-
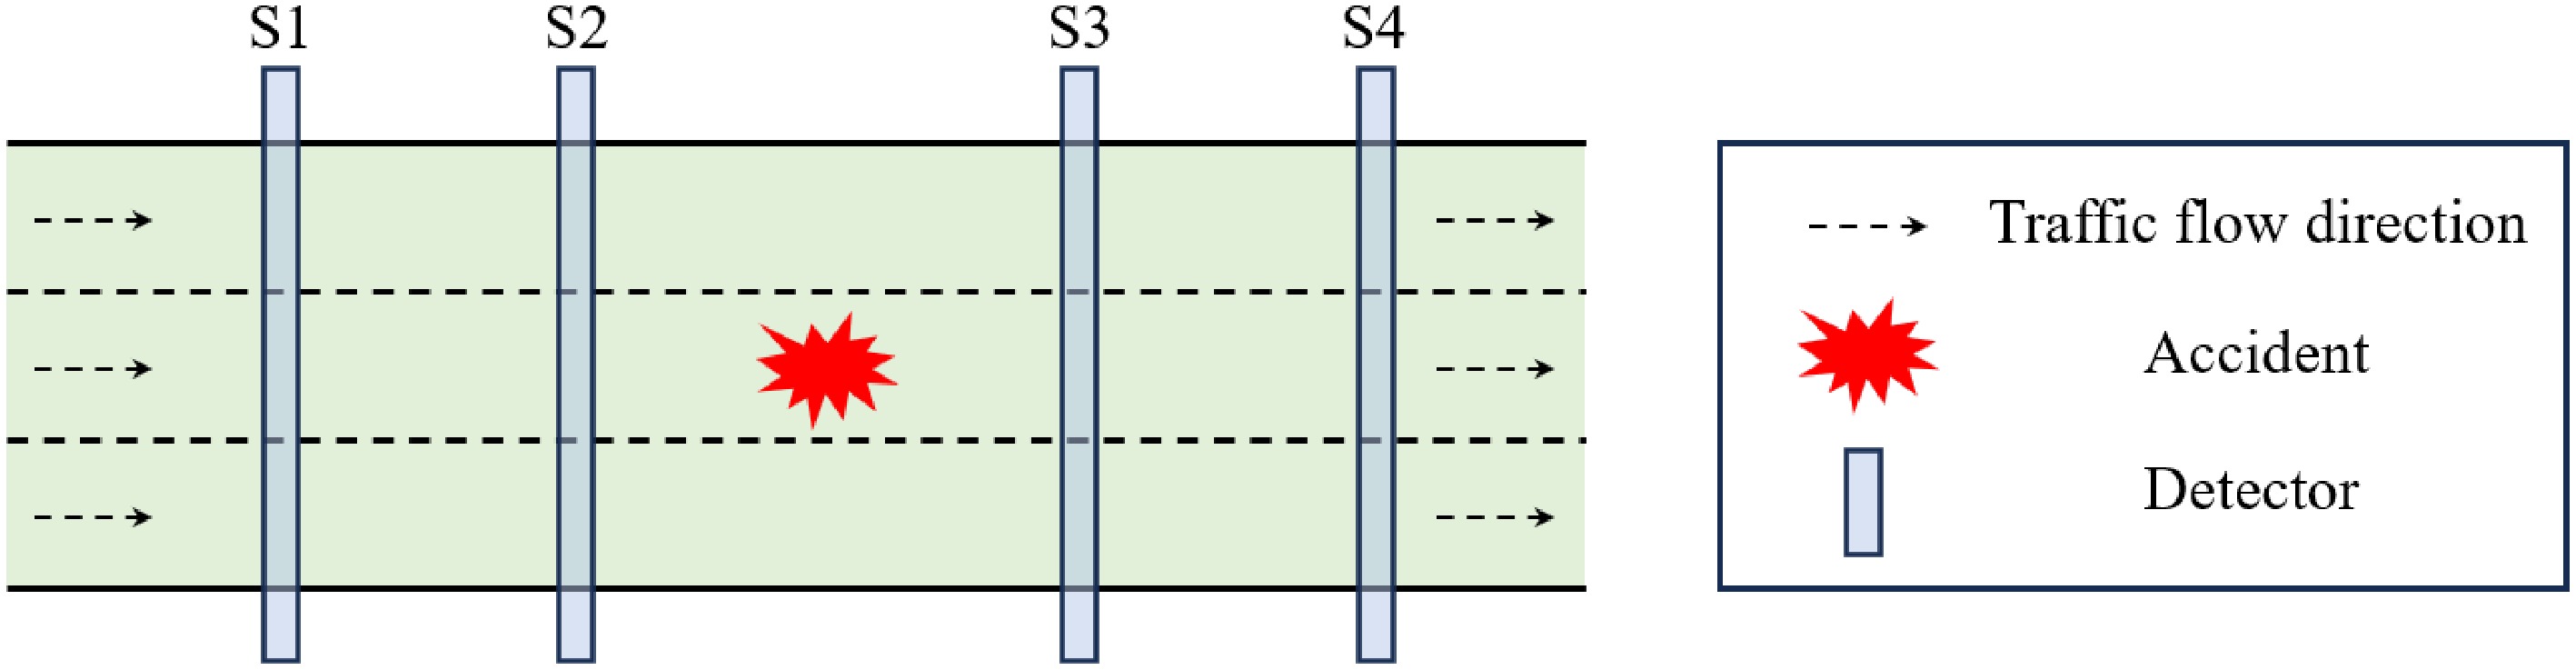
Figure 1.
Accident location and detector selection.
-
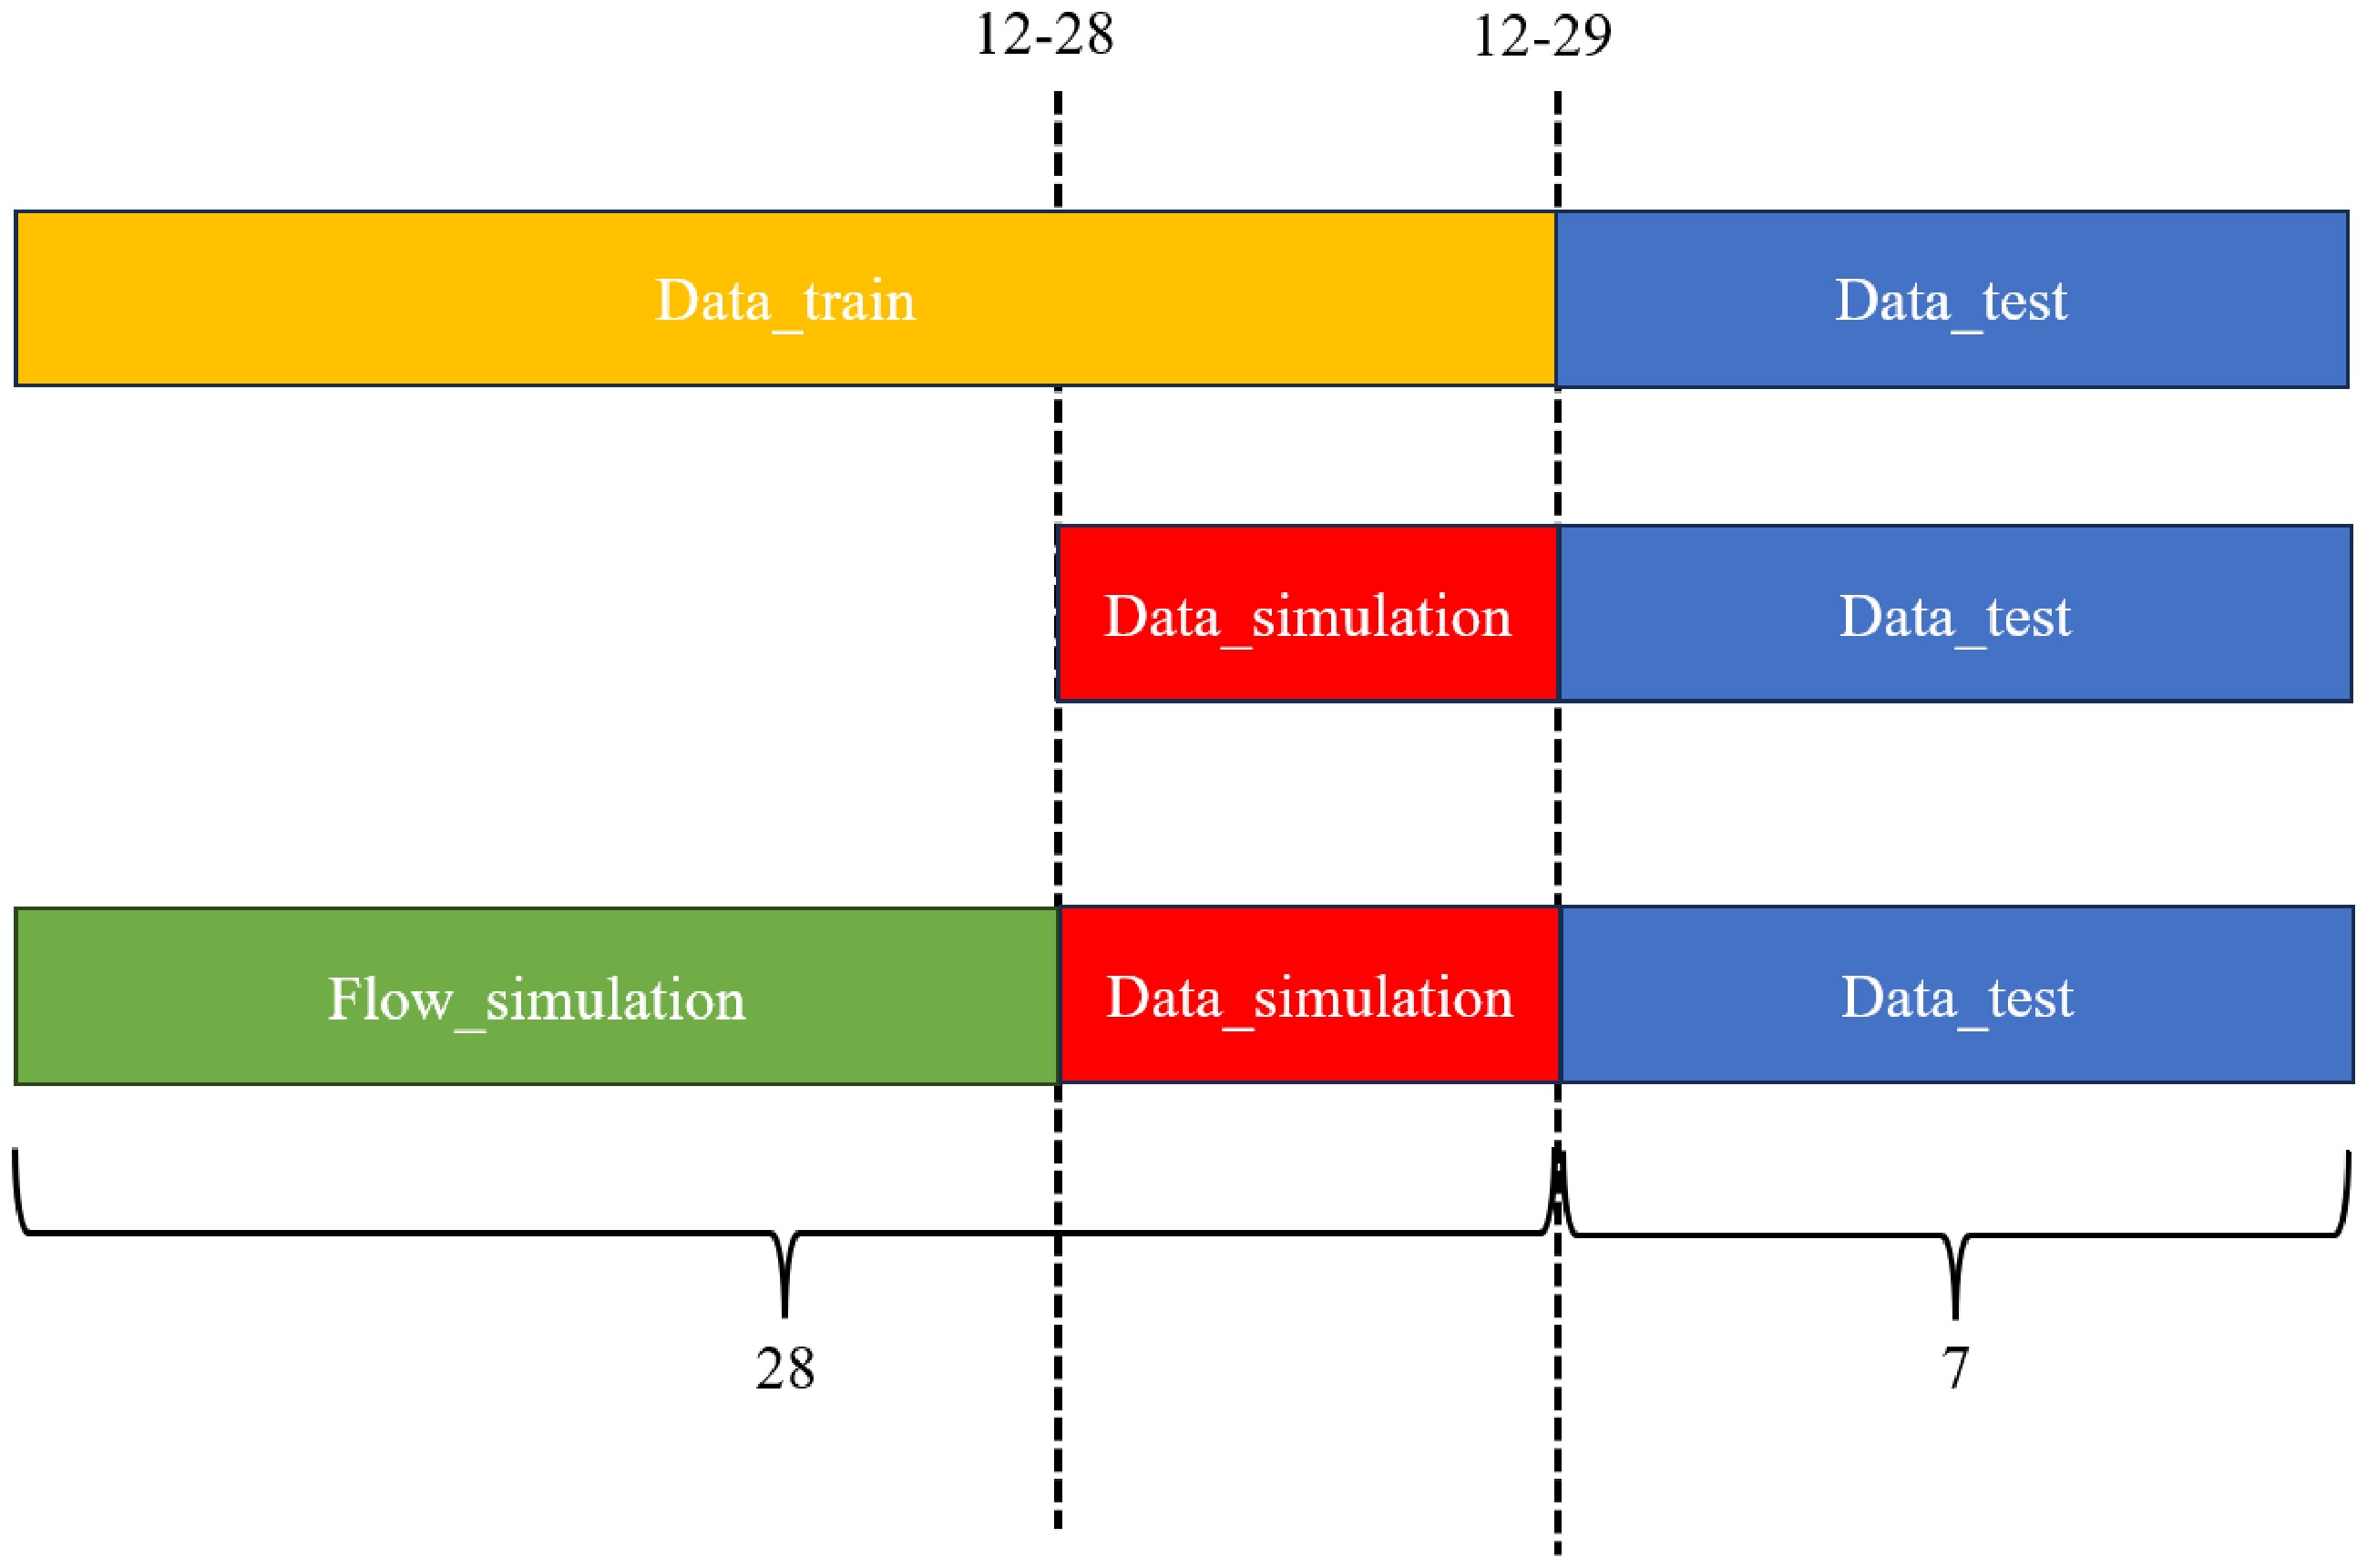
Figure 2.
Mixed dataset strategy for model training.
-
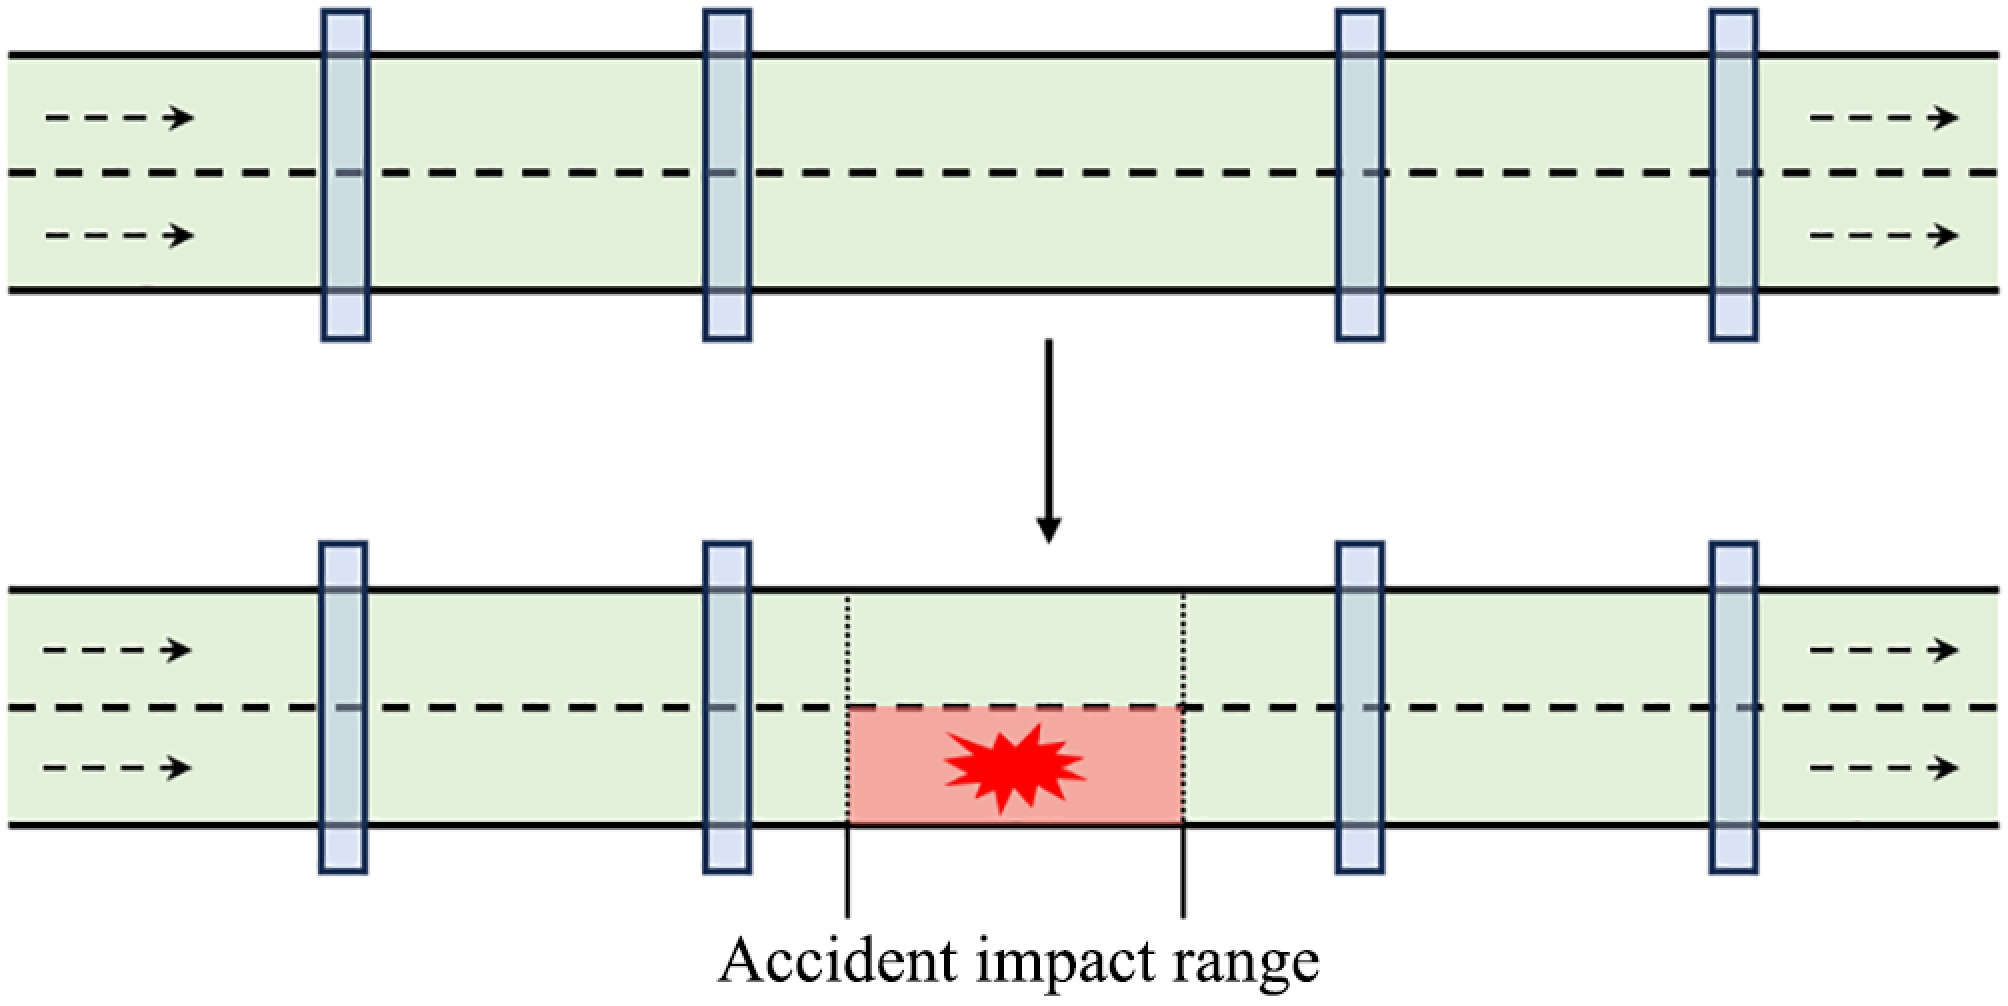
Figure 3.
SUMO accident simulation diagram.
-
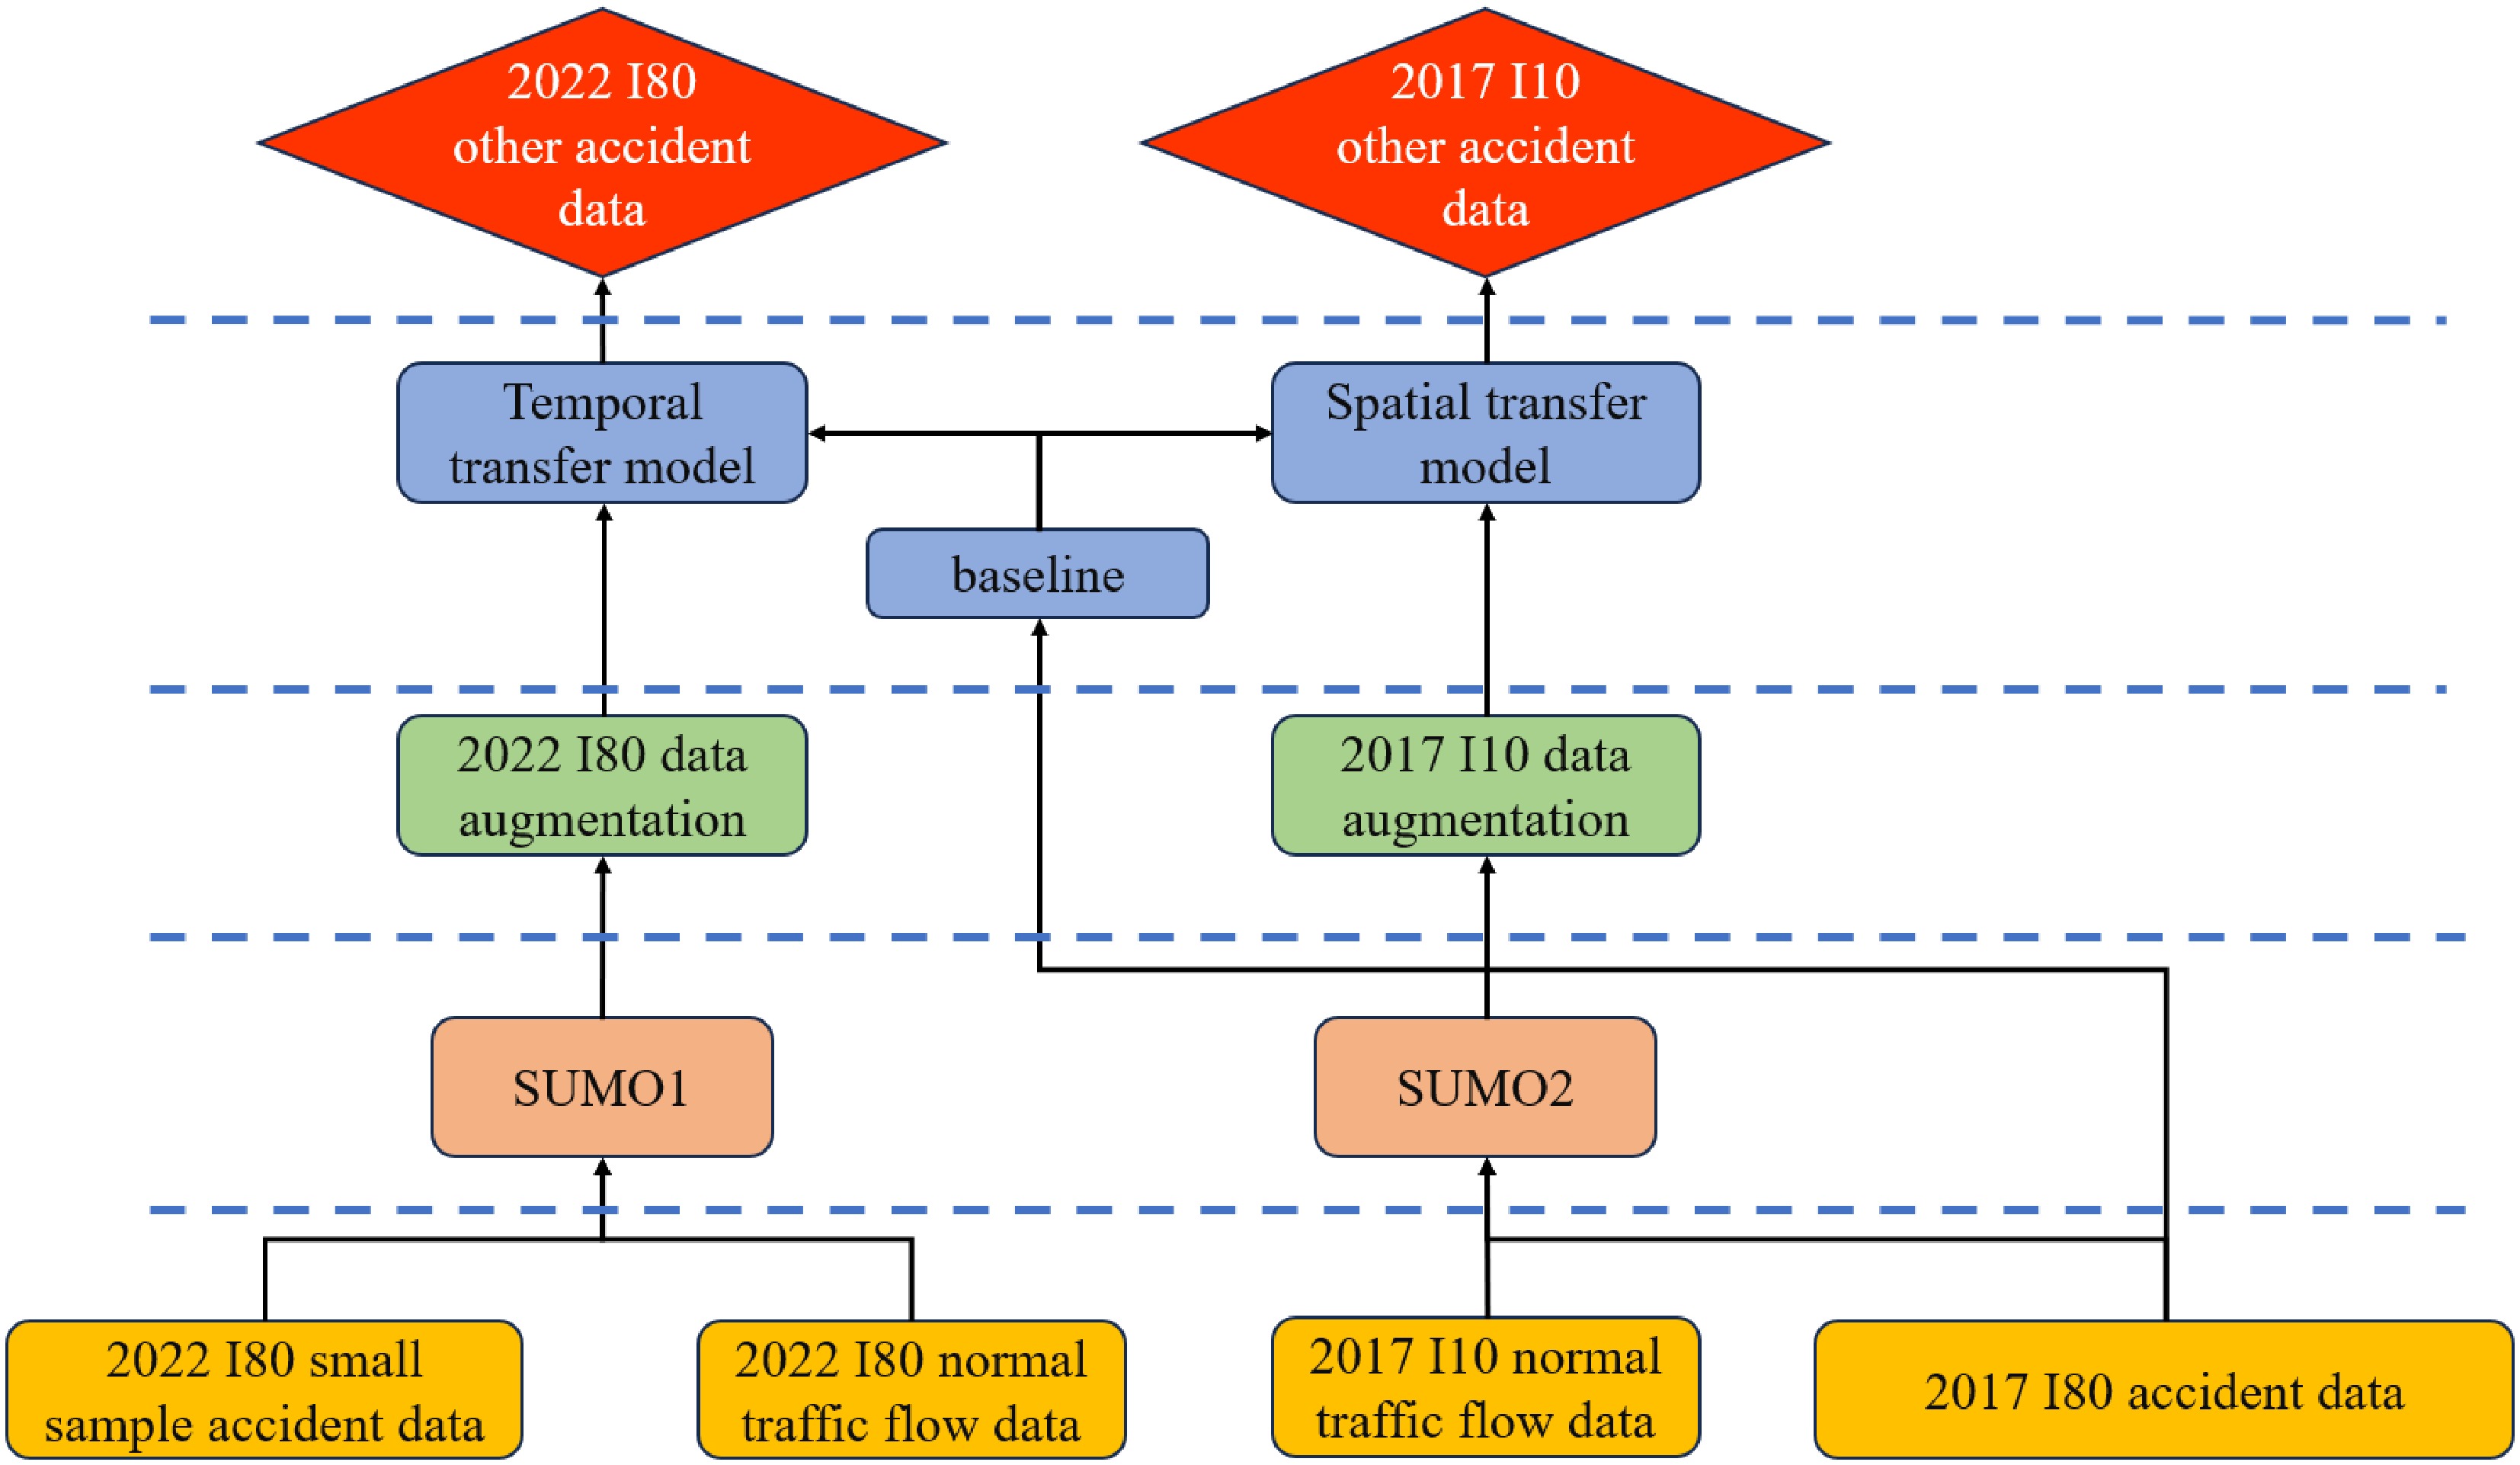
Figure 4.
Temporal and spatial transfer simulation diagram.
-
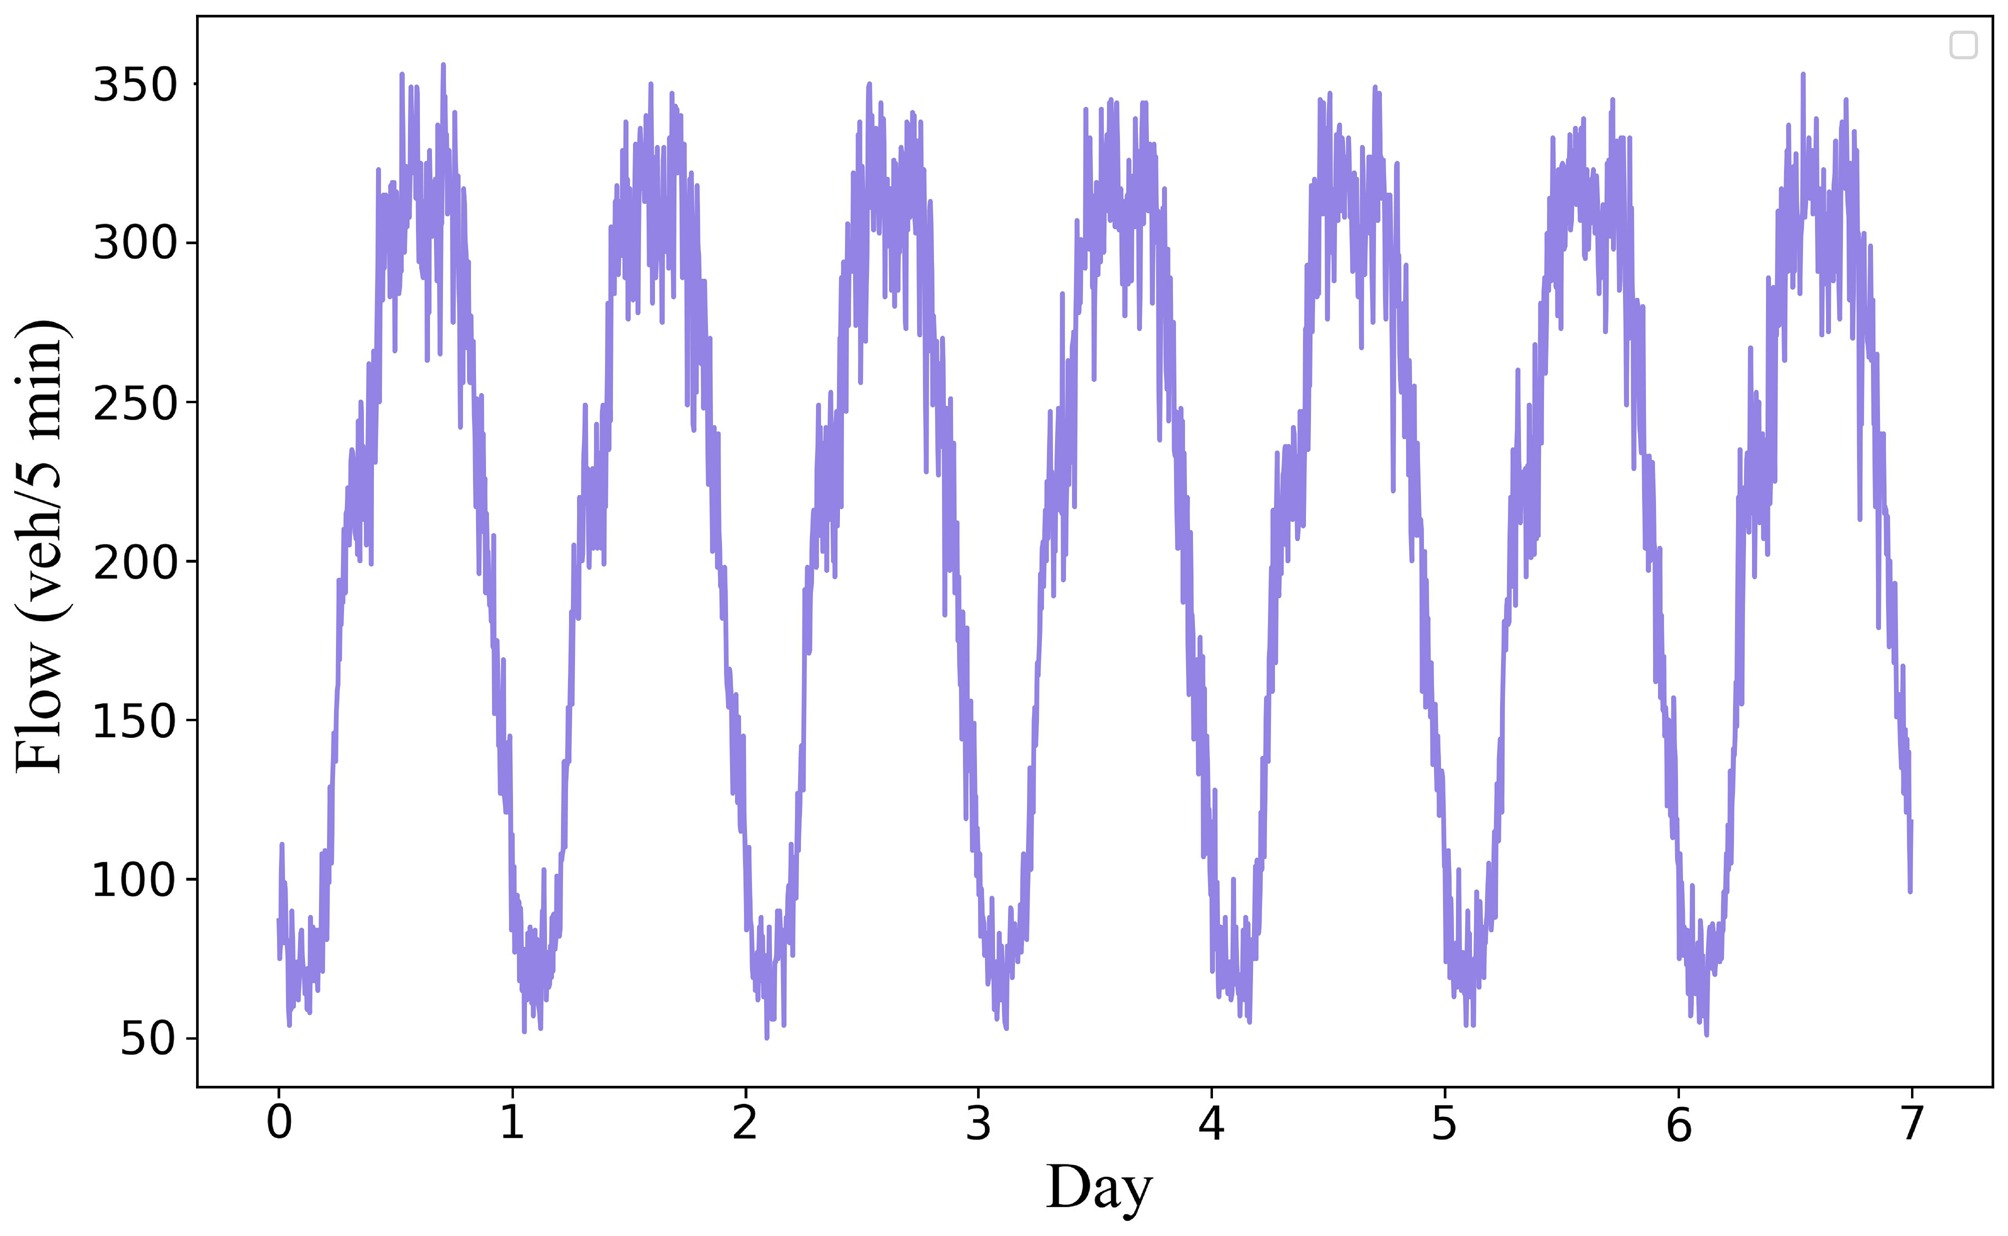
Figure 5.
Seven-day simulation traffic flow variation curve.
-
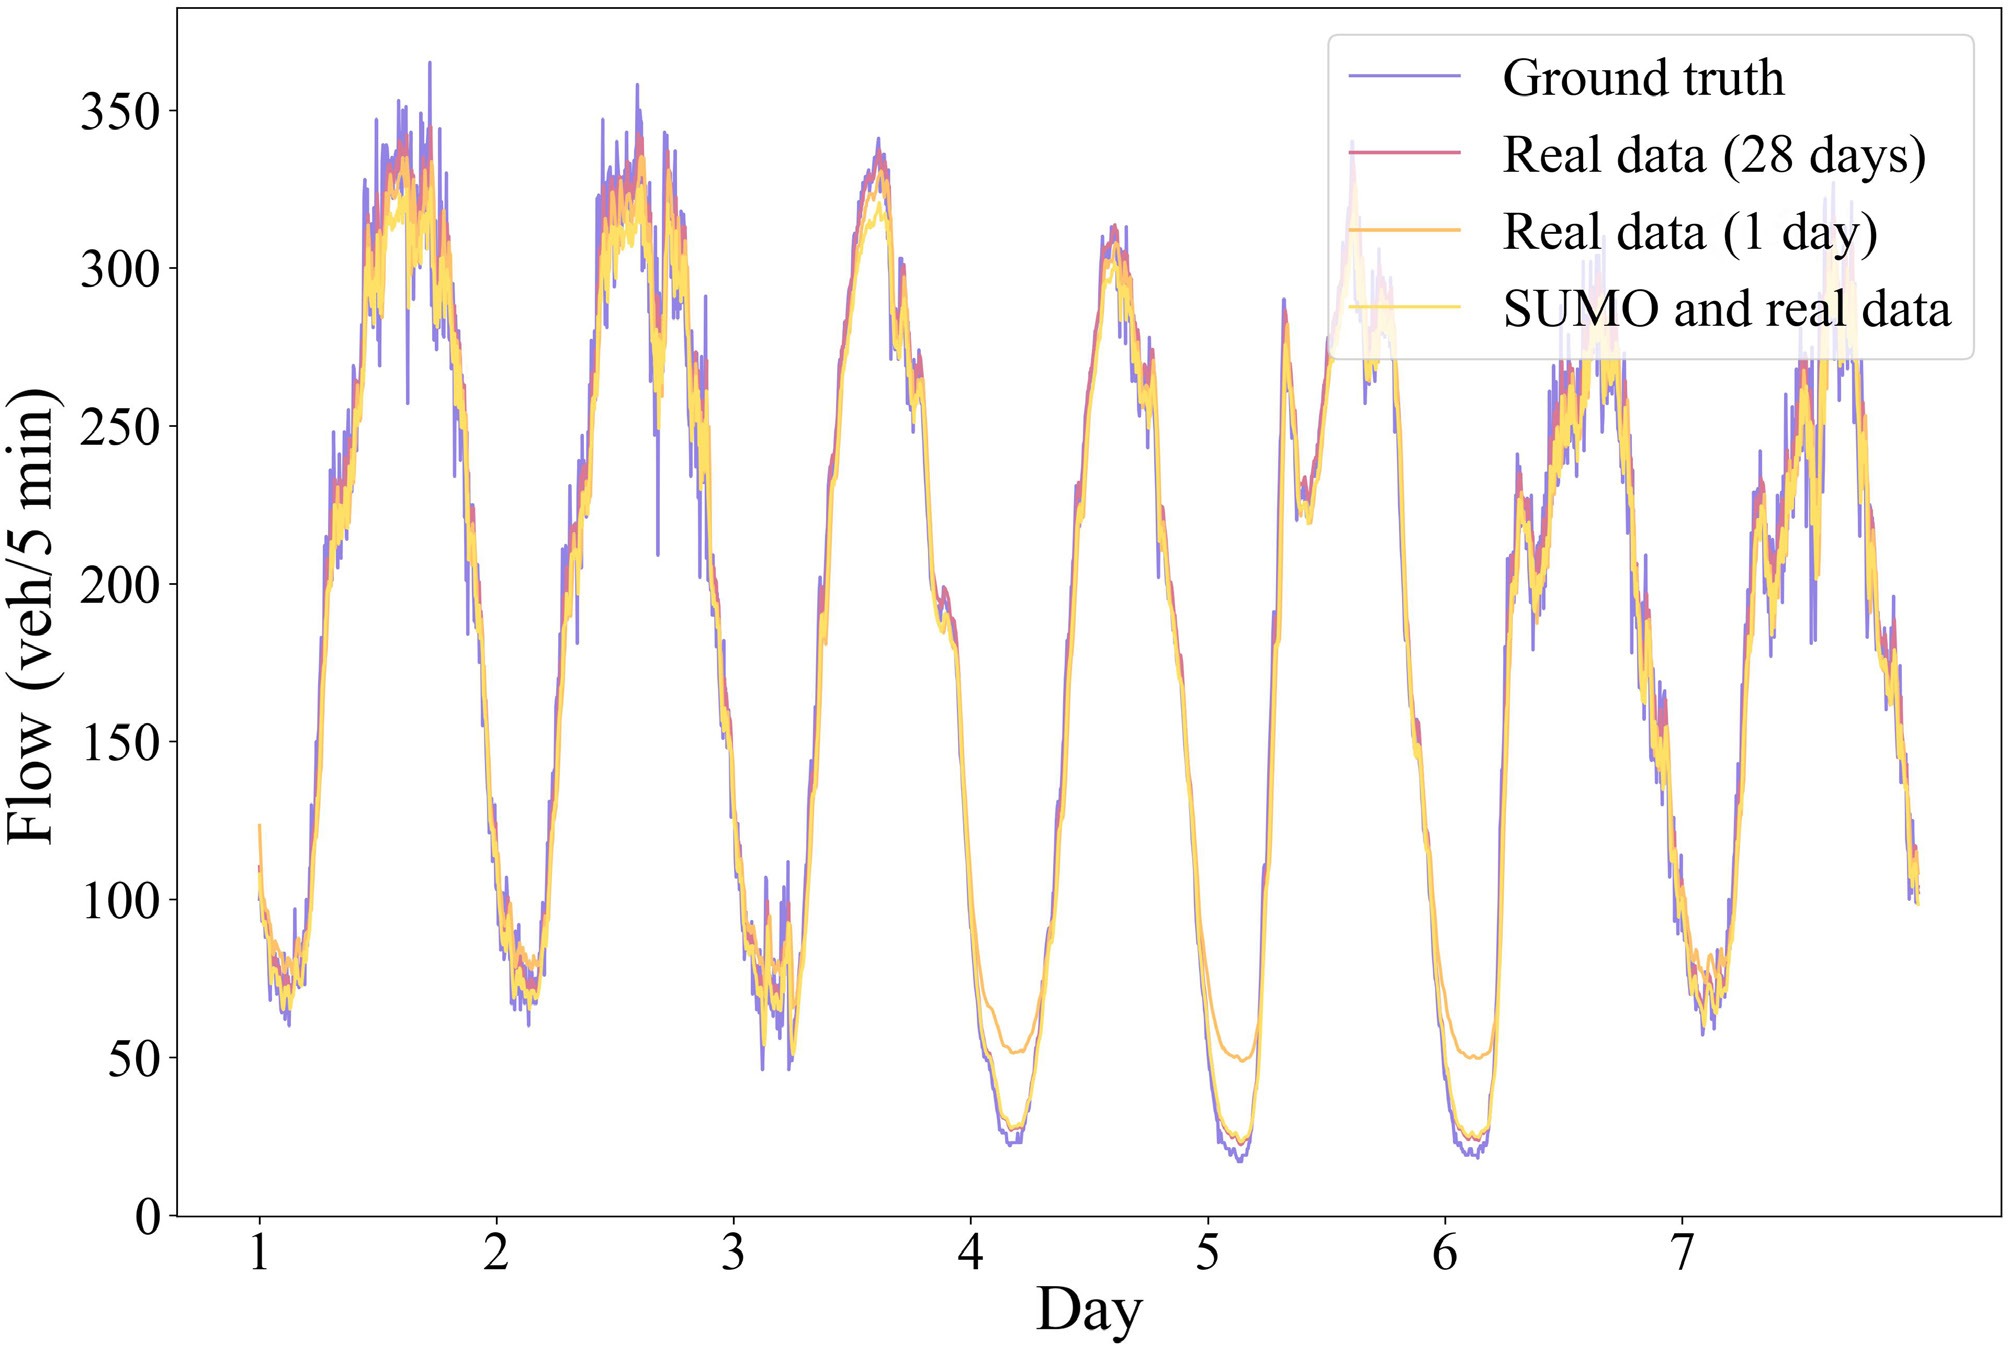
Figure 6.
Comparison of prediction results.
-
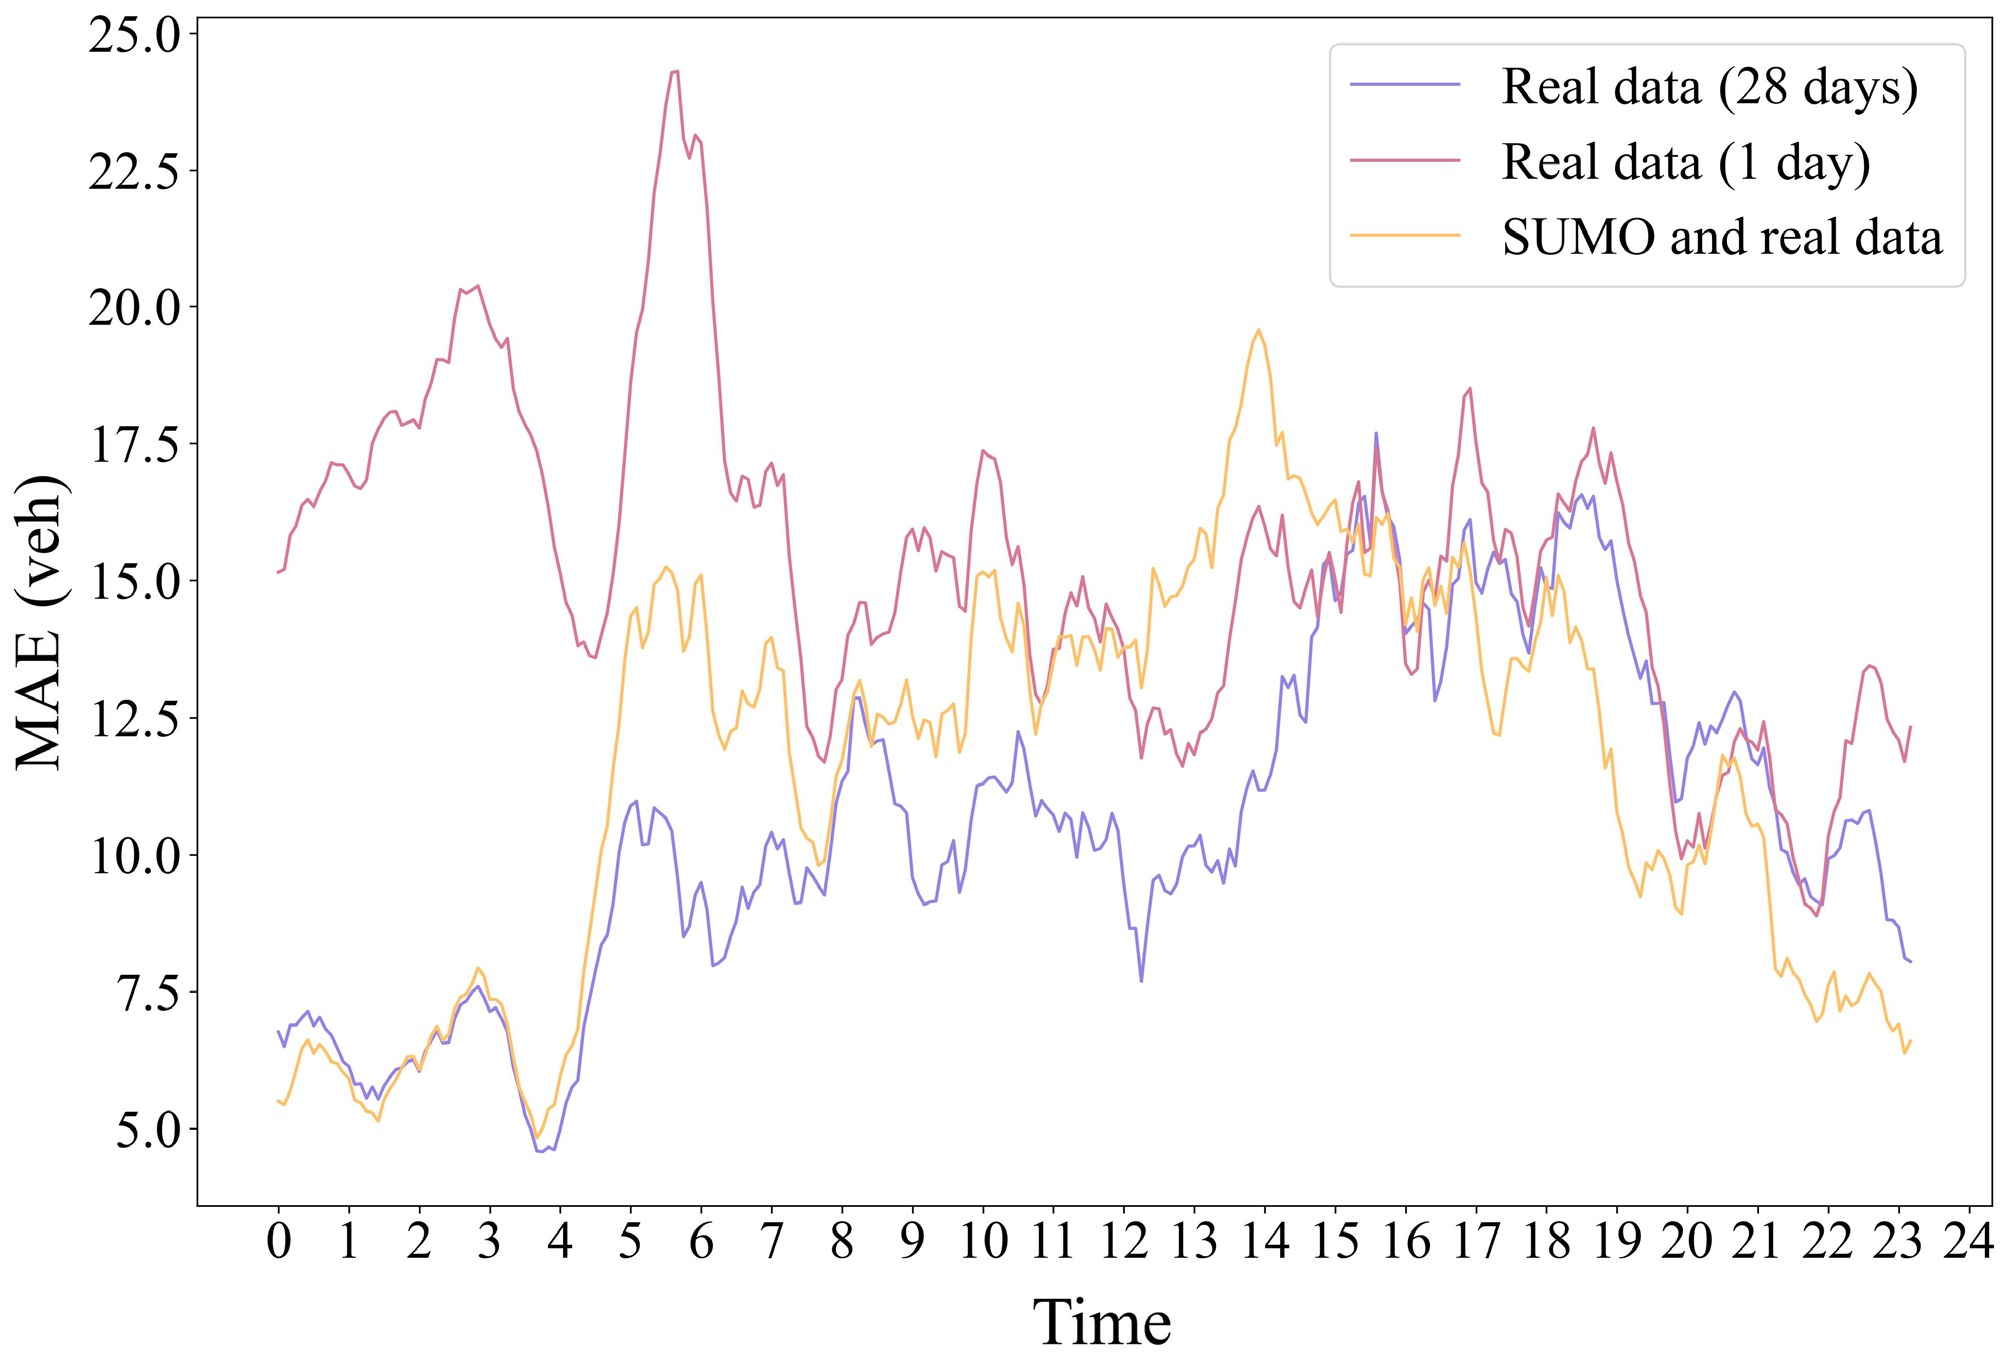
Figure 7.
Twenty four hour traffic flow MAE variation.
-

Figure 8.
Temporal transfer experiment simulation results. (a) The convergence curves of accuracy and AUC under MLP, CNN, and LSTM neural networks. (b) The comparison of accuracy and AUC curves before and after fine-tuning the model using the 2022 small sample dataset with a 1:1, 1:9, and 1:19 sample ratio as the fine-tuning training set.
-

Figure 9.
Spatial transfer experiment simulation results. (a) The convergence curves of accuracy and AUC under MLP, CNN, and LSTM neural networks. (b) Comparison of accuracy and AUC convergence curves between the fine-tuned model using SUMO simulation data and the baseline model.
Figures
(9)
Tables
(0)