-
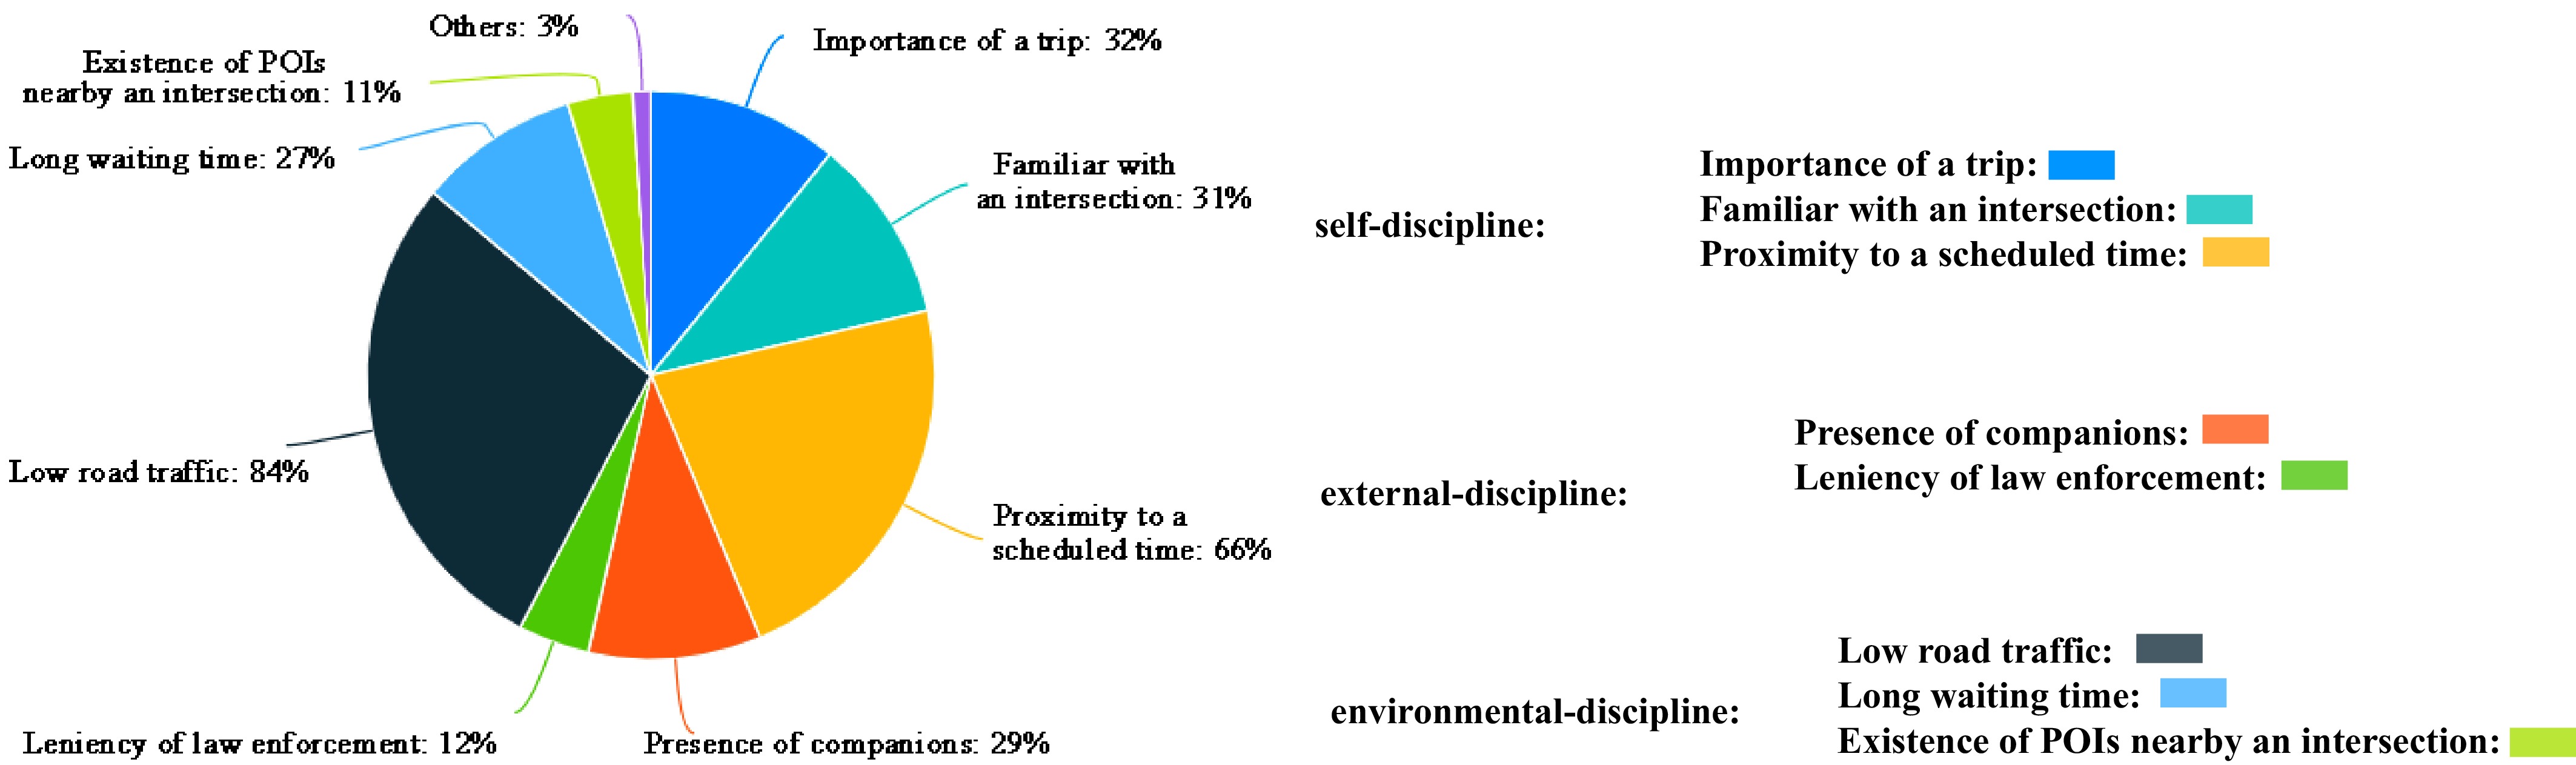
Figure 1.
Questionnaire survey results of the impact distribution of different causal factors that trigger pedestrians' red-light running behaviors.
-
Facet Factors B Standard error Significance Exp (B) Demographic-discipline Gender −0.166 0.067 0.013 0.847 Age −0.211 0.087 0.042 0.847 Education level −0.185 0.089 0.039 0.831 Occupation −0.005 0.024 0.827 0.995 Familiarity with regulations 0.101 0.039 0.009 1.106 Self-discipline Importance of a trip 0.758 0.088 < 0.001 2.135 Familiar with an intersection 0.469 0.078 < 0.001 1.1598 proximity to a scheduled time 0.504 0.073 < 0.001 1.656 External-discipline Presence of a companion 1.173 0.076 < 0.001 3.231 Leniency of law enforcement 0.562 0.084 < 0.001 1.755 Environmental-discipline Long waiting time 0.797 0.072 < 0.001 2.220 Attractive destinations on the opposite side of the intersection 0.152 0.072 0.033 1.164 Low road traffic 0.748 0.074 < 0.001 2.113 Constant −1.258 0.259 < 0.001 0.284 Table 1.
Results of the binary logistic regression to assess the impact of individual factors, together with their combinations, on pedestrians' red-light running behaviors.
-
Methods Precision Recall AUC Naïve bayes 87.4% 87.3% 87.4% Logistic regression 87.7% 87.6% 93.2% Multi-layer perceptron 88.3% 88.2% 94.6% Decision tree 88.4% 88.8% 94.9% Random forest 88.9% 88.8% 95.2% Table 2.
The supervised learning performances of the chosen classifiers based on the extracted feature engineering.
Figures
(1)
Tables
(2)