-
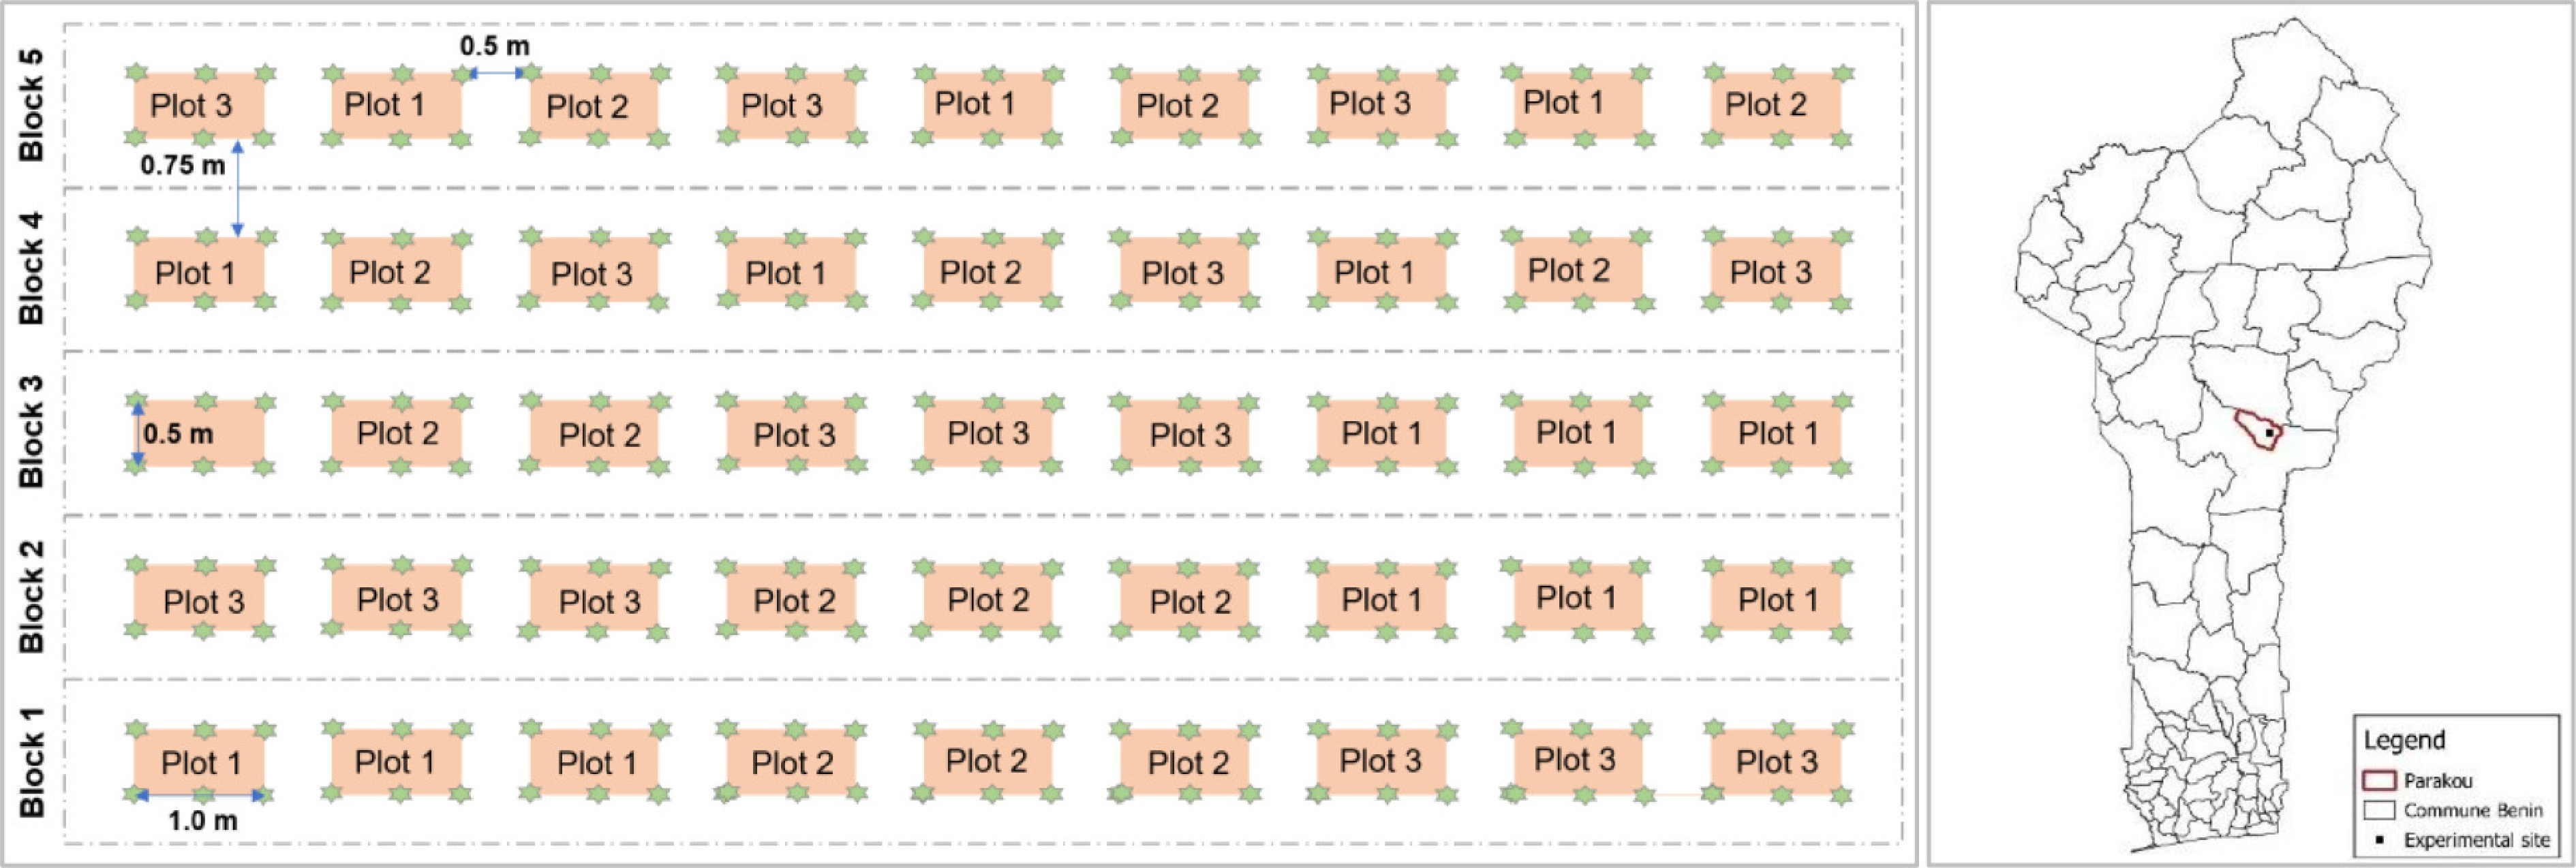
Figure 1.
(left) Study design, and (right) location of the study site in the commune of Parakou (dark thick line), Benin Republic. Green stars are Adansonia digitata trees. Three plots were considered as a subblock that was replicated three times.
-
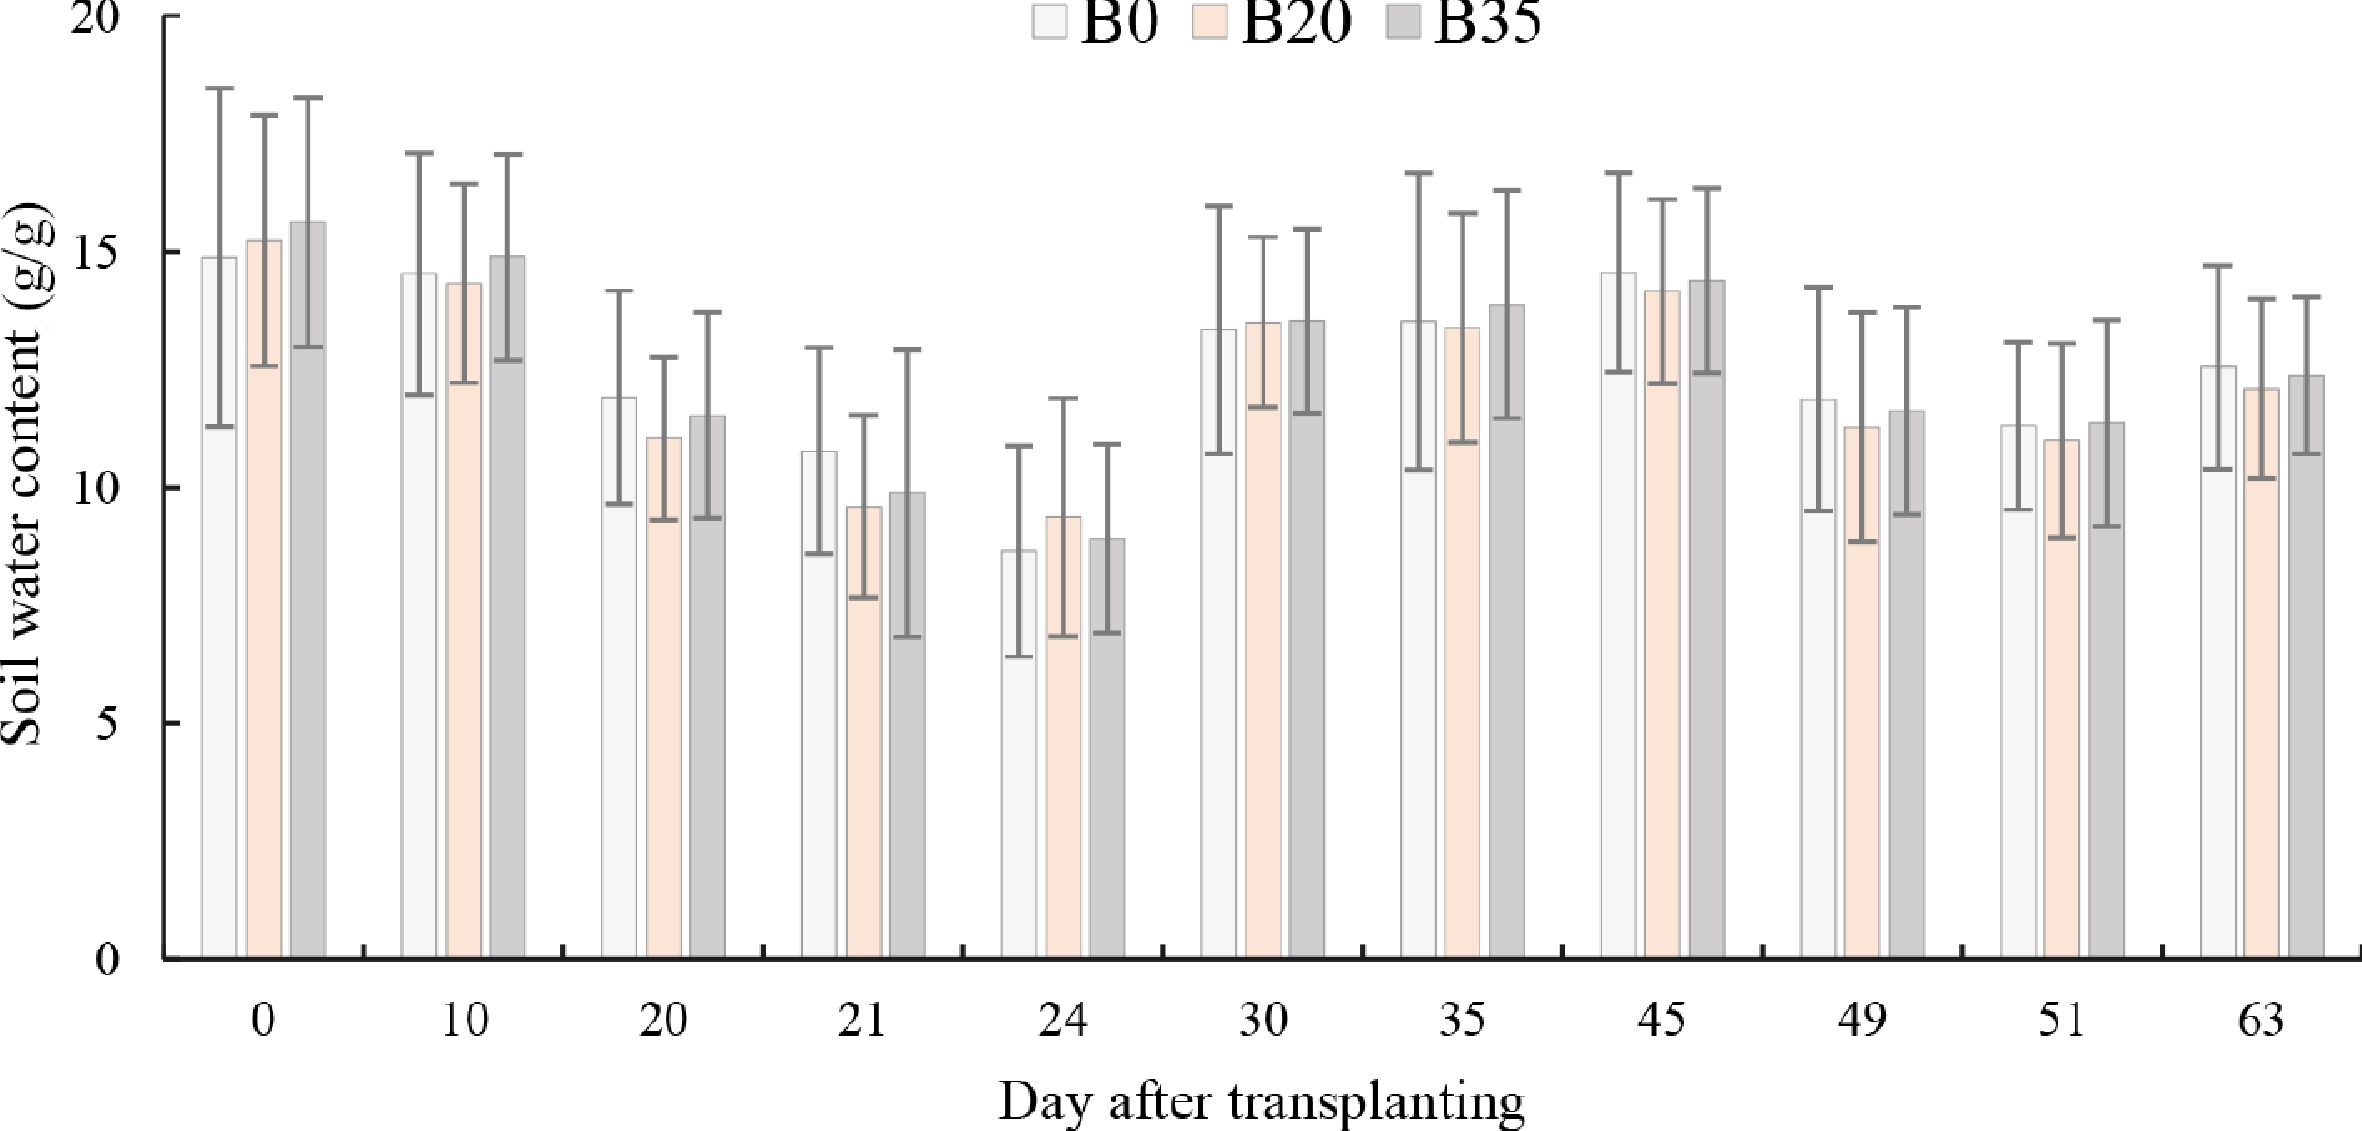
Figure 2.
Variation of day after transplanting soil water content under biochar application. B0, B20, and B35 are 0, 20, and 35 g biochar application, respectively.
-
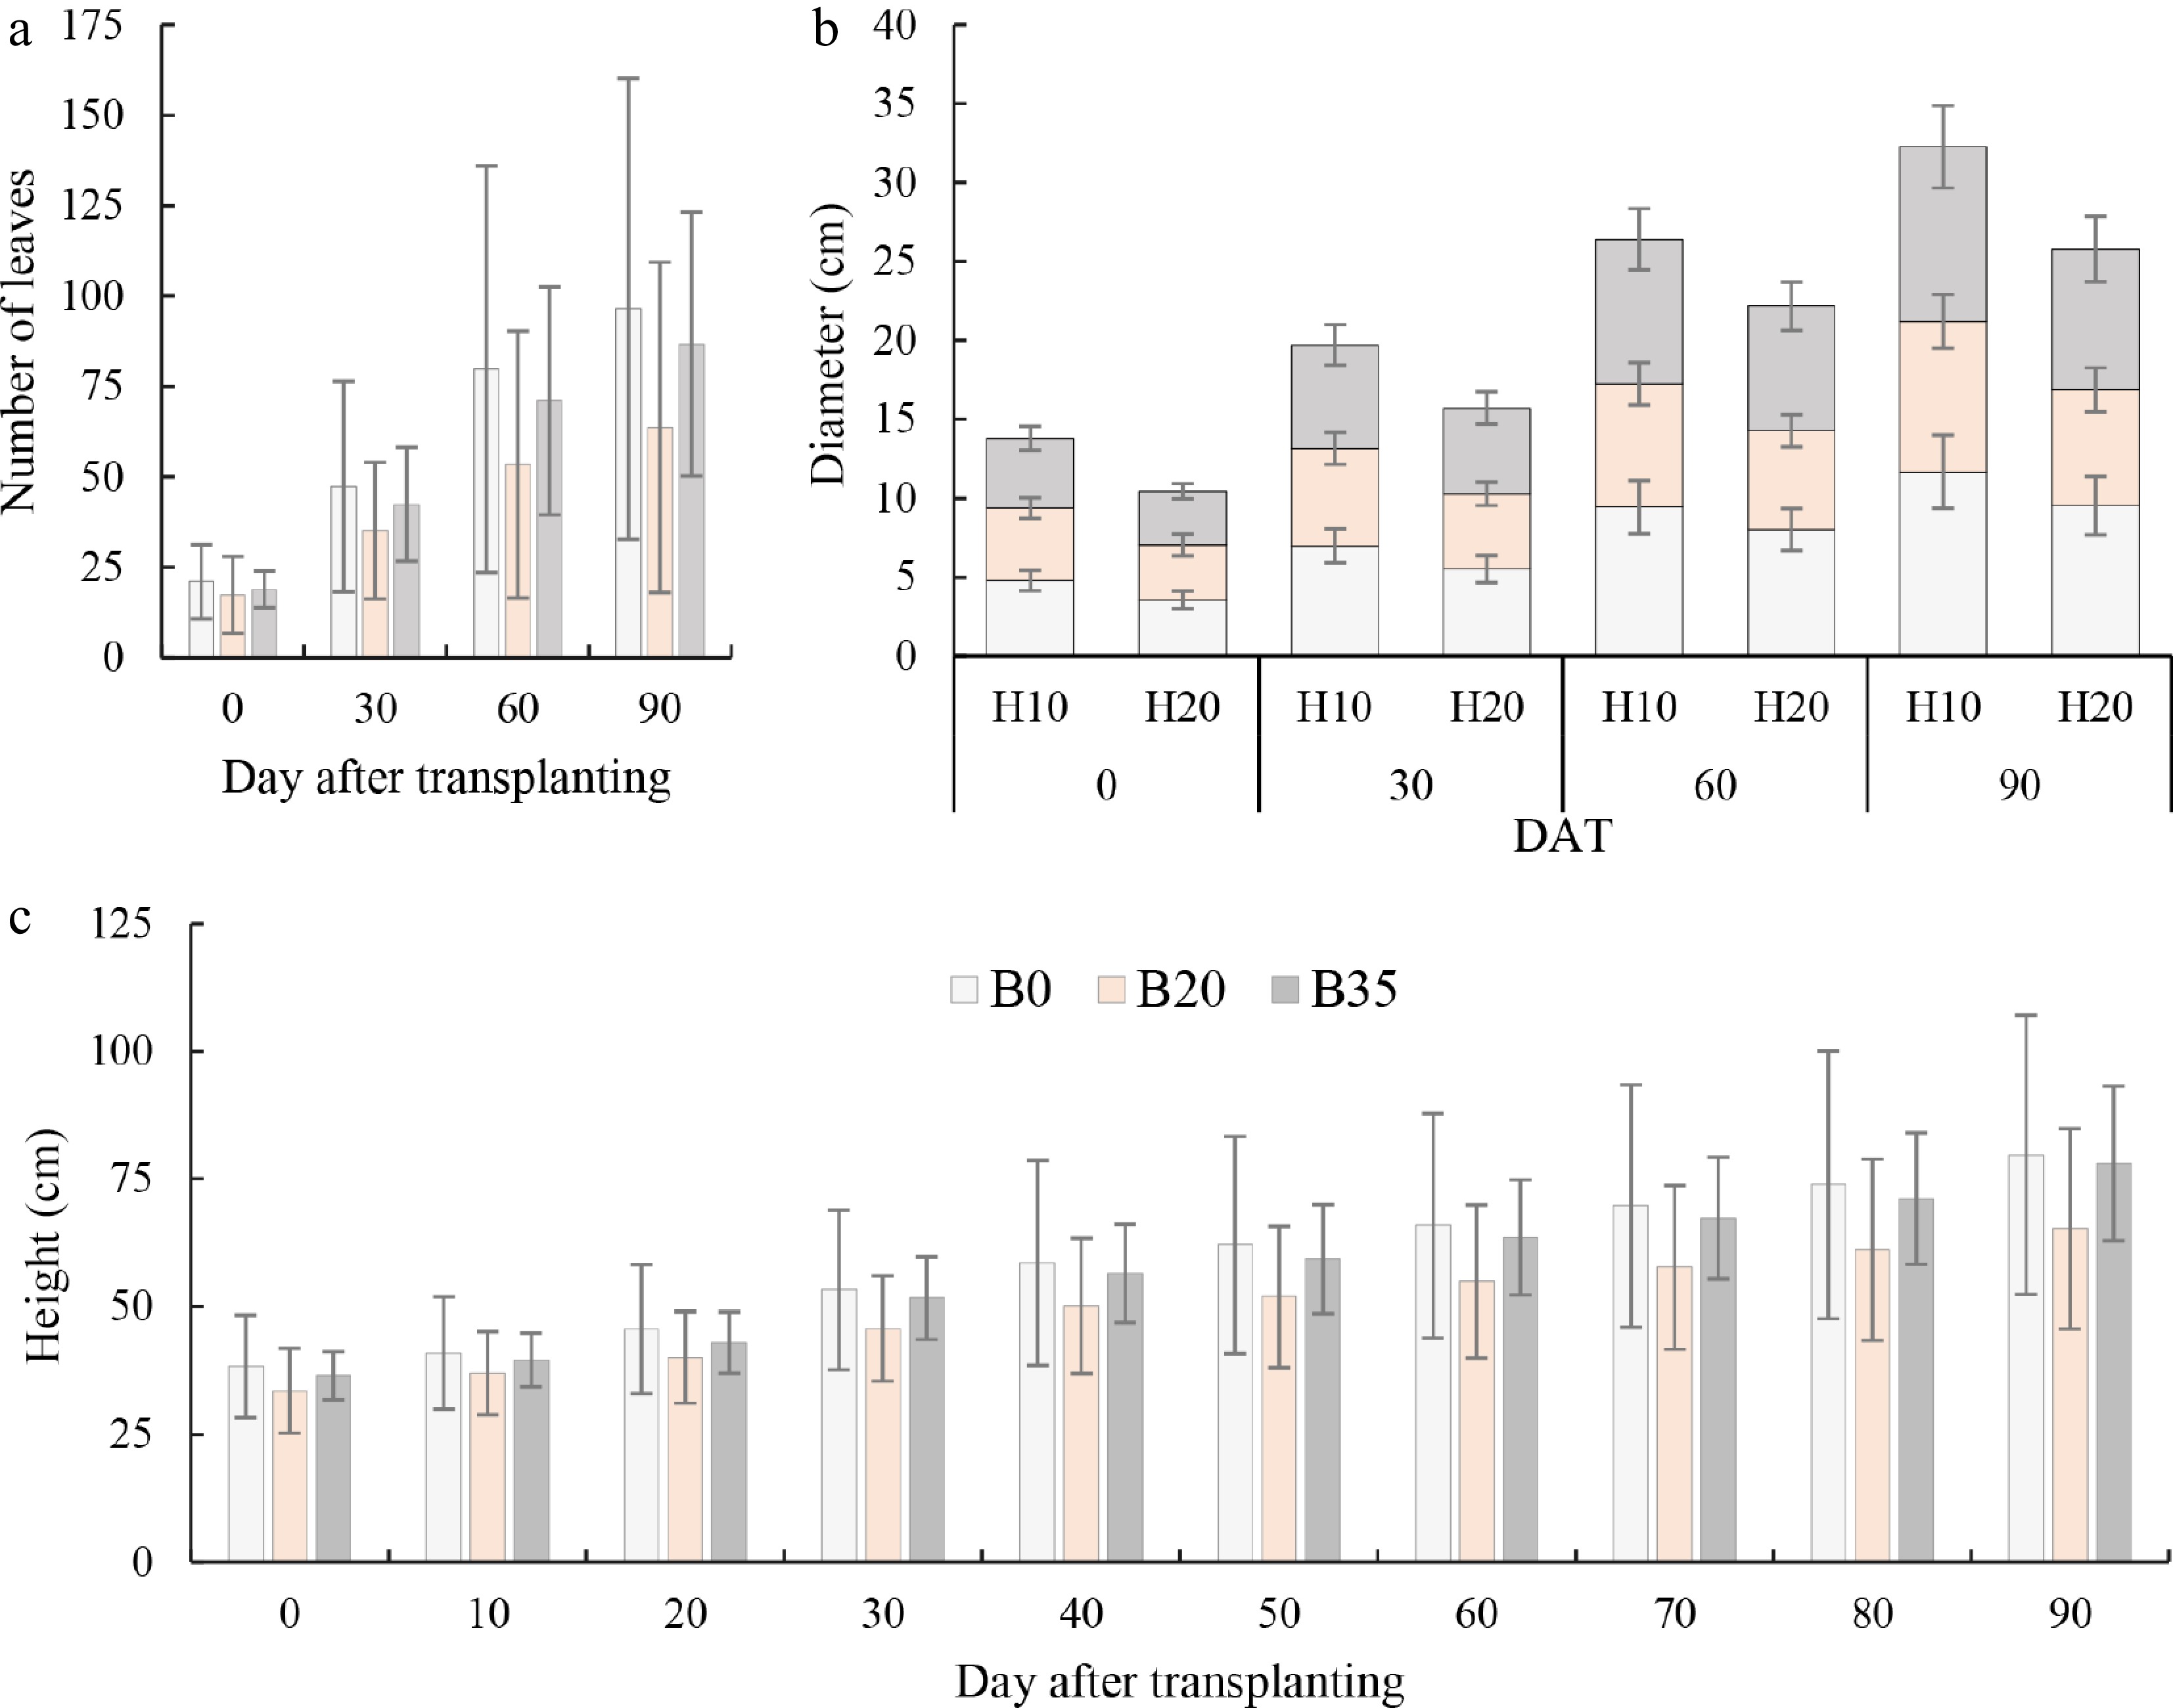
Figure 3.
Variation of (a) day after transplanting number of A. digitata seedlings leaves, (b) stem diameter at two heights, and (c) seedling height under biochar application. B0, B20, and B35 are 0, 20, and 35 g biomass application, respectively. H10 and H20 are 10 and 20 cm height for diameter measurement.
-
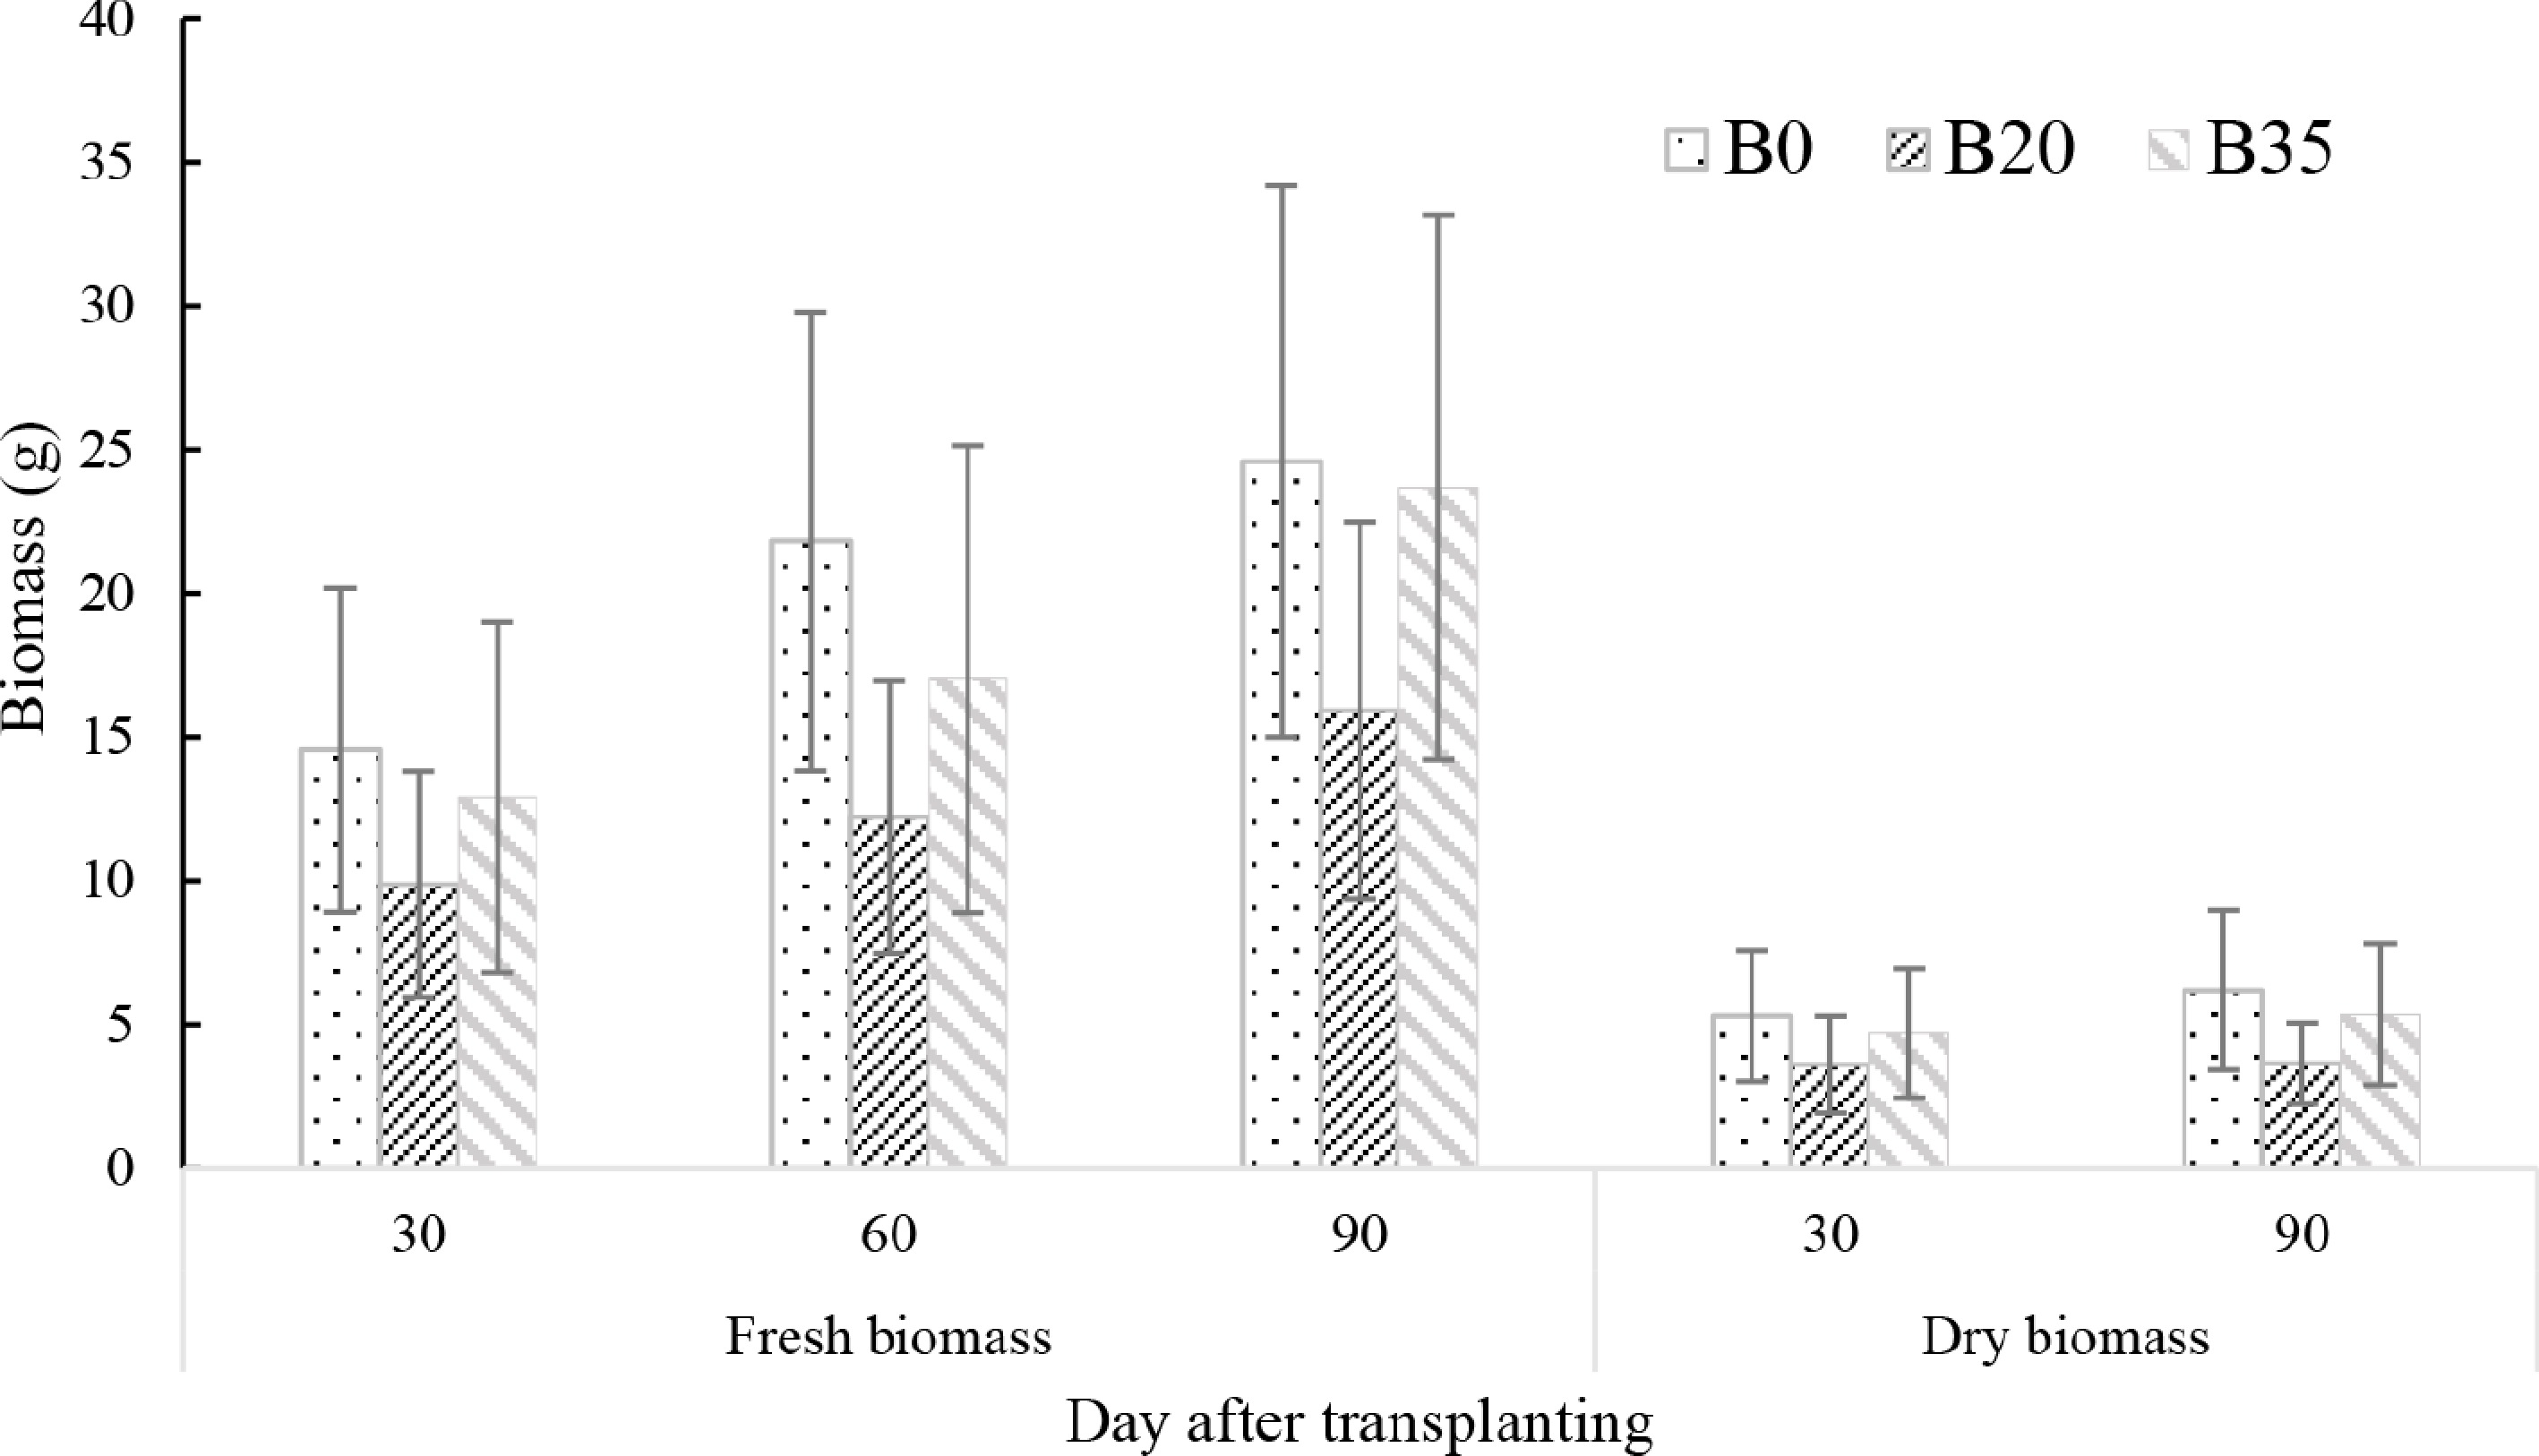
Figure 4.
Changes in day after transplanting A. digitata seedlings leaves fresh and dry biomass yields under biochar application. B0, B20, and B35 are 0, 20, and 35 g biomass application, respectively.
-
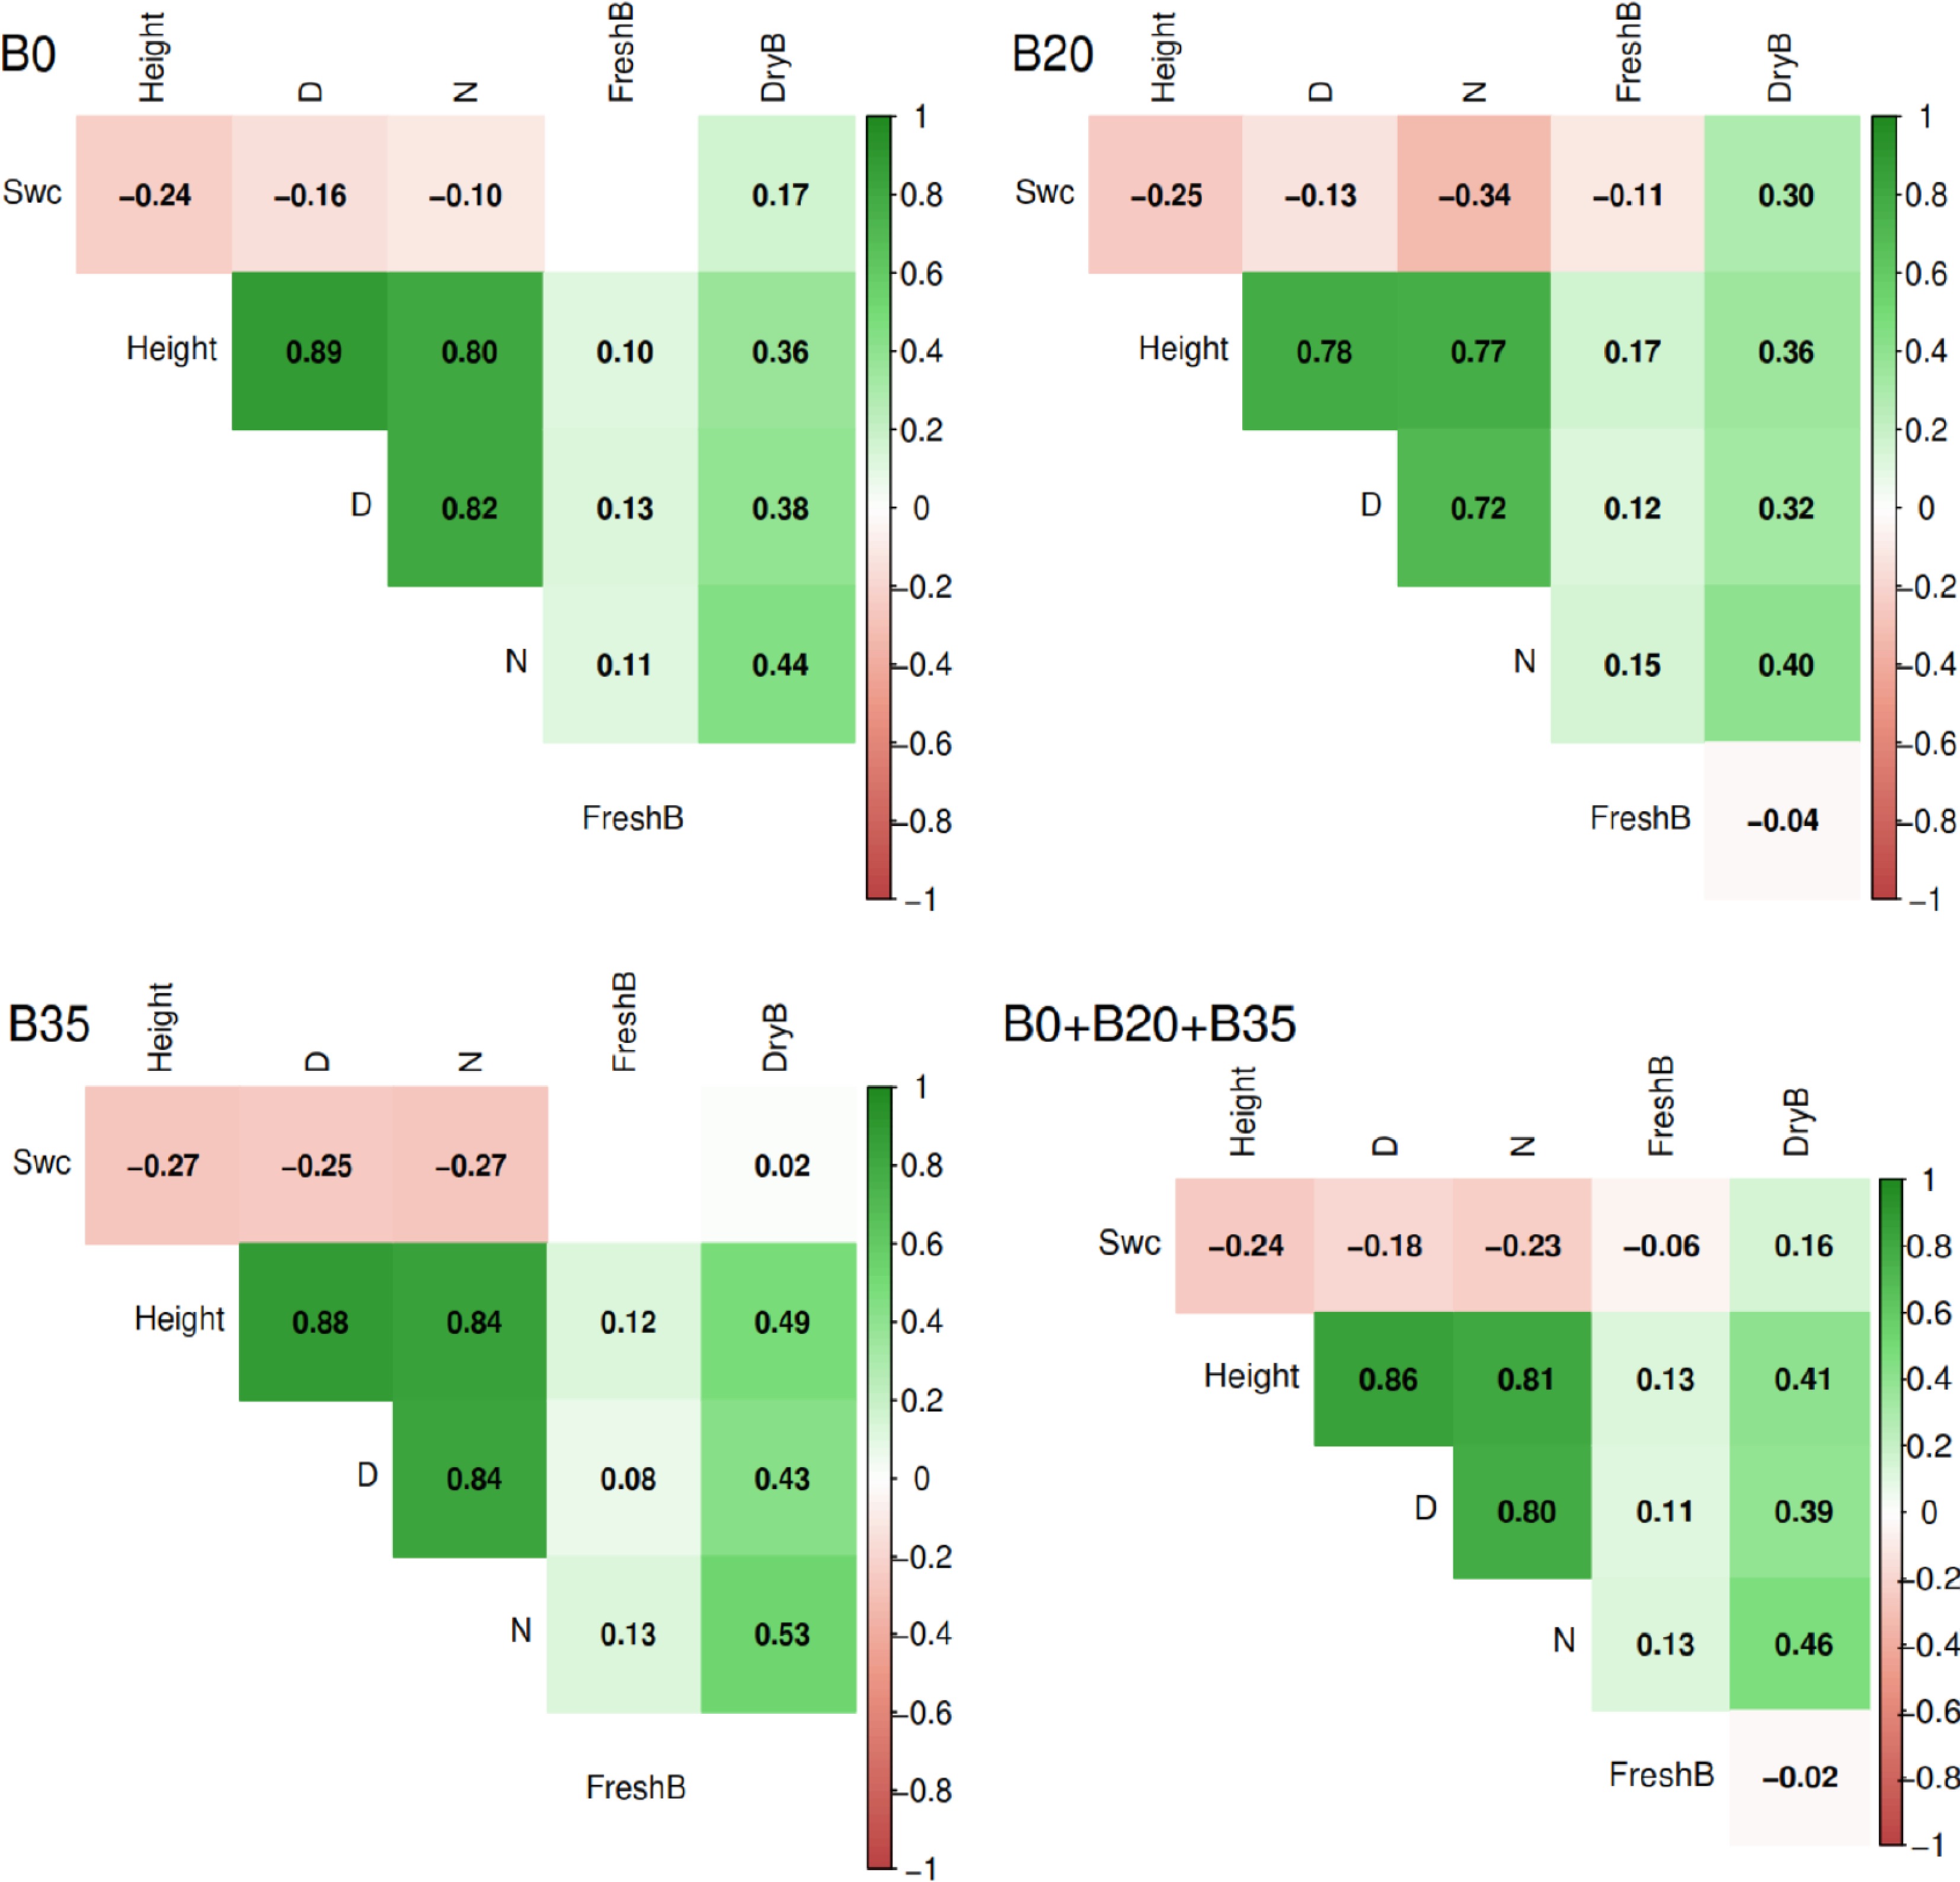
Figure 5.
Correlation analysis among soil water content, and A. digitata growth parameters and biomass yields using B0, B20, B355, and global data (B0 + B20 + B35). B0, B20, and B35 are 0, 20, and 35 g of biochar application, respectively.
-
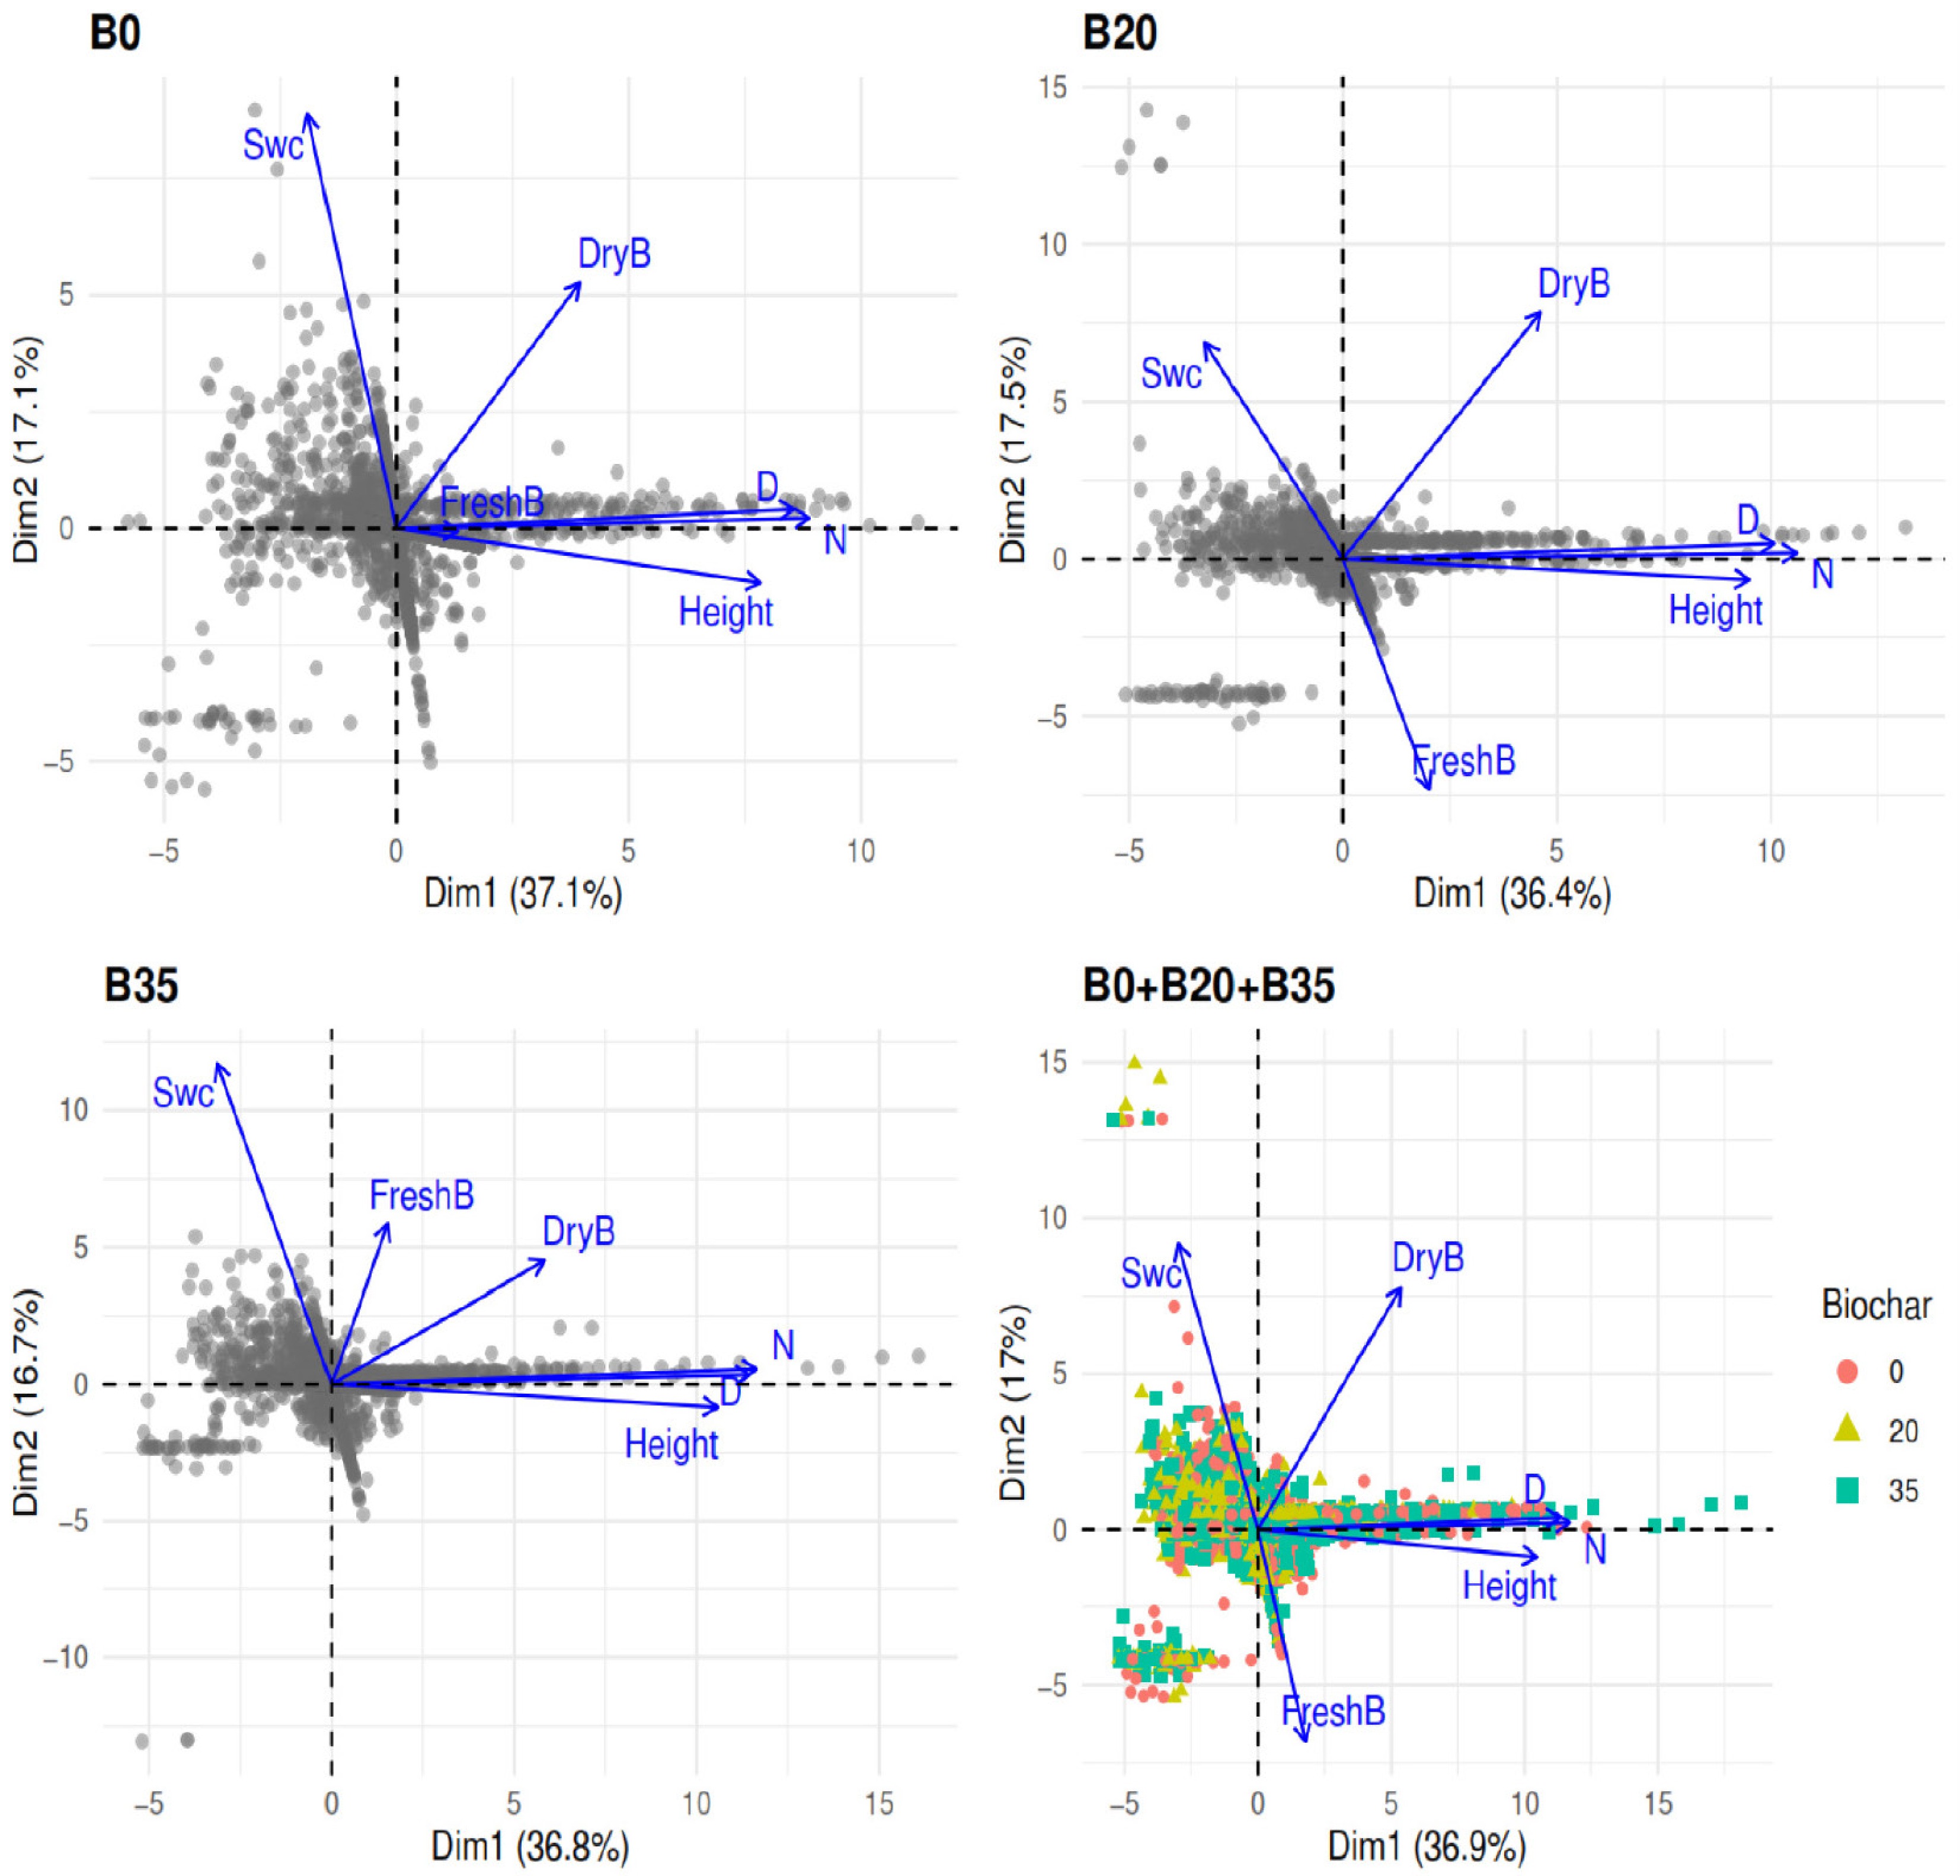
Figure 6.
Principal components analysis among soil water content, and A. digitata growth parameters and biomass yields using B0, B20, B355, and global data (B0 + B20 + B35). B0, B20, and B35 are 0, 20, and 35 g of biochar application, respectively.
-
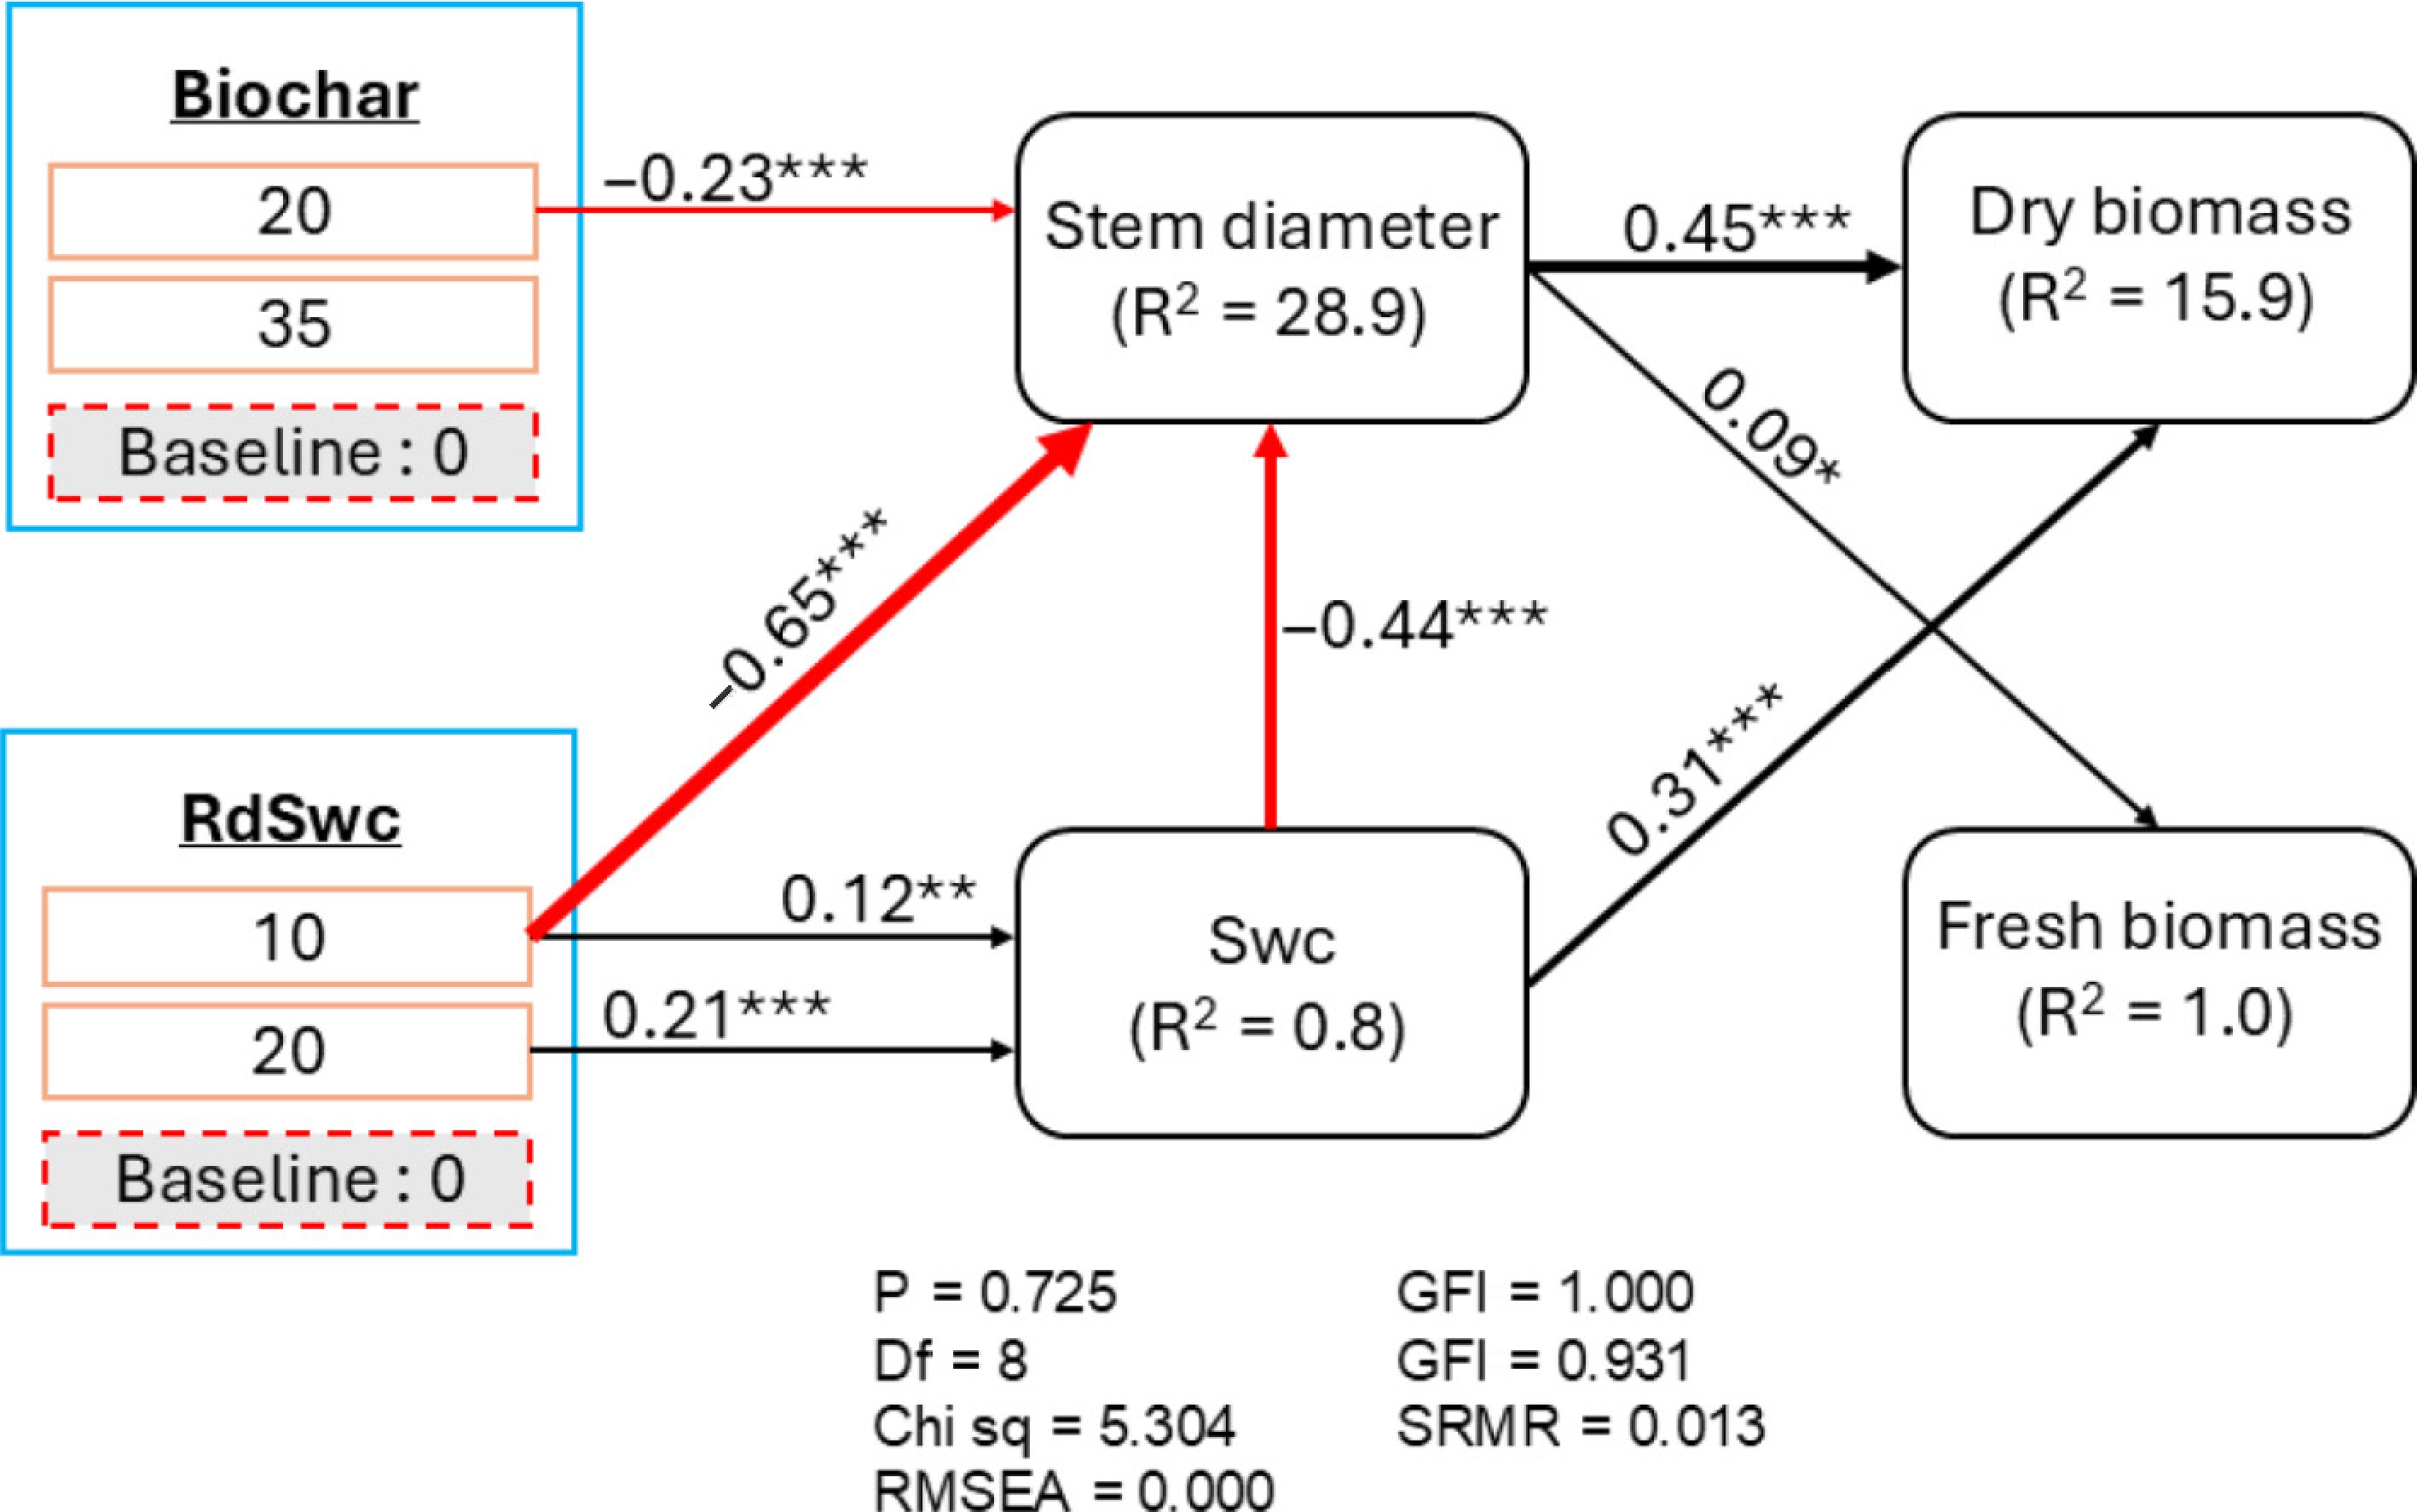
Figure 7.
Structural equation model showing the underlying mechanism of soil water content, and A. digitata growth parameters and biomass yields under harvesting intensity. The thickness of the path equates to the strength of the path coefficient. Black and red arrows indicate positive and negative paths respectively. Green color ellipse are response variables; bule color boxes represent the factor, and below each factor is shown its level and the baseline of comparison. The proportion of variation explained by the model (R2) are shown next to each endogenous variable. B0, B20, and B35 are 0, 20, and 35 g of biochar applications, respectively. Asterisks associated to values are the level of significancy of the p-value (*** p < 0.001; ** p < 0.01; and * p < 0.05). Chi square = 5.304, p-value = 0.725, degree of freedom (DF) = 8, RMSEA = 0.001, Comparative Fit Index (CFI) = 1.000.
Figures
(7)
Tables
(0)