-
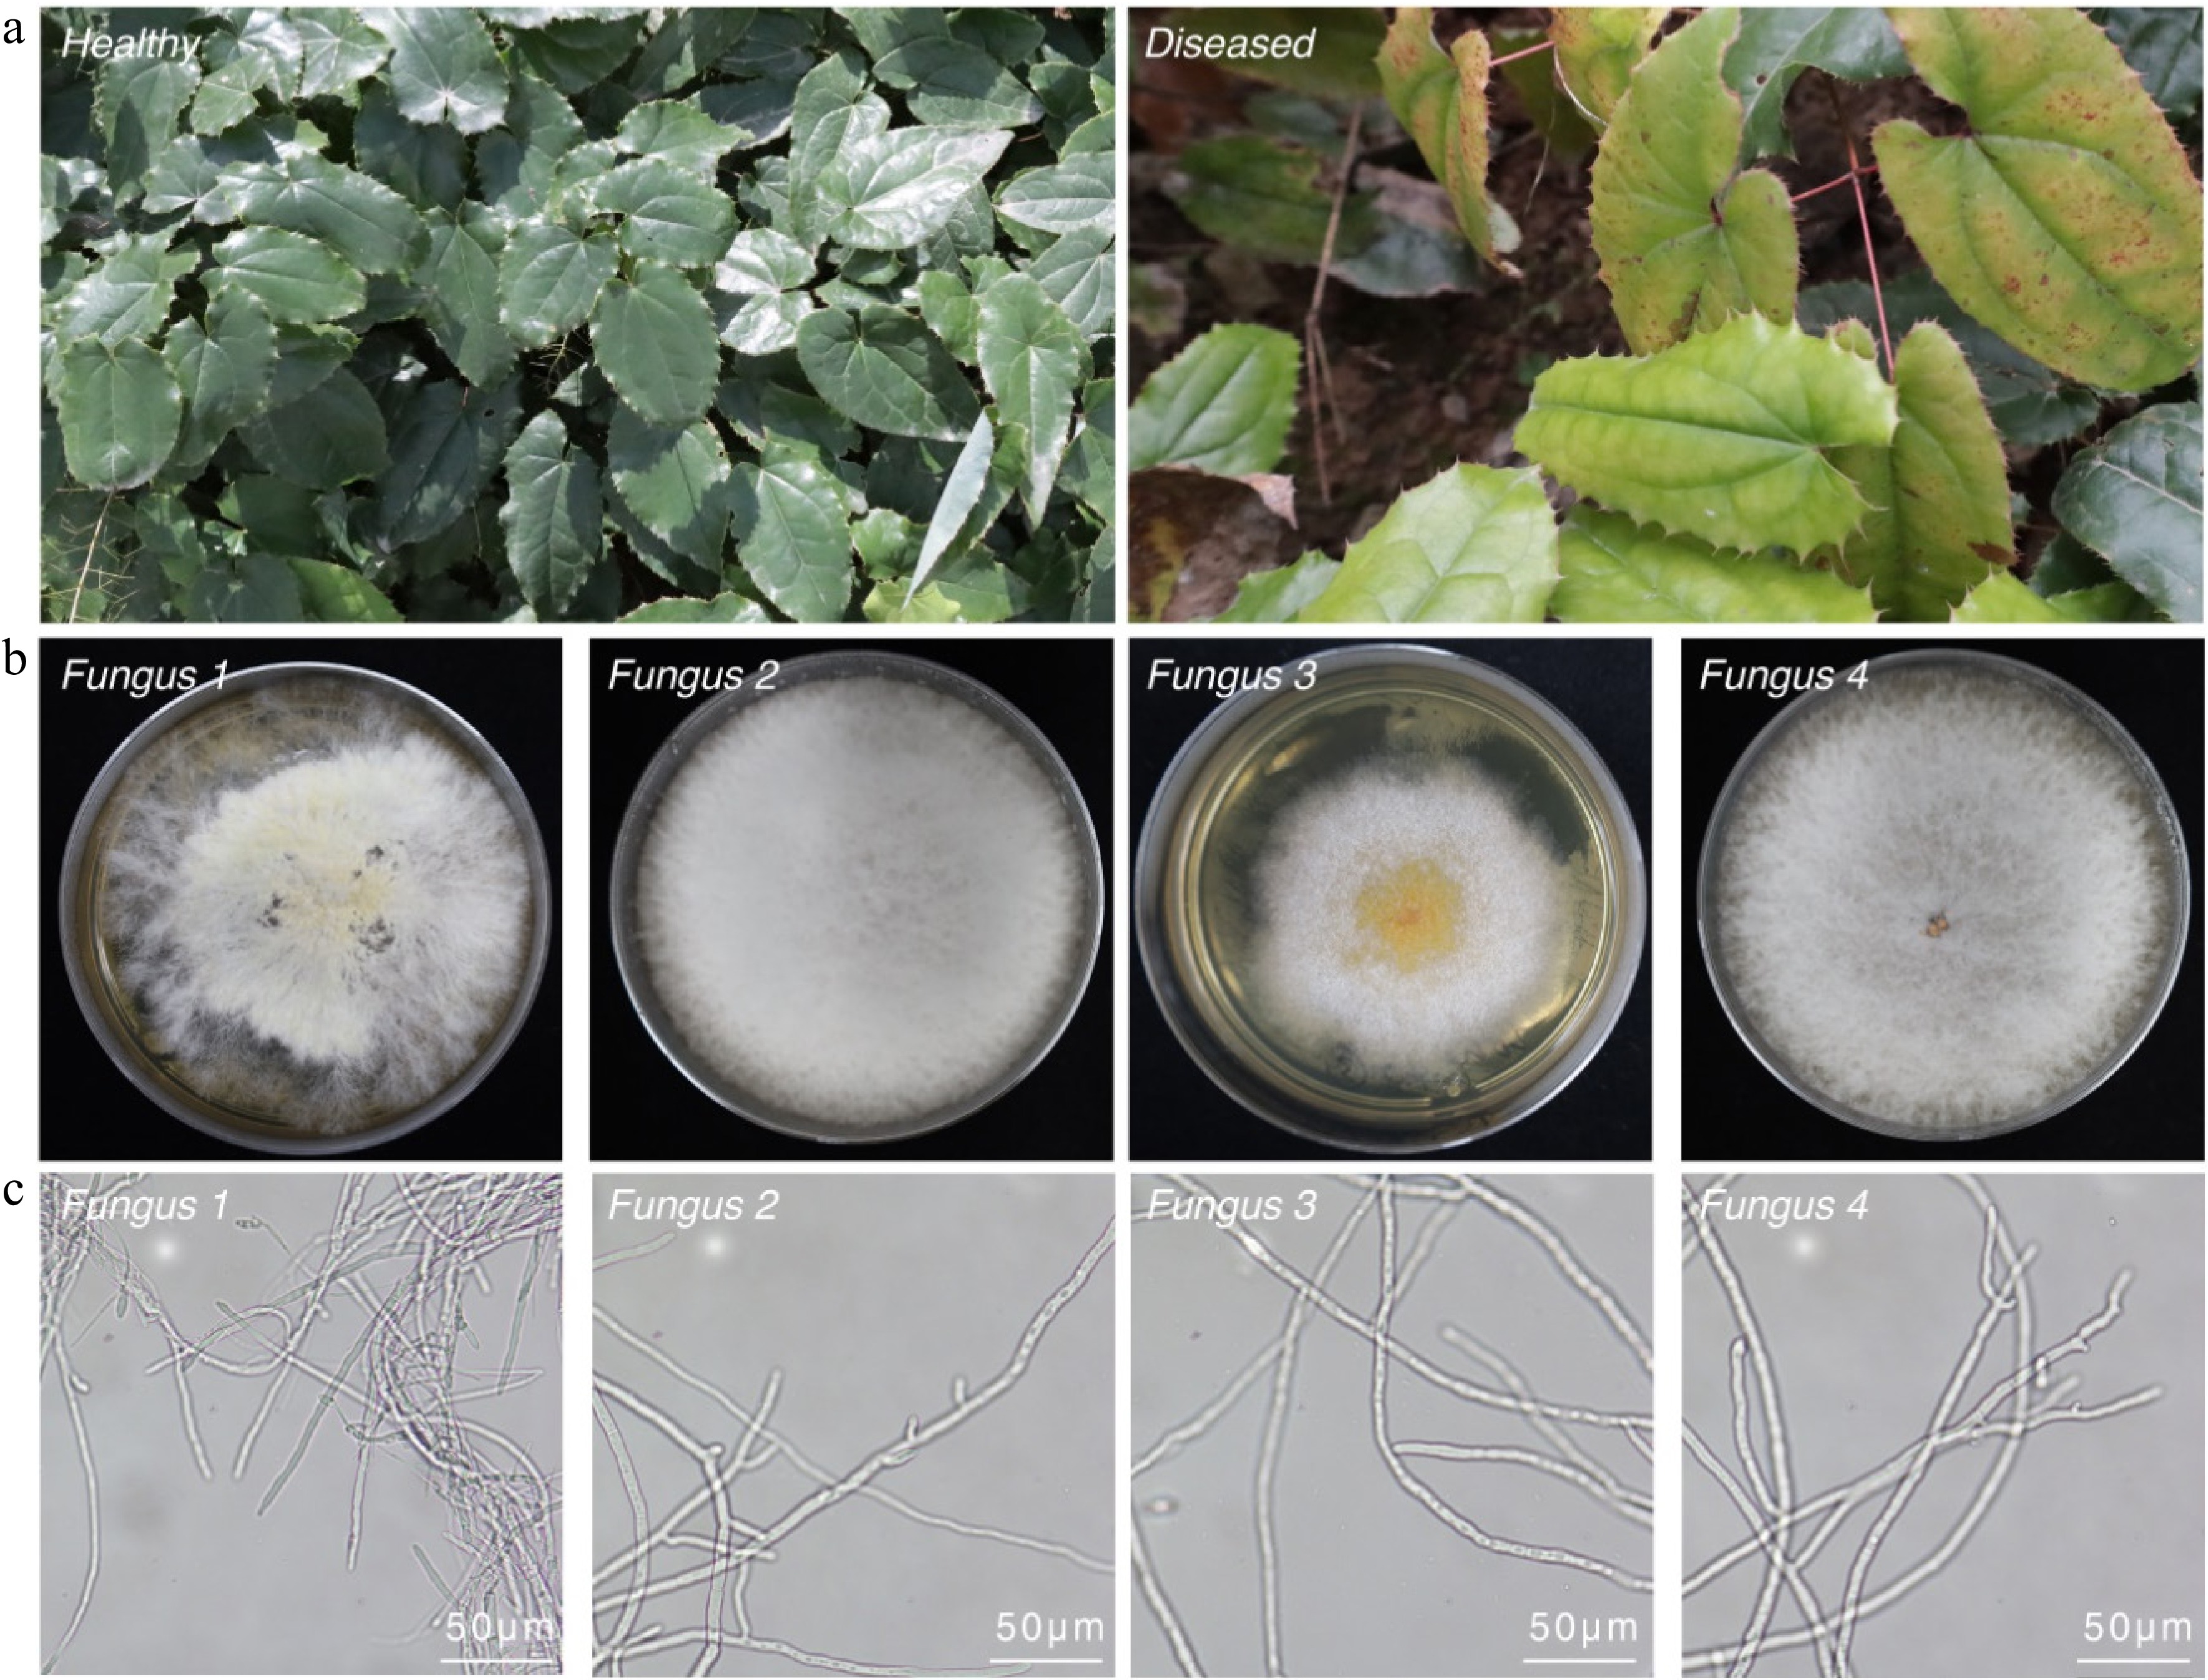
Figure 1.
Disease symptoms and morphological characterization of Colletotrichum anthracnose in Epimedium sagittatum. (a) Comparative field observations of healthy and anthracnose-infected Epimedium leaves demonstrating characteristic necrotic lesions with distinct chlorotic halos. (b) Morphological features of fungal colonies isolated from infected tissues following 7-d incubation on PDA at 28 °C, showing concentric growth patterns. (c) Microscopic characterization of hyphal structures using brightfield microscopy. Scale bars: 50 μm.
-
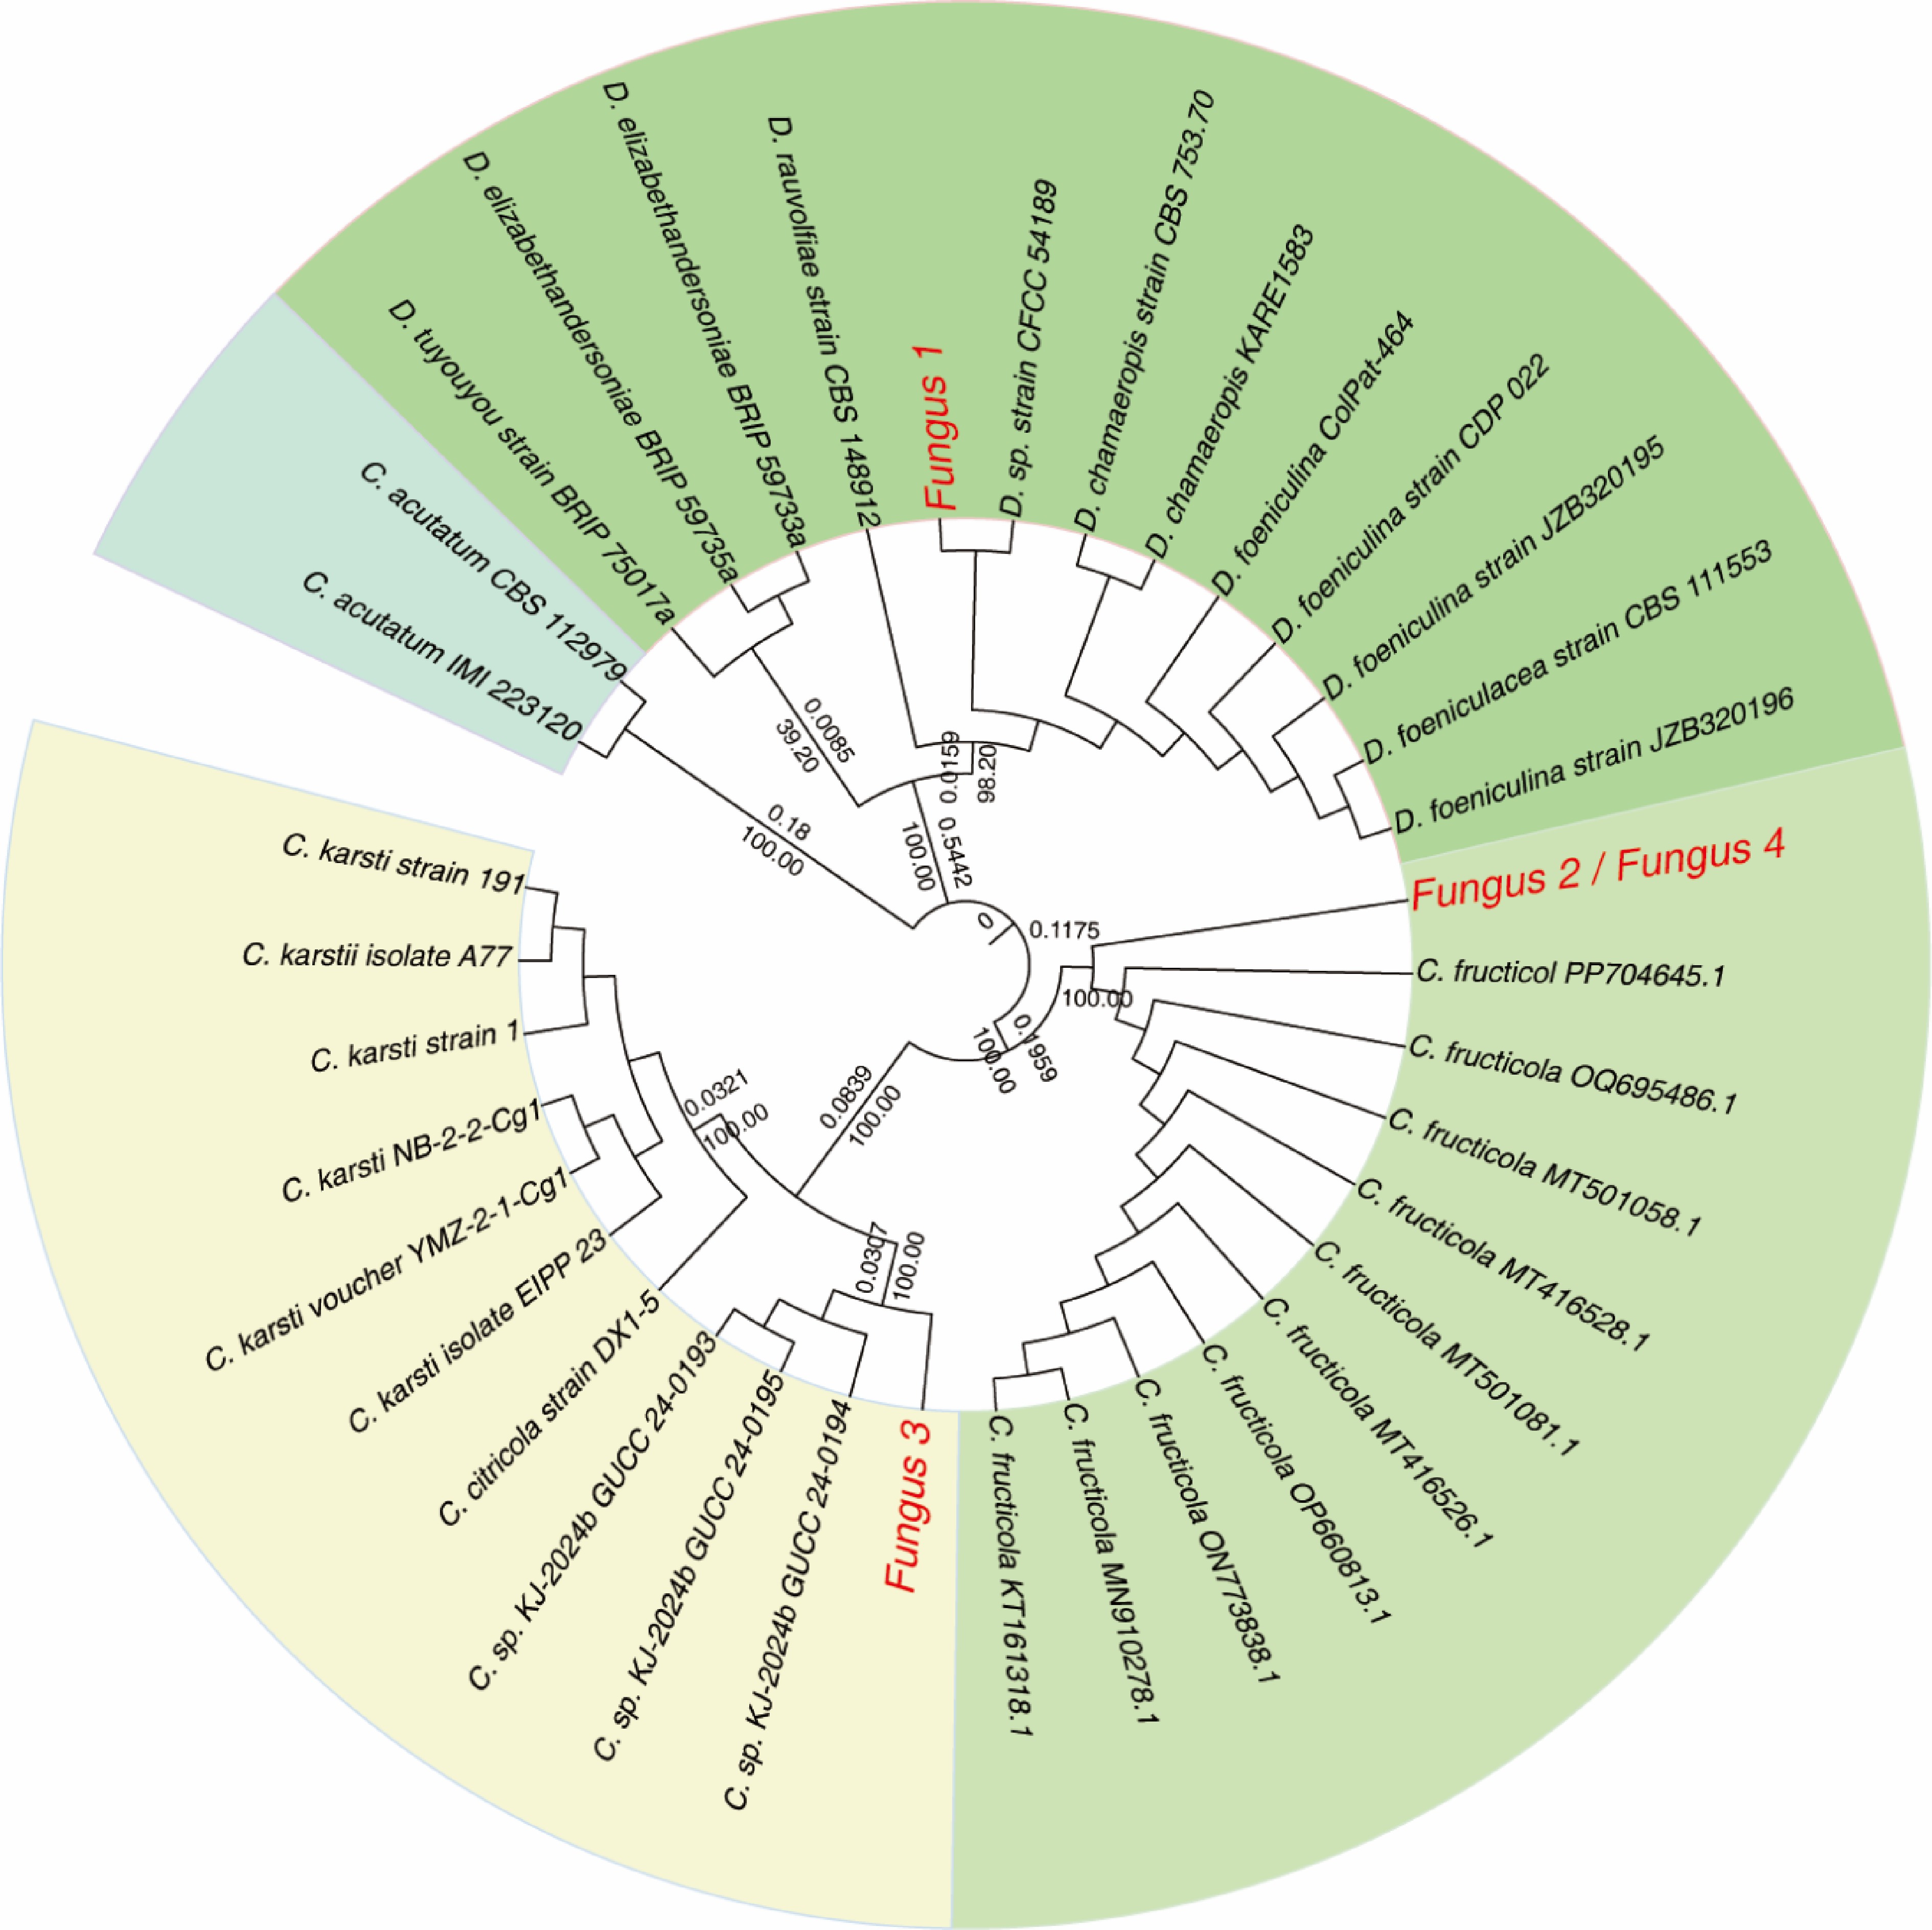
Figure 2.
Phylogenetic analysis of Colletotrichum isolates based on a concatenated alignment of the ITS2, GAPDH, TUB2, and ACT genes' regions. The maximum likelihood tree shows bootstrap support values of >30% at the nodes. Reference sequences were obtained from NCBI's GenBank. Isolates characterized in this study are highlighted in red.
-
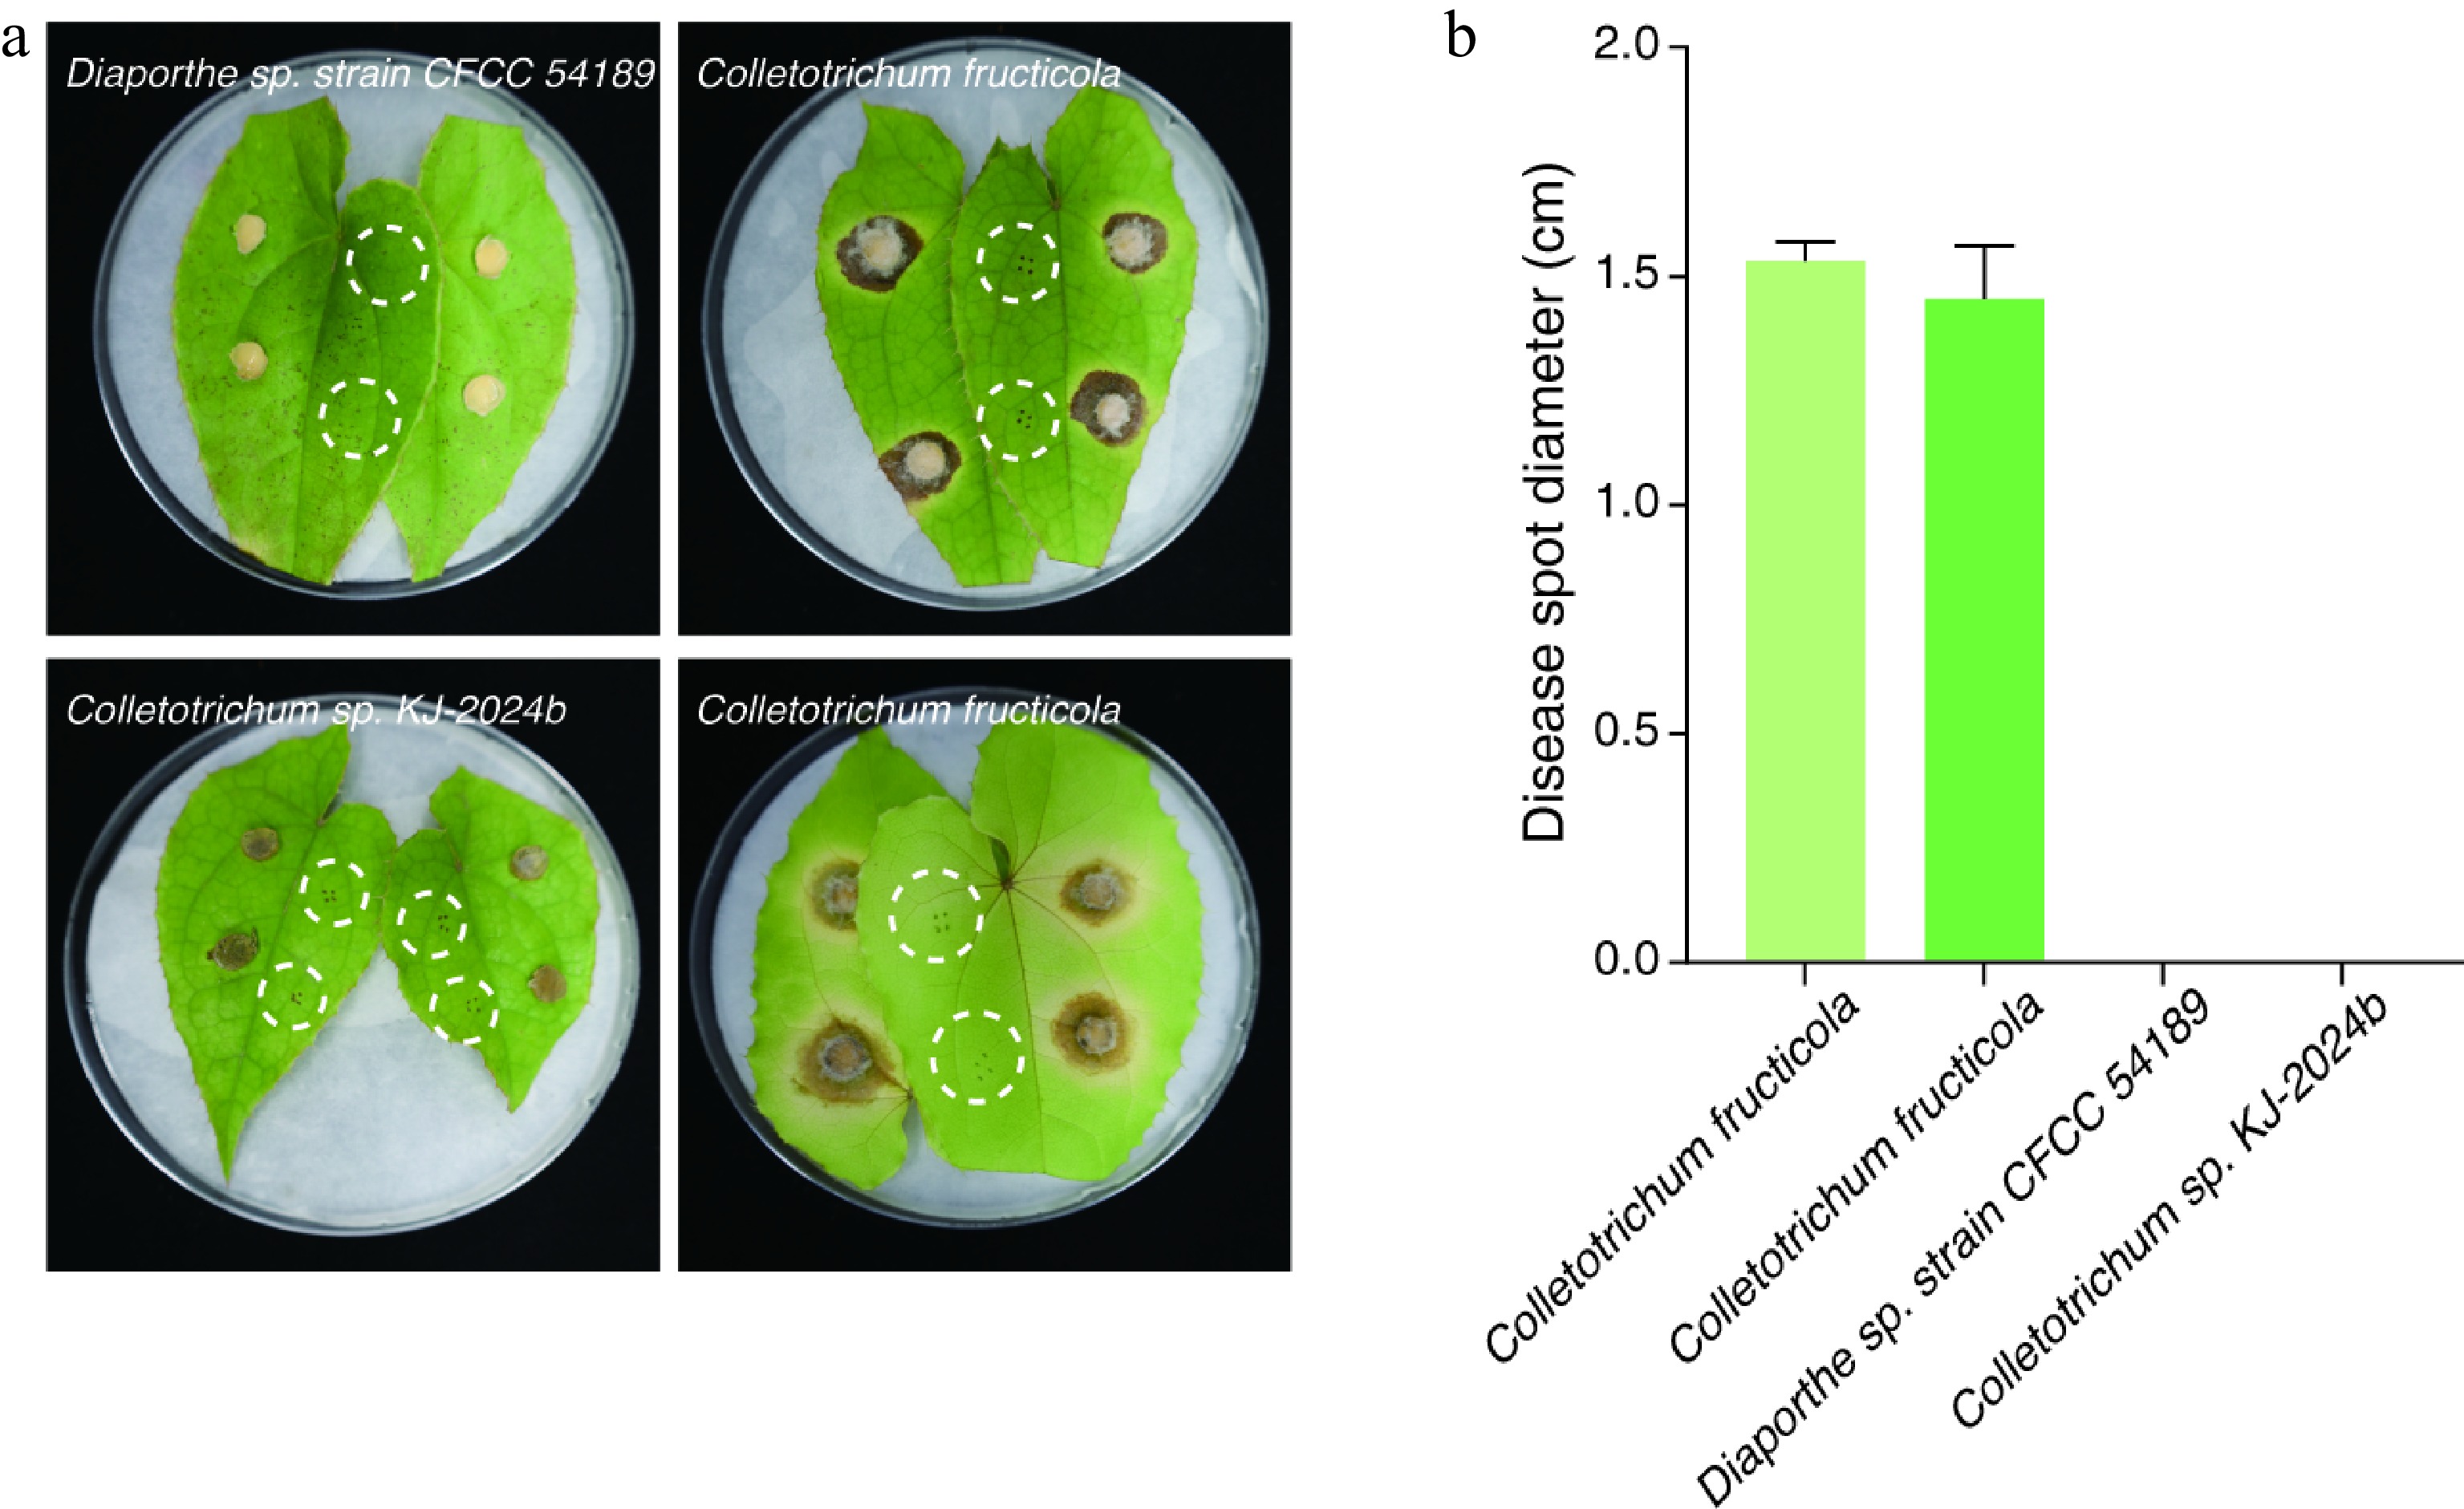
Figure 3.
Assessment of the pathogenicity endophytic fungi on Epimedium sagittatum foliage. Disease symptoms became evident on E. sagittatum leaves at 7 dpi under controlled in vitro conditions. (a) Differential leaf responses to fungal inoculation: C. fructicola (Fungus 2 and Fungus 4), Diaporthe sp. strain CFCC 54189 (Fungus 1), and Colletotrichum sp. KJ-2024b (Fungus 3). White dashed circles demarcate uninoculated control leaves. (b) Quantitative analysis of lesion development revealed significant necrosis induction by C. fructicola strains Fungus 2 (mean lesion diameter: 15.3 ± 2 mm) and Fungus 4 (14.5 ± 4.5 mm), whereas Diaporthe sp. strain CFCC 54189 (Fungus 1) and Colletotrichum sp. KJ-2024b (Fungus 3) exhibited no detectable pathogenic activity. Vertical bars indicate the mean lesion diameter with standard deviation error margins.
-
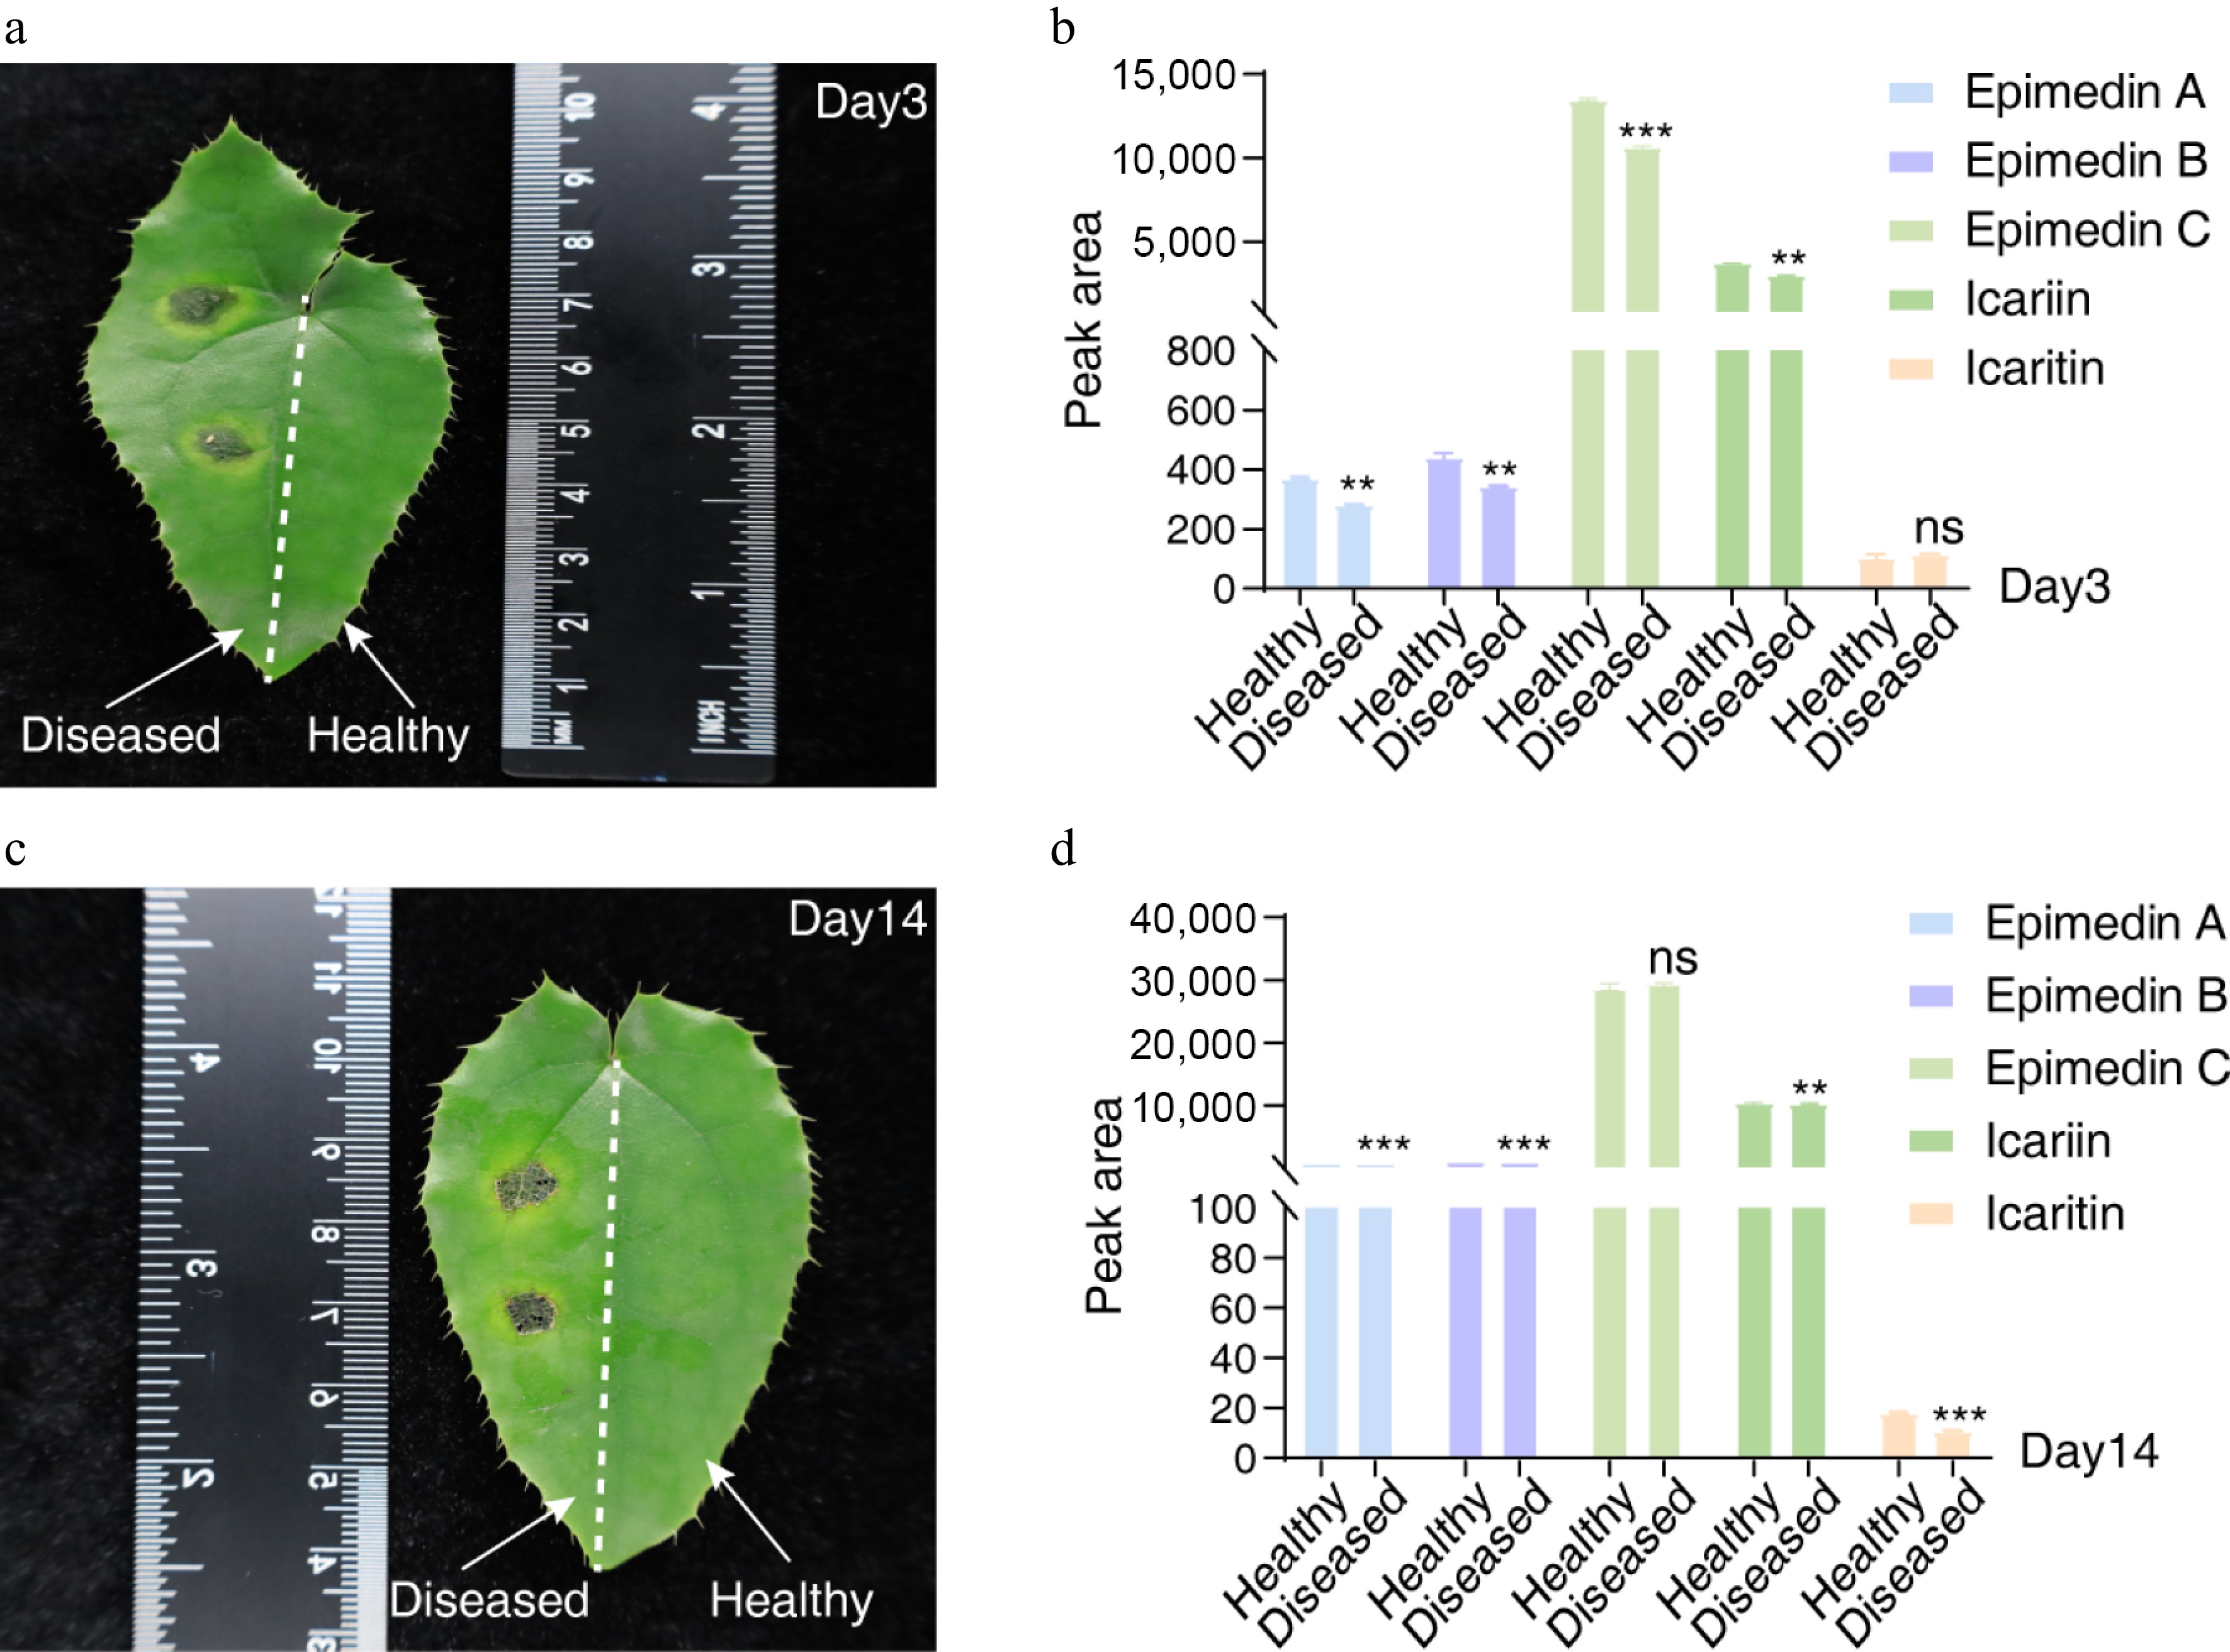
Figure 4.
Dynamic profiling of flavonoid metabolites in Epimedium sagittatum during Colletotrichum fructicola infection. (a, c) Representative HPLC chromatograms depicting characteristic flavonoid profiles in healthy (control) and pathogen-infected leaves at 3 and 14 dpi, respectively. (b, d) Quantitative analysis of major flavonoid metabolites normalized to the control levels. Data represent the mean ± SD (n = 5 biological replicates). Statistical significance was determined by Student's t-test (**, p < 0.01; ***, p < 0.001; ns, p > 0.05 not significant).
-
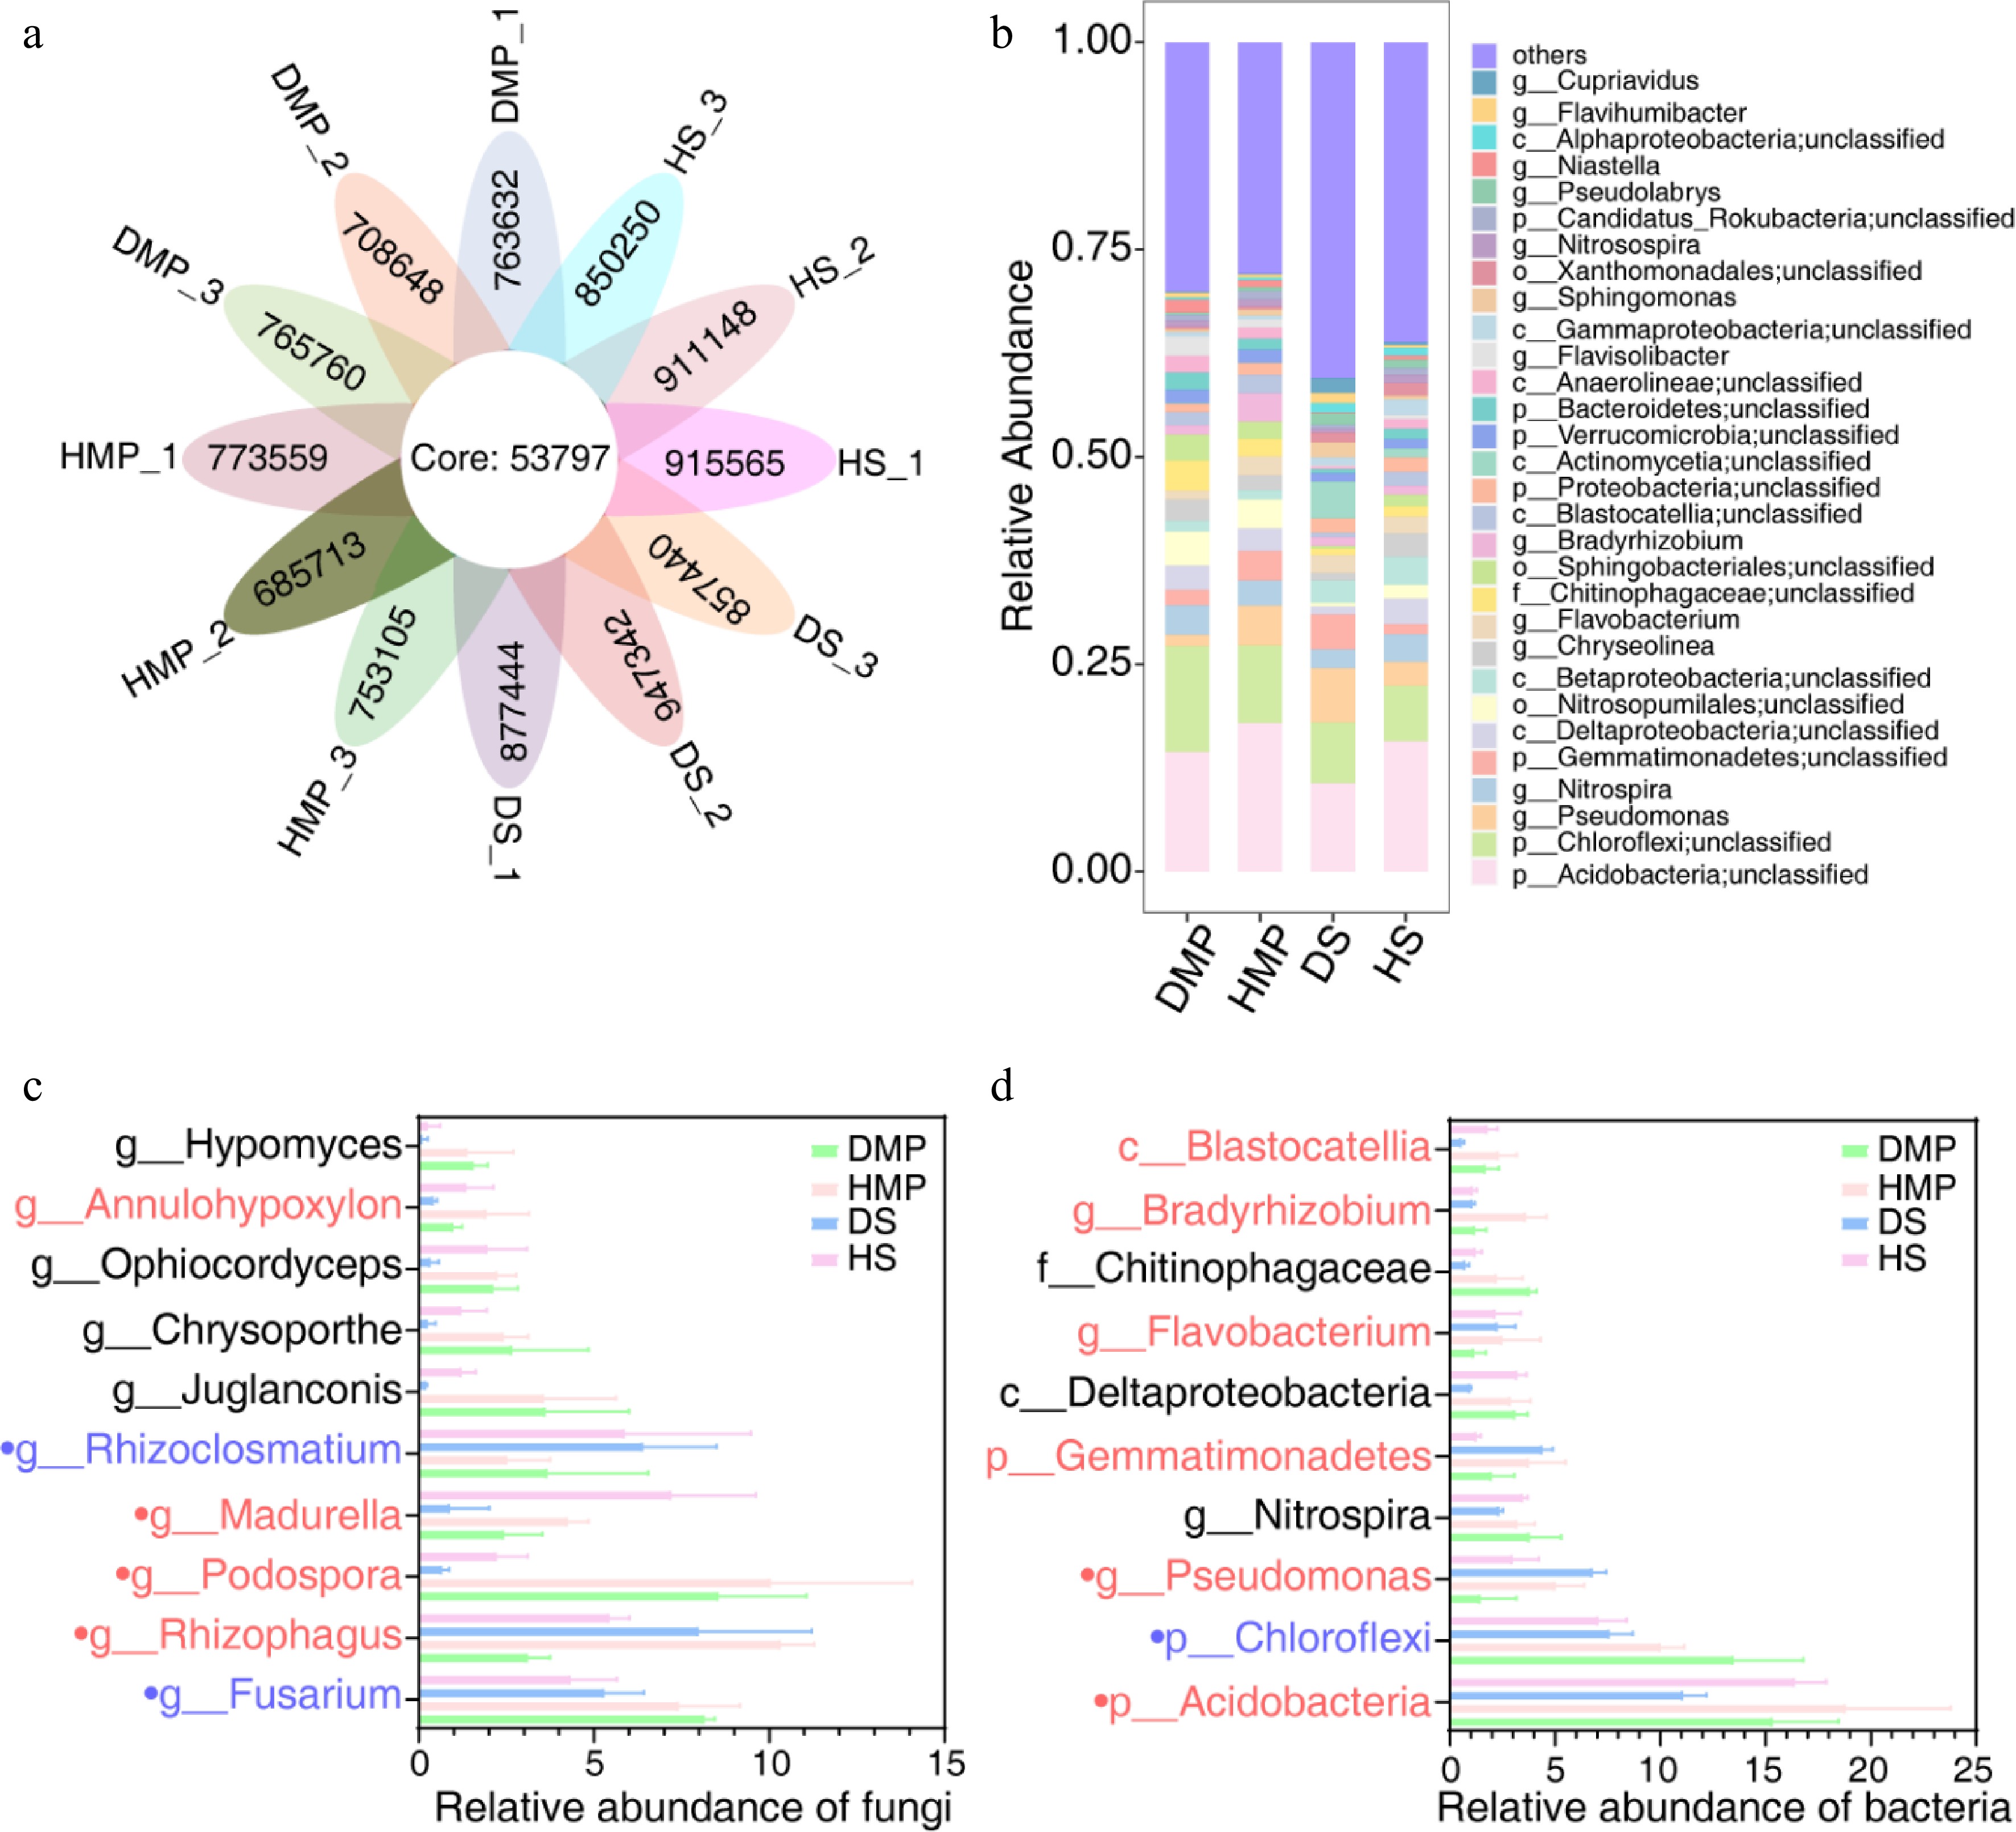
Figure 5.
Rhizosphere microbiome dysbiosis in diseased Epimedium sagittatum. (a) Relative abundance of bacterial and fungal taxa at the phylum level in healthy (control) and diseased rhizospheres. DMP, diseased and mature plants; HMP, healthy and mature plants; DS, diseased seedlings; HS, healthy seedlings. Significant shifts (FDR < 0.05) are highlighted in stacked bar charts. (b) Heatmap illustrating the differential abundance of dominant microbial families. Red and blue gradients indicate increased and decreased abundance in diseased soils, respectively. (c, d) Fold-change analysis of key taxa, including Rhizophagus (beneficial) and Fusarium (pathogenic). Red represents putative beneficial taxa, blue represents putative pathogenic taxa, and black represents putative amphoteric taxa. Data are presented as the mean ± SD (n = 3).
-
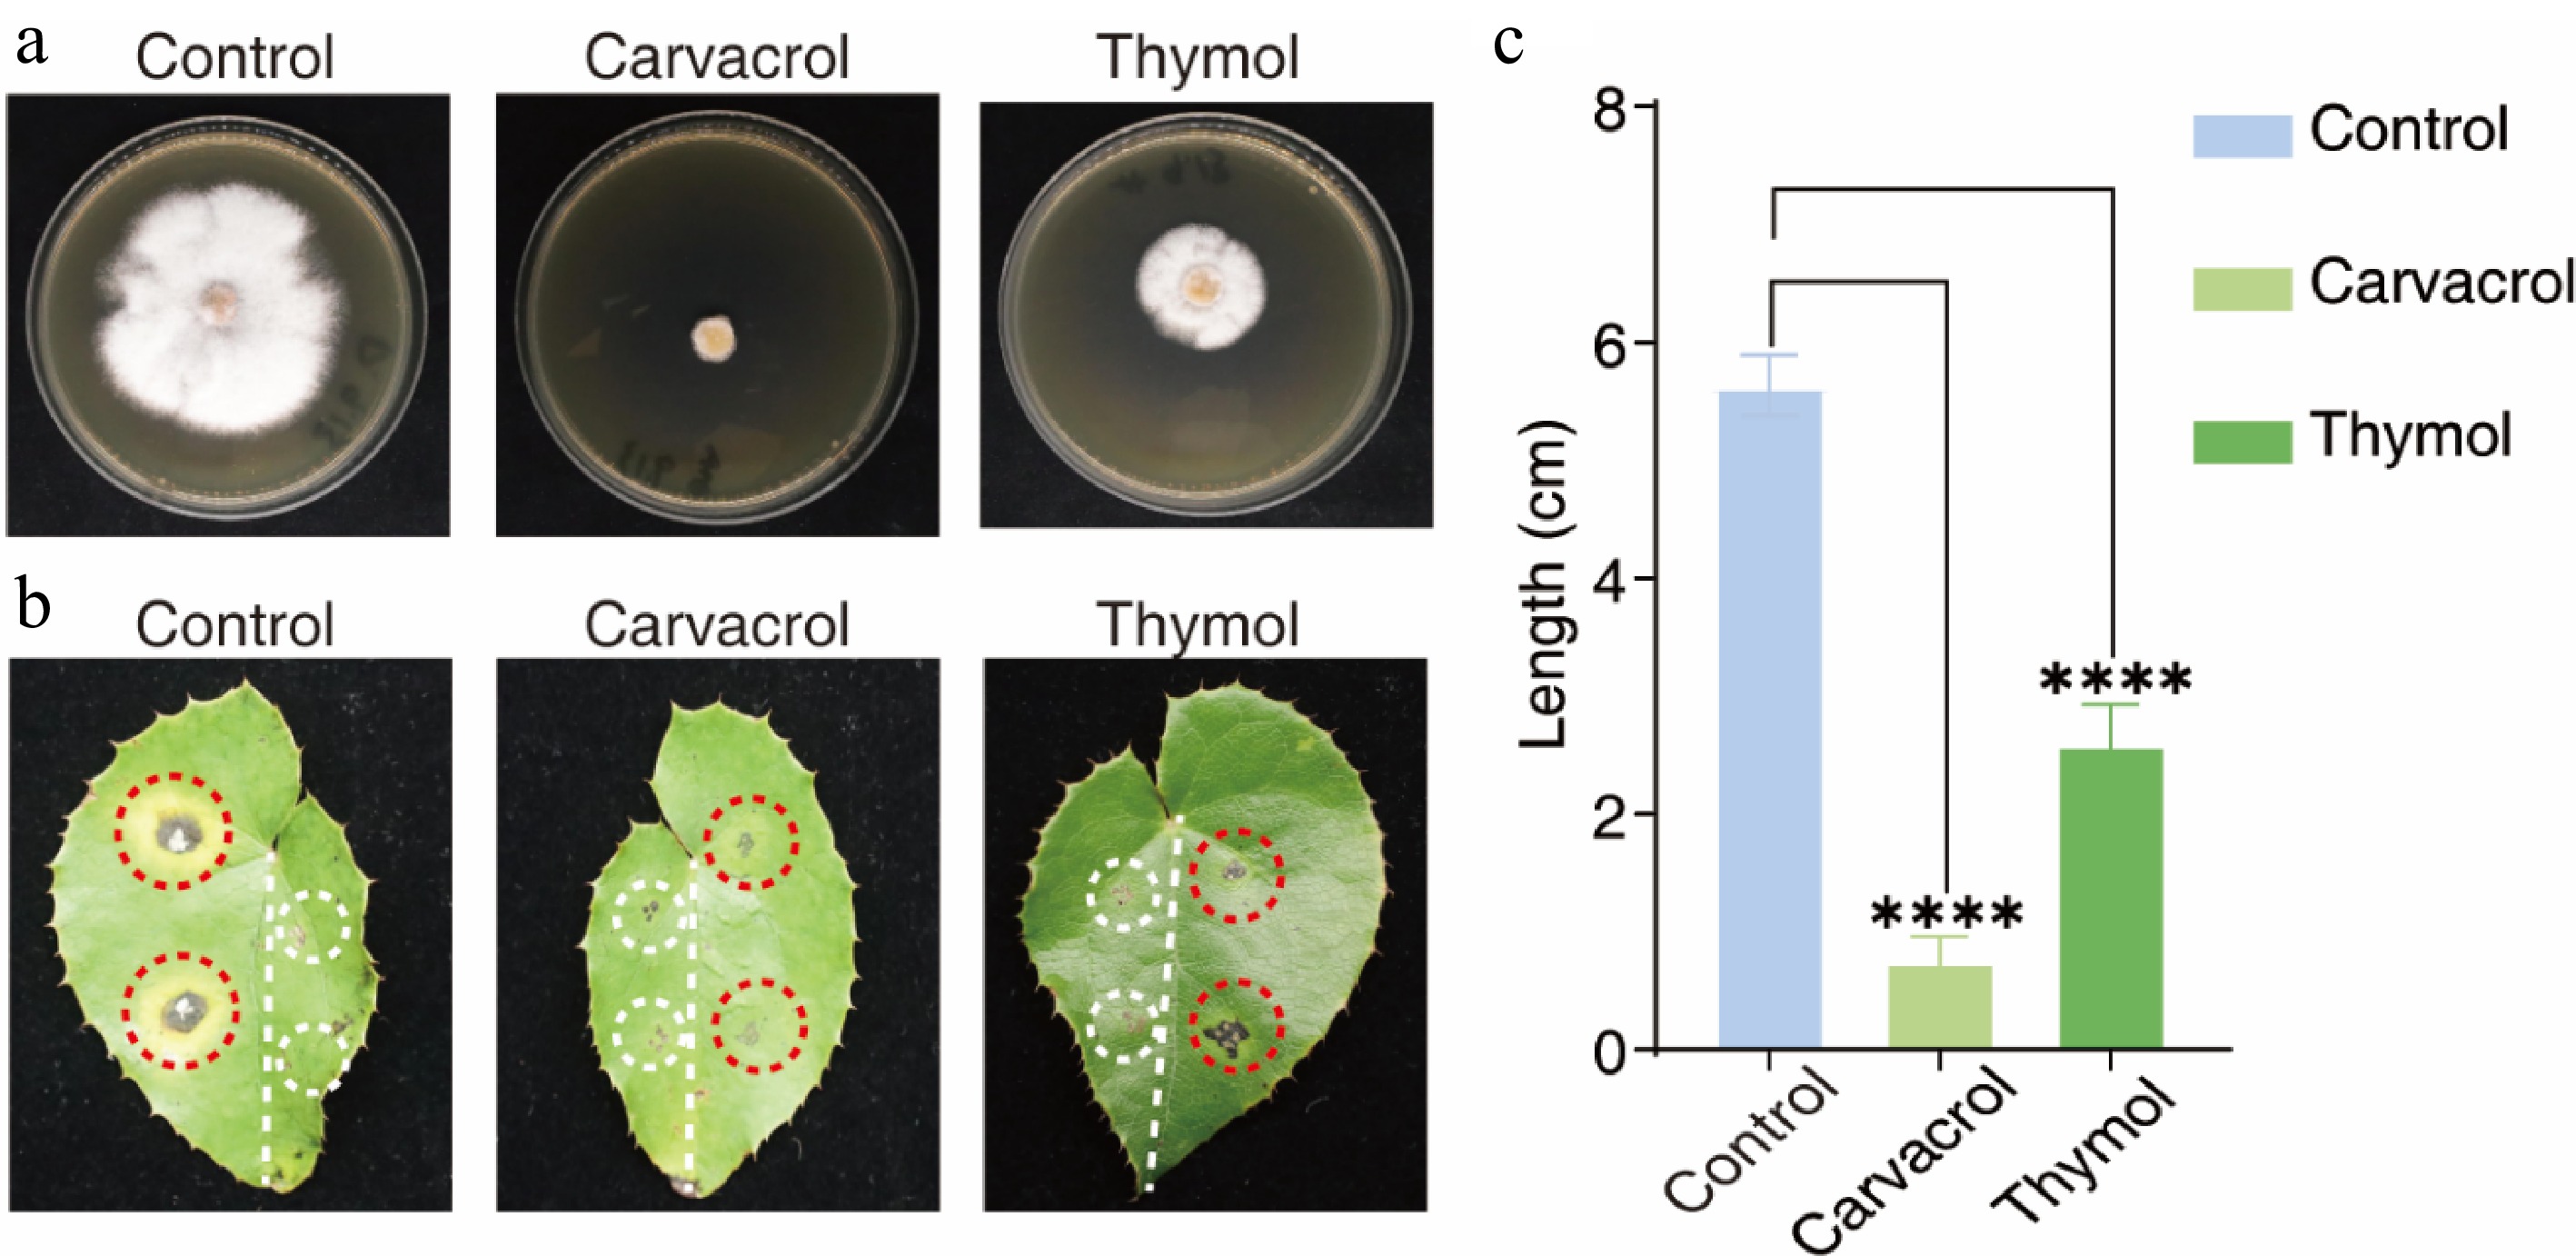
Figure 6.
Antifungal efficacy of carvacrol and thymol against Colletotrichum fructicola in detached leaf assays. (a) In vitro mycelial inhibition assay demonstrating the antifungal activity of carvacrol or thymol (100 μg·mL−1) against C. fructicola. (b) Comparison of disease phenotypes: Untreated controls developed characteristic anthracnose lesions (light gray necrotic centers bordered by gray-brown margins) by 10 dpi (left panel, red circles). Carvacrol- or thymol-treated specimens (right panel, red circles) showed complete or intermediate suppression of hyphal proliferation and lesion formation. Control pinhole (white circles): Mechanically drilled aperture showing no detectable growth of fungal hyphae under standard culture conditions. (c) Quantitative lesion analysis: Carvacrol treatment achieved 86.7% efficacy (****, p < 0.0001) by restricting the lesions' diameter to 0.75 cm, significantly lower than the untreated controls (5.63 cm). Thymol demonstrated intermediate inhibitory capacity with a 54.4% reduction in diameter (2.60 cm) (****, p < 0.0001). Data represent the mean ± SD from triplicate experiments (n = 3 biological replicates with three leaves each). Statistical significance determined by one-way ANOVA with Tukey's post hoc test.
Figures
(6)
Tables
(0)