-
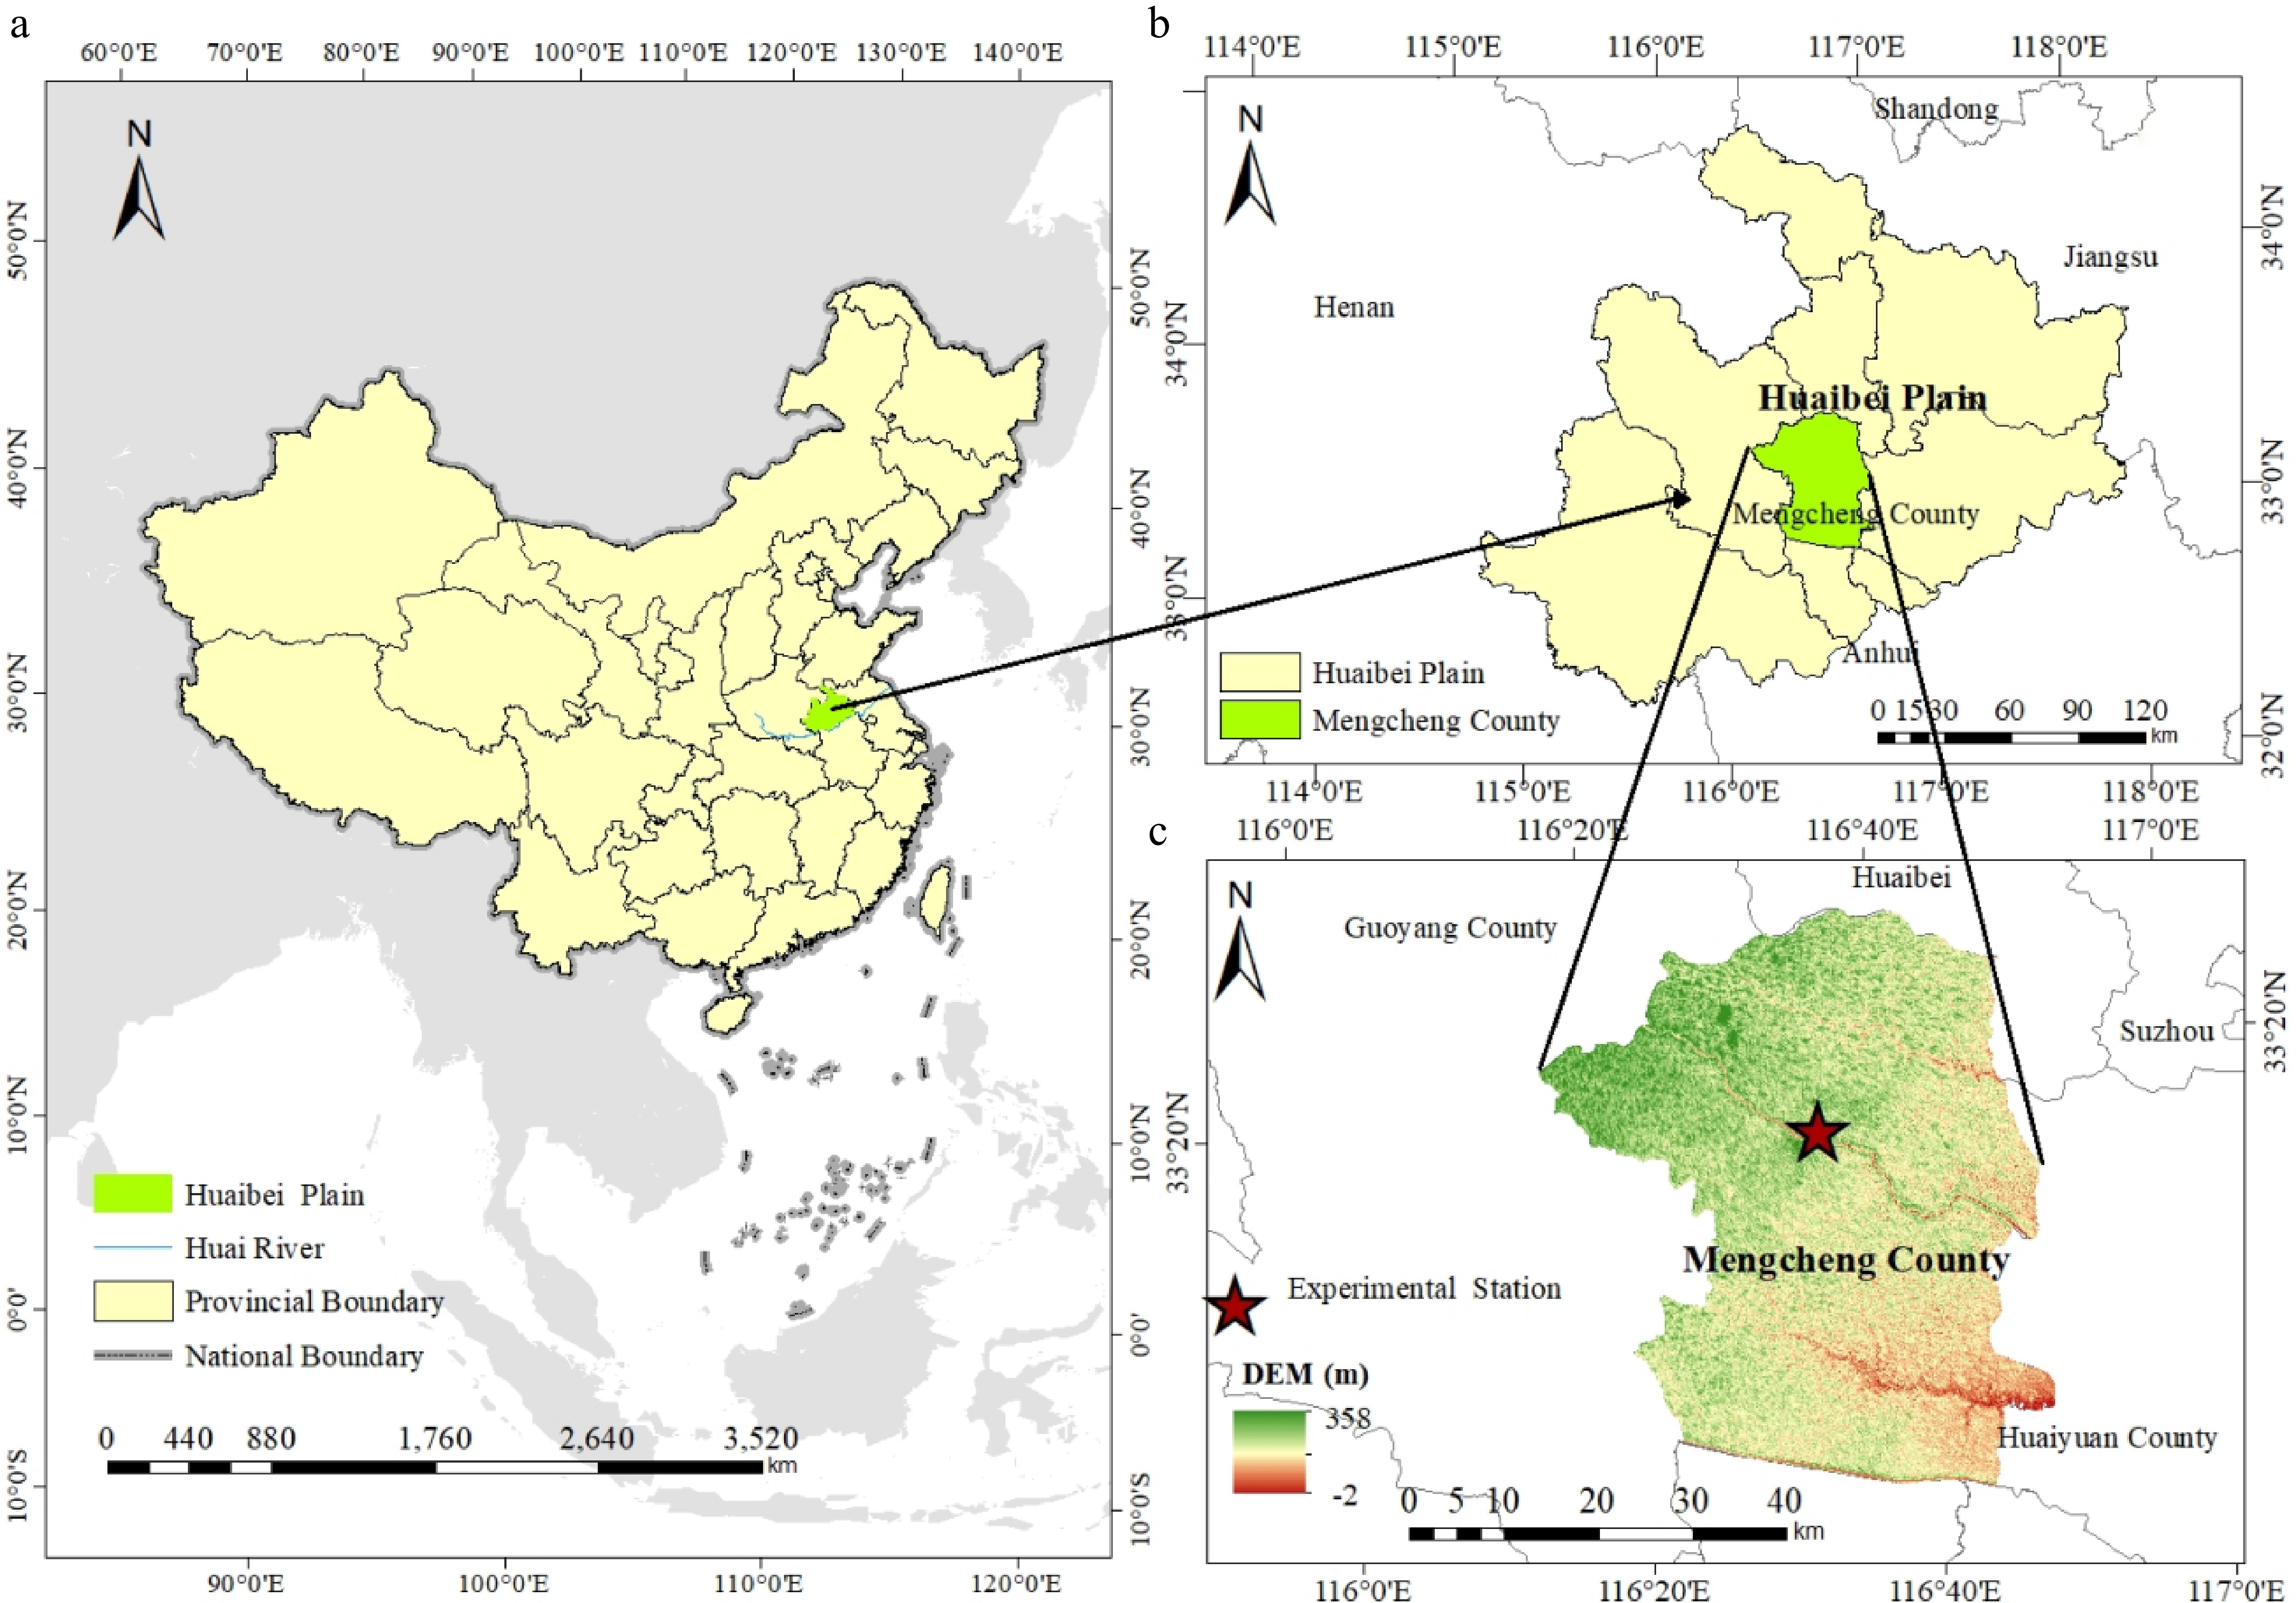
Figure 1.
Location of the experiment station in this study.
-
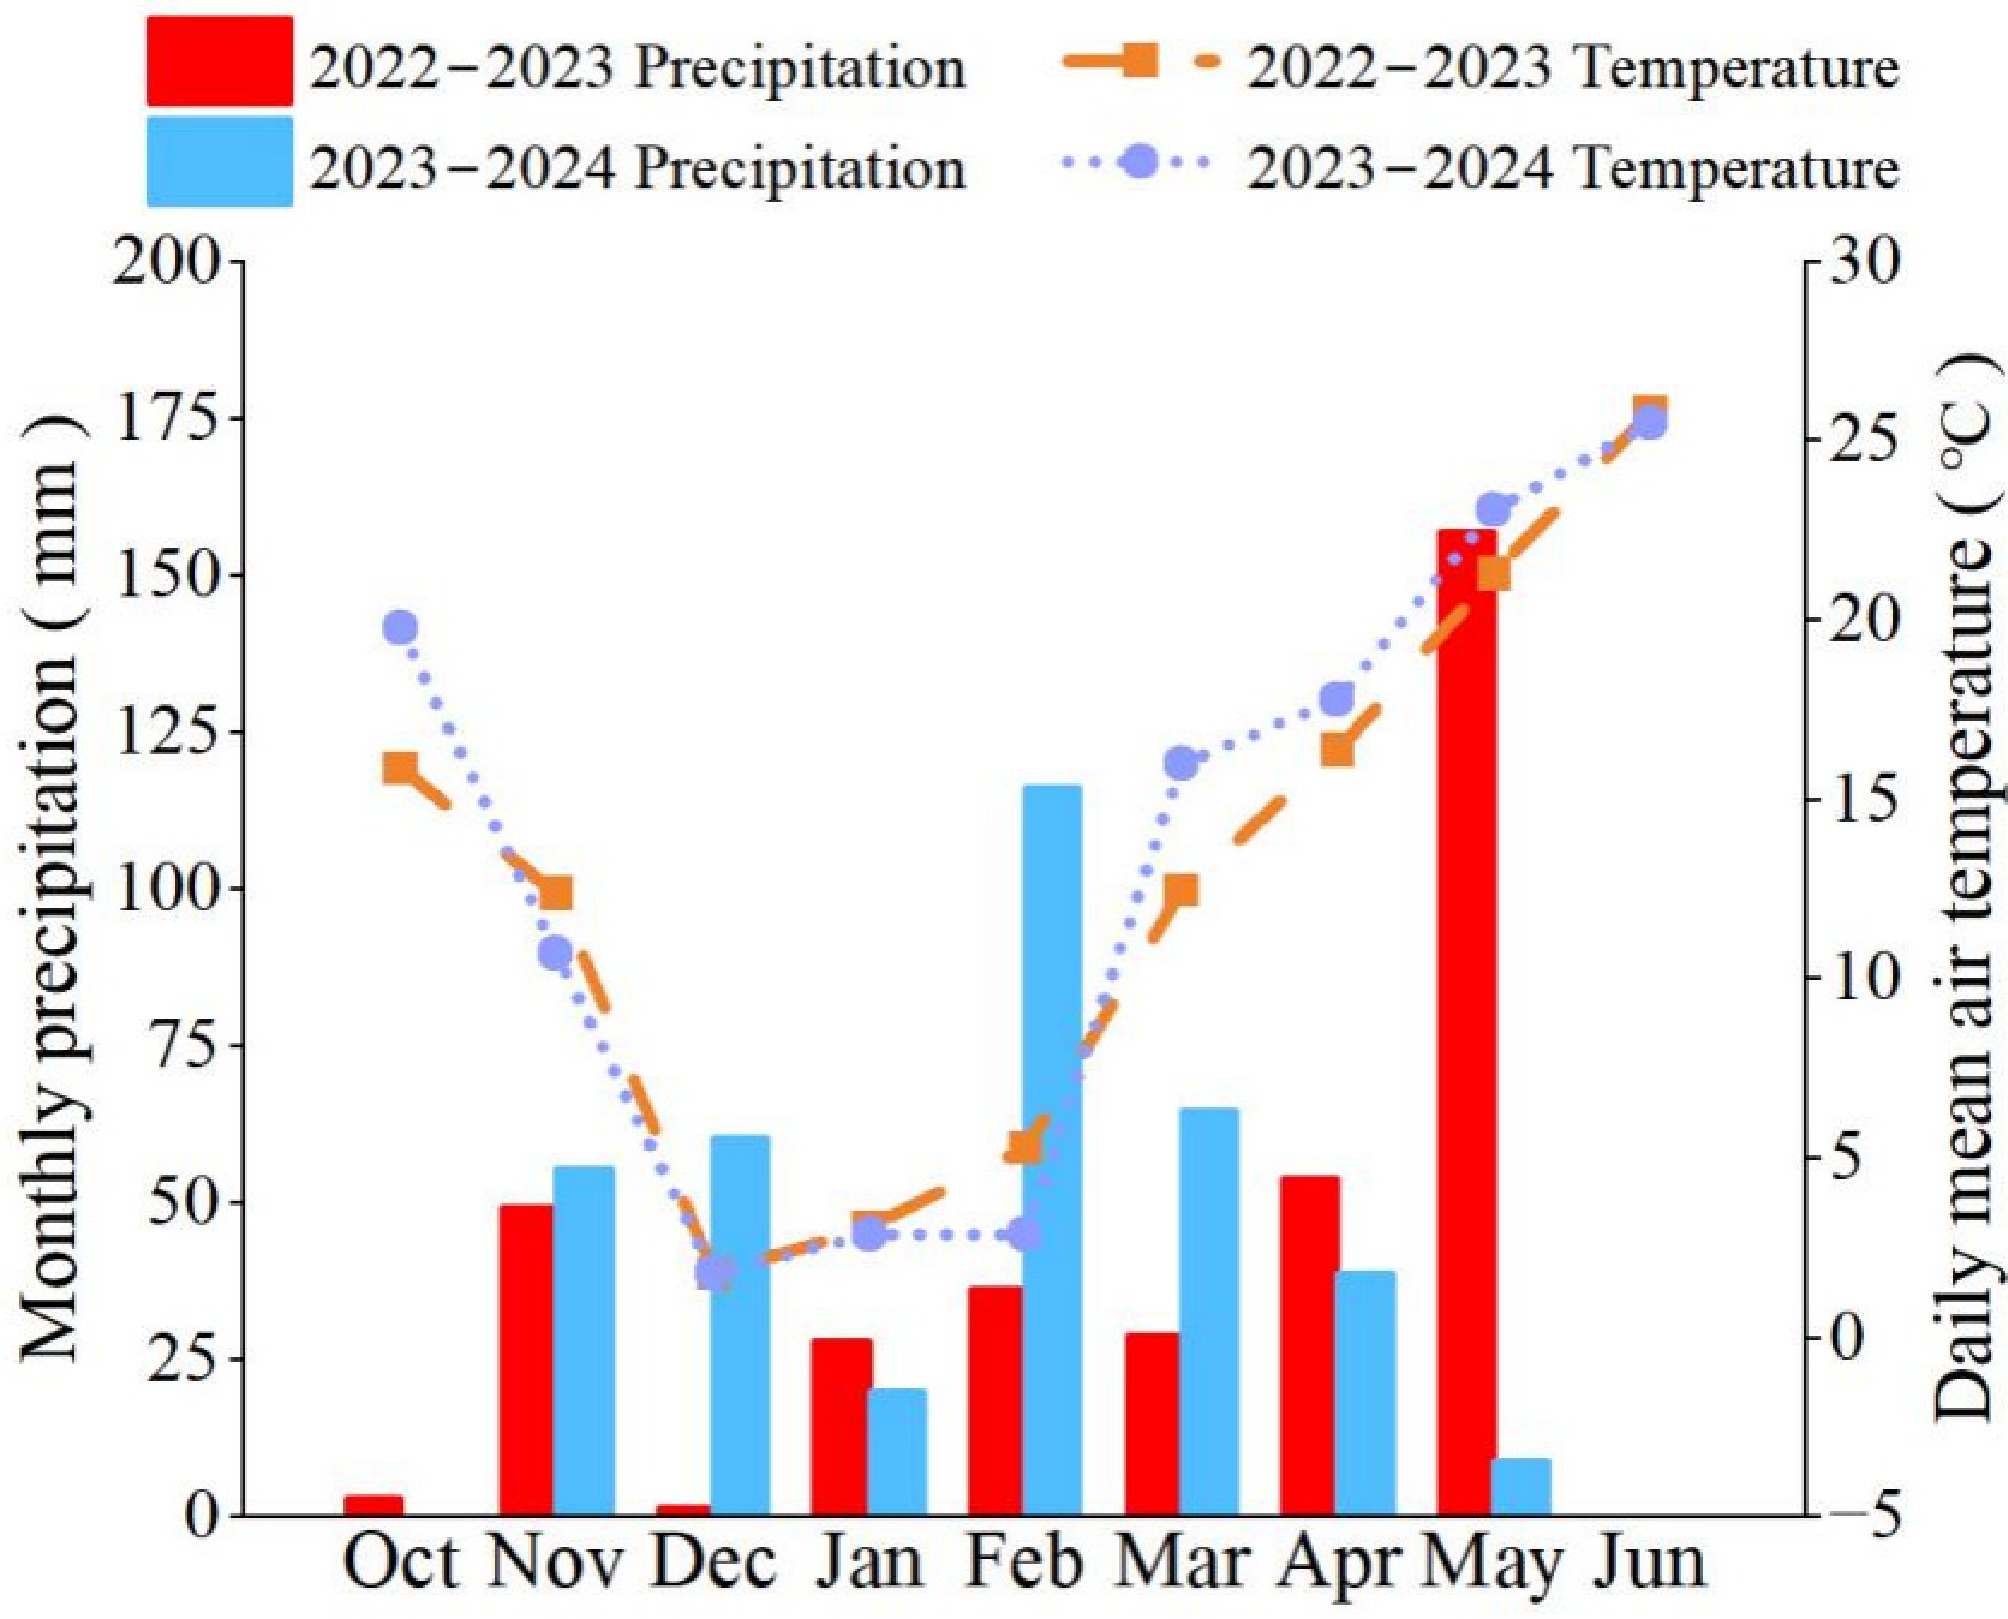
Figure 2.
Monthly precipitation and daily mean air temperature during the two winter wheat growing seasons.
-
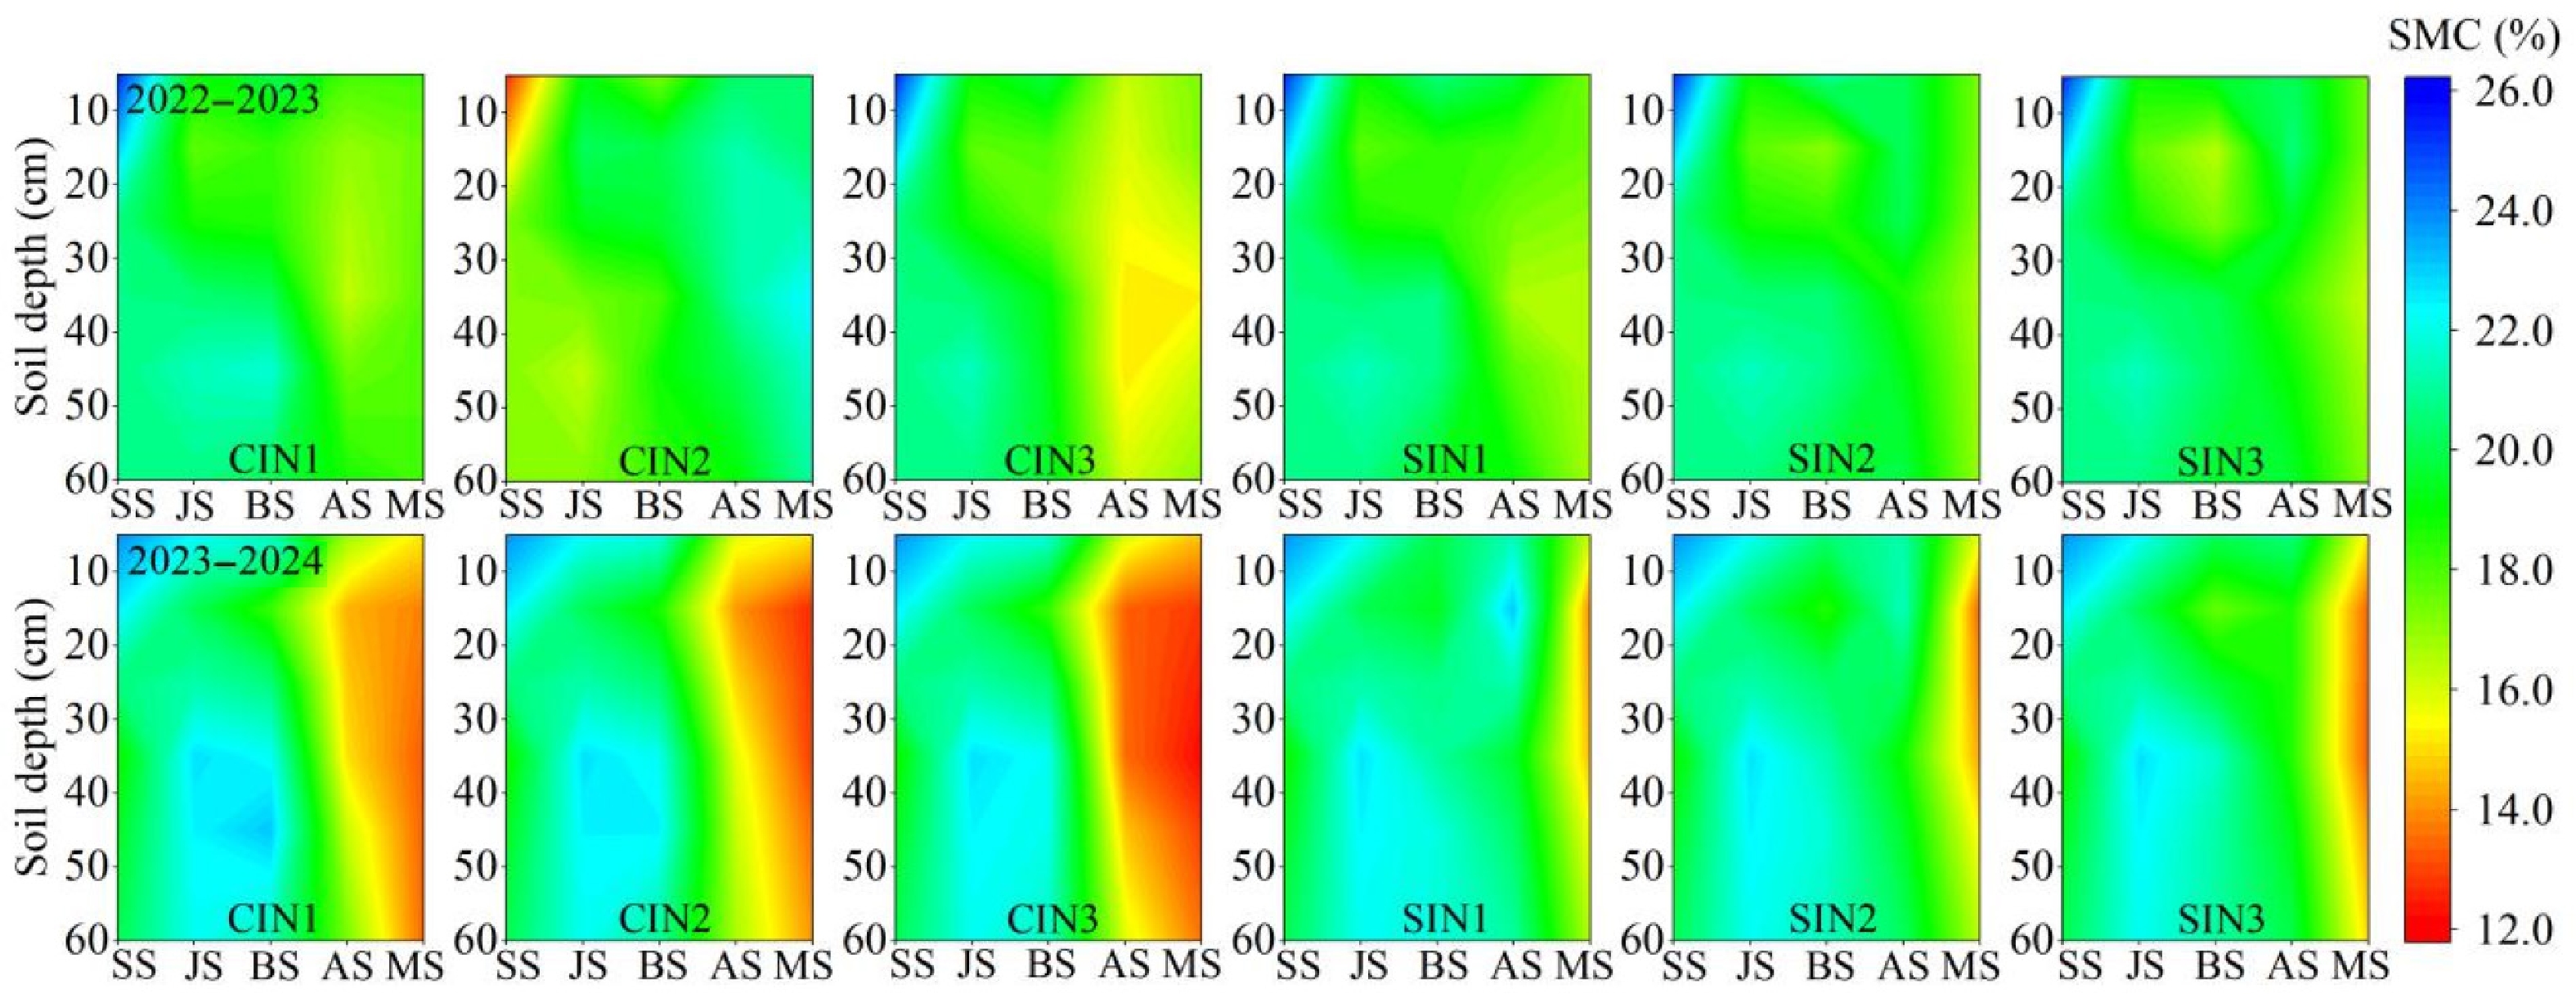
Figure 3.
Soil moisture content in different soil layers (0–60 cm profile) for different treatments during the 2022–2023 and 2023–2024 growing seasons. Note: CI, conventional flood irrigation; SI, micro-sprinkler irrigation; N1, N2, and N3 represent topdressing nitrogen with 45 kg·ha−1, 90 kg·ha−1, and 135 kg·ha−1 respectively. SS, sowing stage; JS, jointing stage; BS, booting stage; AS, anthesis stage; MS, maturity stage.
-
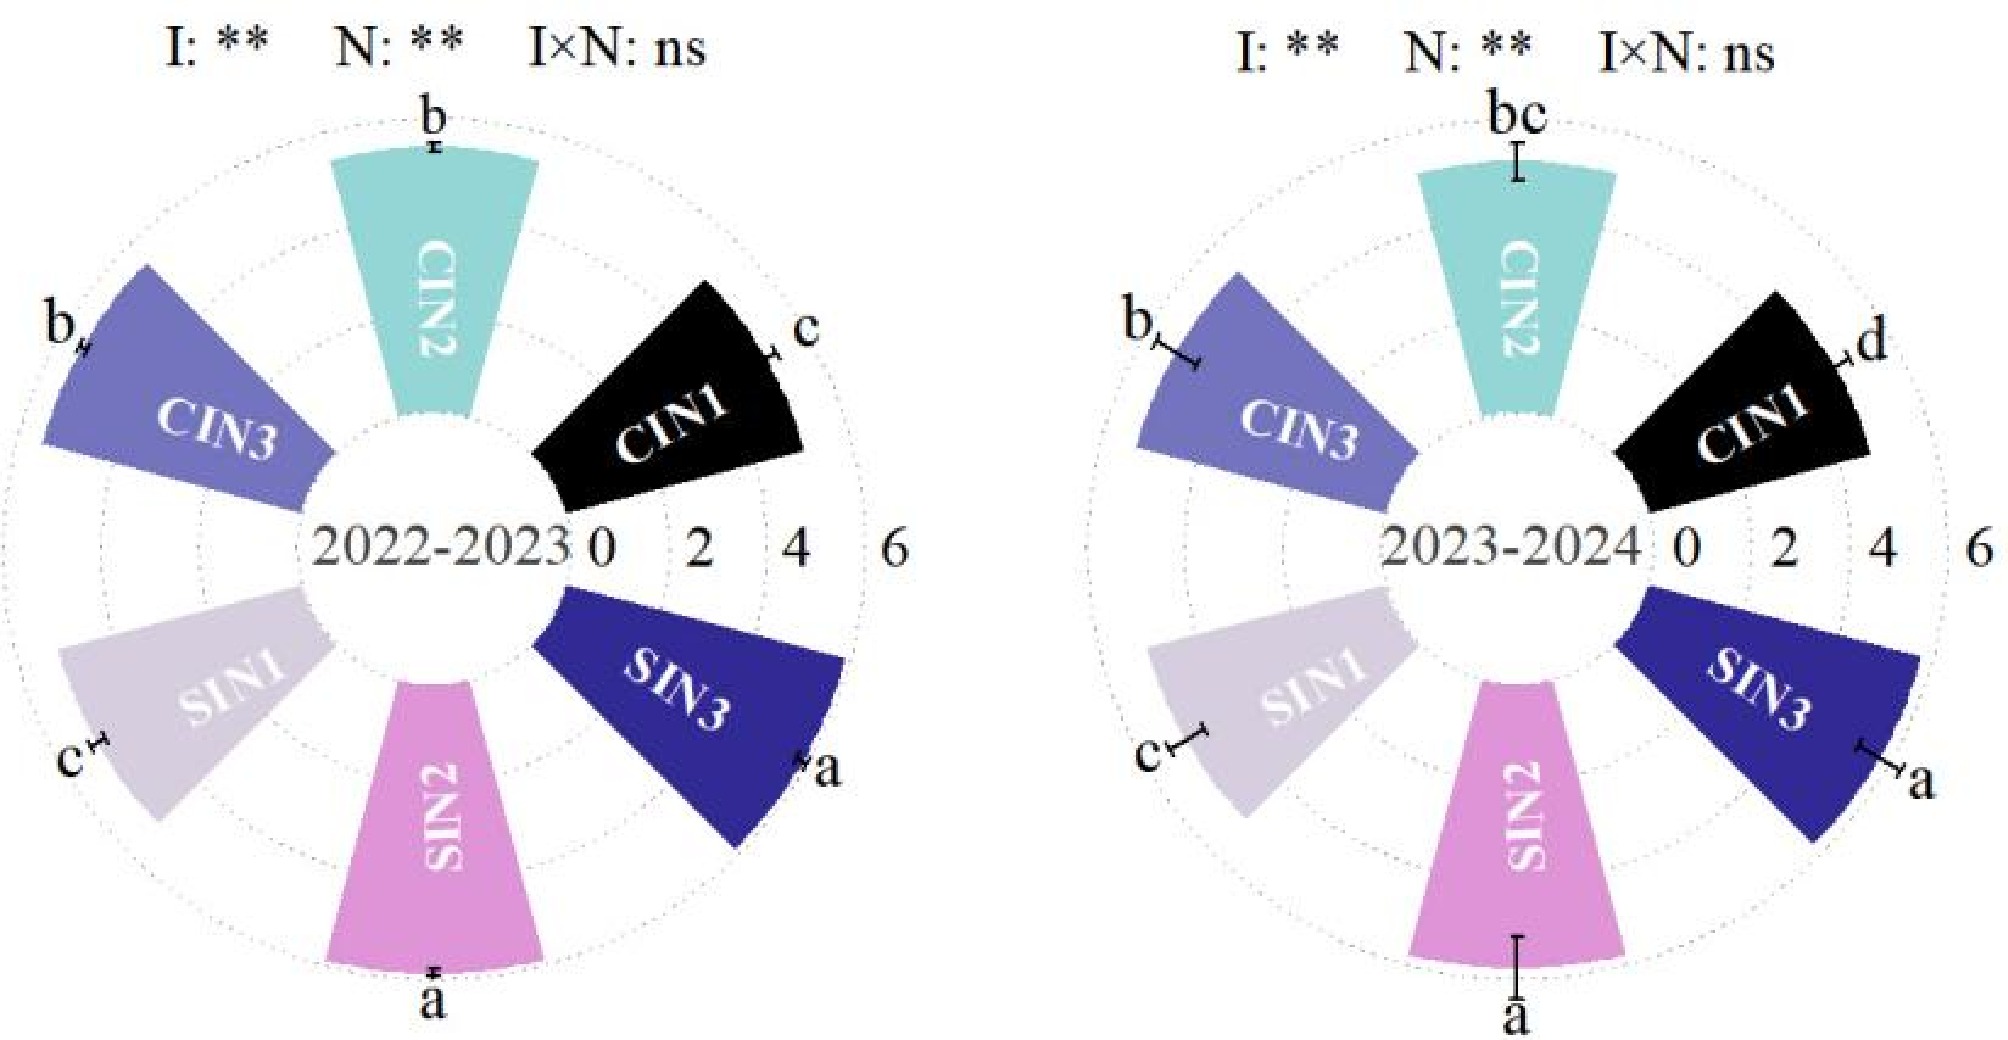
Figure 4.
Population leaf area index at the anthesis stage for different treatments during the 2022–2023 and 2023–2024 growing seasons. Note: CI, conventional flood irrigation; SI, micro-sprinkler irrigation; N1, N2 and N3 represent topdressing nitrogen with 45 kg·ha−1, 90 kg·ha−1, and 135 kg·ha−1 respectively. Various letters stand for significant differences at p < 0.05, and the vertical bars indicate the standard deviation (n = 3). I indicates the irrigation methods, N indicates the nitrogen application levels, and I × N indicates the interaction. ** represents the significant difference at the 0.01 level; ns represents that the difference is not significant.
-
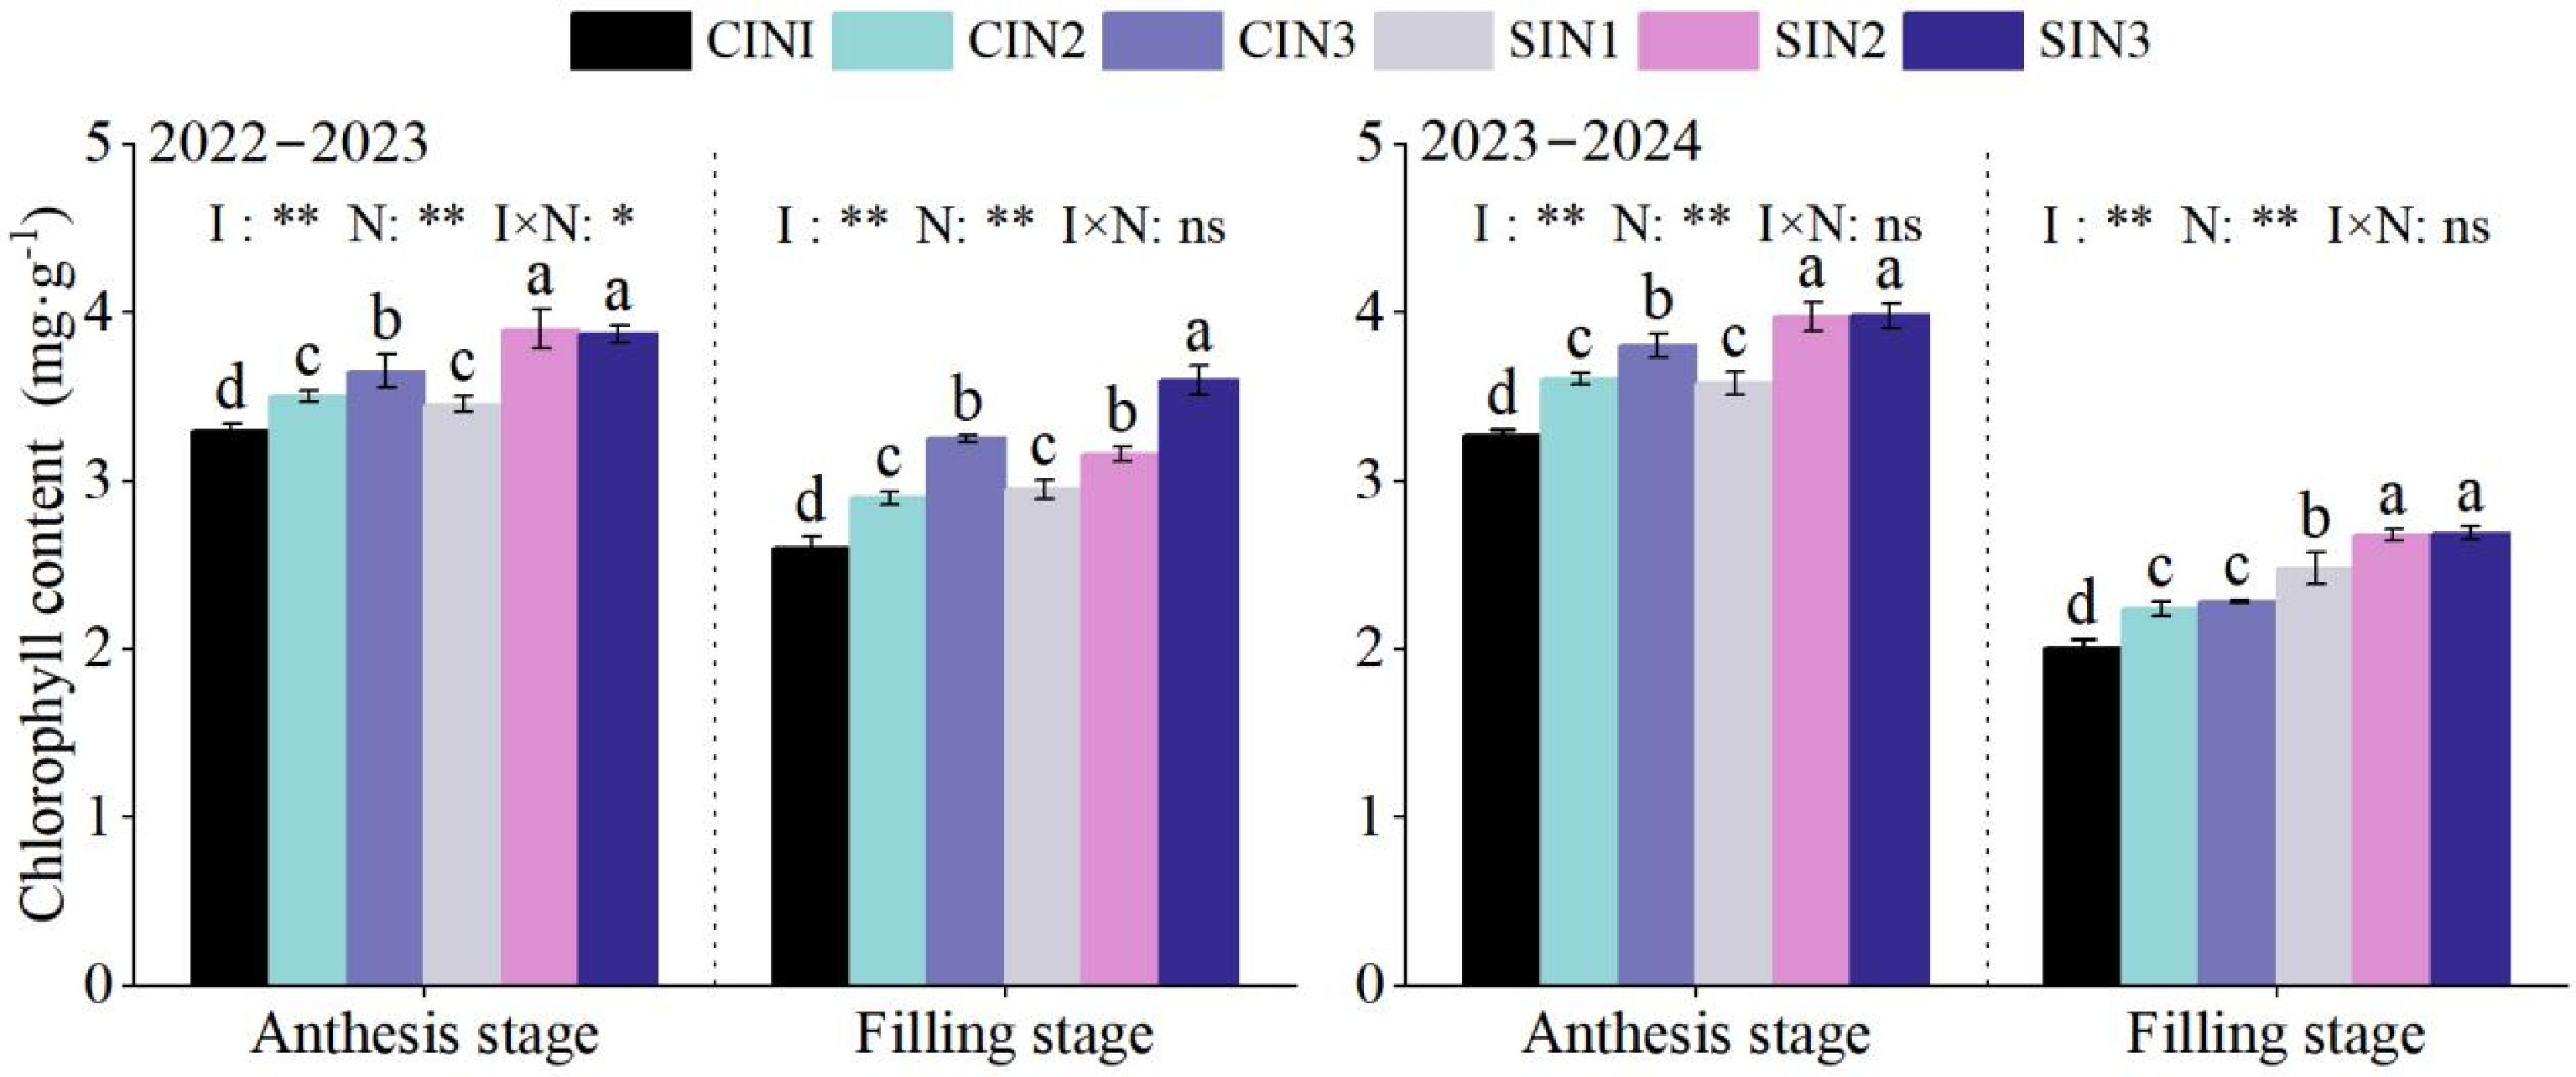
Figure 5.
Flag leaf chlorophyll content at the anthesis stage and filling stage (20 d after anthesis) for different treatments during the 2022–2023 and 2023–2024 growing seasons. Note: CI, conventional flood irrigation; SI, micro-sprinkler irrigation; N1, N2, and N3 represent topdressing nitrogen with 45 kg·ha−1, 90 kg·ha−1, and 135 kg·ha−1 respectively. Various letters stand for significant differences at p < 0.05 (n = 3). Various letters stand for significant differences at p < 0.05, and the vertical bars indicate the standard deviation (n = 3). I indicates the irrigation methods, N indicates the nitrogen application levels, and I × N indicates the interaction. * and ** represent the significant difference at the 0.05 and 0.01 levels, respectively, ns represents that the difference is not significant.
-
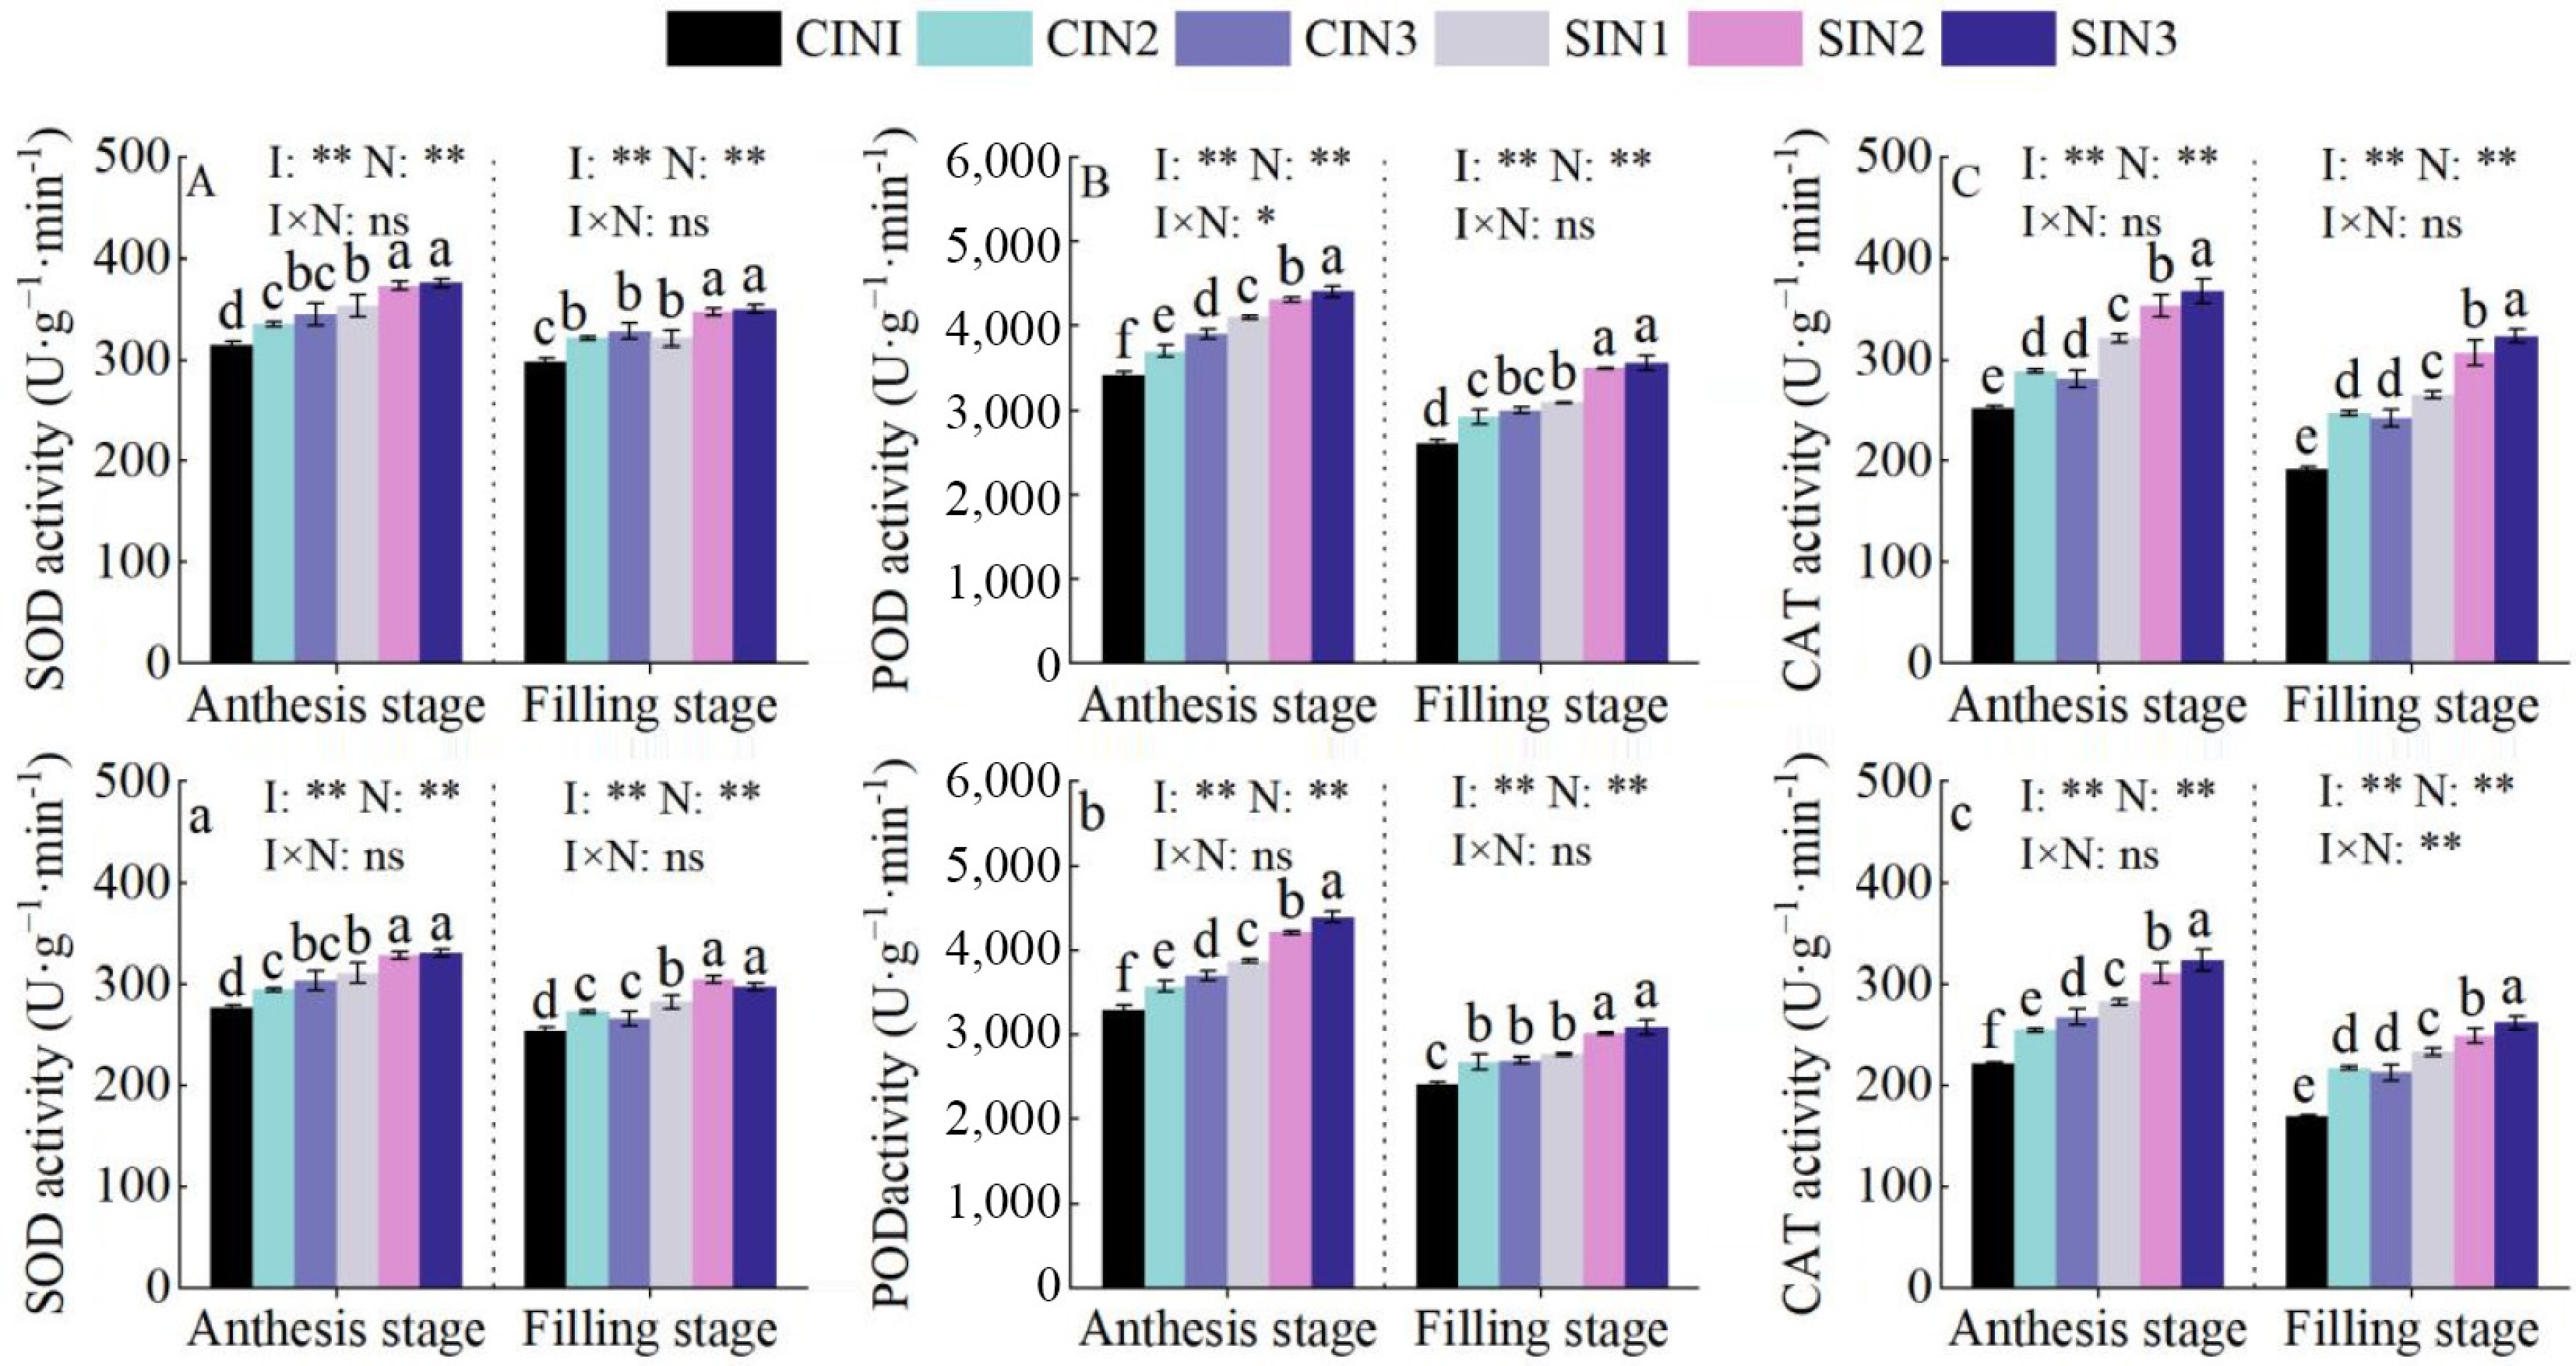
Figure 6.
Flag leaf antioxidase activity at the anthesis stage and filling stage (20 d after anthesis) for different treatments during the 2022–2023 and 2023–2024 growing seasons. Note: CI, conventional flood irrigation; SI, micro-sprinkler irrigation; N1, N2, and N3 represent topdressing nitrogen with 45 kg·ha−1, 90 kg·ha−1, and 135 kg·ha−1 respectively. Various letters stand for significant differences at p < 0.05, and the vertical bars indicate the standard deviation (n = 3). I indicates the irrigation methods, N indicates the nitrogen application levels, and I × N indicates the interaction. * and ** represent the significant difference at the 0.05 and 0.01 levels, respectively, ns represents that the difference is not significant.
-
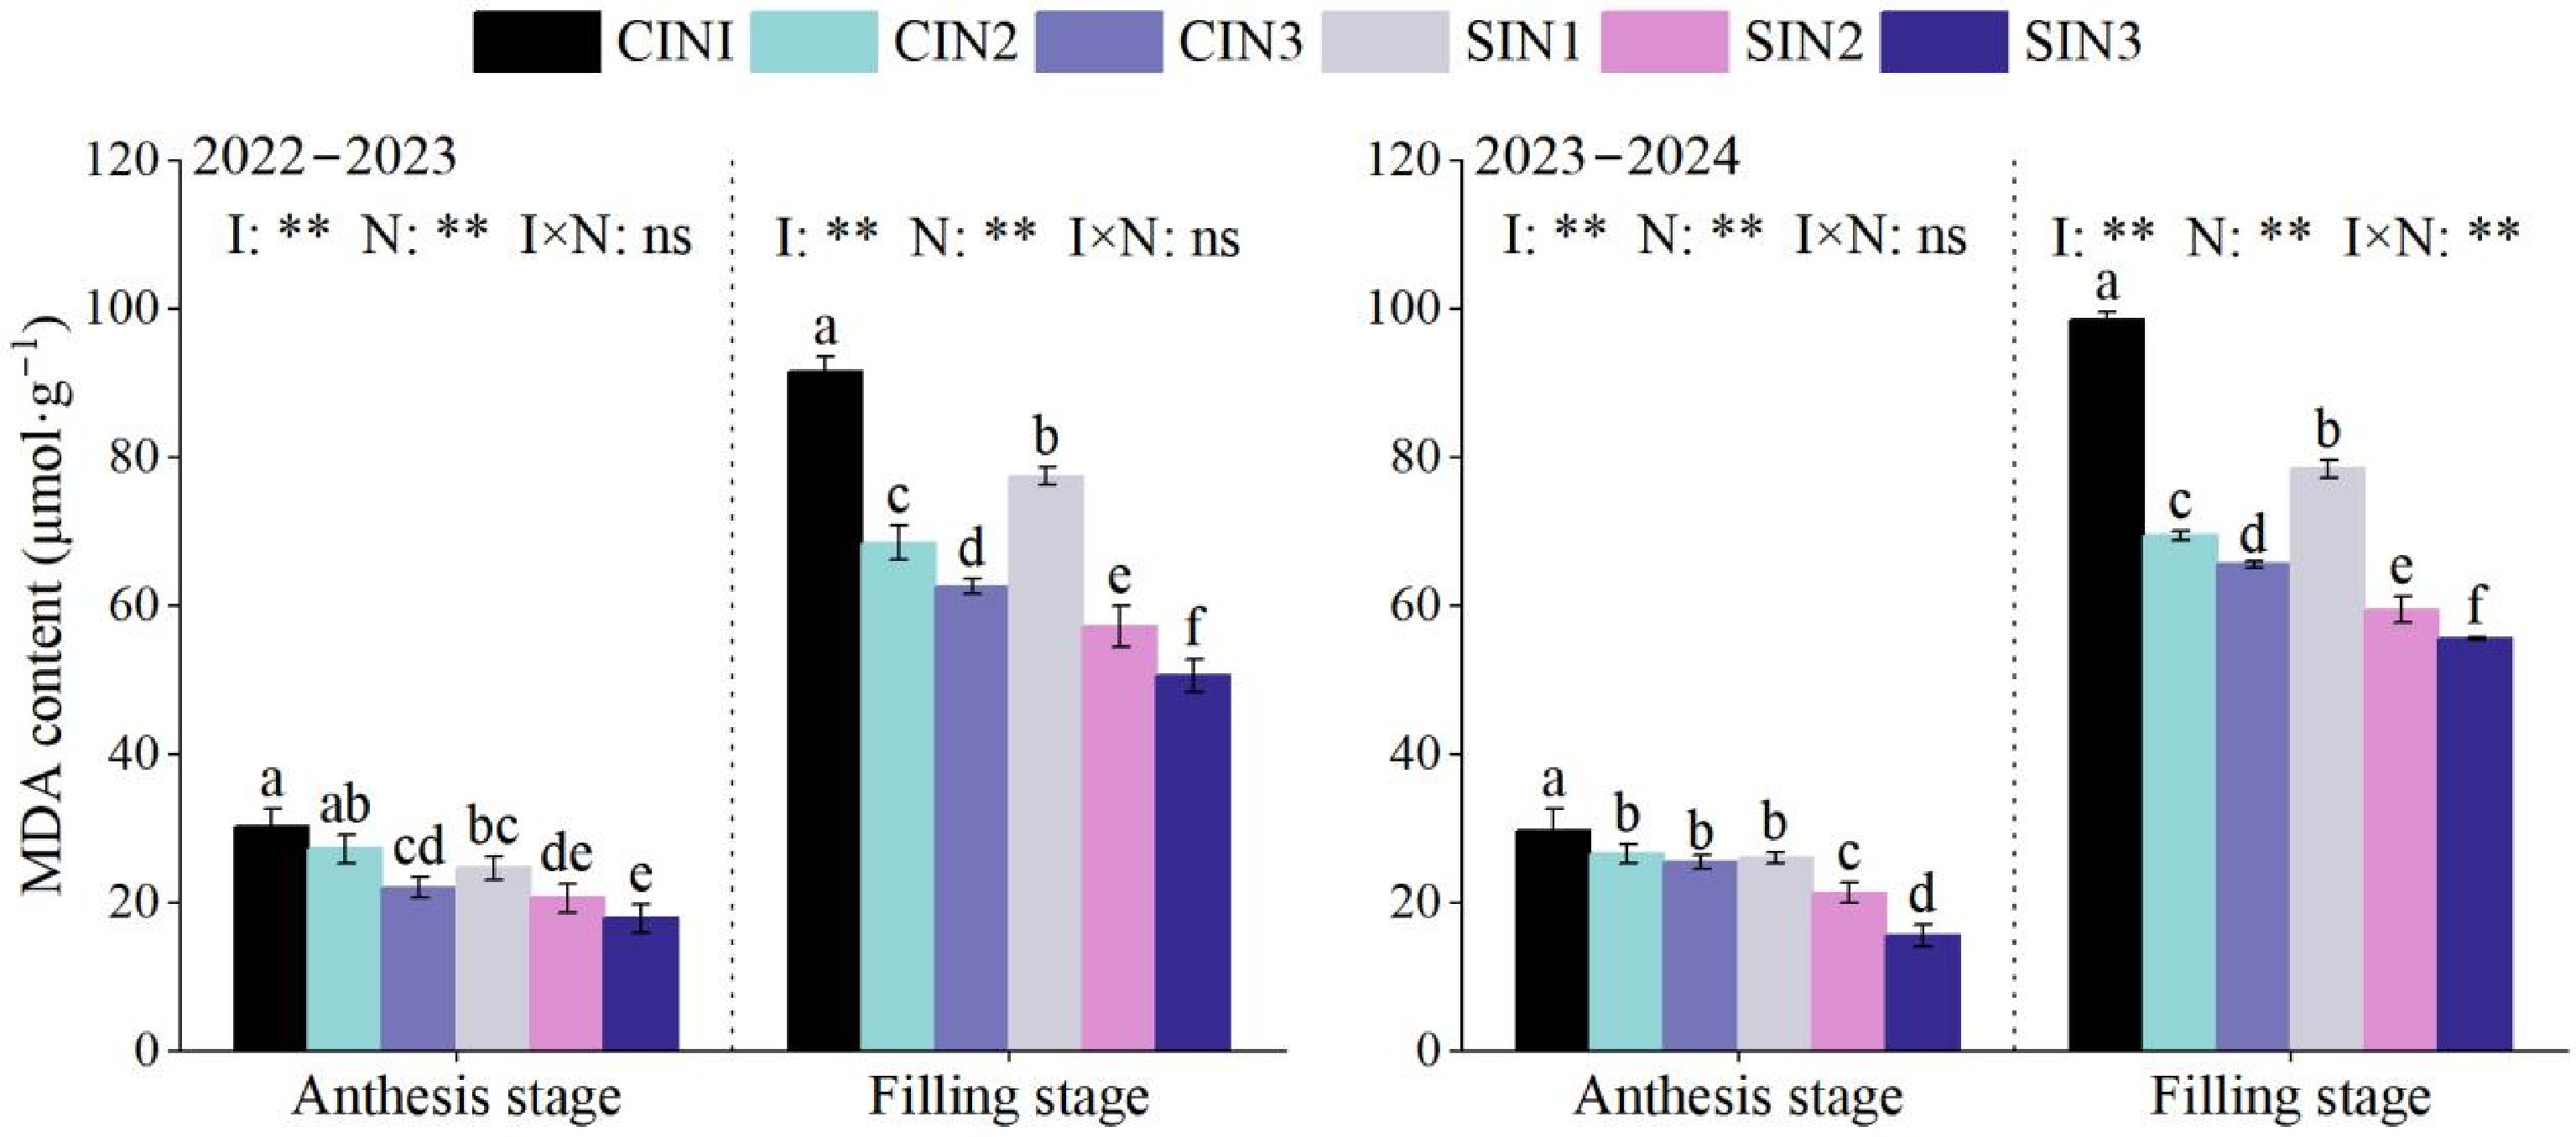
Figure 7.
Flag leaf MDA content at the anthesis stage and filling stage (20 d after anthesis) for different treatments during the 2022–2023 and 2023–2024 growing seasons. Note: CI, conventional flood irrigation; SI, micro-sprinkler irrigation; N1, N2, and N3 represent topdressing nitrogen with 45 kg·ha−1, 90 kg·ha−1, and 135 kg·ha−1 respectively. Various letters stand for significant differences at p < 0.05 (n = 3). Various letters stand for significant differences at p < 0.05, and the vertical bars indicate the standard deviation (n = 3). I indicates the irrigation methods, N indicates the nitrogen application levels, and I × N indicates the interaction. ** represents the significant difference at the 0.01 level, ns represents that the difference is not significant.
-
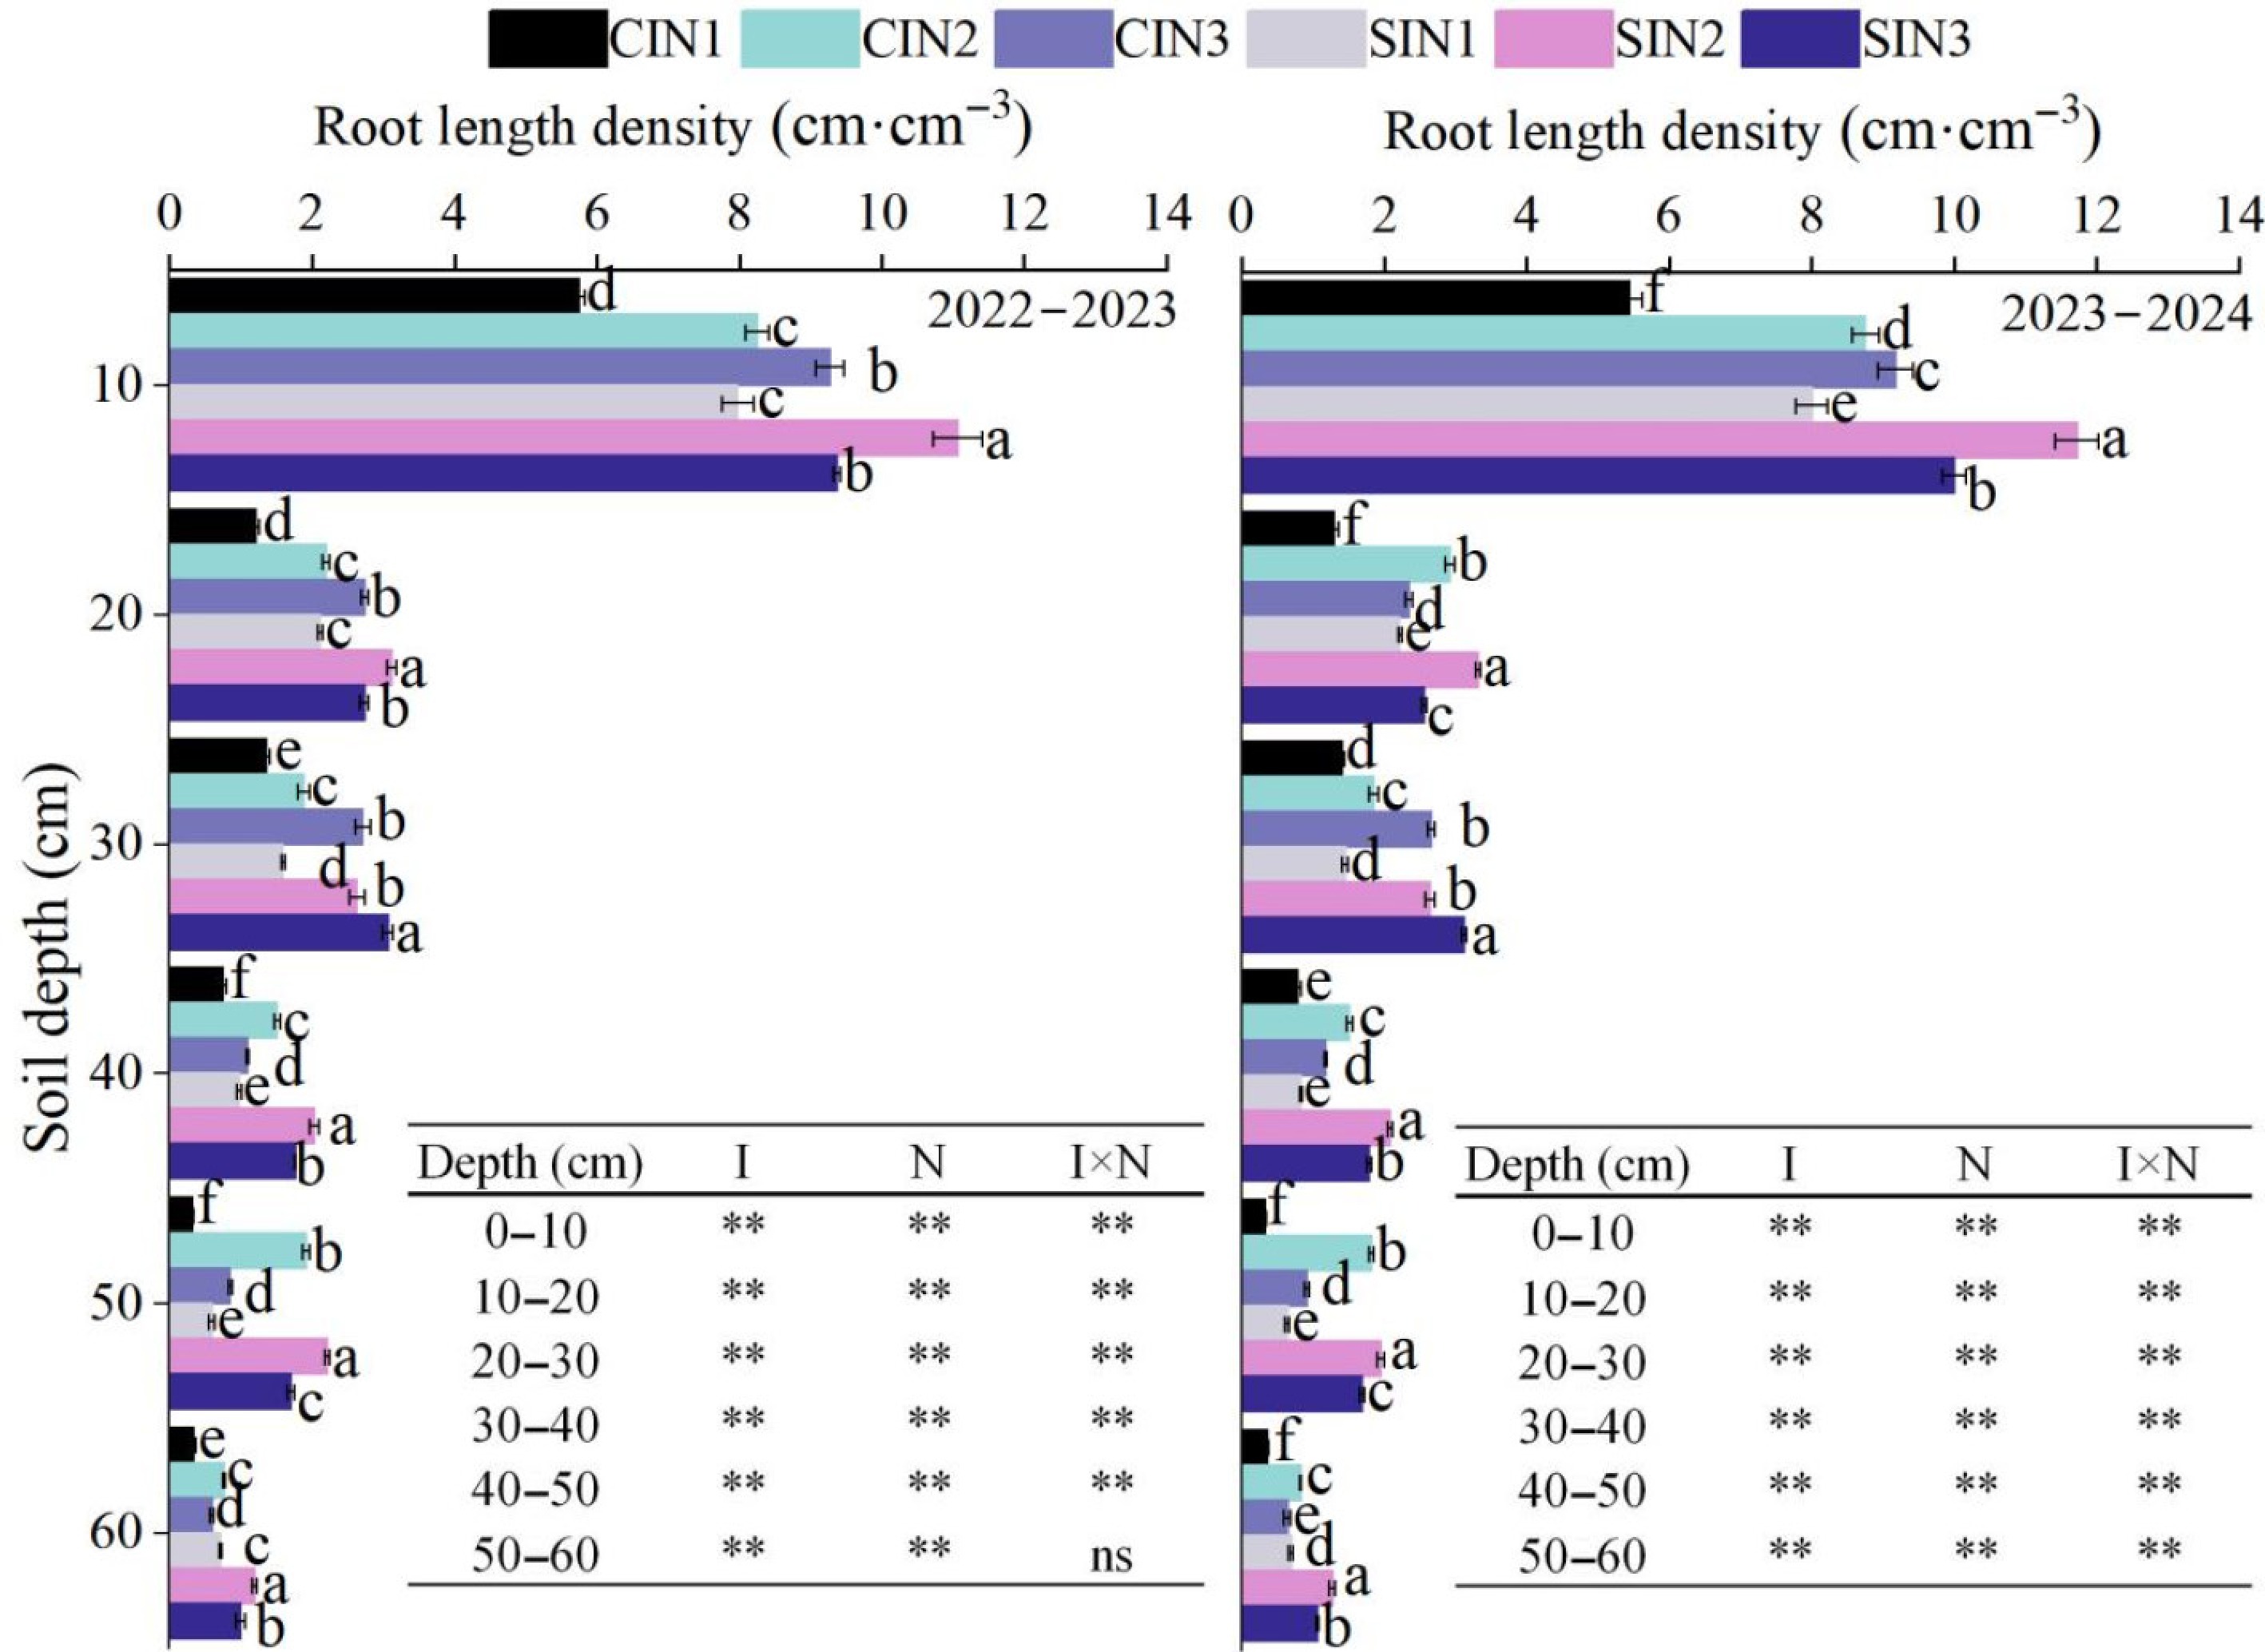
Figure 8.
Root length density in the 0-60 cm soil profile at the anthesis stage for different treatments during the 2022–2023 and 2023–2024 growing seasons. Note: CI, conventional flood irrigation; SI, micro-sprinkler irrigation; N1, N2, and N3 represent topdressing nitrogen with 45 kg·ha−1, 90 kg·ha−1, and 135 kg·ha−1 respectively. Various letters stand for significant differences at p < 0.05 (n = 3). Various letters stand for significant differences at p < 0.05 and the horizontal bars indicate the standard deviation (n = 3). I indicates the irrigation methods, N indicates the nitrogen application levels, and I × N indicates the interaction. ** represents the significance at the 0.01 level, ns represents that the difference is not significant.
-
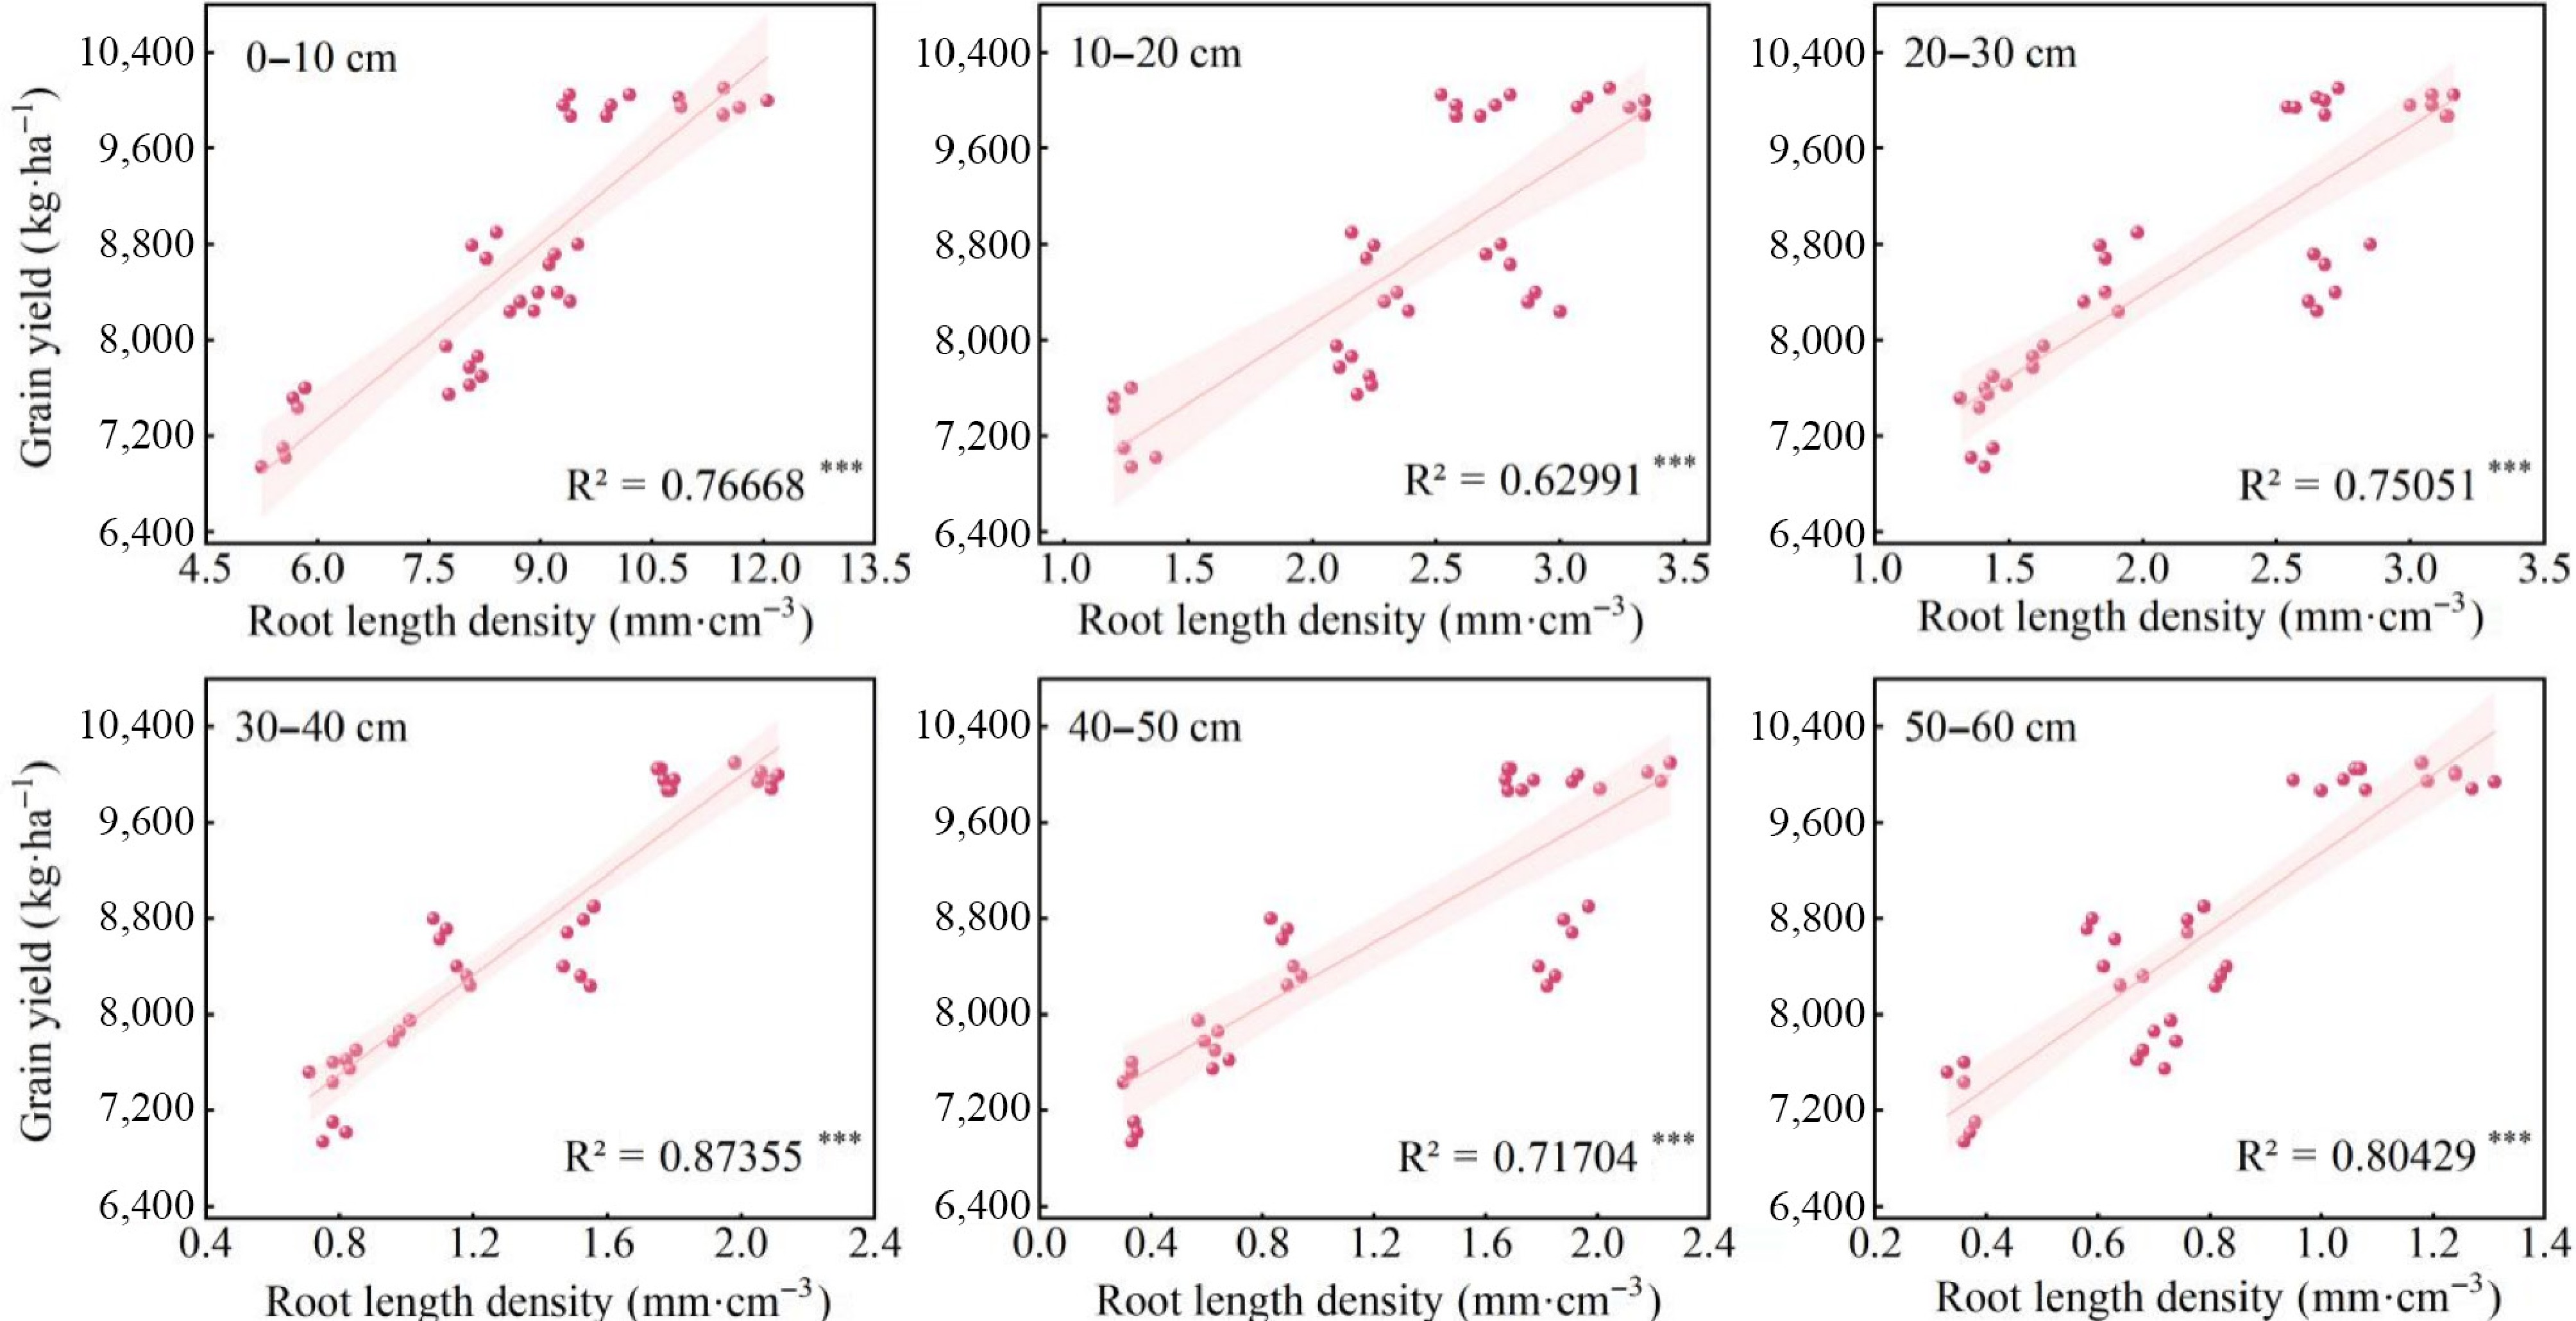
Figure 9.
Correlation of root length density under different soil layer with grain yield of winter wheat in this study. *** represents the significance at 0.001 level.
-
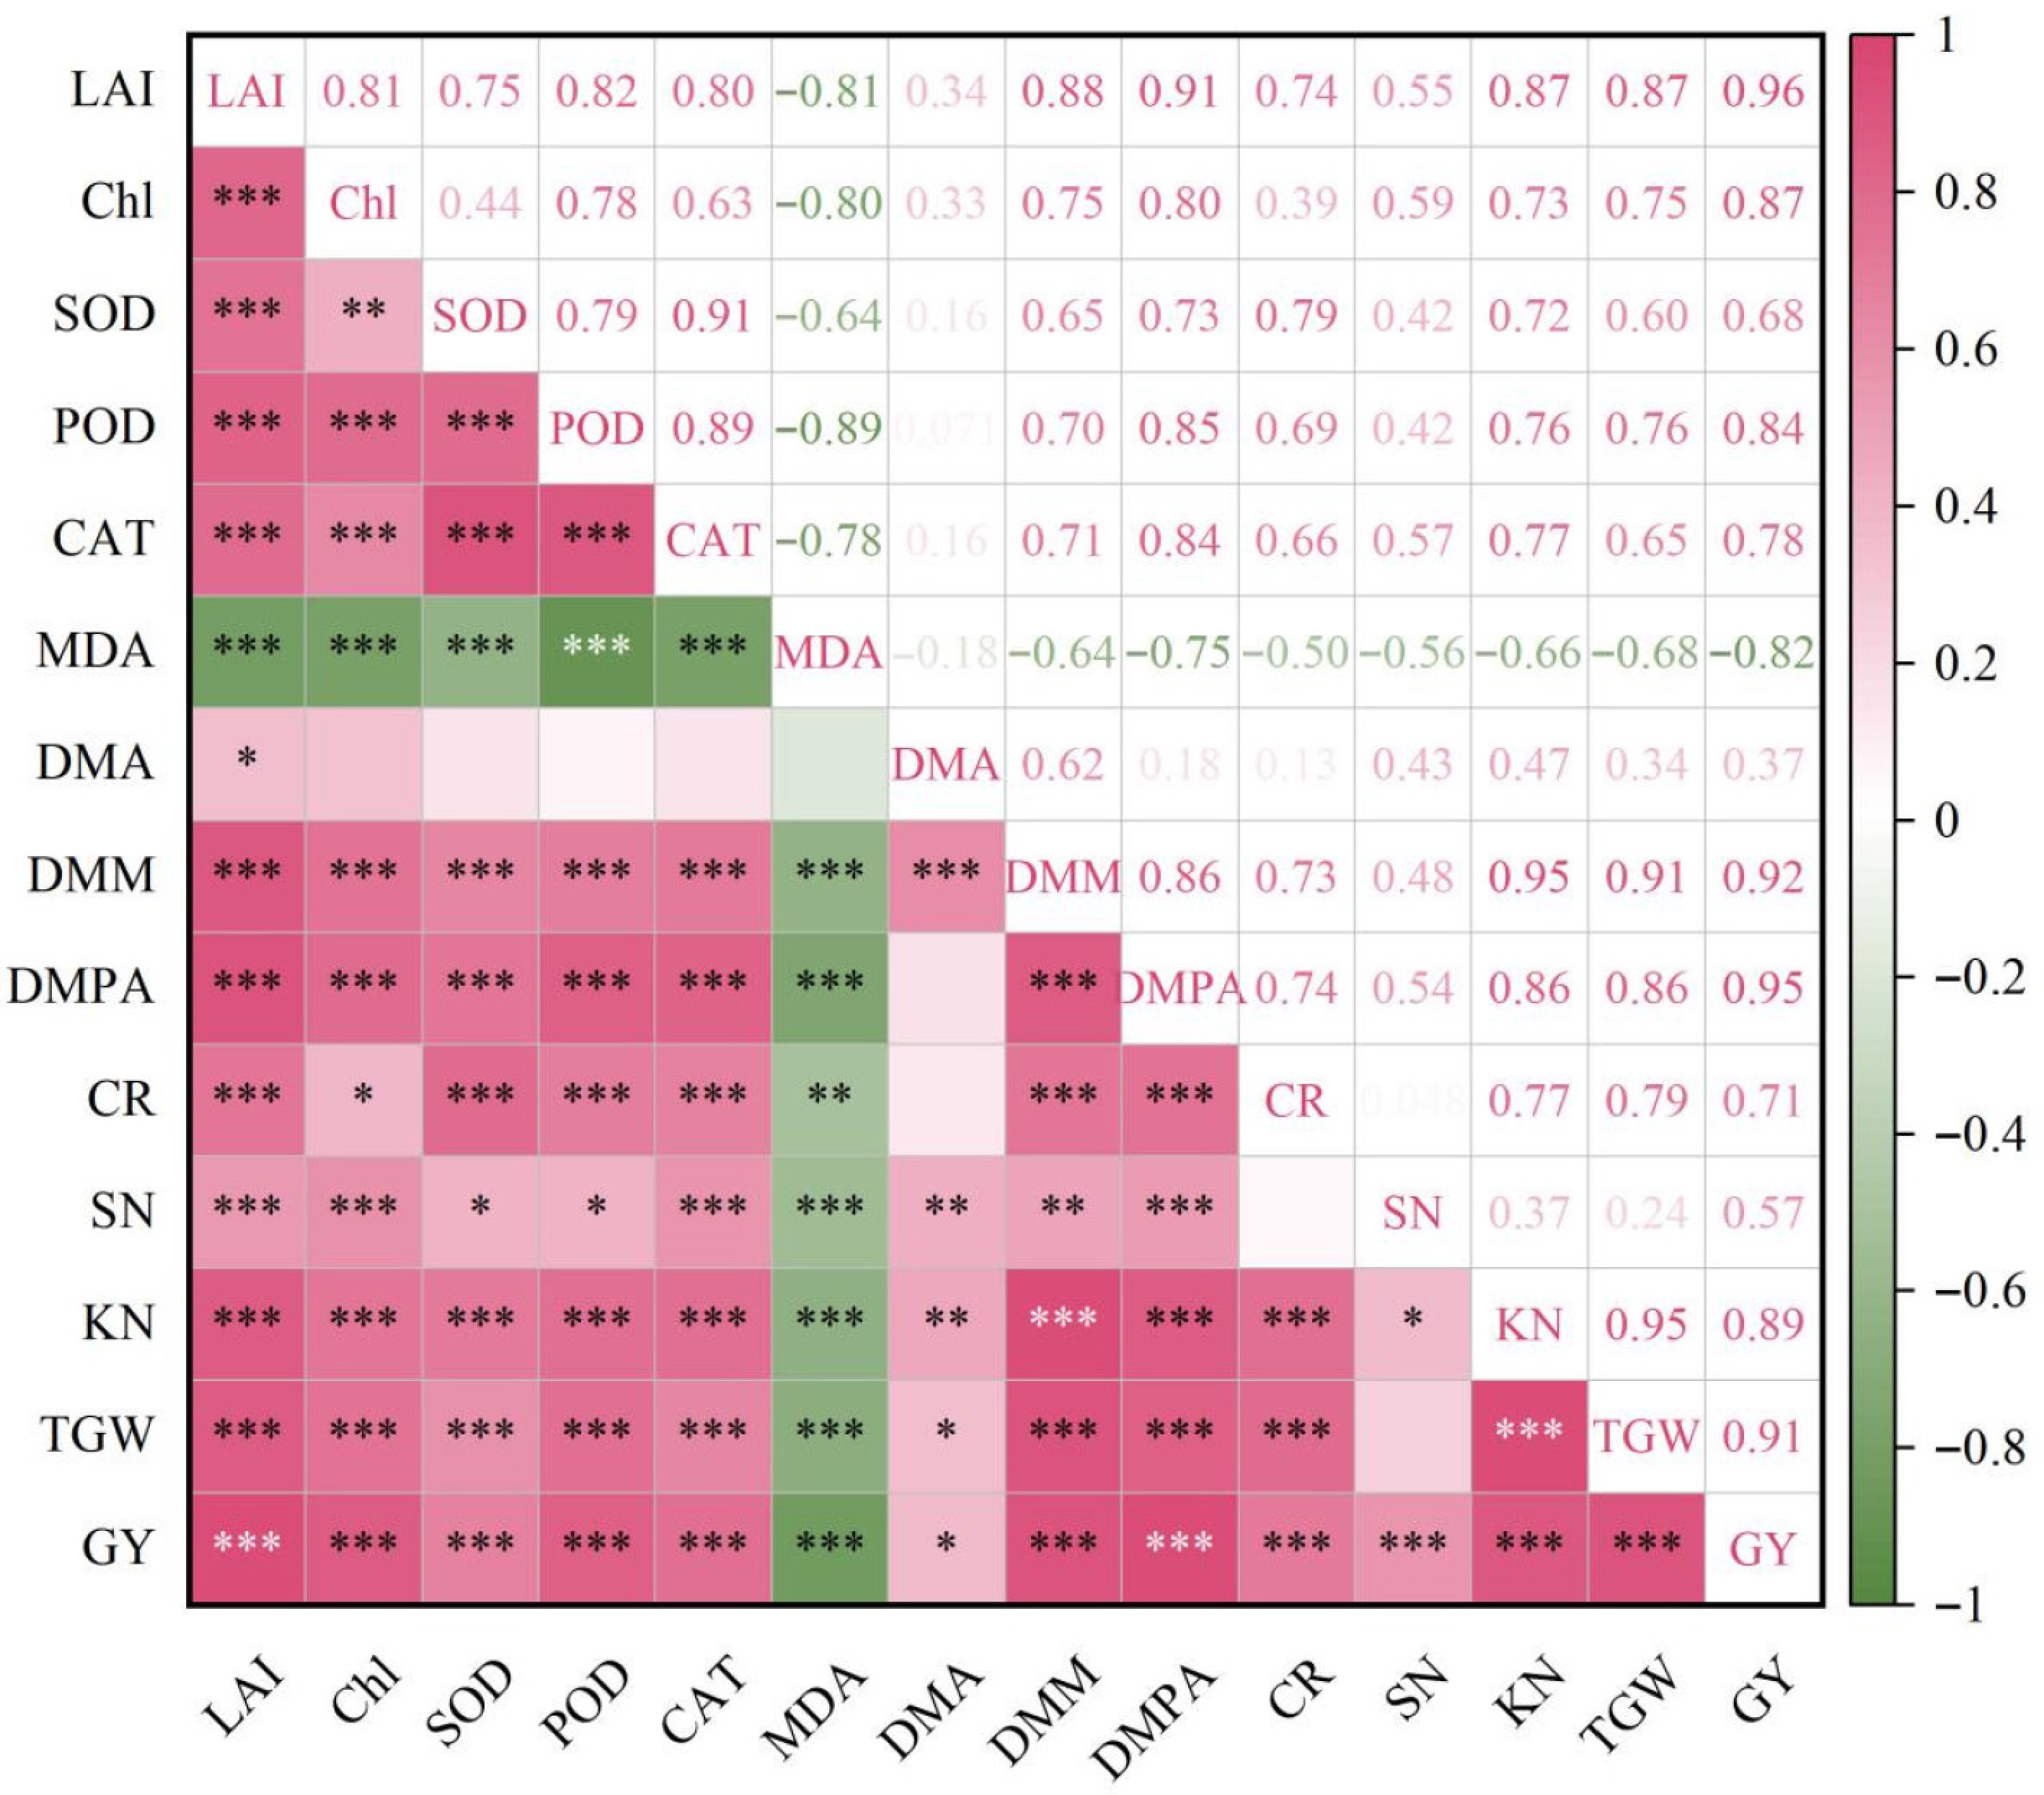
Figure 10.
Relationships between different parameters and grain yield in this study. Different colors indicate the intensity of the significant, and the closer to red (positive) or green (negative), the higher for the significant. * Represents the significance at the 0.05 level, ** represents the significance at the 0.01 level, and *** represents the significance at the 0.001 level, respectively.
-
Treatment Irrigation amount (mm) N application amount (kg·ha−1) Jointing stage Booting stage Total Base fertilizer Jointing stage Booting stage Total CIN1 60.0 / 60.0 112.5 45.0 / 157.5 CIN2 60.0 / 60.0 112.5 90.0 / 202.5 CIN3 60.0 / 60.0 112.5 135.0 / 247.5 SIN1 30.0 30.0 60.0 112.5 22.5 22.5 157.5 SIN2 30.0 30.0 60.0 112.5 45.0 45.0 202.5 SIN3 30.0 30.0 60.0 112.5 67.5 67.5 247.5 Table 1.
Irrigation and fertilization schedules in this study.
-
Treatment Dry matter accumulation in 2022–2023 Dry matter accumulation in 2023–2024 DMA (kg·ha−1) DMM (kg·ha−1) DMPA (kg·ha−1) CR (%) DMA (kg·ha−1) DMM (kg·ha−1) DMPA (kg·ha−1) CR (%) CIN1 11,646.52b 16,974.12d 5,327.60f 71.30c 11,533.30b 16,081.33c 4,548.03c 64.80c CIN2 11,944.90ab 18,582.00b 6,637.10c 75.51b 12,452.80a 18,503.30b 6,050.50b 67.69b CIN3 12,004.53ab 18,058.93bc 6,054.40d 72.60c 12,851.17a 18,384.93b 5,533.77b 66.38b SIN1 11,689.62b 17,475.42cd 5,785.80e 74.12bc 10,431.20c 16,404.80c 5,973.60c 68.11c SIN2 12,169.93a 20,067.83a 7,897.90a 78.83a 11,764.13b 19,185.27a 7,421.13a 74.54a SIN3 12,219.67a 19,513.67a 7,294.00b 75.82b 11,829.00b 18,971.77a 7,142.77a 76.67a ANOVA I ns ** ** ** ** ** ** ** N ** ** ** ** ** ** ** ** I×N ns ns ** ns ns ns ns * Note: CI, conventional flood irrigation; SI, micro-sprinkler irrigation; N1, N2, and N3 represent topdressing nitrogen with 45 kg·ha−1, 90 kg·ha−1, and 135 kg·ha−1 respectively. DMA, dry matter accumulation at anthesis stage. DMM, dry matter accumulation at maturity stage; DMPA, post-anthesis dry matter accumulation; CR, the contribution rate of dry matter accumulation post-anthesis to grain yield. Different lowercase letters within a column indicate significant differences at p ≤ 0.05. I indicates the irrigation methods, N indicates the nitrogen application levels, and I × N indicates the interaction. * and ** represent the significant difference at the 0.05 and 0.01 levels, respectively, ns represents that the difference is not significant. Table 2.
Effects of different treatments on the above-ground dry matter accumulation and the contribution ratio of dry matter accumulation post-anthesis to grain yield of winter wheat.
-
Treatment 2022–2023 2023–2024 GY (kg·ha−1) SN (× 104·ha−1) KN TGW (g) GY (kg·ha−1) SN (× 104·ha−1) KN TGW (g) CIN1 7,517.78 d 573.48 c 37.19 d 42.18 d 7,019.30 d 562.55 b 36.88 d 42.60 d CIN2 8,790.80 b 609.18 b 40.55 b 45.21 b 8,319.44 b 604.03 a 40.19 b 44.82 b CIN3 8,714.15 b 615.85 ab 40.43 b 45.17 b 8,321.11 b 602.70 a 40.15 b 44.31 b SIN1 7,861.71 c 579.68 c 39.19 c 43.58 c 7,623.81 c 564.22 b 38.51 c 43.48 c SIN2 10,022.73 a 625.88 a 43.48 a 47.72 a 9,940.51 a 607.11 a 41.34 a 47.49 a SIN3 9,958.53 a 627.19 a 42.91 a 47.19 a 9,960.48 a 605.22 a 41.16 a 47.20 a ANOVA I *** ** *** *** *** ns *** *** N *** *** *** *** *** *** *** *** I × N * ns ns ns *** ns ns *** Note: CI, conventional flood irrigation; SI, micro-sprinkler irrigation; N1, N2 and N3 represent topdressing nitrogen with 45 kg·ha−1, 90 kg·ha−1, and 135 kg·ha−1 respectively. GY, grain yield; SN, spike number; KN, kernel number per spike; TGW, thousand-grain weight. I indicates the irrigation methods, N indicates the nitrogen application levels, and I × N indicates the interaction. Different lowercase letters within a column indicate significant differences p ≤ 0.05 *, **, and *** indicate significant difference at p ≤ 0.05, ≤ 0.01, and ≤ 0.001, respectively, ns represents that the difference is not significant. Table 3.
Effects of different treatments on grain yield and yield components of winter wheat.
Figures
(10)
Tables
(3)