-
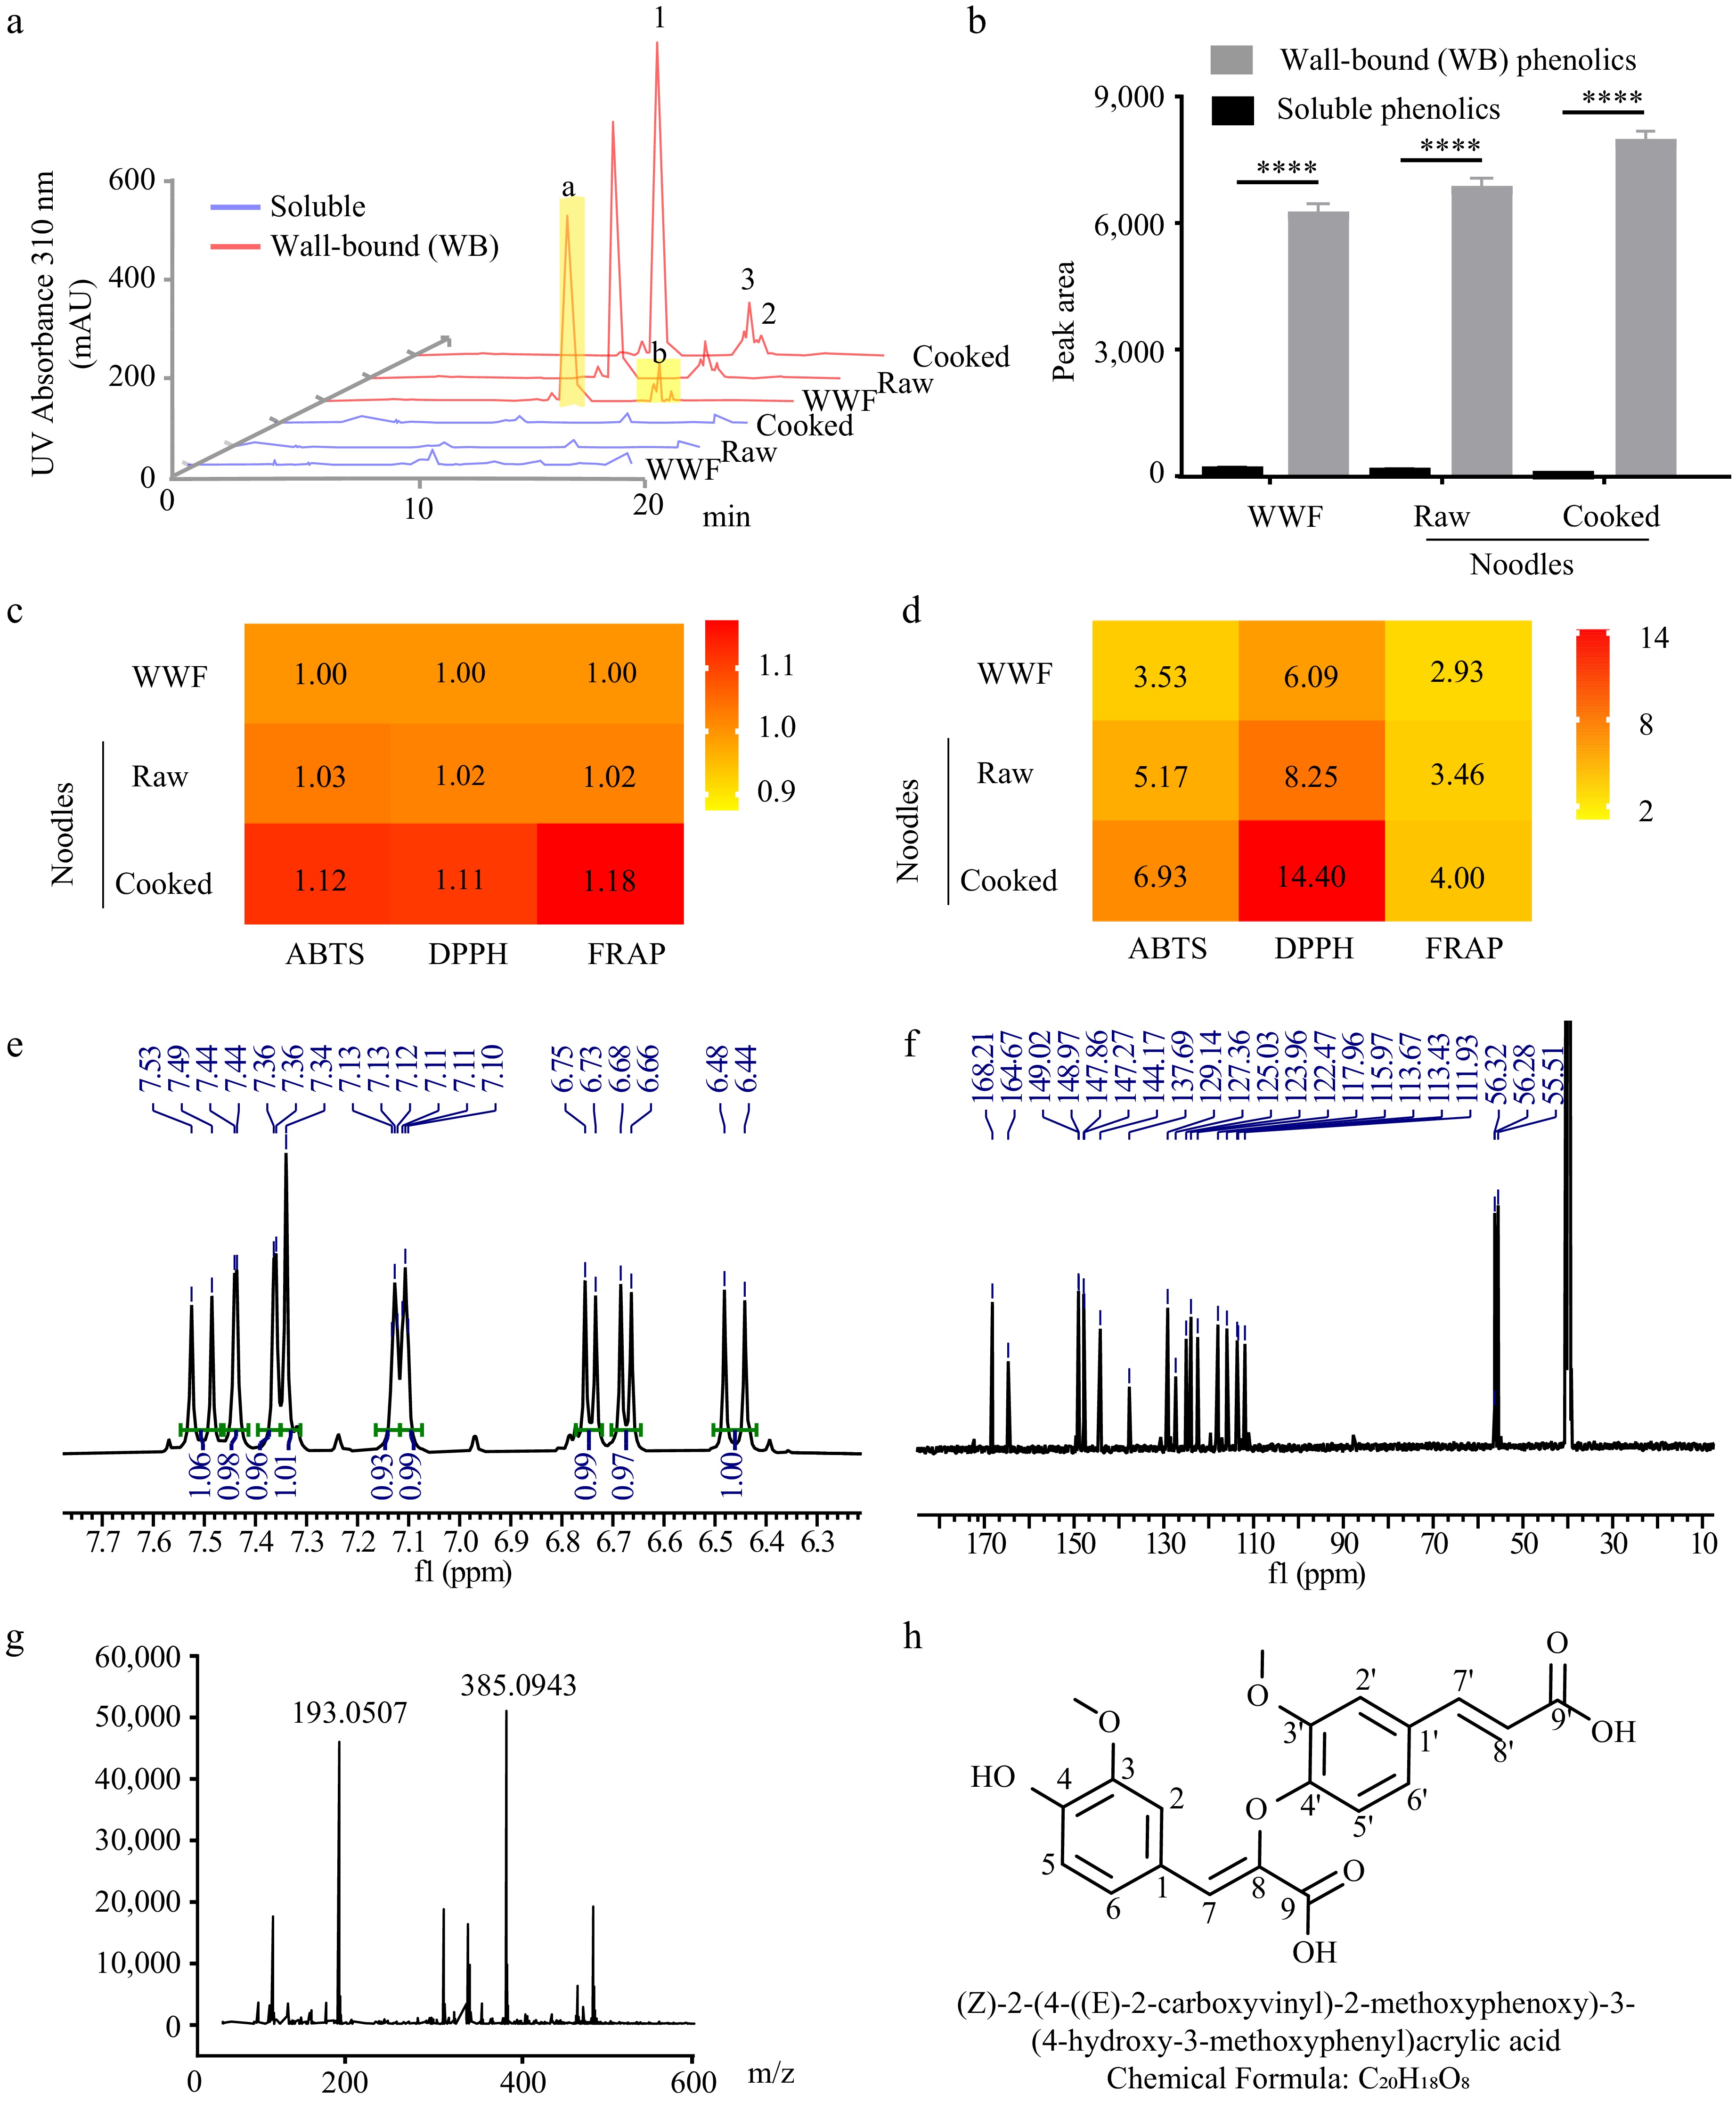
Figure 1.
The contents and antioxidant potentials of soluble and wall-bound (WB) phenolics in wheat foods. The (a) chromatographs, and (b) contents (n = 4) of phenolic compounds in the soluble and wall-bound phenolics of noodles made from the whole wheat flour (WWF) of Jimai22 (JM22, JM). Fraction a represented a phenolic monomer, and fraction b represented phenolic dimers. Peaks 1, 2, and 3 underwent purification and characterization processes. Raw, raw noodles. Cooked, cooked noodles. The antioxidant potentials of (c) soluble, and (d) wall-bound phenolics in various food forms were assessed using the ABTS, DPPH, and FRAP methods, respectively. Data represent the mean ± standard error. Unpaired student's t-test determined the p-value, * < 0.05, ** < 0.01, *** < 0.001, **** < 0.0001. NMR spectroscopy analyses of (e) hydrogen and (f) carbon spectra of Peak 3. The (g) mass spectrum, and (h) predicted structure of Peak 3 as the 8-O-4'-diferulic acid.
-
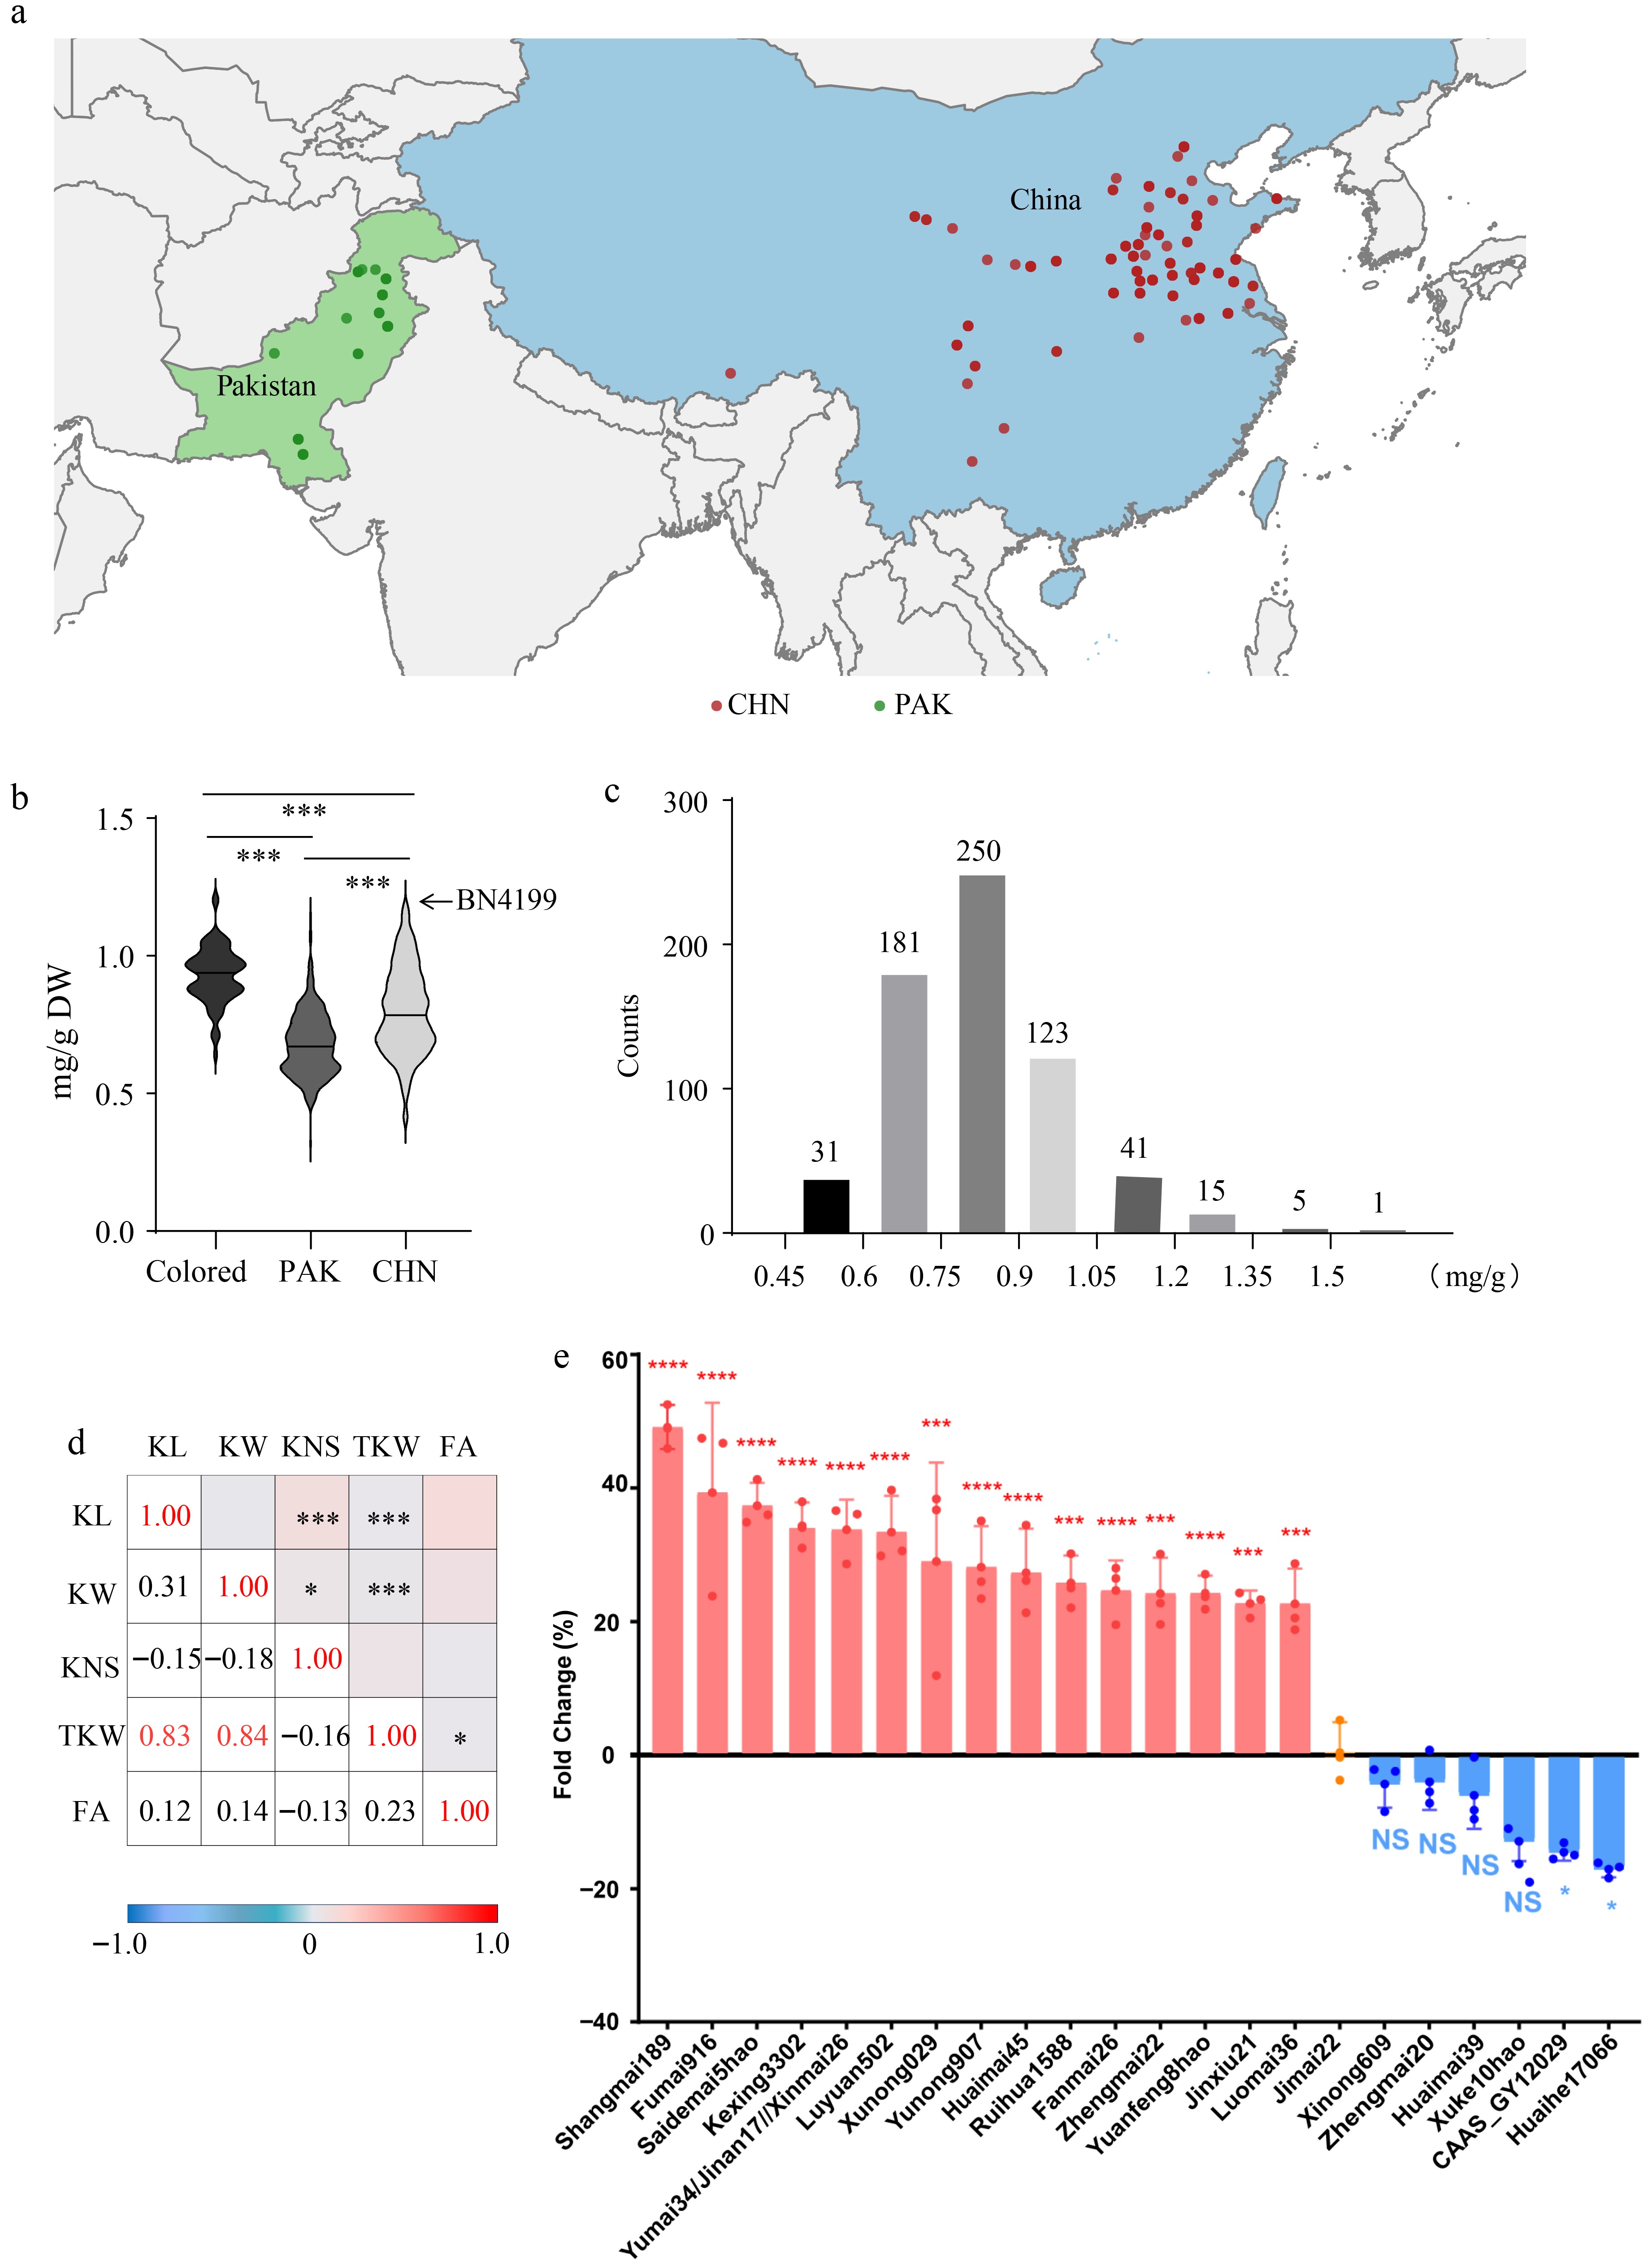
Figure 2.
Collection and screening of Pakistani and Chinese modern wheat germplasm with higher ferulic acid contents. (a) The distribution of breeding regions of the germplasms in the wheat population. PAK, Pakistani cultivars. CHN, Chinese cultivars. (b) The comparison of FA contents in wheat germplasms, including both colored and uncolored wheat cultivars from Pakistan and China. BN4199, Bainong4199. (c) The counts of germplasms with different FA contents in the wheat population. (d) The correlation of FA contents with agronomic traits in the wheat population. KL, kernel length. KW, kernel width. KNS, kernel number per spike. TKW, 1,000 kernel weight. FA, ferulic acid content. (e) The FA contents in some selected high-ferulic acid (HFA) or low-ferulic acid (LFA) cultivars. n = 3.
-
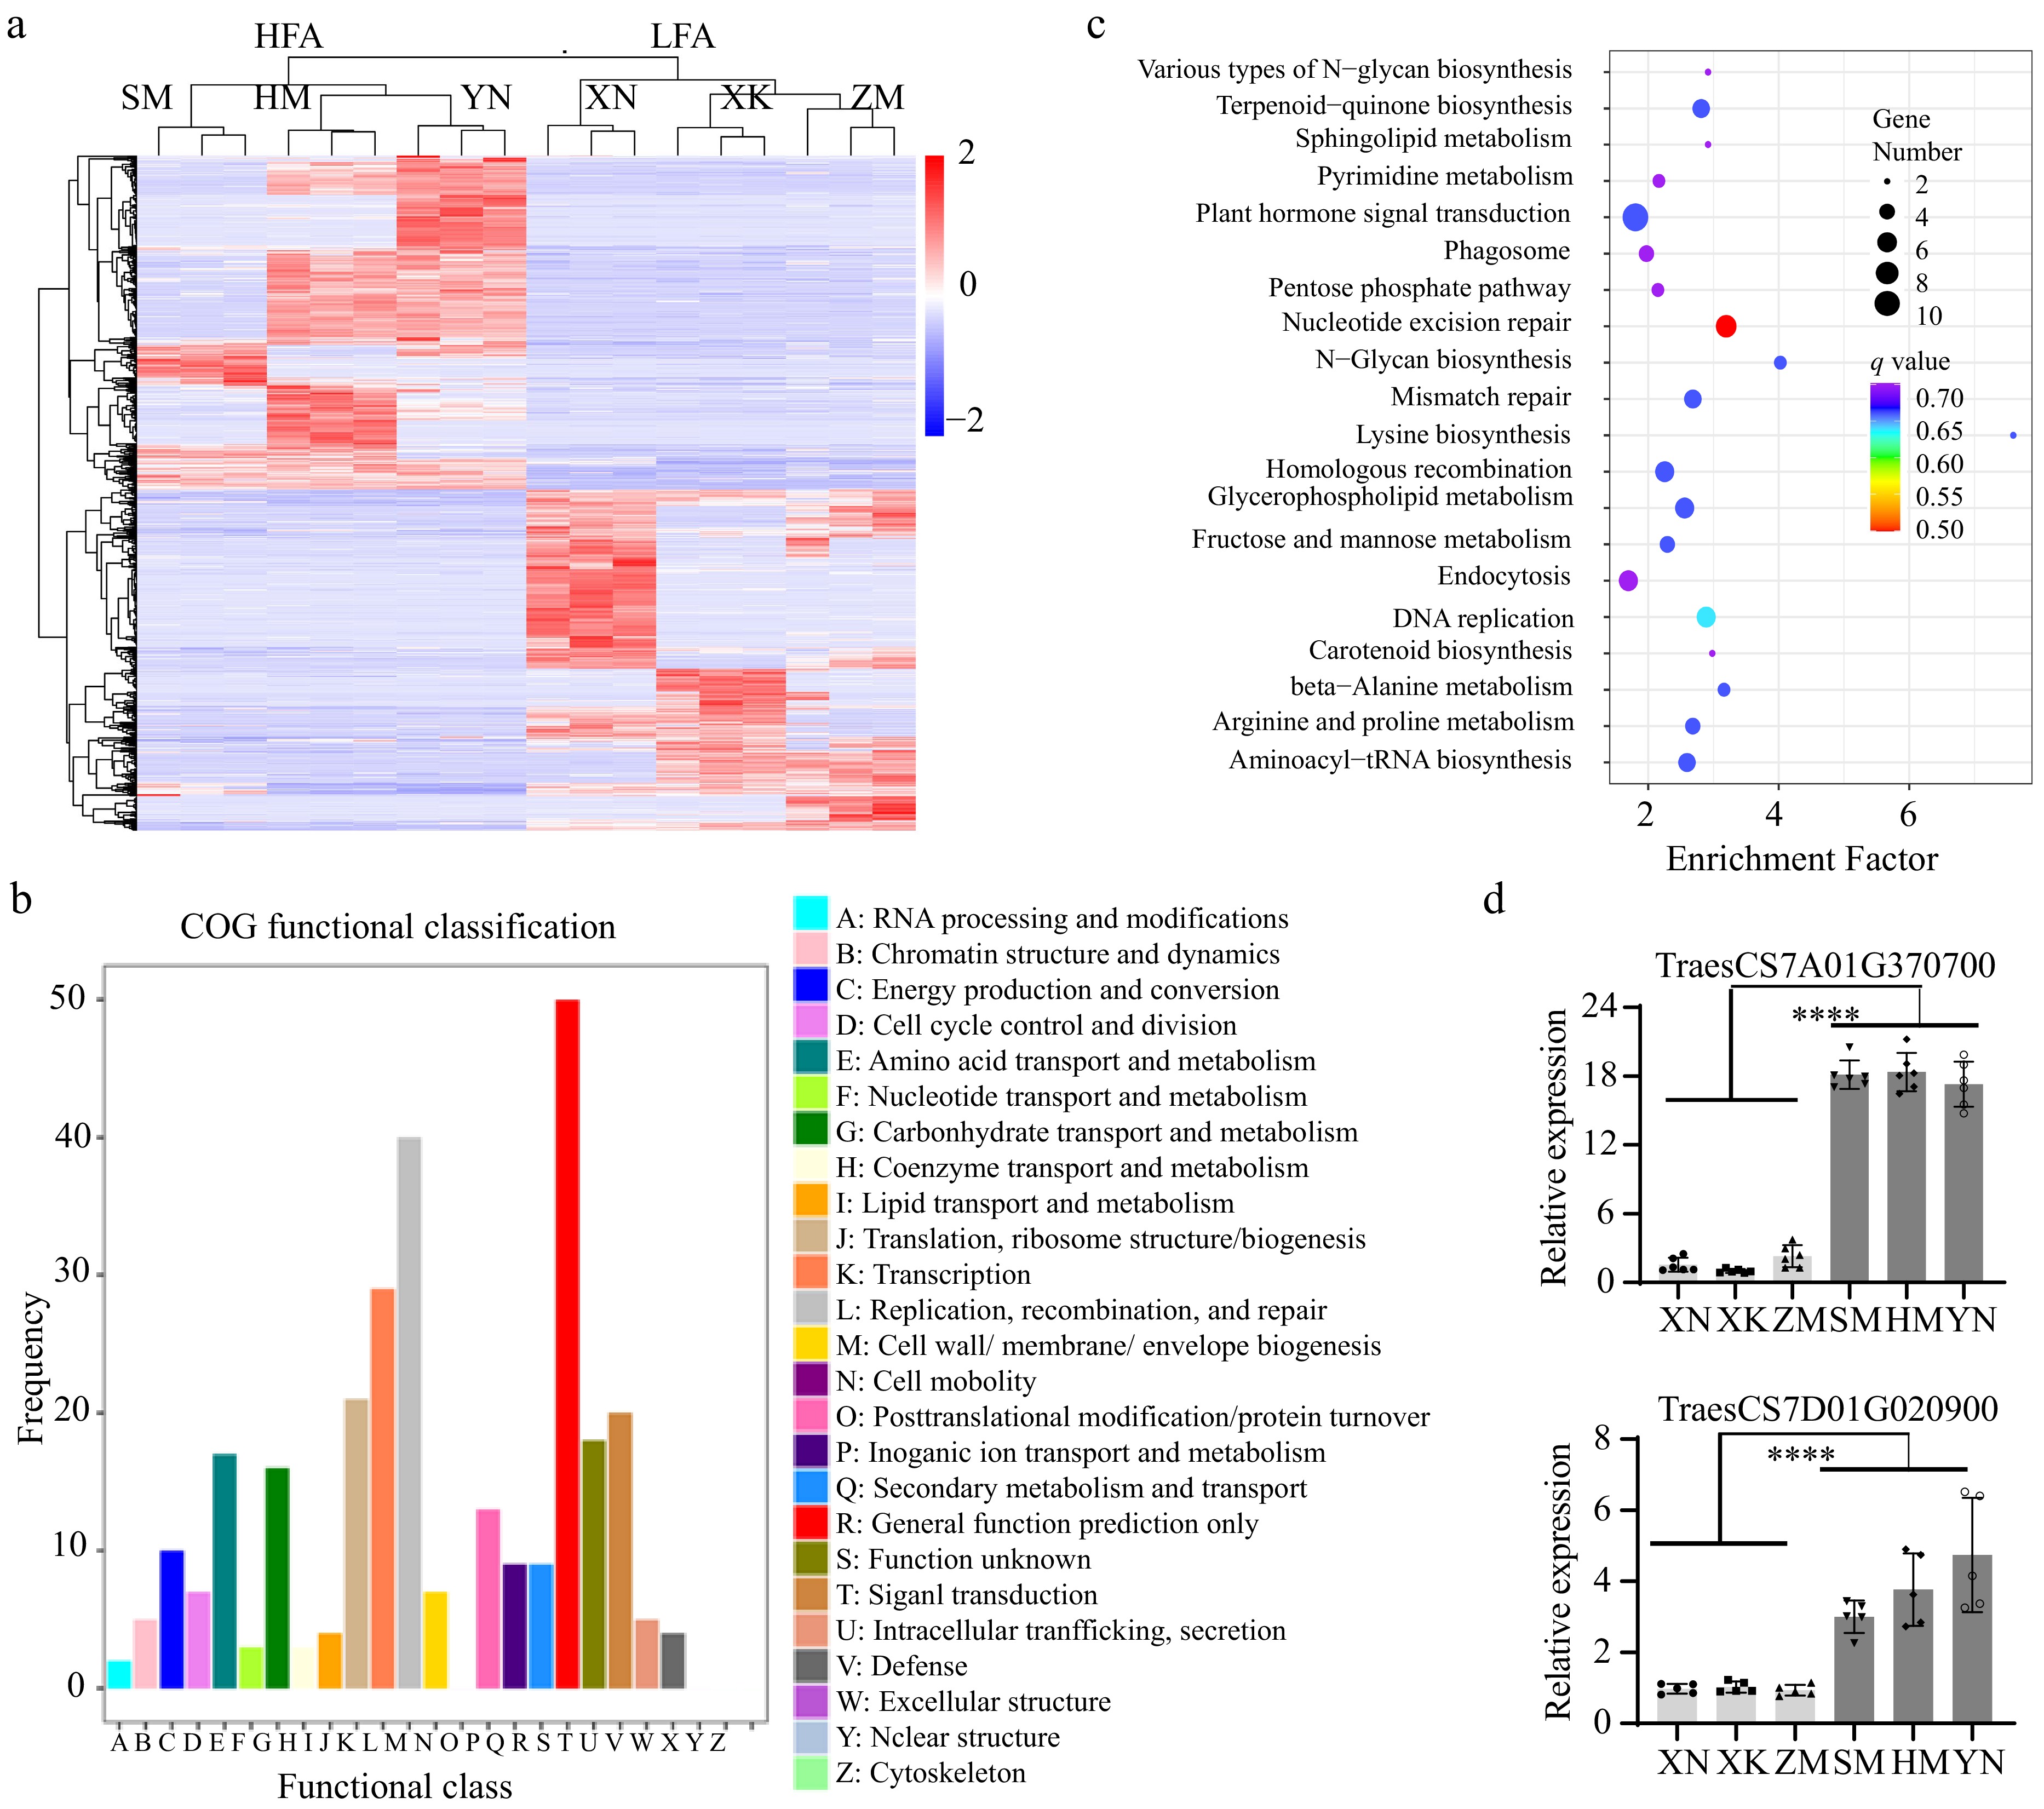
Figure 3.
The transcriptomes of developing grains in HFA and LFA. (a) The heat map shows differentially expressed genes (DEGs) during the grain-filling stage in HFA and LFA cultivars. (b) The Clusters of Orthologous Groups (COG) of proteins encoded by the DEGs. (c) The Kyoto Encyclopedia of Genes and Genomes (KEGG) metabolism pathway analysis of DEGs. (d) The RT-qPCR analyses of the annotated HXXXD-type acyltransferase genes in the grain-filling stage of HFA or LFA varieties. n = 6.
-
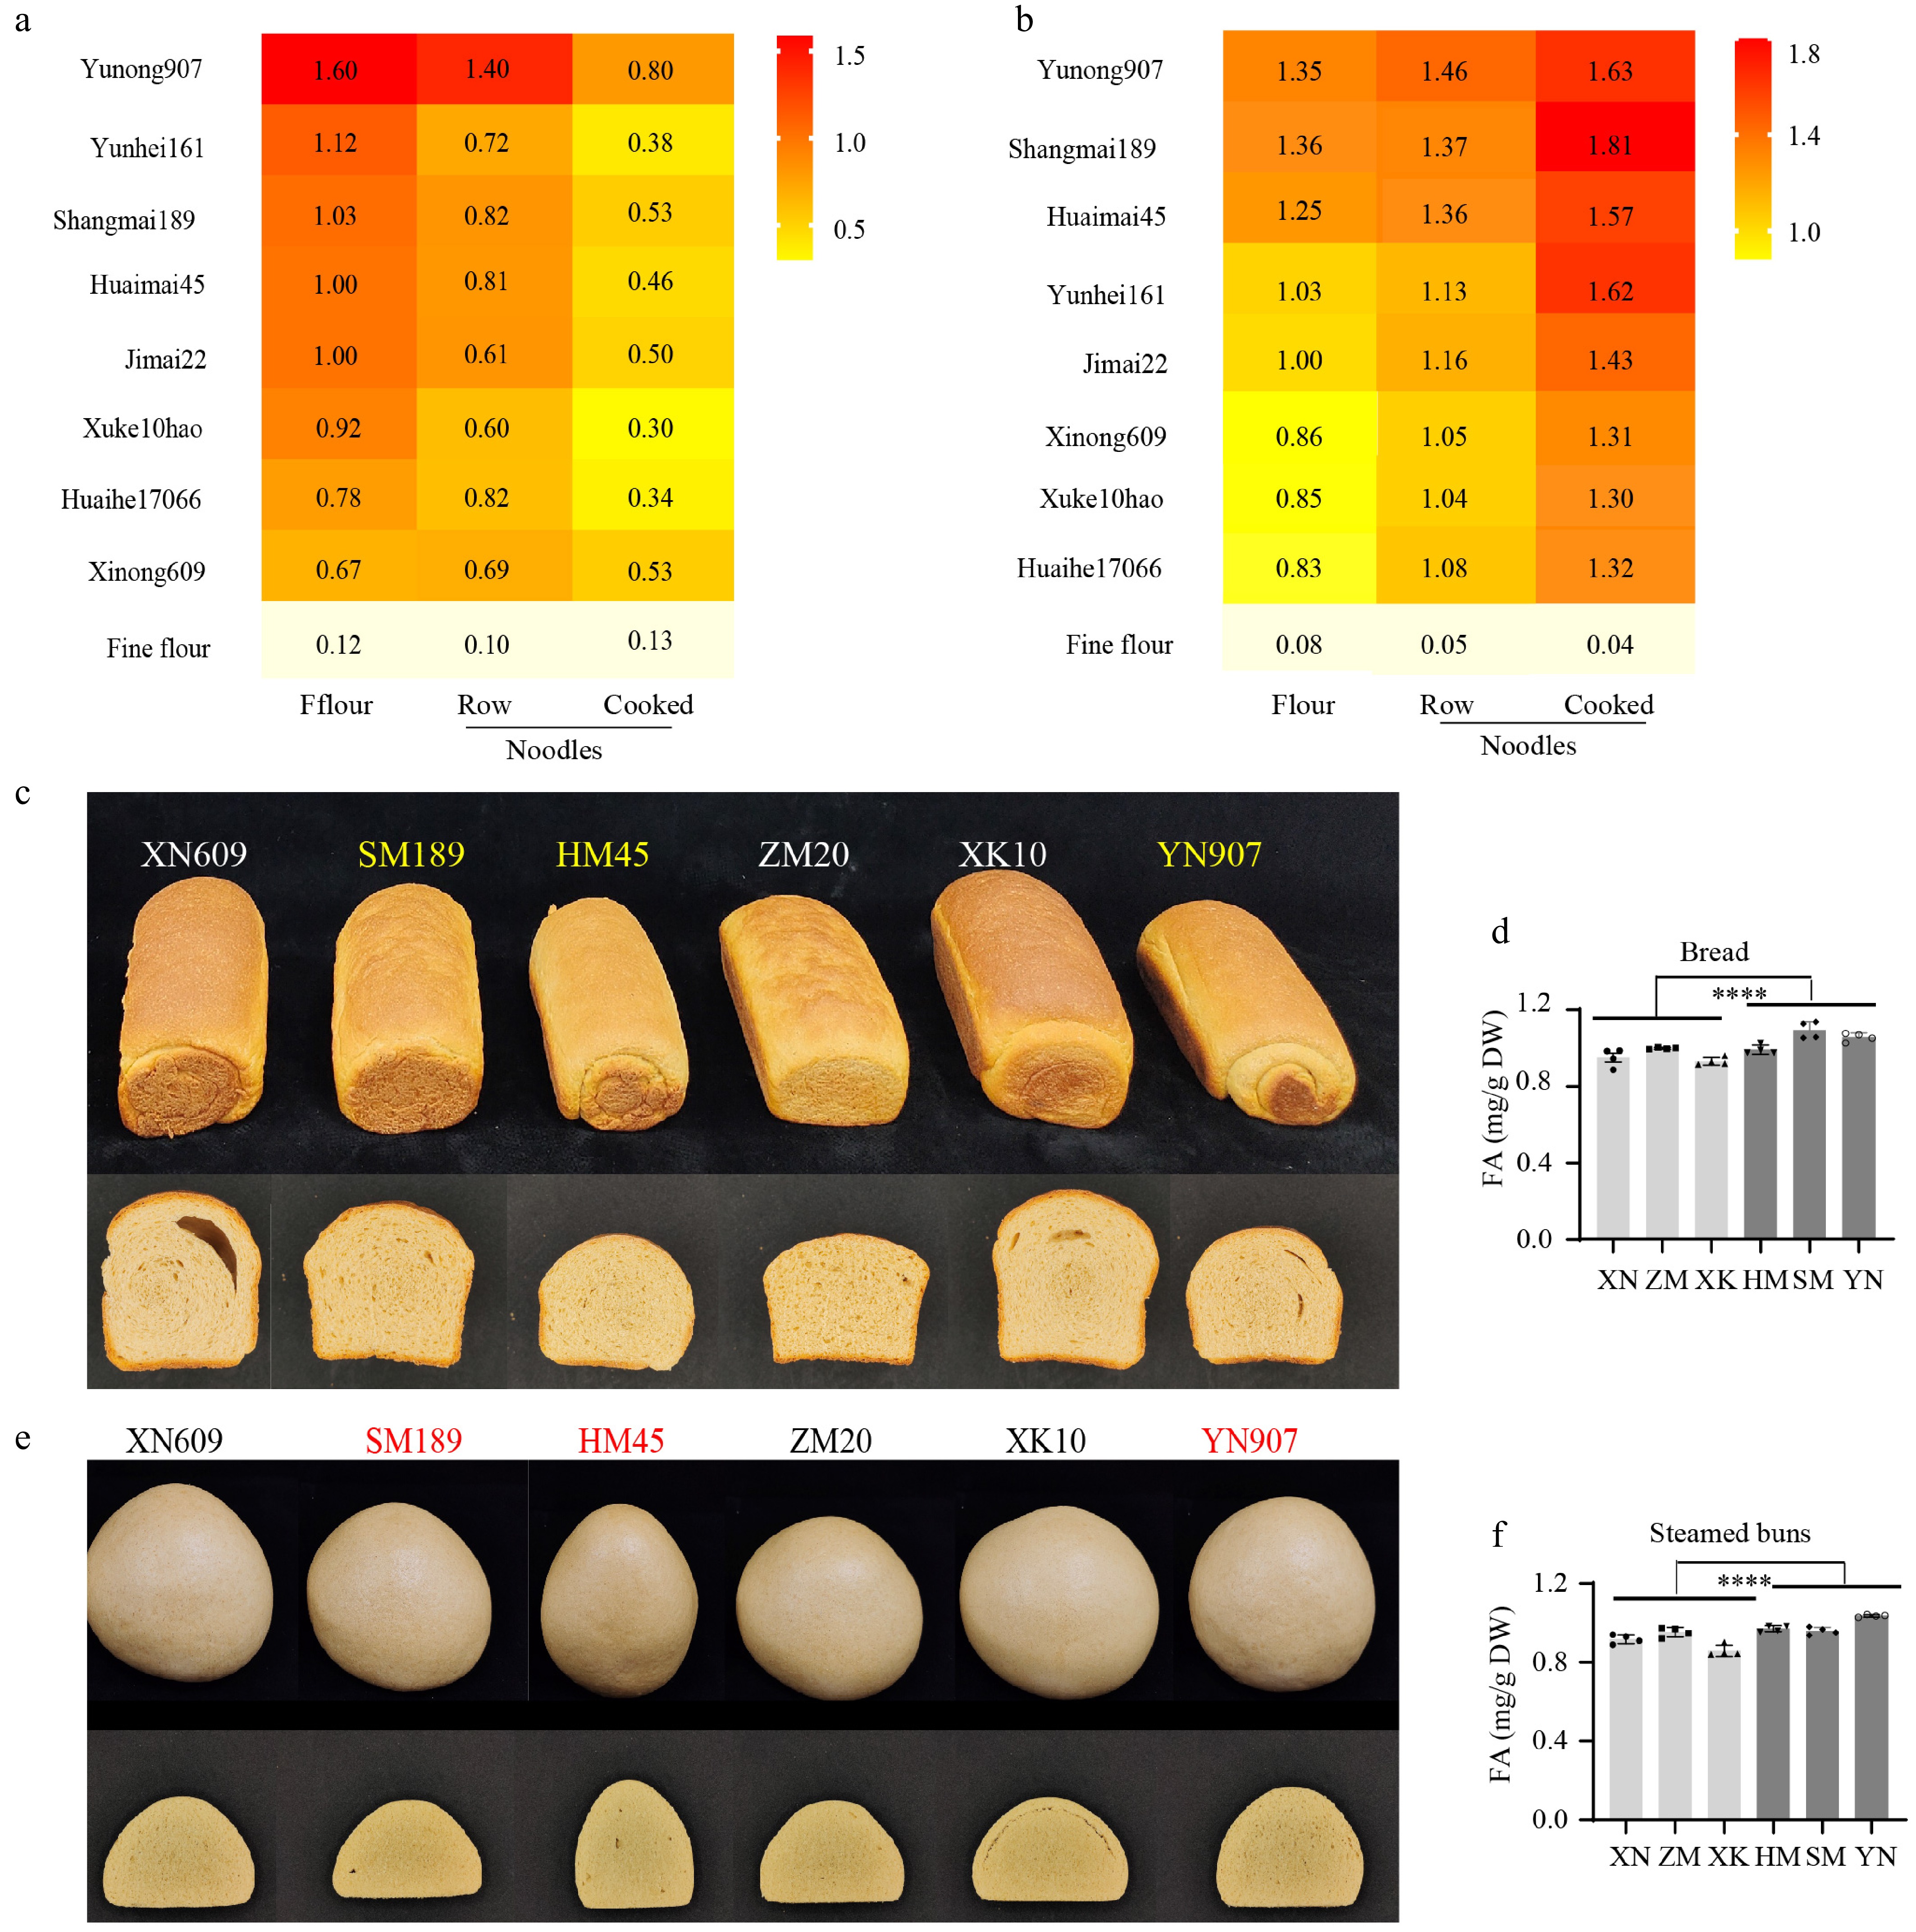
Figure 4.
Changes in FA content during food processing. The (a) soluble, and (b) wall-bound (WB) phenolic compounds in different forms of foods made from HFA, LFA, black wheat (Yunhei161), JM22, and refined flour. Raw, raw noodles. Cooked, cooked noodles. (c) The exterior (up) and interior (bottom) views of bread made from HFA or LFA cultivars. (d) The change of FA contents during the bread baking of HFA or LFA varieties. (e) The exterior (up) and interior (bottom) views of steamed buns made from HFA or LFA varieties. (f) The change in FA contents during the processing of steamed buns made with whole wheat flours of HFA or LFA cultivars.
-
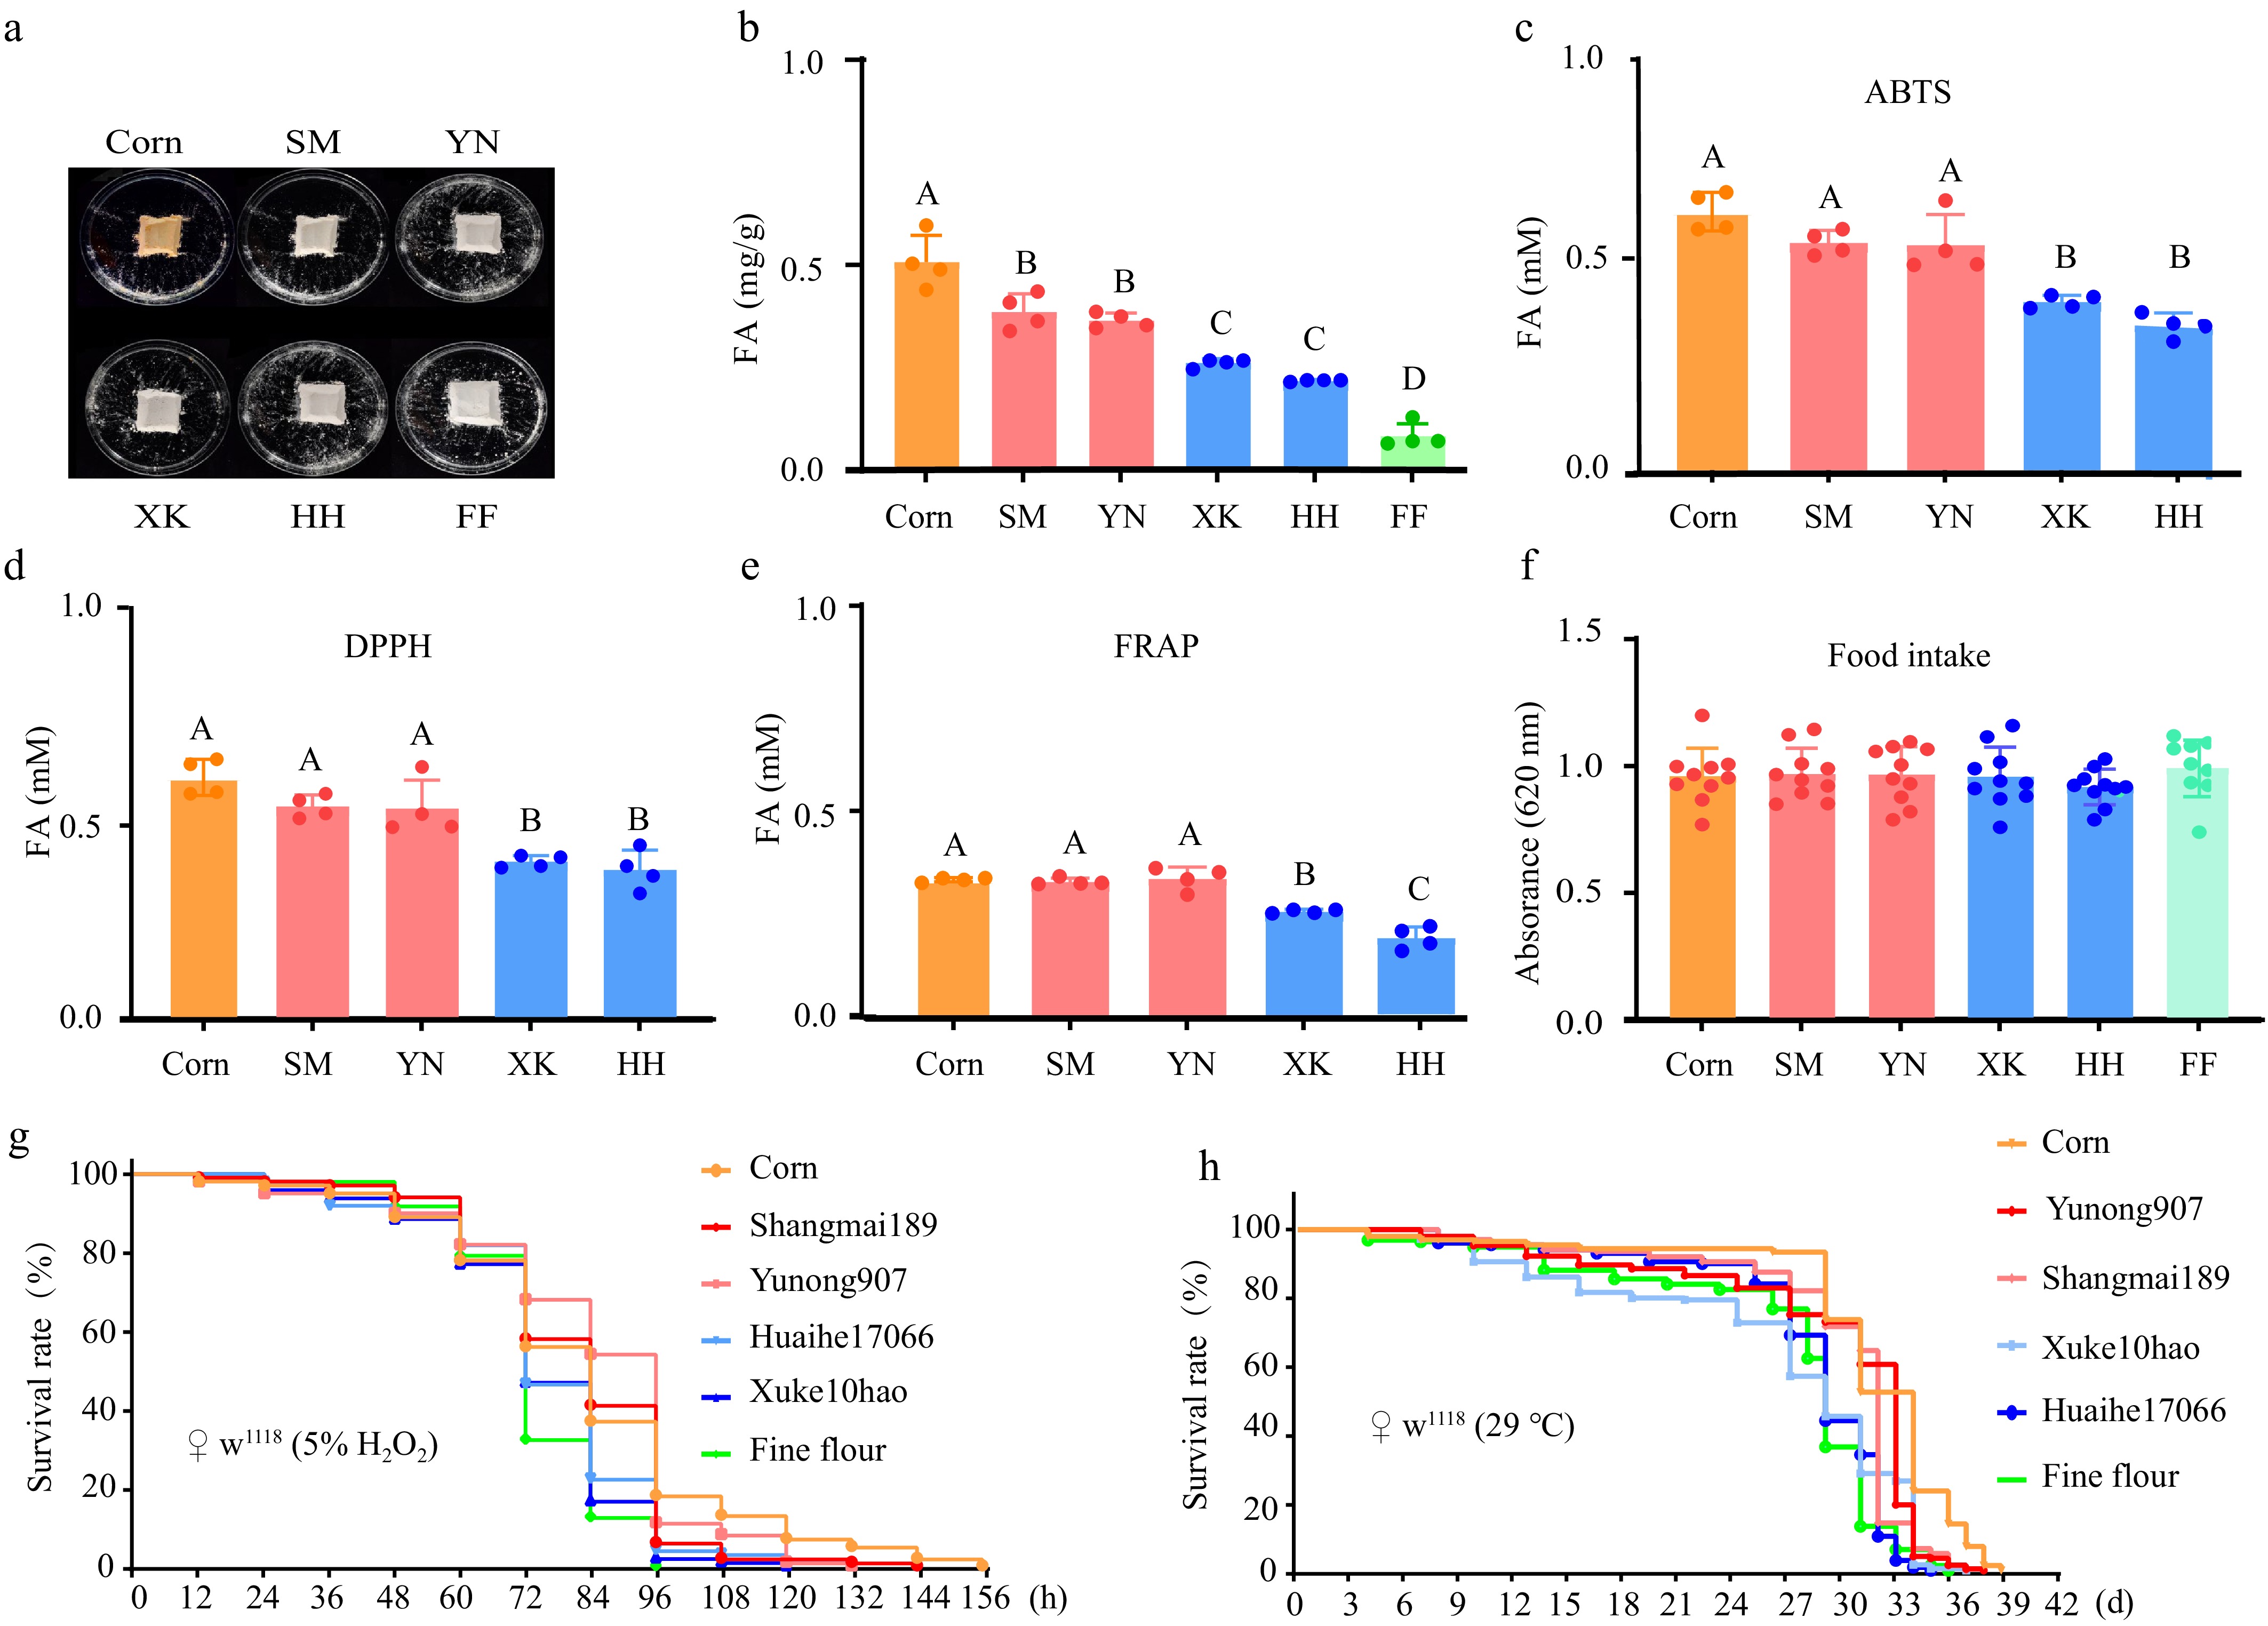
Figure 5.
The lifespans of fruit flies on food made with HFA or LFA cultivars. (a) The appearance of foods made with whole-wheat flour from HFA (SM, YN) of LFA (XK, HH) cultivars. Corn is a food made with corn flour and contains the highest content of FA in tested samples, serving as an HFA control. FF is a fine flour from Jimai22 with a very low FA content, serving as an LFA control. The (b) FA contents and antioxidant potentials (c), ABTS; (d) DPPH; and (e) FRAP of the foods. n = 4. (f) The amount of food taken by fruit flies. Note that there is no significant difference between the foods. n = 10. (g) The lifespan of female fruit flies on different foods in acute stress induced by 5% H2O2, grown at RT. Note that the FF has low FA, and the corresponding group (green line) has the shortest lifespan. (h) The lifespan of female fruit flies on different foods in chronic stress caused by heat treatment (29 °C). Note that the corn flour with the highest FA content has the longest lifespan in its group (orange line).
Figures
(5)
Tables
(0)