-
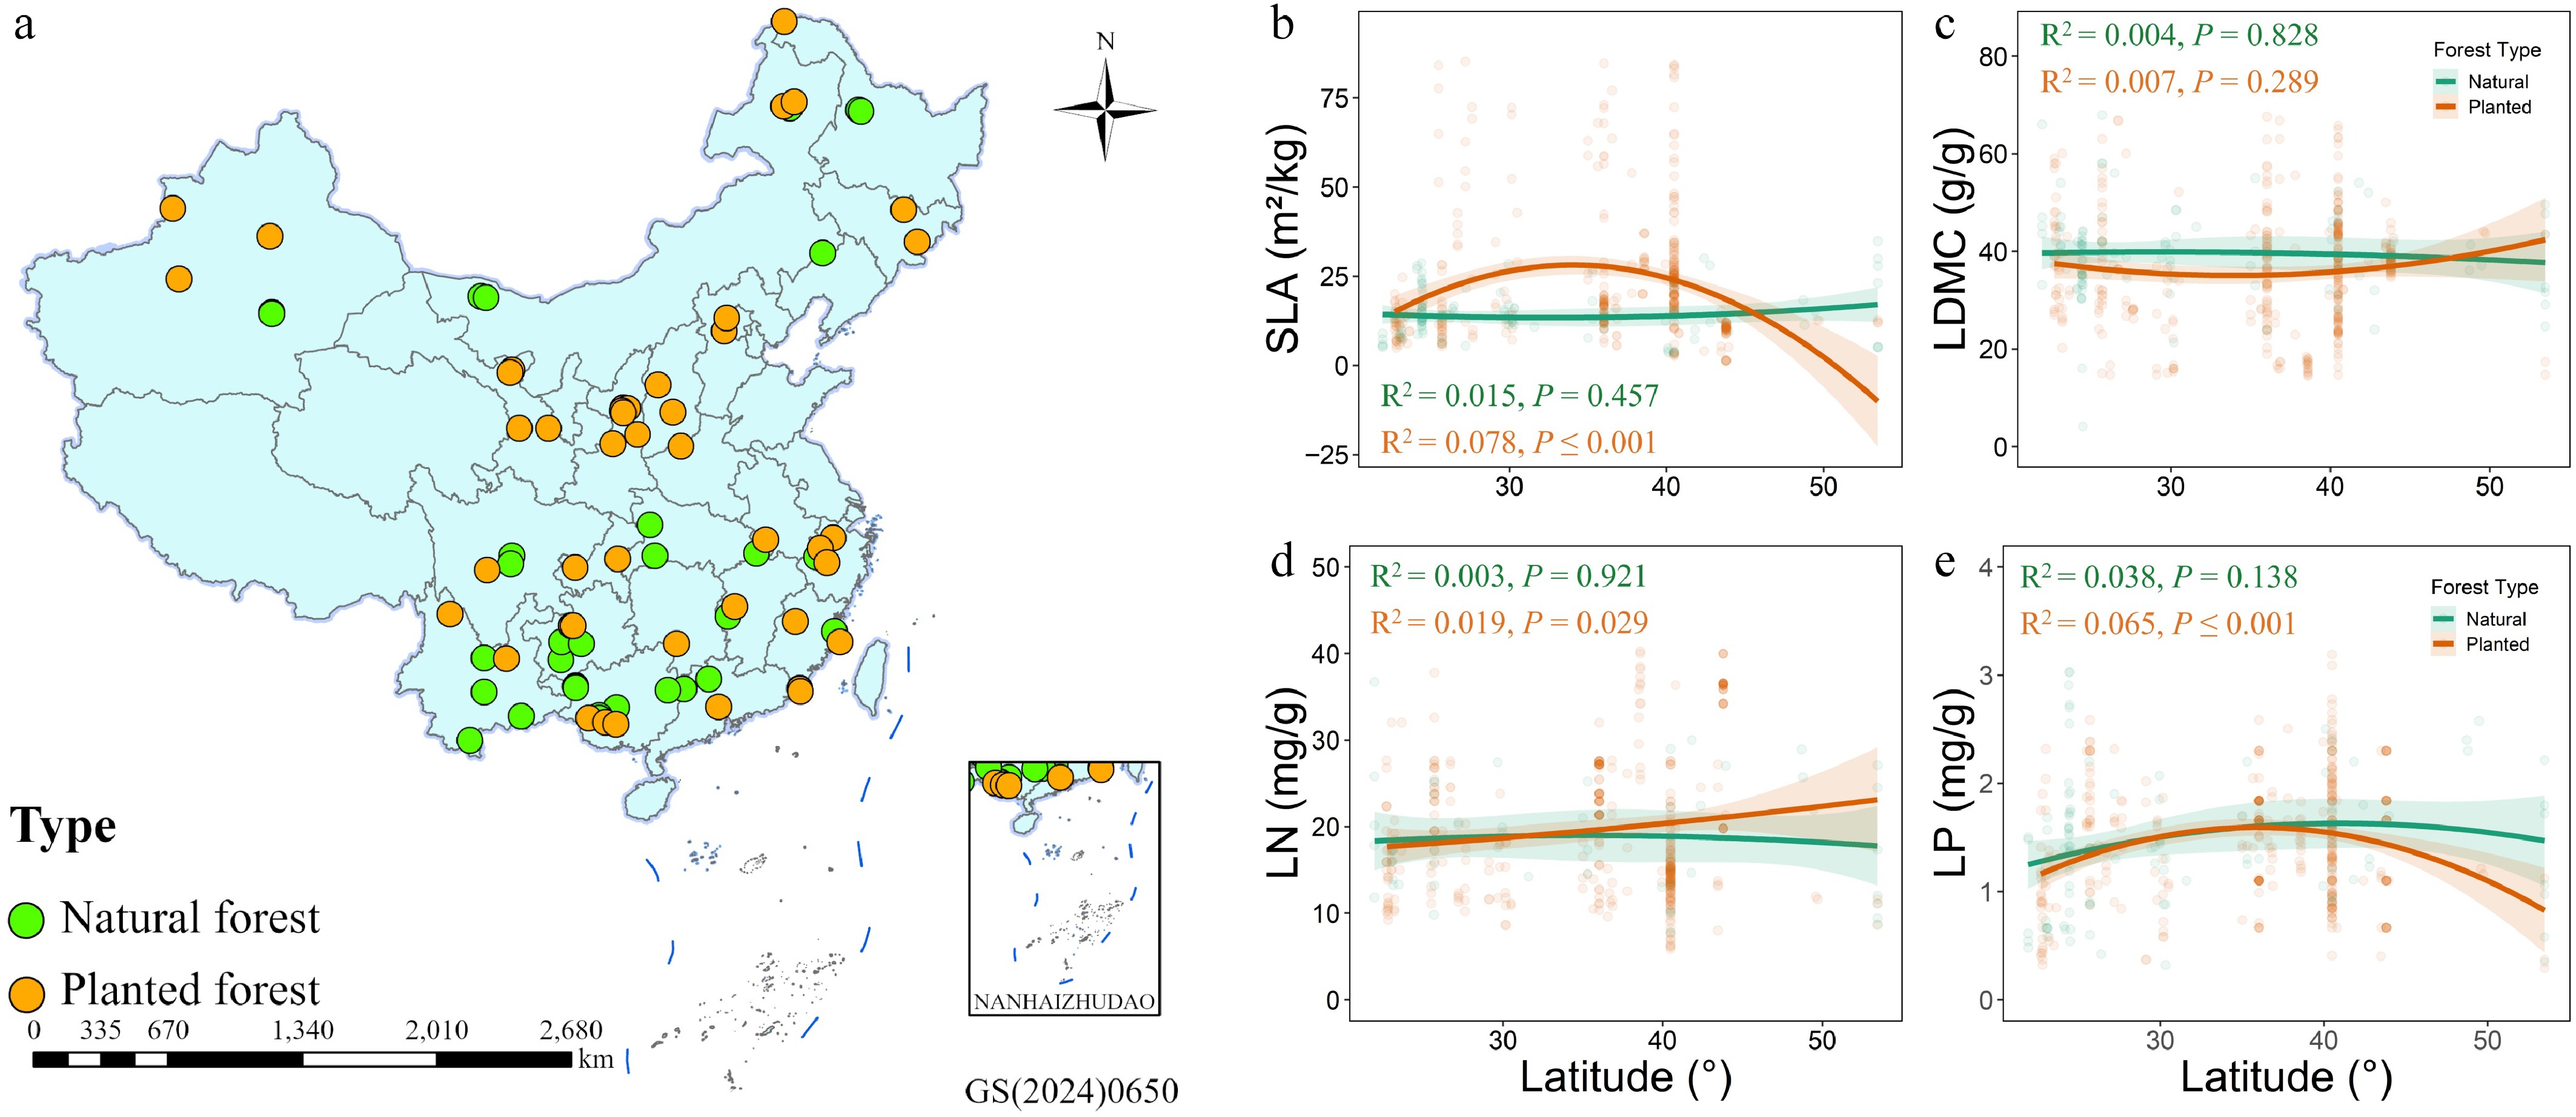
Figure 1.
(a) Spatial distribution of natural forests (green), and planted forests (orange) sampling sites; (b)–(e) Latitudinal variation patterns of specific leaf area (SLA), leaf dry matter content (LDMC), leaf nitrogen (LN), and leaf phosphorus (LP) in the two forest types.
-
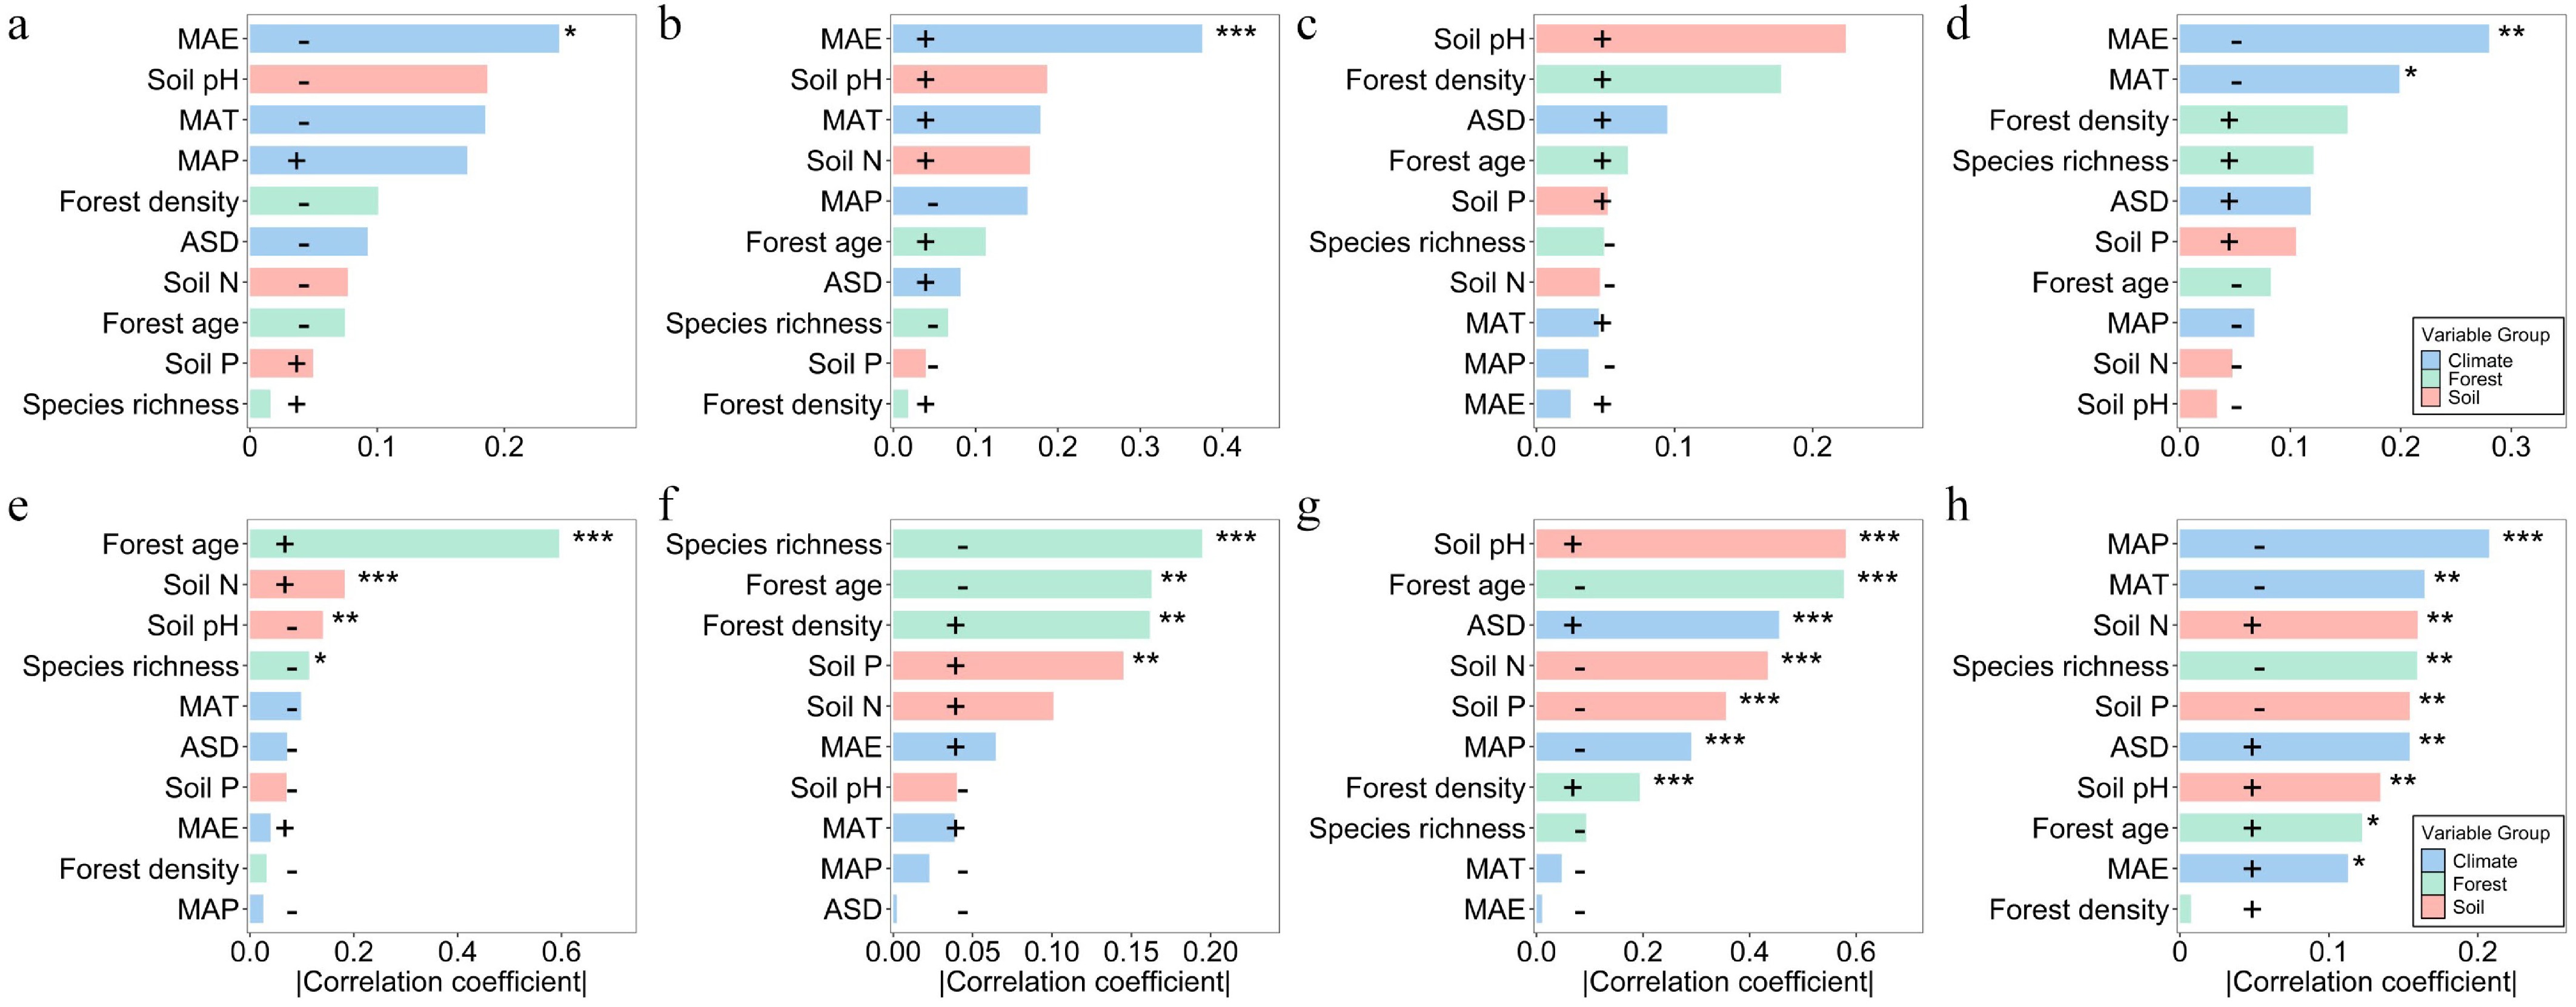
Figure 2.
Correlation analysis between leaf traits and environmental factors. Pearson correlation coefficients between leaf traits and climate, soil, stand structure, and latitude are shown for natural and planted forests. (a)–(d) represent natural forests, and (e)–(h) represent planted forests. Blue, pink, green, and orange bars correspond to climate, soil, forest structure, and latitude factors, respectively; bar length indicates the magnitude of the correlation coefficient, and the direction (positive or negative) indicates the correlation sign. Significance levels: *** p < 0.001; ** p < 0.01; * p < 0.05. SLA: specific leaf area; LDMC: leaf dry matter content; LN: leaf nitrogen concentration; LP: leaf phosphorus concentration.
-
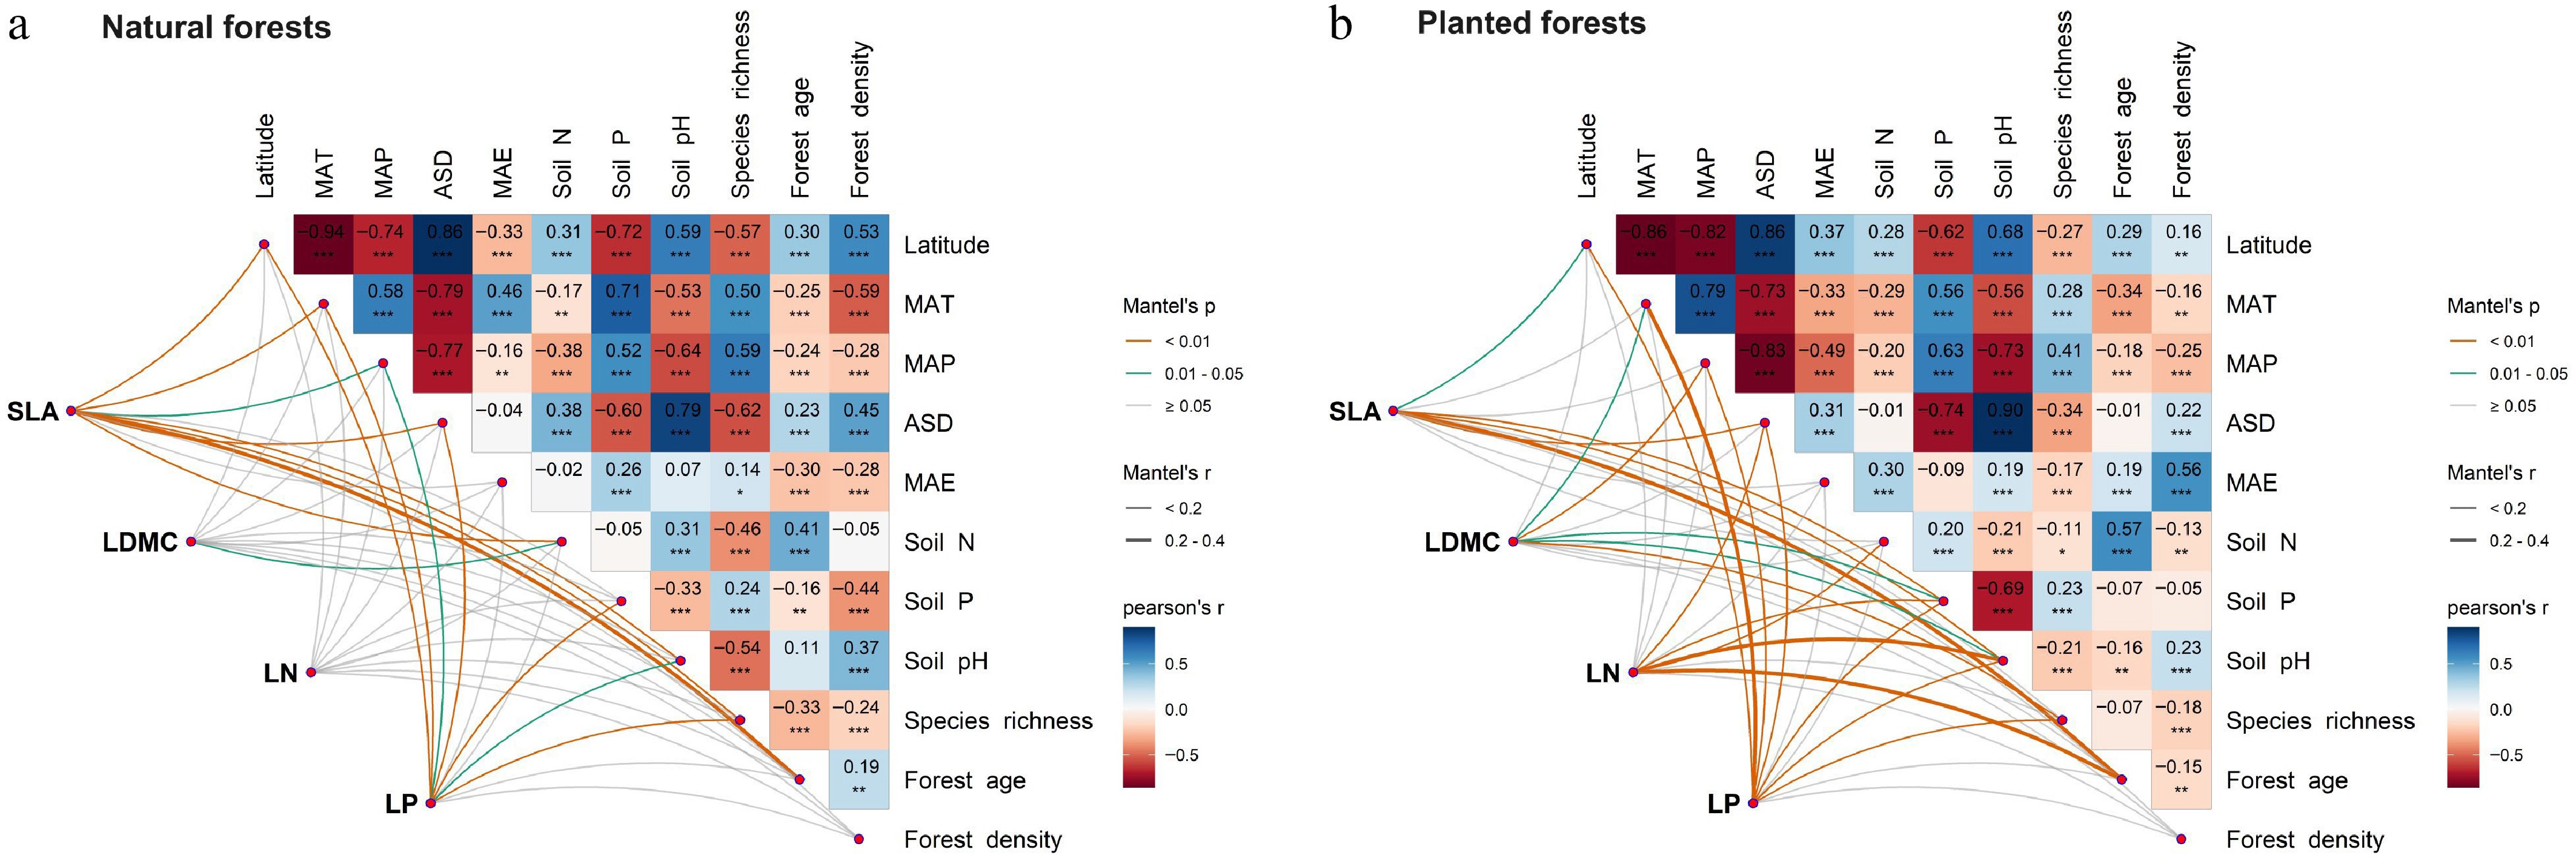
Figure 3.
Multiple correlation analysis of potential drivers influencing leaf traits in (a) natural, and (b) planted forests. Climate factors include mean annual temperature (MAT), mean annual precipitation (MAP), mean annual evapotranspiration (MAE), and annual sunshine duration (ASD); soil factors include soil total nitrogen (N), available phosphorus (P), and soil pH; forest factors include forest age, forest density, and species richness. Significance levels: *** p < 0.001; ** p < 0.01; * p < 0.05.
-
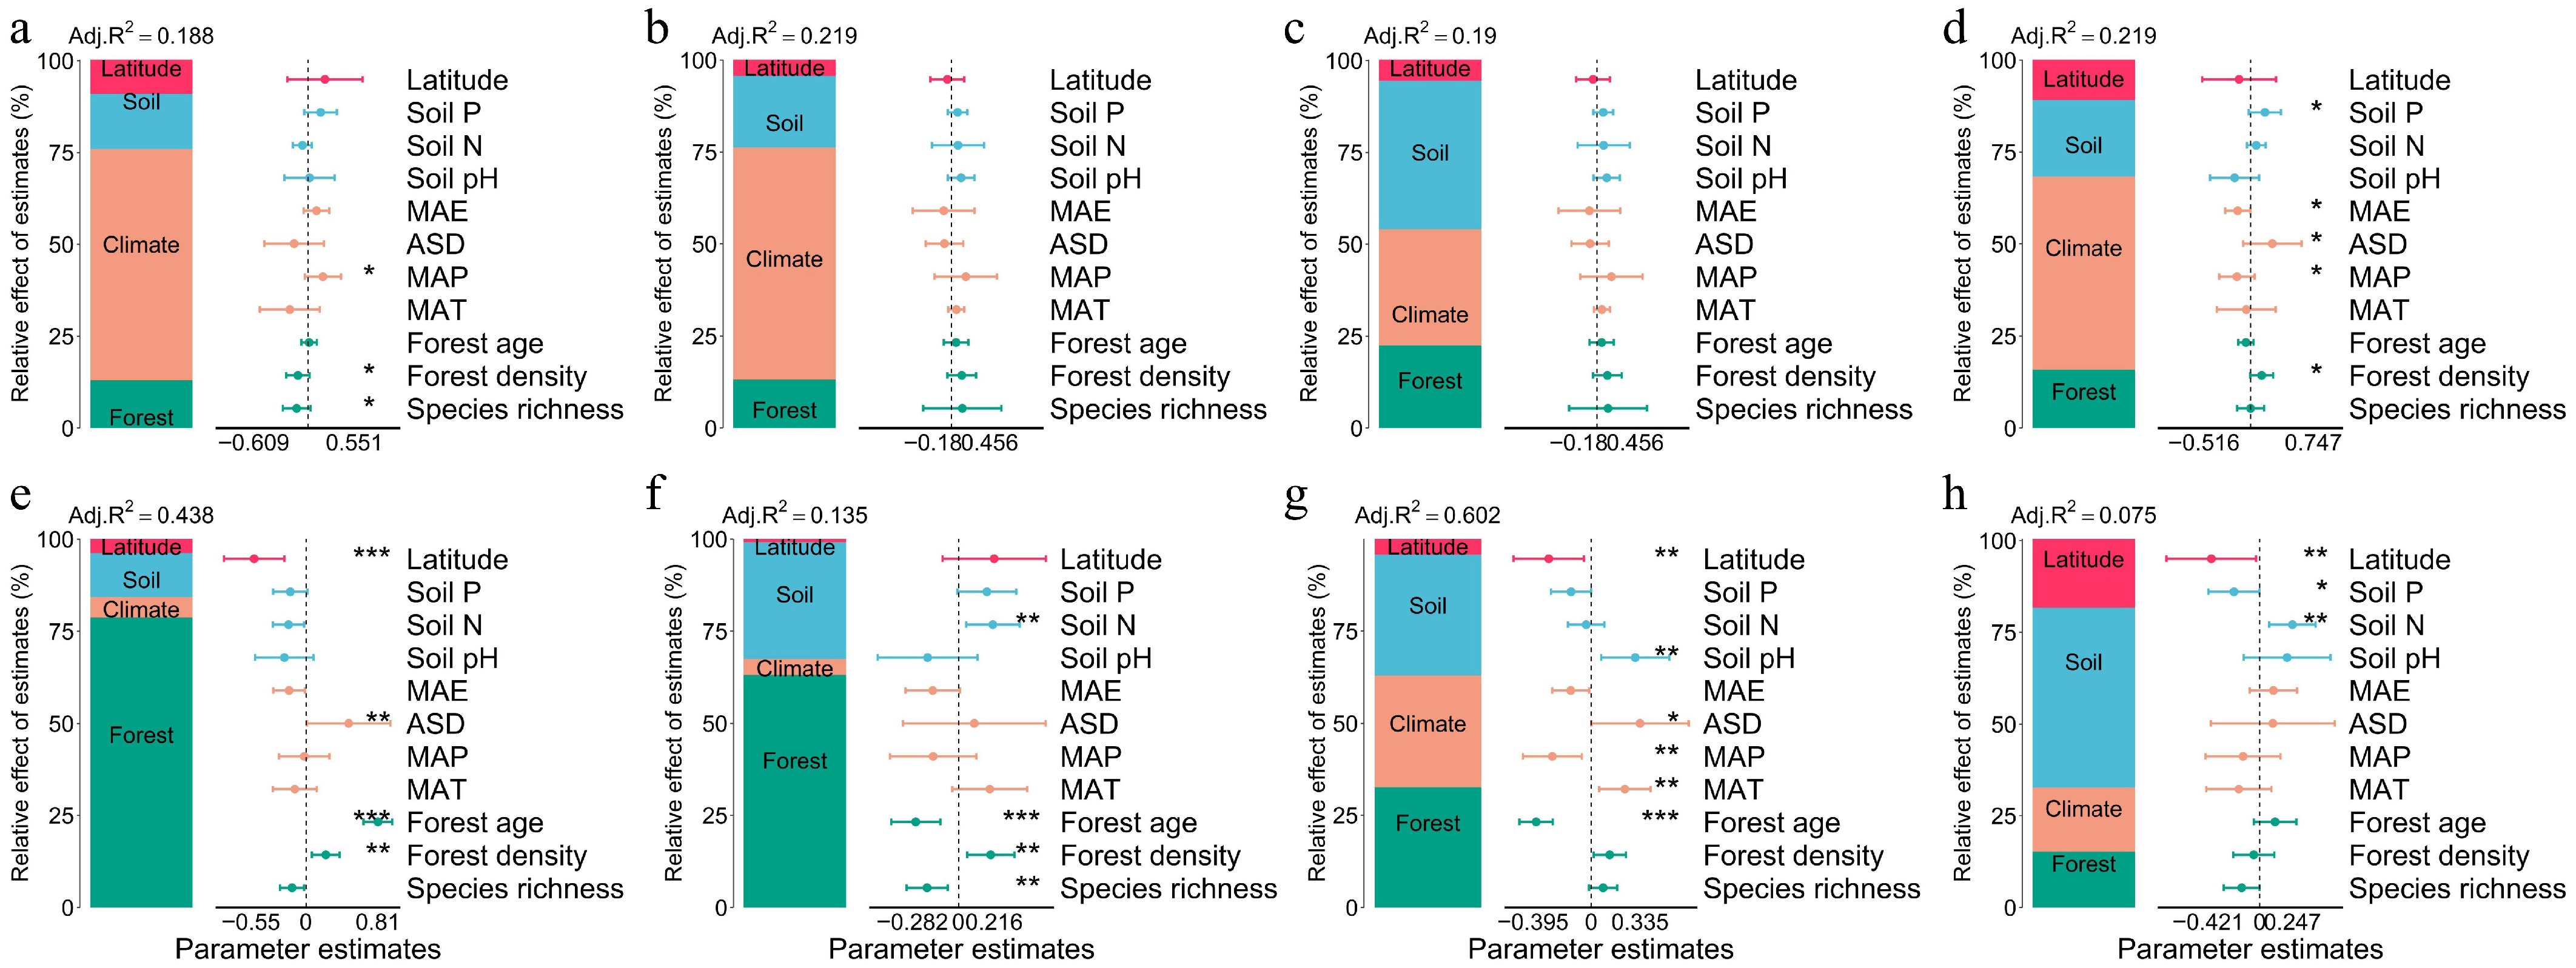
Figure 4.
Relative contributions of environmental and stand structural variables to geographic variation in leaf functional traits (SLA, LDMC, LN, and LP) in natural and planted forests. Each panel consists of two sub-panels. The left sub-panel shows the partitioning of explained variance among four predictor groups—Latitude, Soil (Soil N, Soil P, Soil pH), Climate (MAT, MAP, MAE, ASD), and Forest structure (species richness, forest age, forest density)—based on hierarchical partitioning using adjusted R2 from redundancy analysis (RDA). The right sub-panel presents standardized regression coefficients (± SE), quantifying the direction and magnitude of individual predictors. Positive values indicate positive effects, and negative values indicate negative effects. A broken-axis transformation was applied where necessary to visualize both small and large coefficient estimates simultaneously. Filled points are colored by predictor category (Forest, Climate, Soil, Latitude), significance levels: *** p < 0.001; ** p < 0.01; * p < 0.05. Panel descriptions: Natural forests: (a) SLA, (b) LDMC, (c) LN, (d) LP; Planted forests: (e) SLA, (f) LDMC, (g) LN, (h) LP.
-
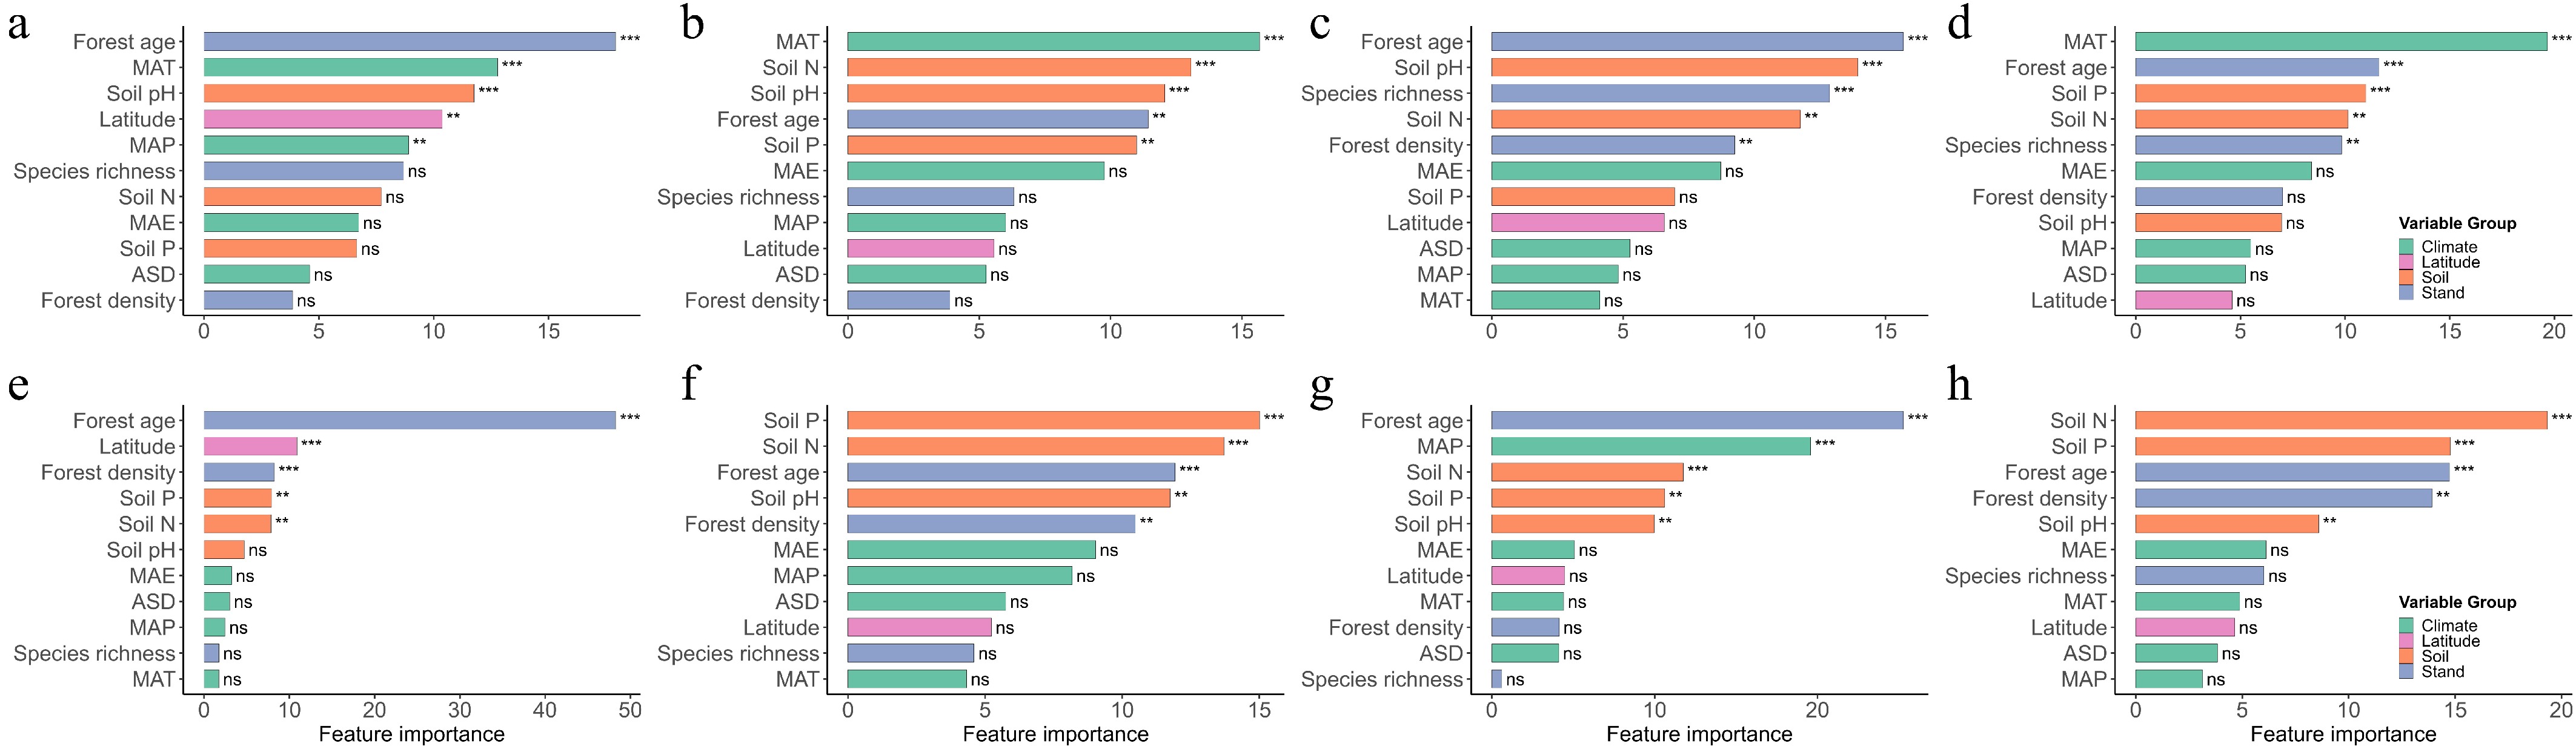
Figure 5.
Relative importance of environmental and stand structural predictors for leaf functional traits in natural and planted forests based on CatBoost models. Results for natural forests—(a) SLA, (b) LDMC, (c) LN, and (d) LP—and planted forests—(e) SLA, (f) LDMC, (g) LN, and (h) LP. Predictor variables were grouped into four categories: Climate (MAT, MAP, ASD, MAE), Soil (Soil pH, Soil N, Soil P), Stand structure (species richness, forest age, forest density), and Latitude. Feature importance was derived from CatBoost using 300 iterations and RMSE loss. Bars represent the relative contribution of each predictor, with colors indicating predictor groups. Asterisks mark relative importance ranks (*** top 3, ** top 4–5, ns = not ranked), highlighting the most influential predictors for each trait. Higher bar height indicates stronger predictive contribution to trait variation.
-
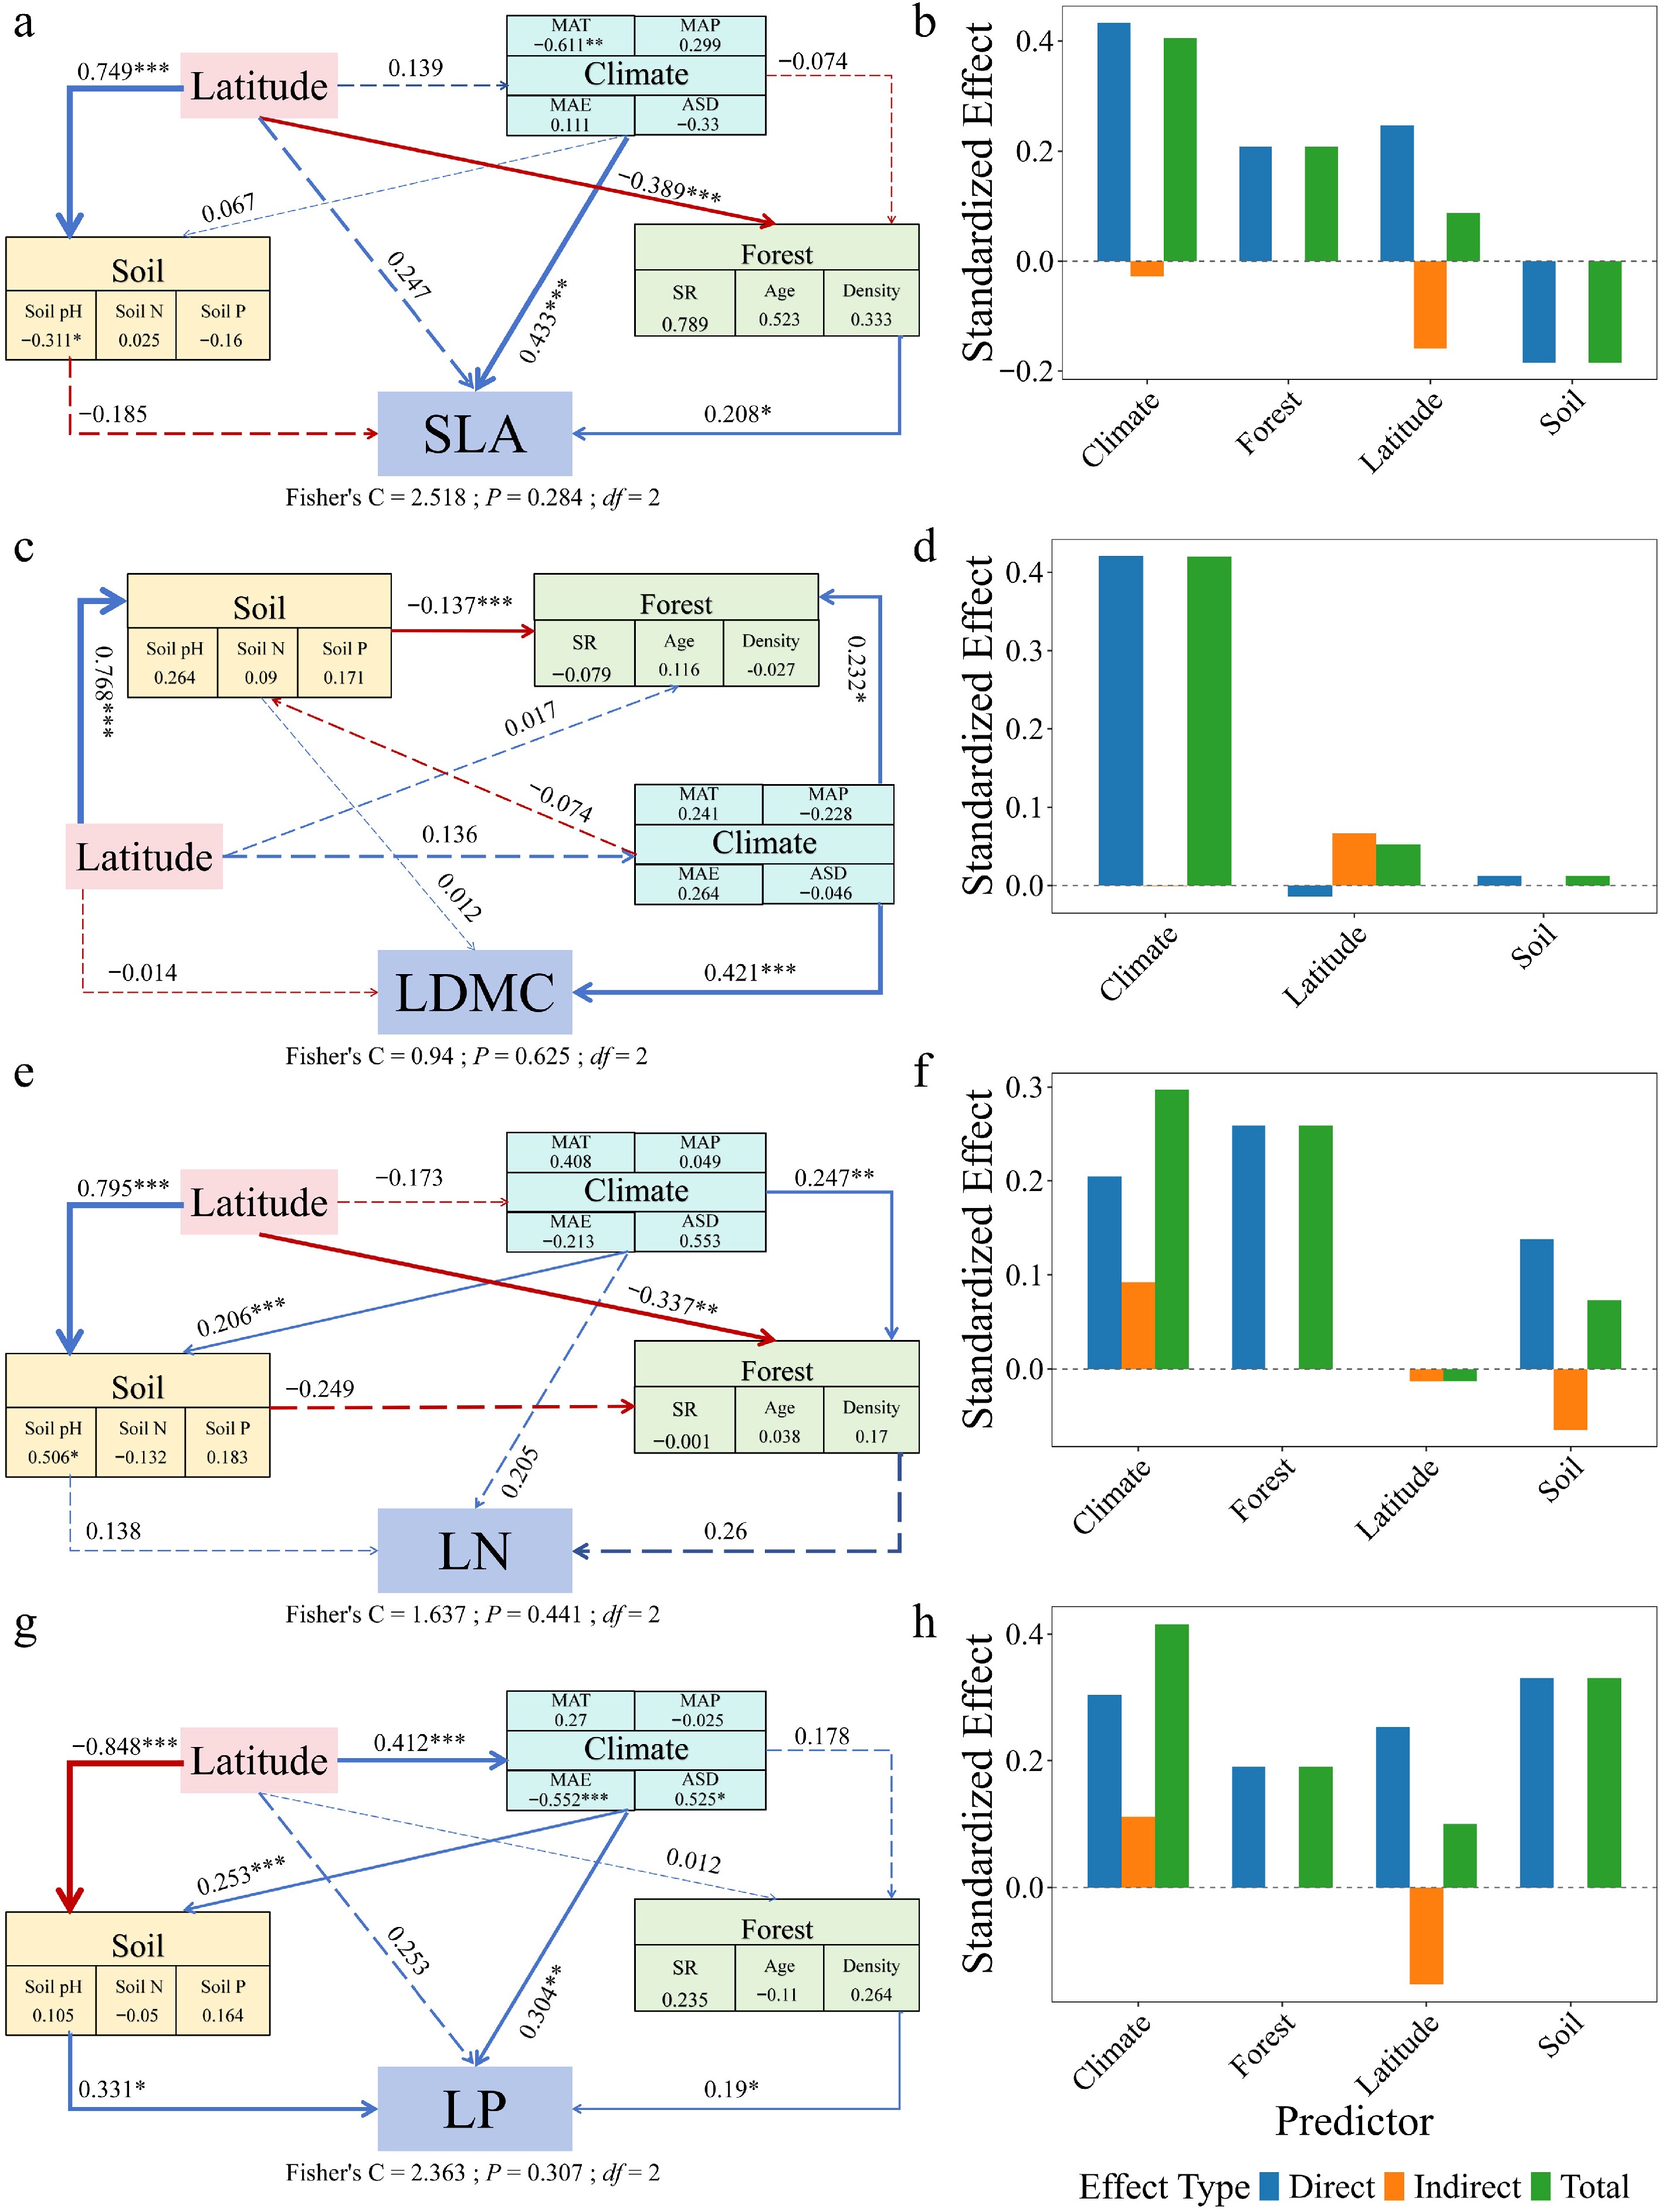
Figure 6.
Structural equation models (SEMs) and effect decomposition of leaf trait responses to latitude in natural forests. (a), (c), (e), (g) Represent SEMs for specific leaf area (SLA), leaf dry matter content (LDMC), leaf nitrogen concentration (Leaf N), and leaf phosphorus concentration (Leaf P), respectively. (b), (d), (f), (h) Show the decomposition of standardized direct effects (blue), indirect effects (orange), and total effects (green) of environmental factors on leaf traits. Solid blue arrows indicate significant positive paths, solid red arrows indicate significant negative paths, and arrow thickness represents the magnitude of standardized path coefficients. Dashed arrows denote non-significant paths. Numbers adjacent to arrows indicate standardized path coefficients for significant paths only (* p < 0.05; ** p < 0.01; *** p < 0.001). Fisher's C statistic is shown as a measure of model fit.
-
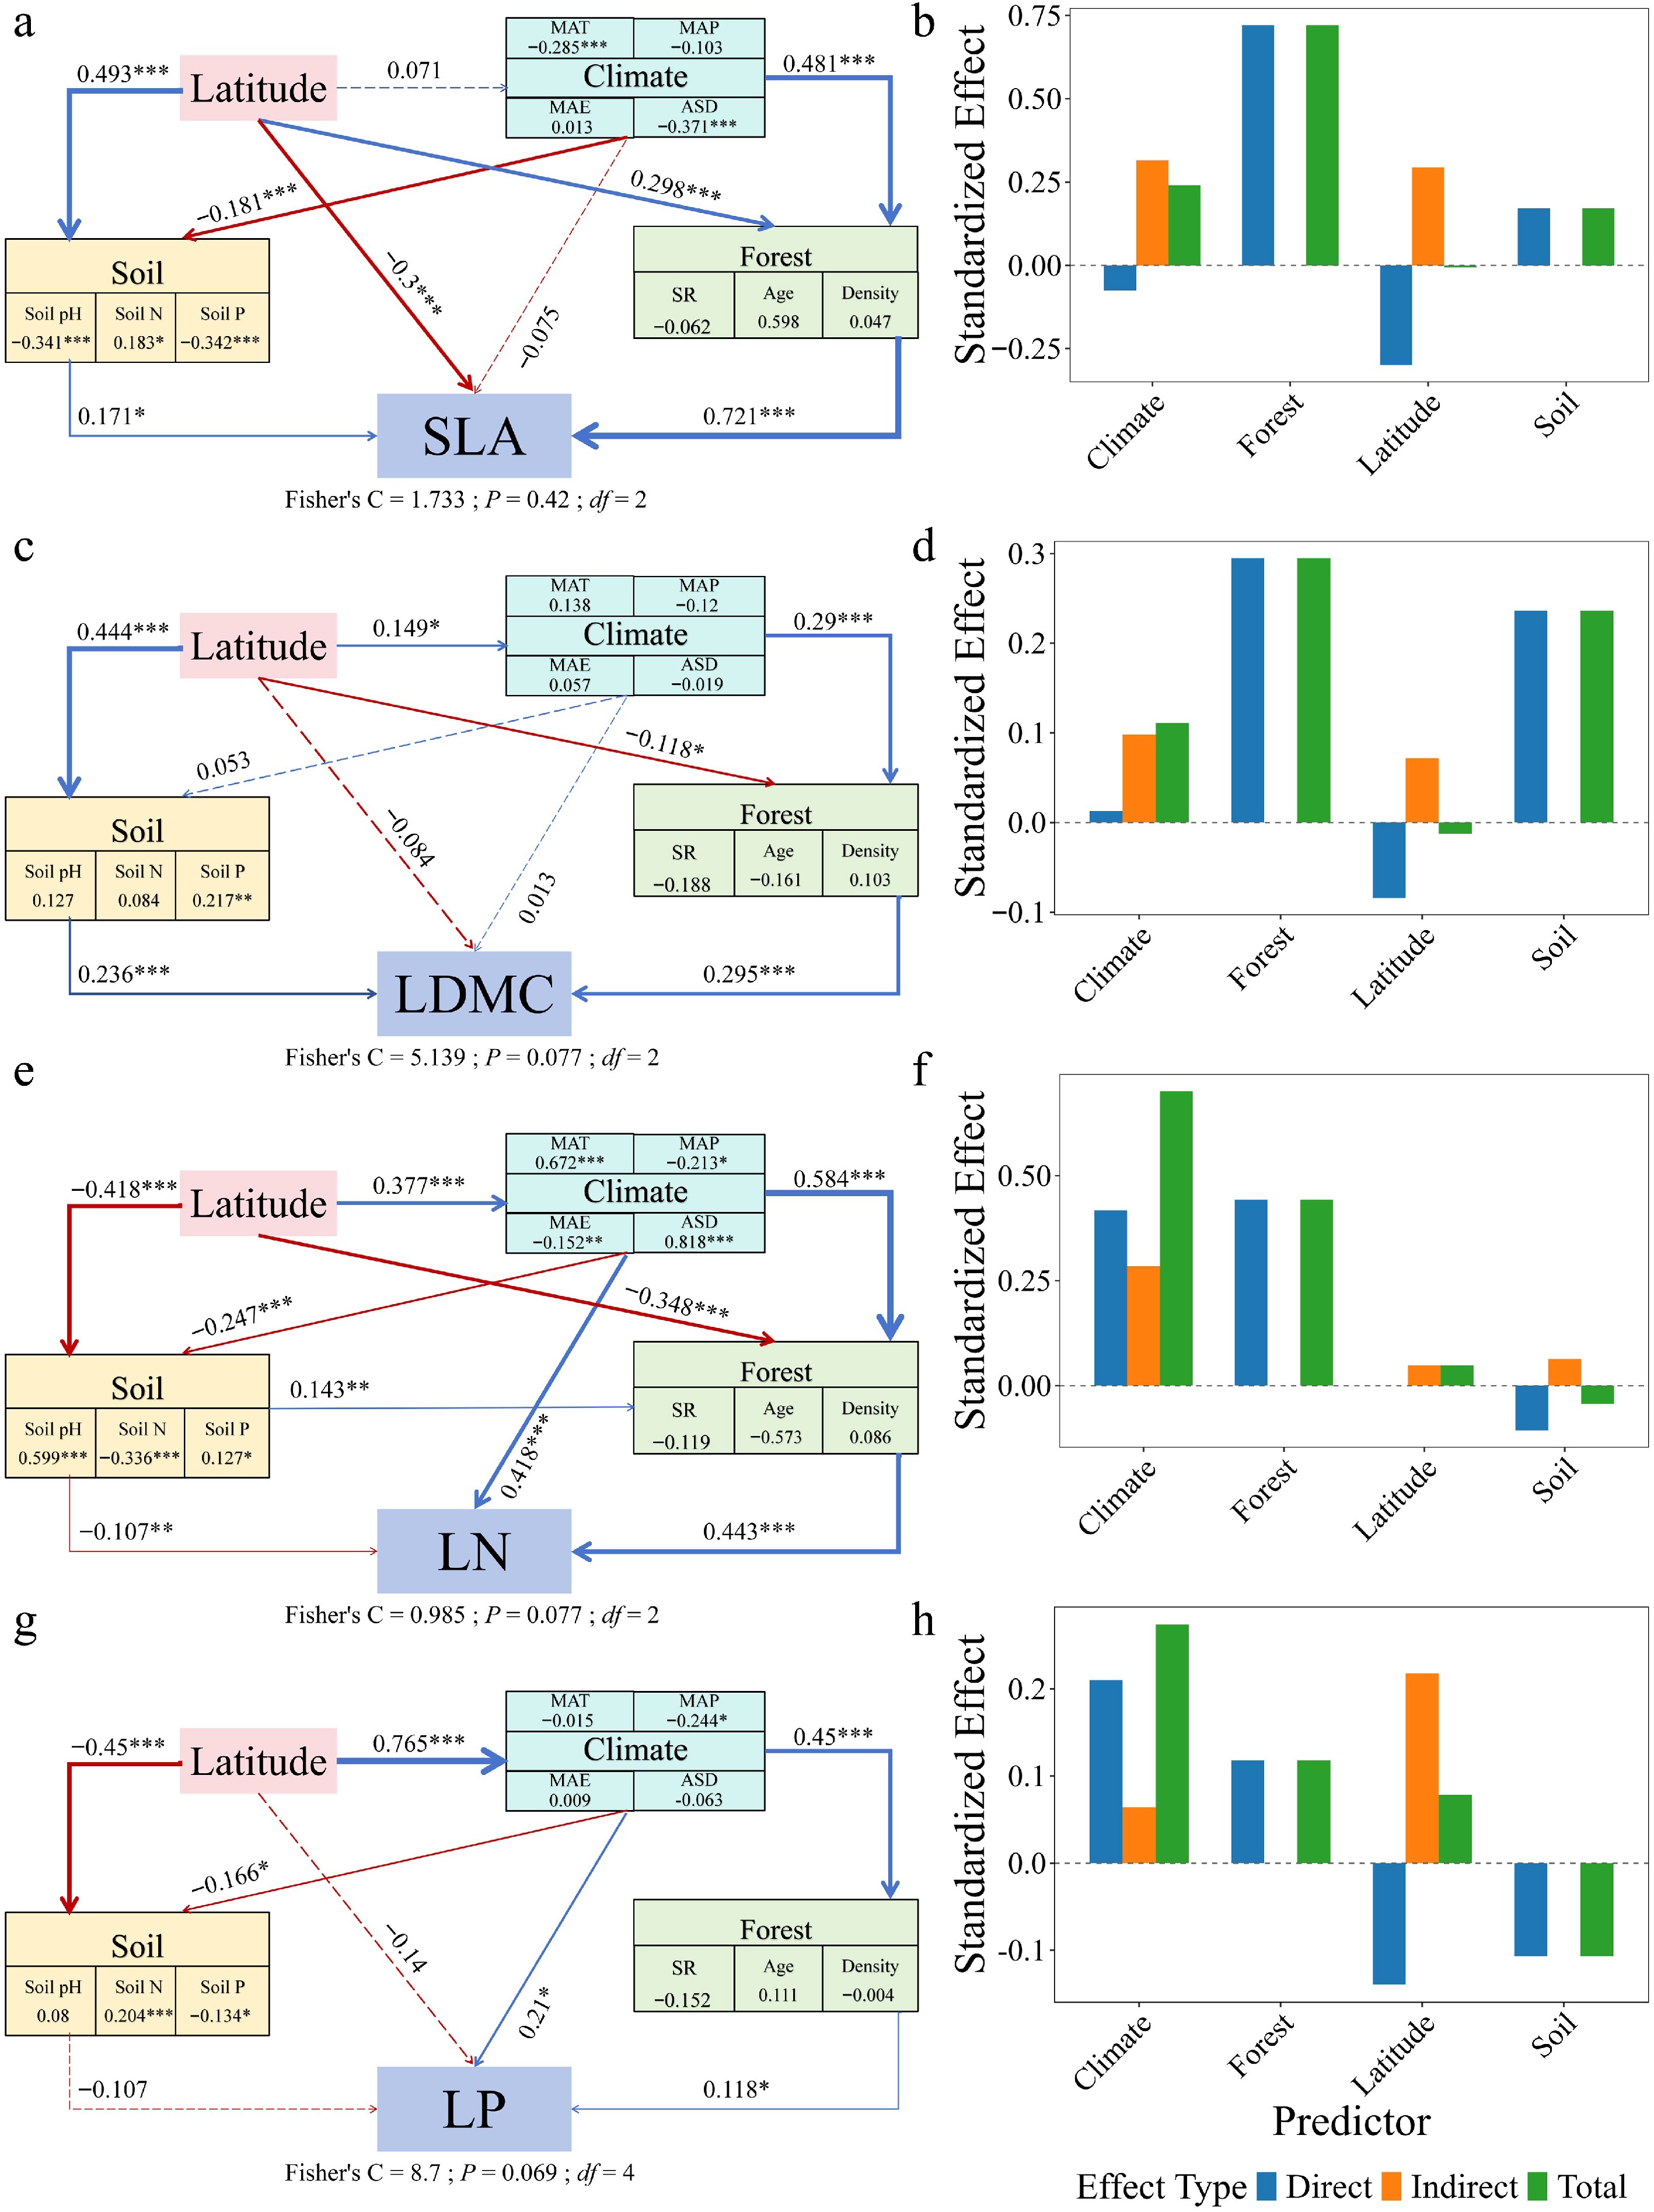
Figure 7.
Structural equation models (SEMs) and effect decomposition of leaf trait responses to latitude in planted forests. (a), (c), (e), (g) Represent SEMs for specific leaf area (SLA), leaf dry matter content (LDMC), leaf nitrogen concentration (Leaf N), and leaf phosphorus concentration (Leaf P), respectively. (b), (d), (f), (h) Show the decomposition of standardized direct effects (blue), indirect effects (orange), and total effects (green) of environmental factors on leaf traits. Solid blue arrows indicate significant positive paths, solid red arrows indicate significant negative paths, and arrow thickness reflects the magnitude of standardized path coefficients. Dashed arrows denote non-significant paths. Numbers adjacent to arrows indicate standardized path coefficients for significant paths only (* p < 0.05; ** p < 0.01; *** p < 0.001). Fisher's C statistic is presented as a measure of model fit.
Figures
(7)
Tables
(0)