-
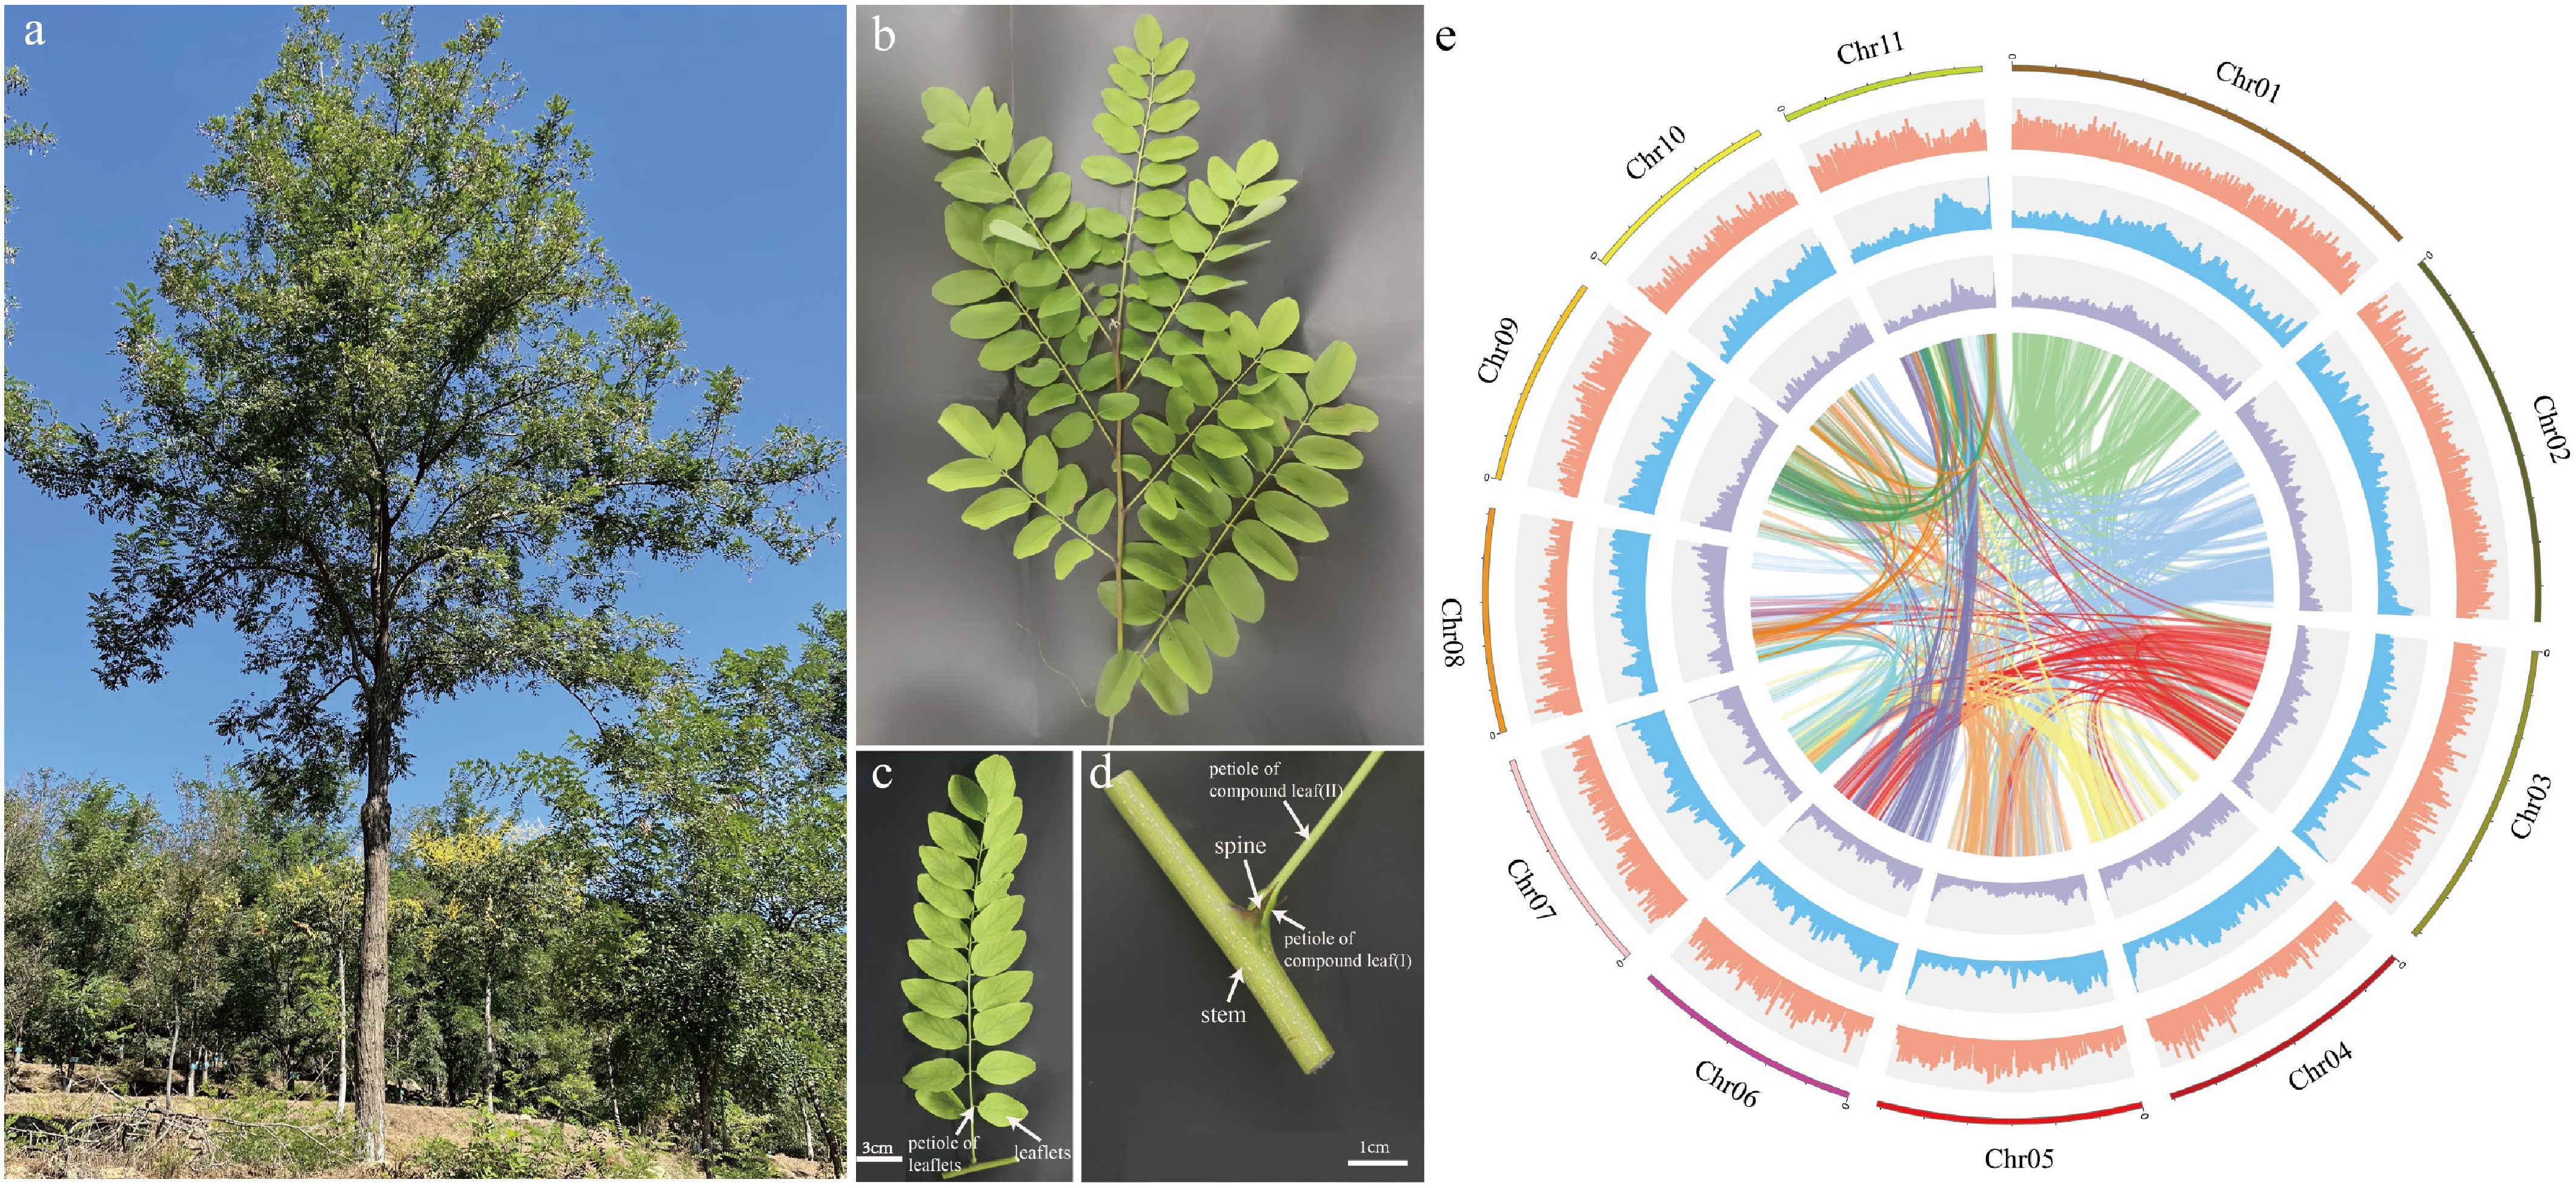
Figure 1.
Plant morphology and genome features of Robinia pseudoacacia. (a) A R. pseudoacacia tree. (b) A stem branch. (c) A compound leaf. (d) Stipular spines of R. pseudoacacia. (e) The circle diagram shows the 11 chromosomes of R. pseudoacacia with a resolution of 1 Mb, gene density with a sliding window of 100 Kb, percentage of repeats with a sliding window of 100 Kb, GC content with a sliding window of 100 Kb, each linking line in the center of the circle connects a pair of homologous genes from inside to outside.
-
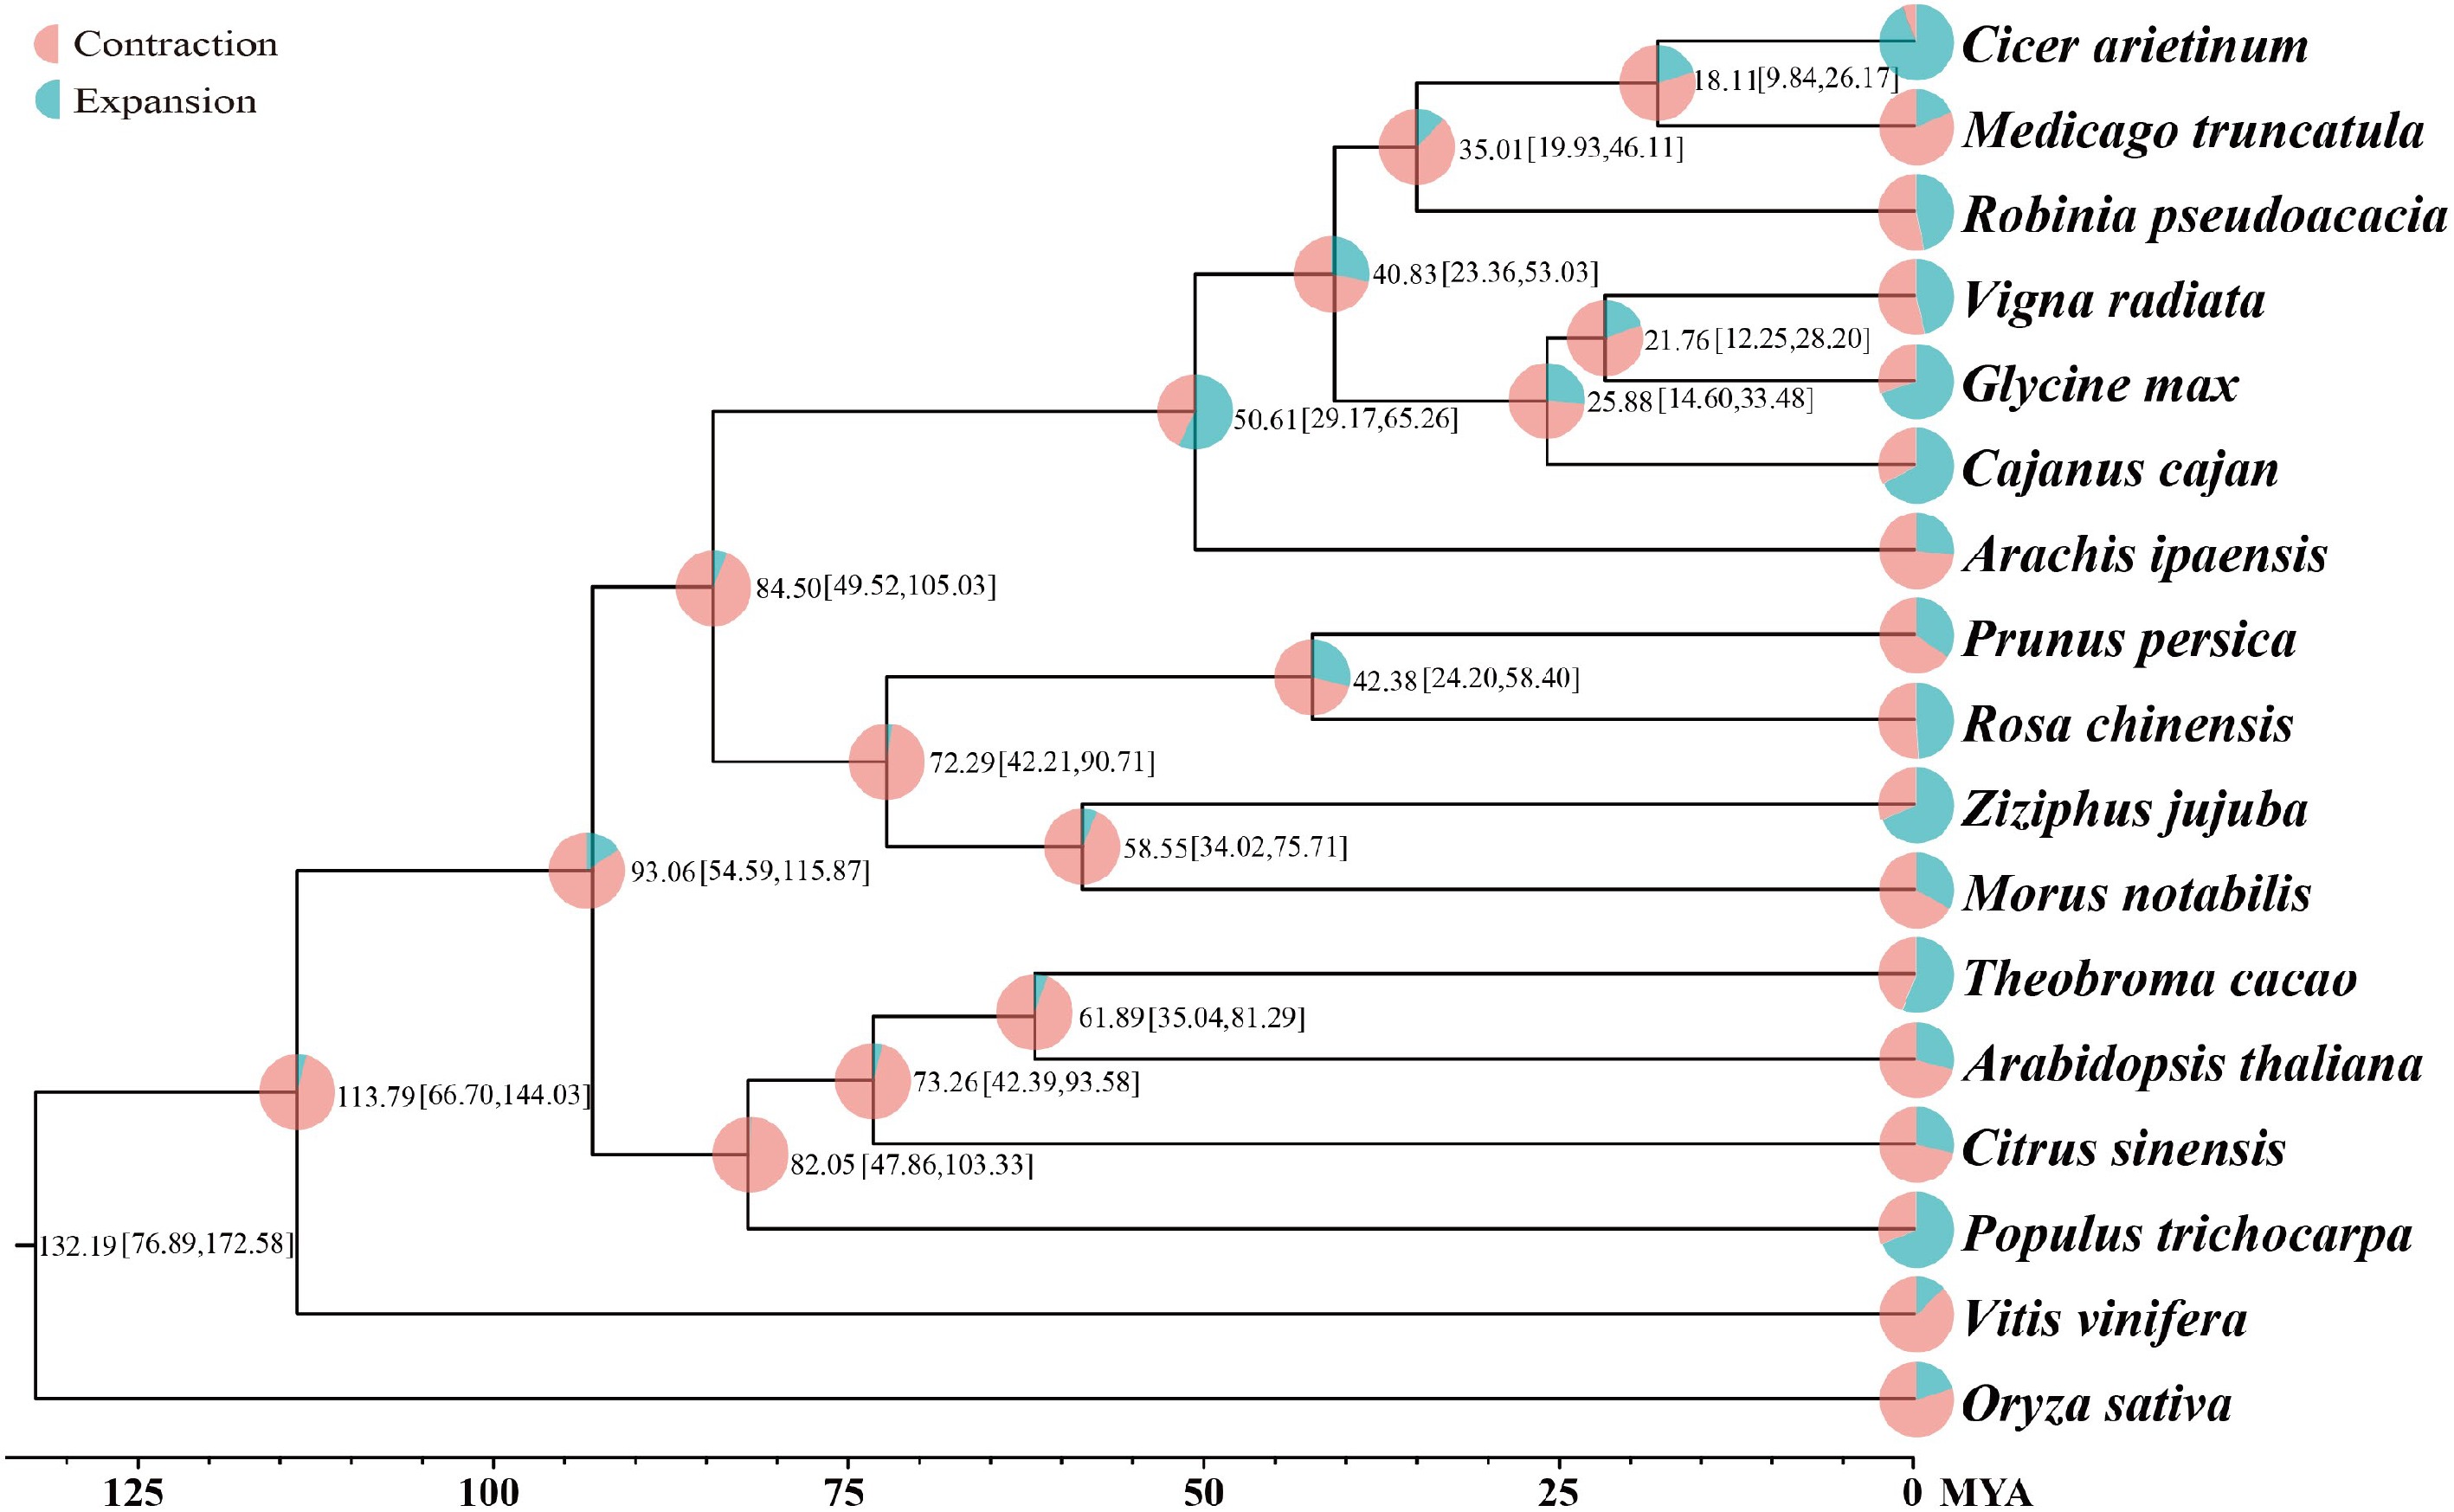
Figure 2.
Phylogenetic tree of 17 plant species. Divergence time (MYA) estimations are indicated by the numbers.
-
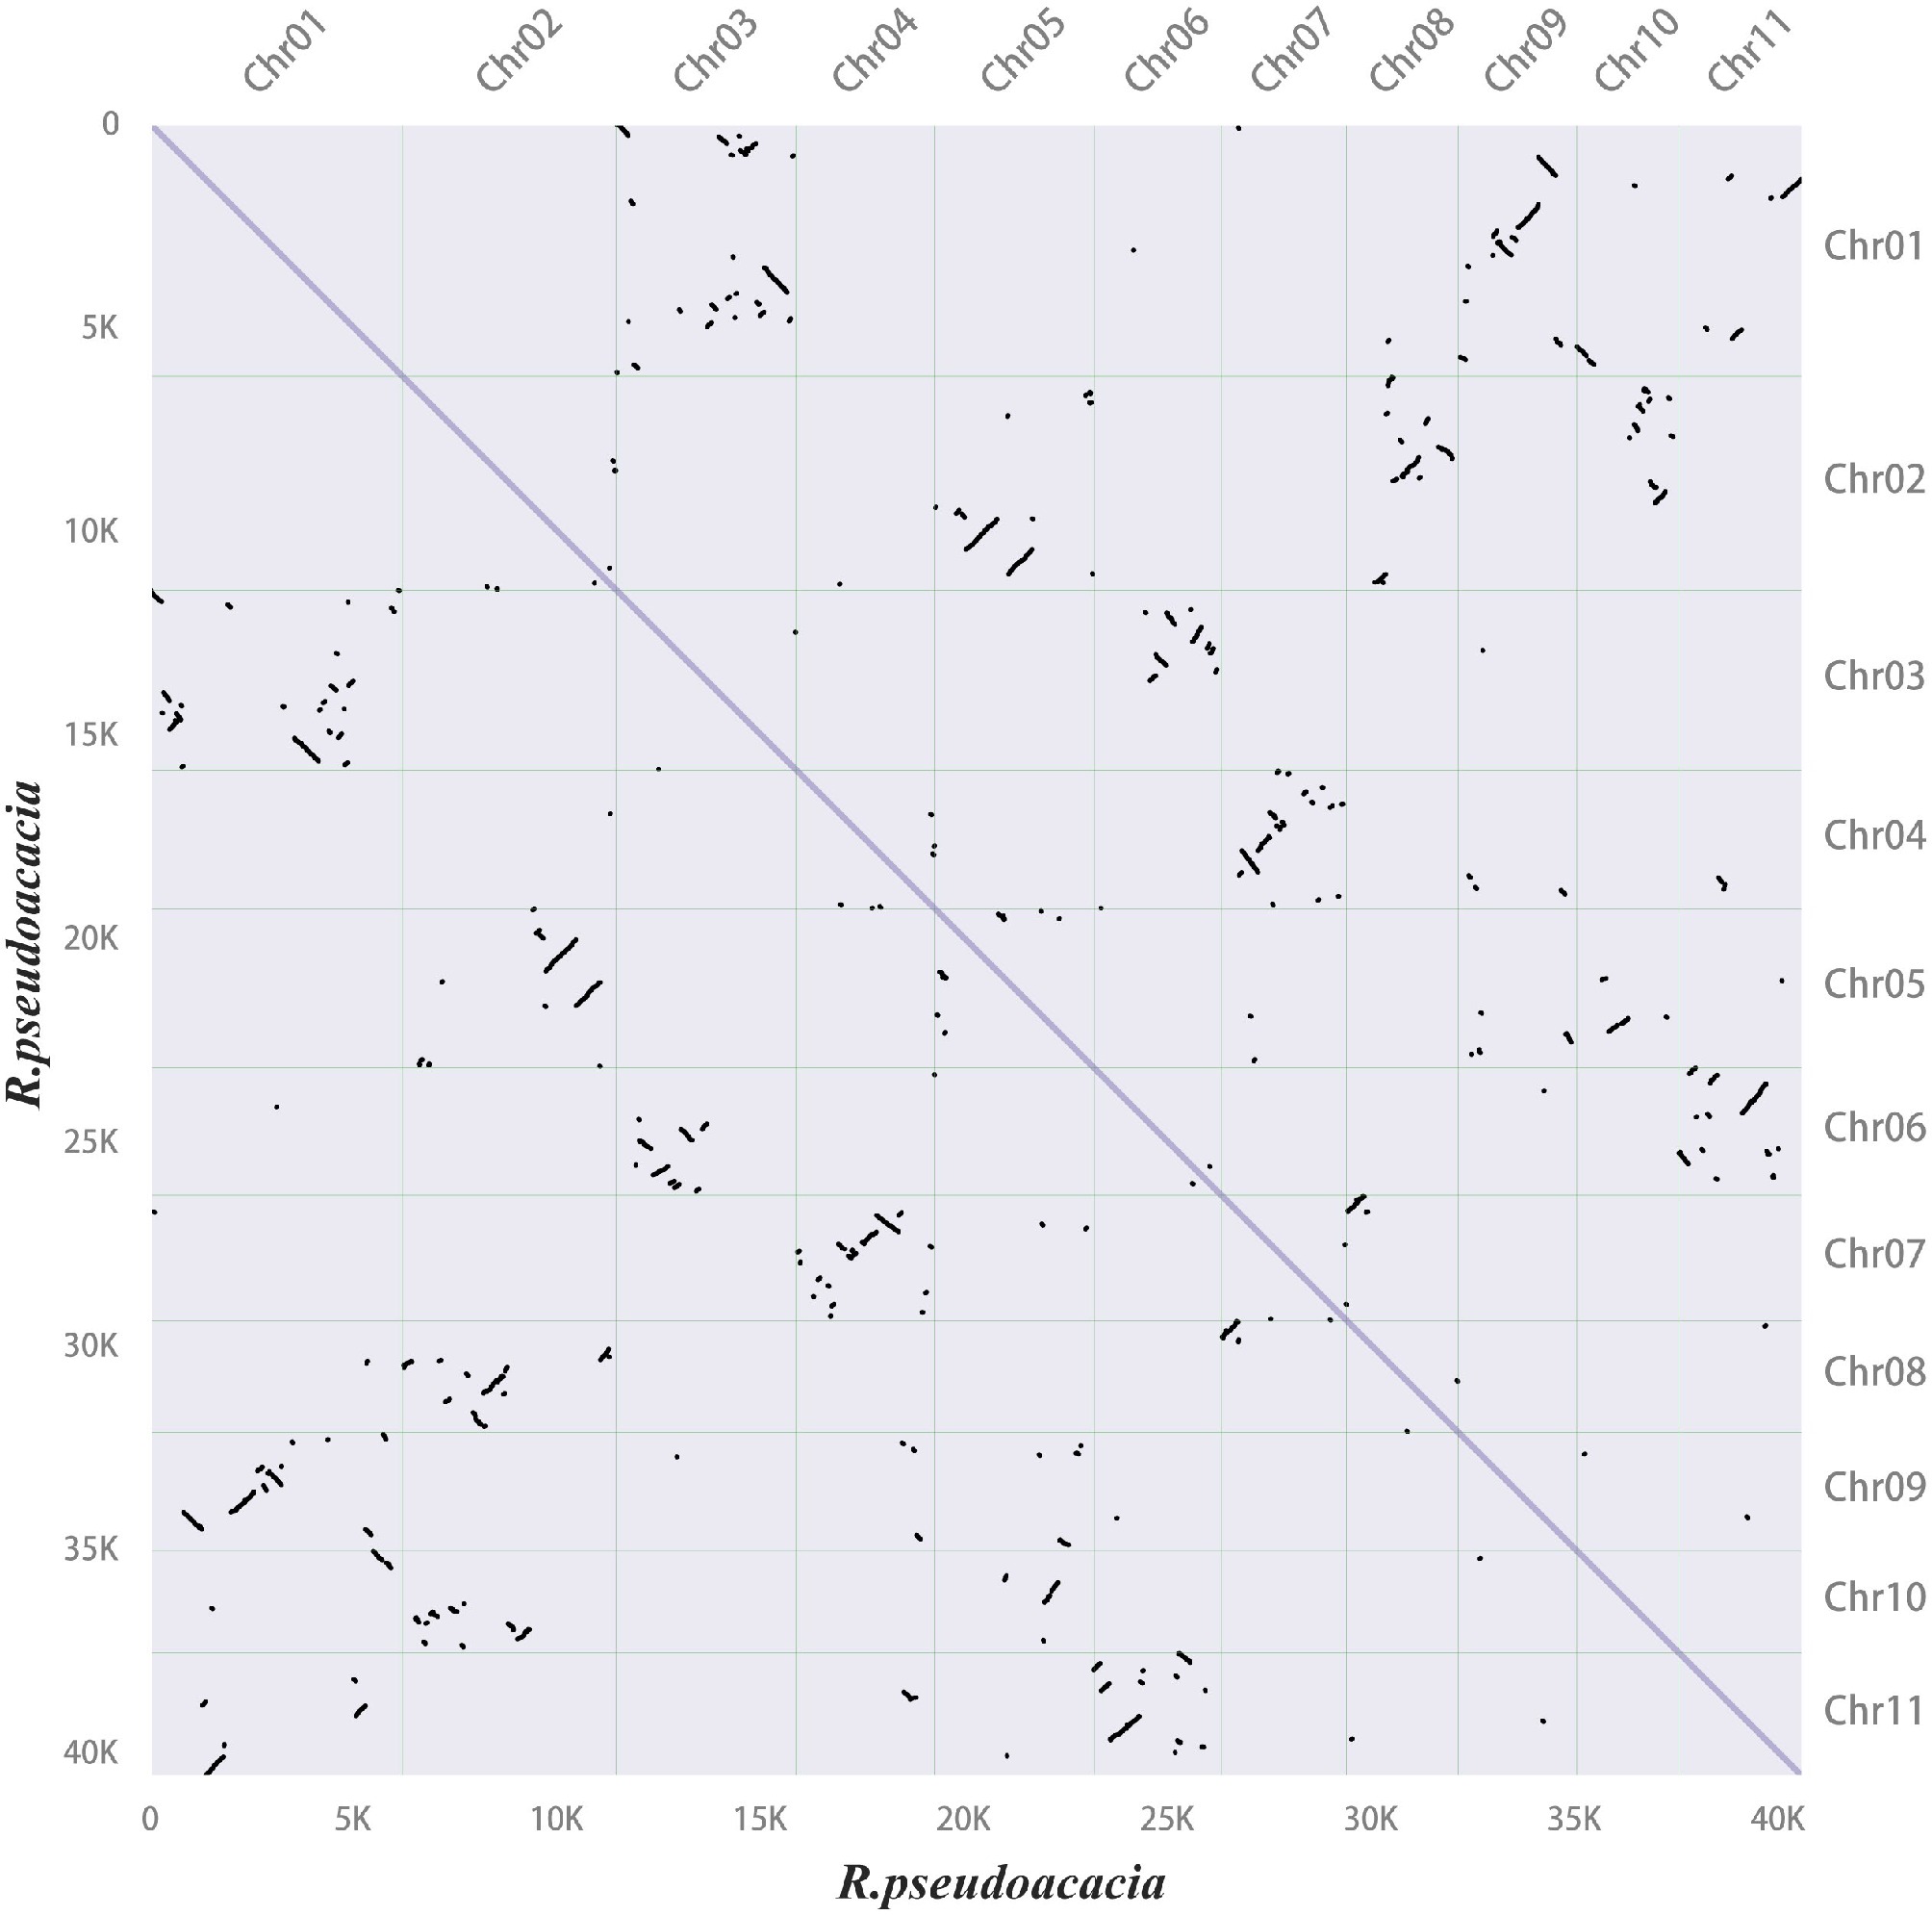
Figure 3.
Synteny dot plot within the Robinia pseudoacacia genome. In the upper right section, the x-axis and y-axis represent the chromosomes (chr01–11) of R. pseudoacacia, arranged in order from left to right and top to bottom according to chromosome numbers. In the lower left section, the x-axis and y-axis indicate lengths ranging from 0–40 K. Each dot represents one homologous block, determined by the positions of genes on the chromosomes.
-
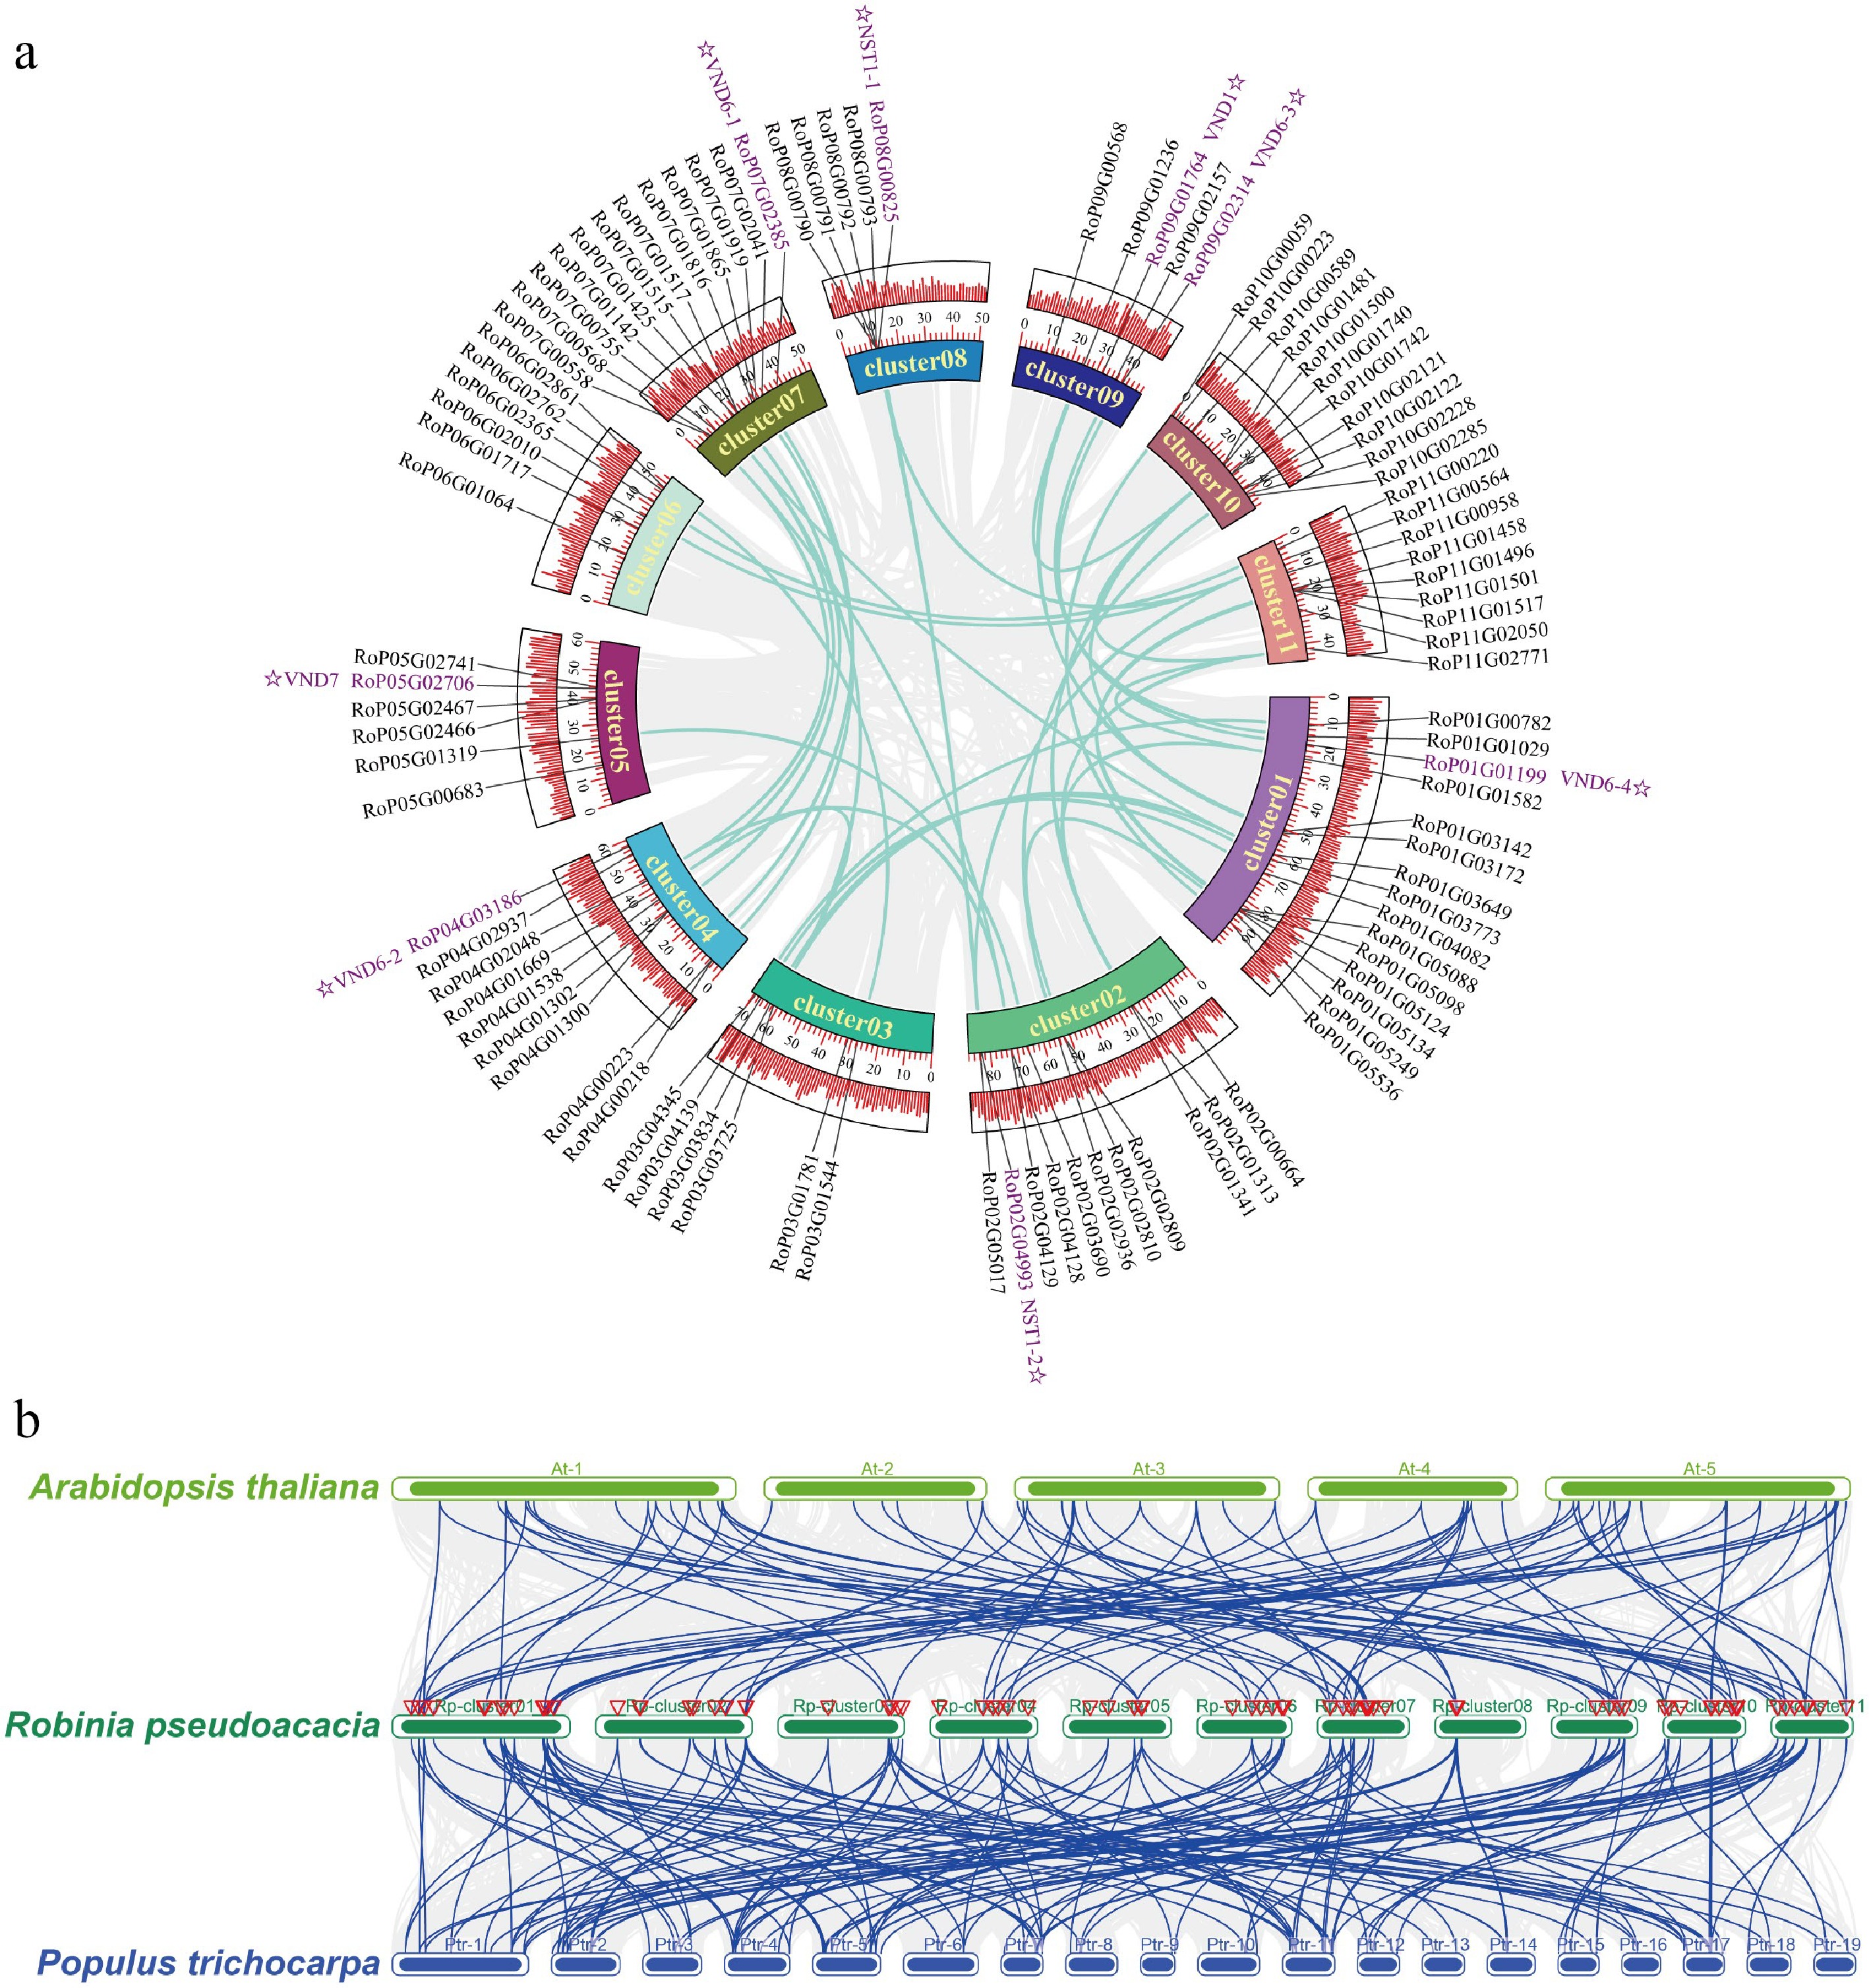
Figure 4.
Intra-species and inter-species collinearity analysis of NAC genes in Robinia pseudoacacia, Arabidopsis thaliana, and Populus trichocarpa. (a) Intra-specific collinearity analysis of NAC genes in Robinia pseudoacacia. (b) Interspecific collinearity analysis of NAC genes among R. pseudoacacia, P. trichocarpa, and A. thaliana.
-
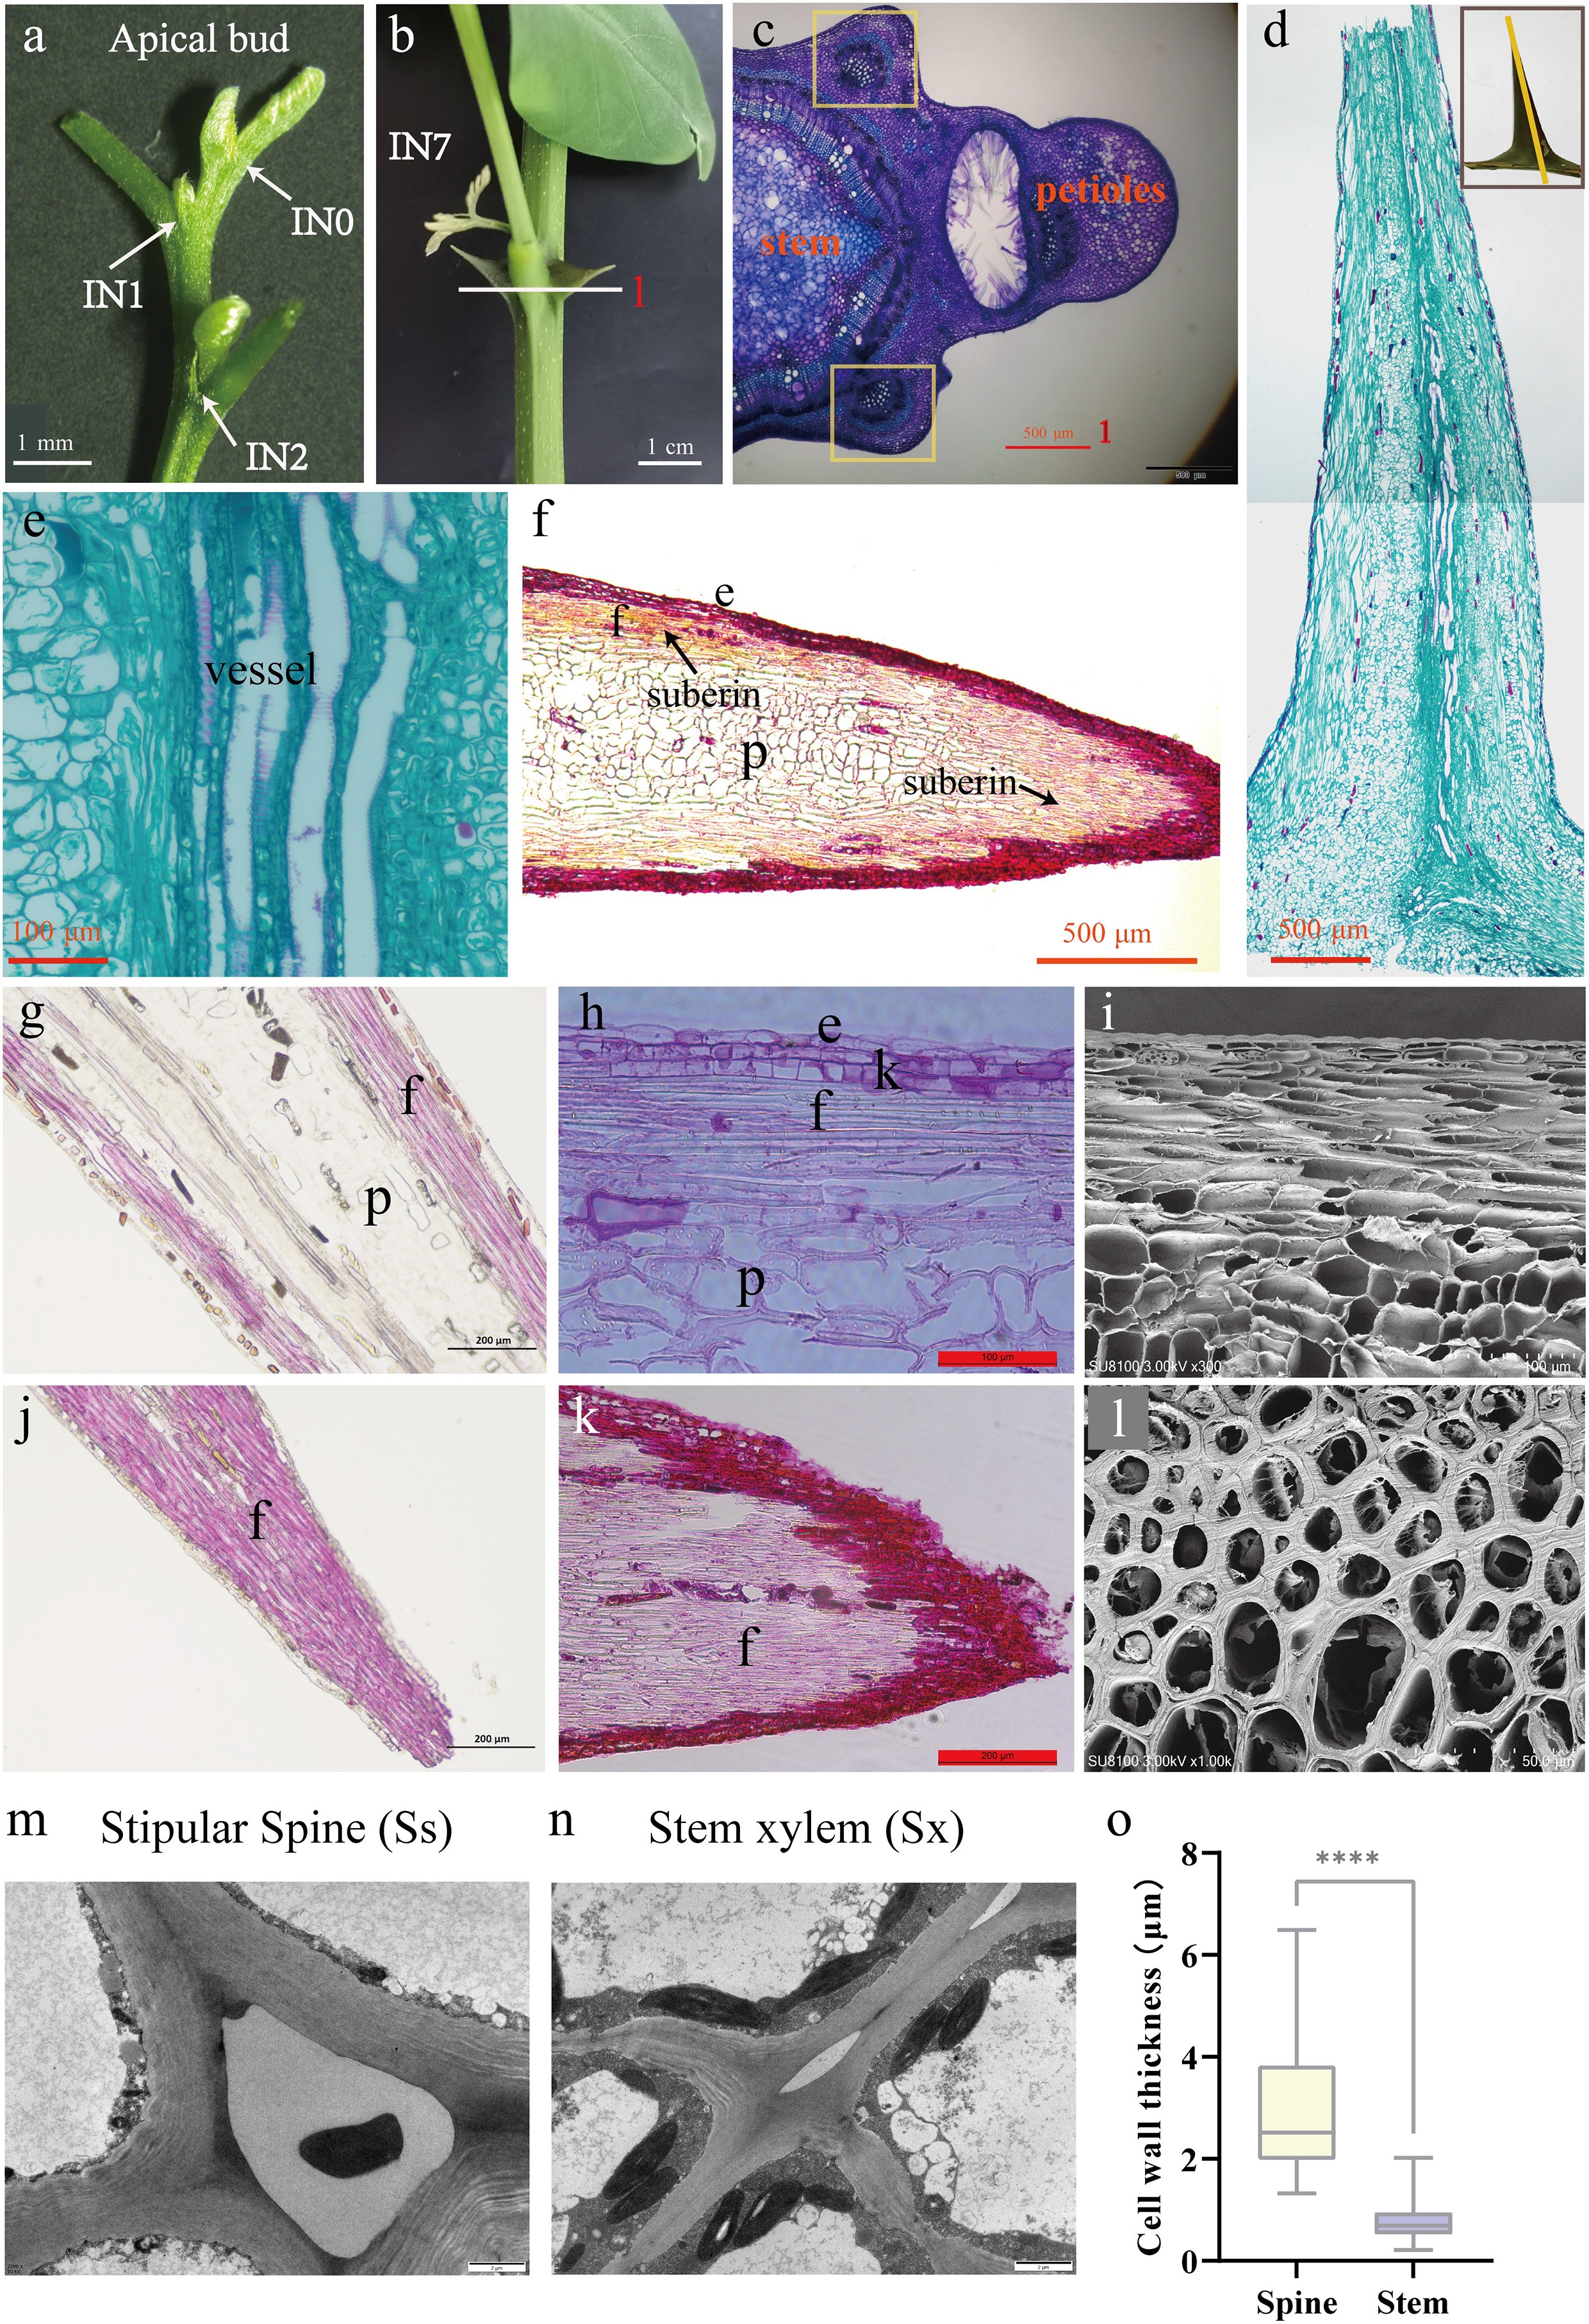
Figure 5.
Stipular spines in Robinia pseudoacacia variety AGT. (a) The apical bud of AGT, a large-spined clonal line of R. pseudoacacia. (b) The large stipular spines of AGT(IN7). (c) Cross-section of the internode, scale bar 500 μm. (d) Longitudinal section of stipular spine, scale bar 500 μm. (e) vascular tissue of stipular spine. Scale bar 100 μm. (f) Longitudinal section of perennial stipular spine, scale bar 500 μm. (g) Longitudinal section of the middle part of stipular spines stained with phloroglucinol, scale bar 200 μm. (h) Longitudinal section of the middle part of stipular spines stained with safranin, scale bar 100 μm. (i) Electron micrograph of the longitudinal section of stipular spines, scale bar 100 μm. (j) Longitudinal section of the tip part of stipular spines stained with phloroglucinol, scale bar 200 μm. (k) Longitudinal section of the tip part of stipular spines stained with safranin, scale bar 200 μm. (l) Electron micrograph of the cross-section of stipular spines, scale bar 500 μm. (m) Transmission electron microscope (TEM) images of stipular spine cells. (n) Transmission electron microscope (TEM) images of stem cells. (o) Cell wall thickness of fiber cells in stem xylem (Sx) and stipular spine (Ss). The asterisks indicate the significance (**** p < 0.001, the Student’s t-test).
-
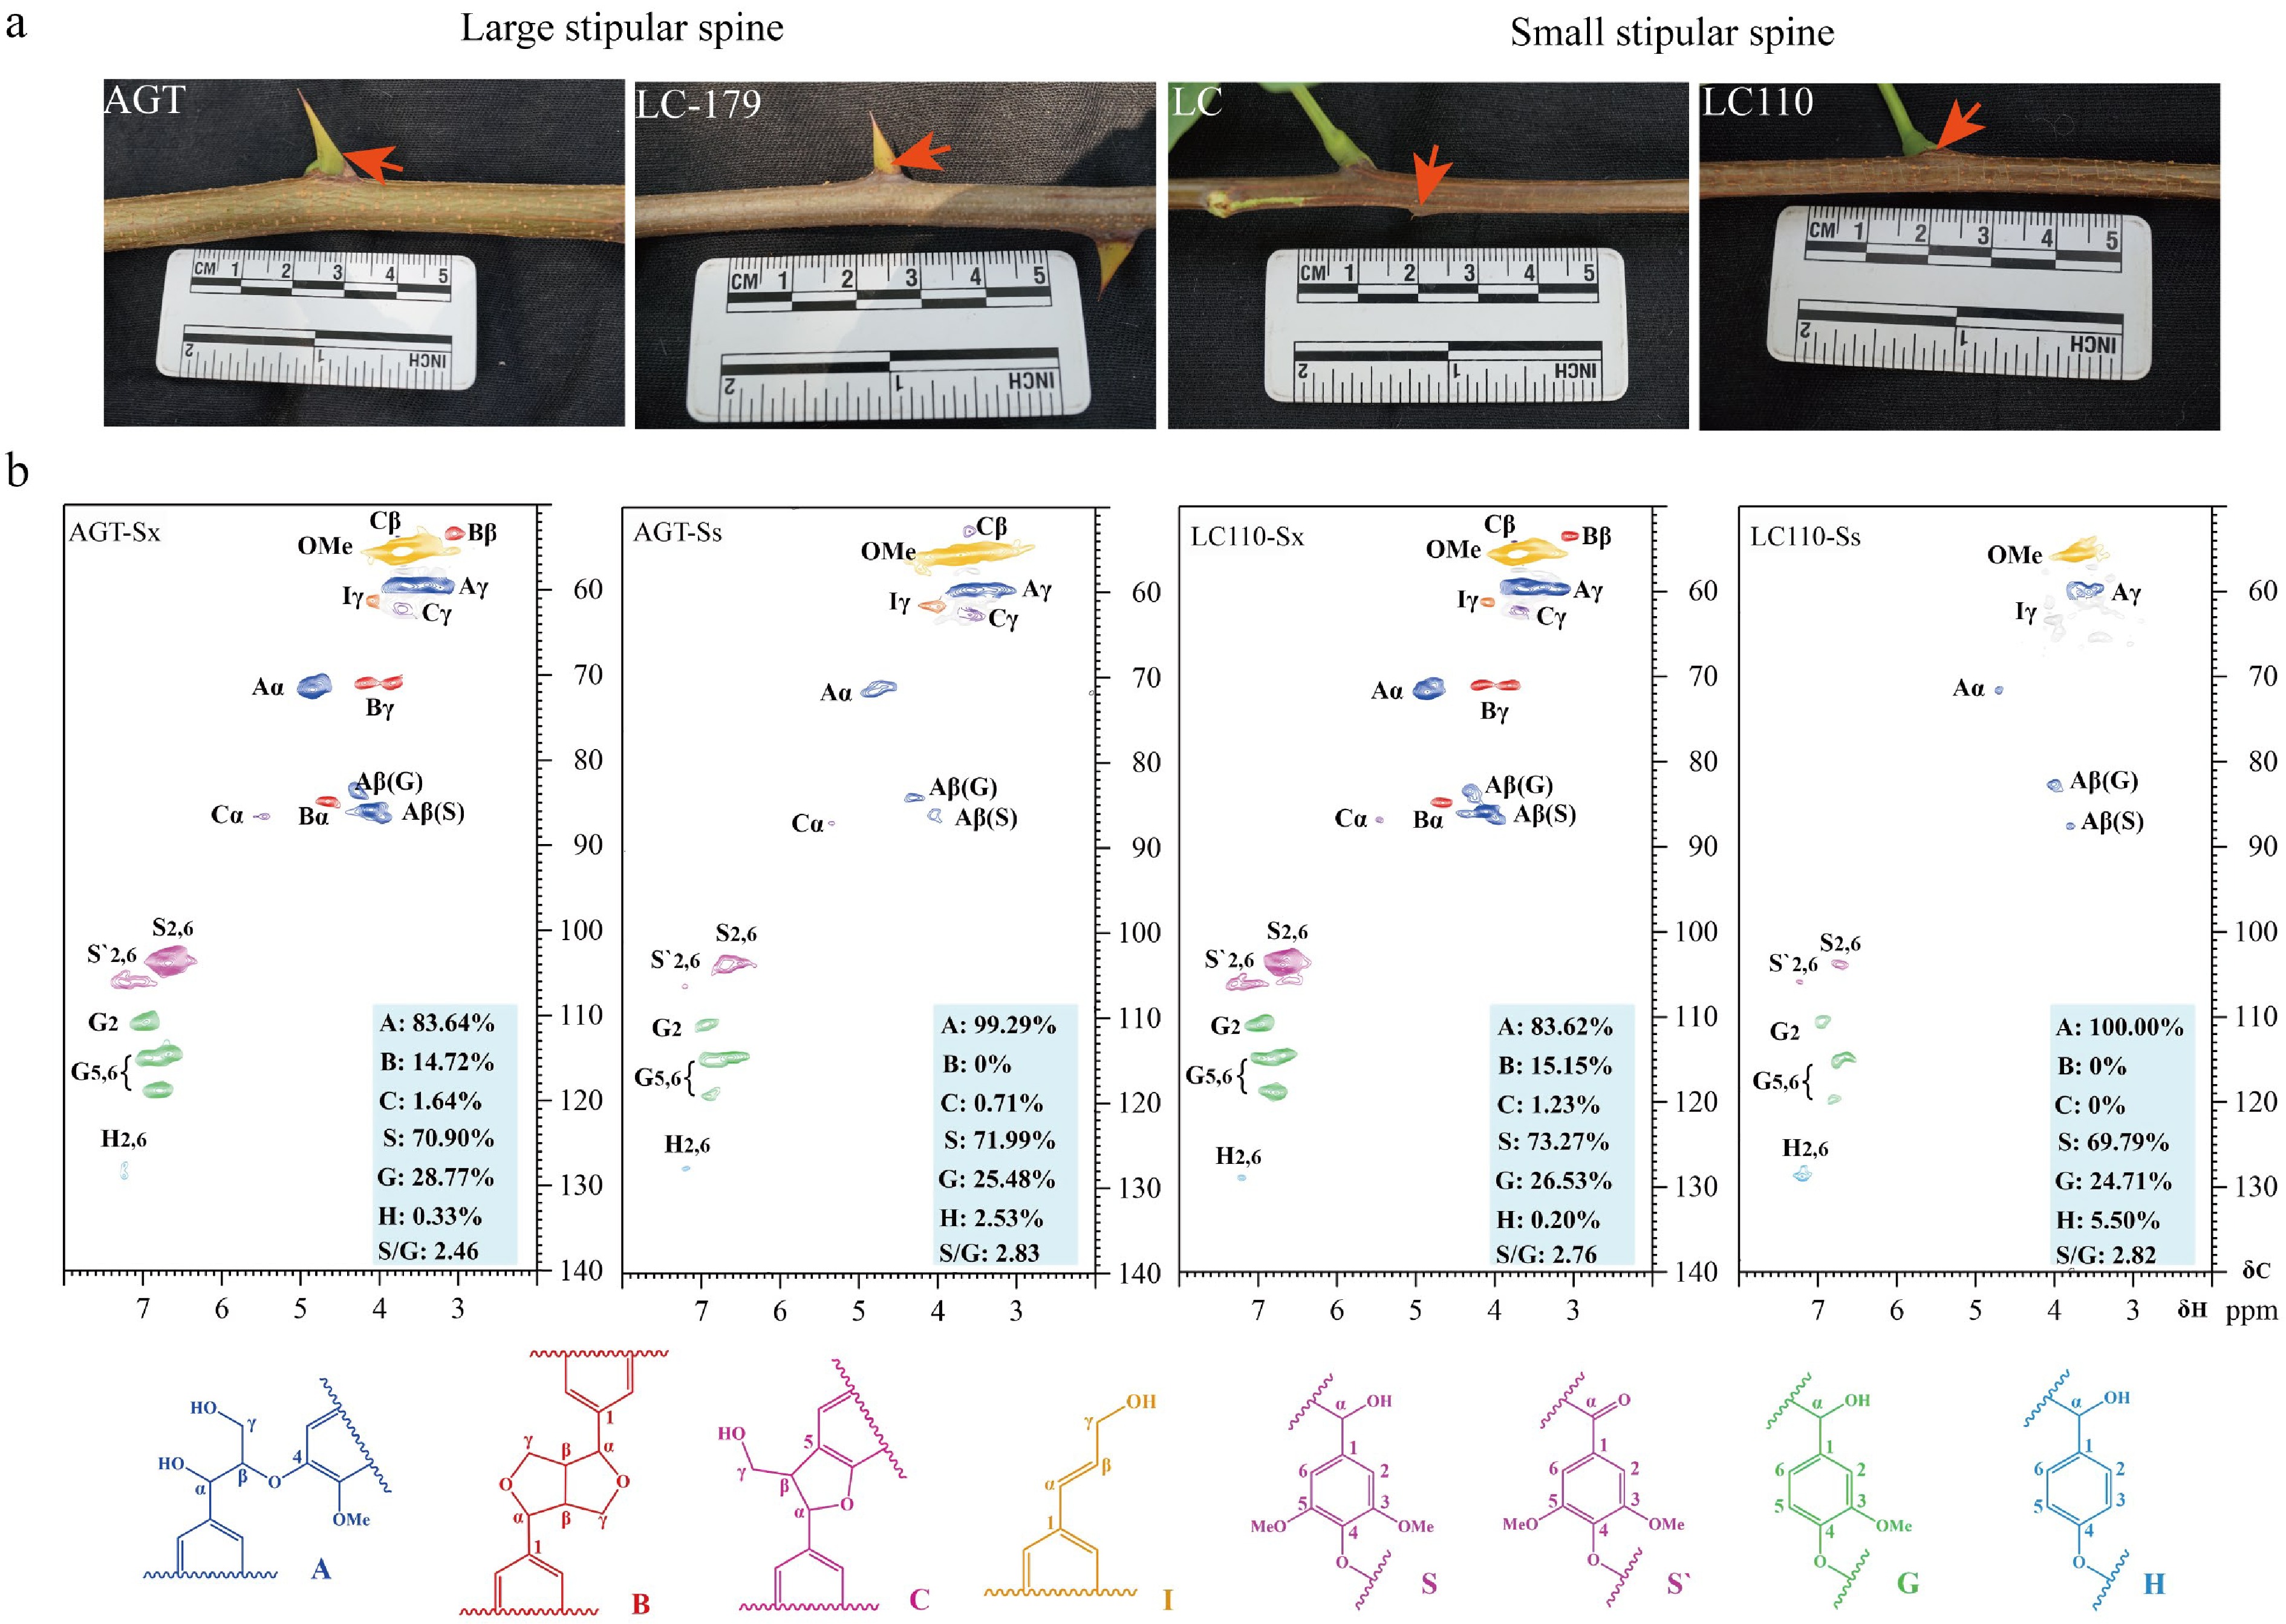
Figure 6.
Lignin accumulation in stipular spines and stems of Robinia pseudoacacia. (a) Photos show the stipular spines in large-spined (AGT and LC179) and small-spined (LC and LC110) varieties. (b) NMR analysis of stem xylem (Sx) and stipular spine (Ss) in the black locust varieties AGT and LC110.
-
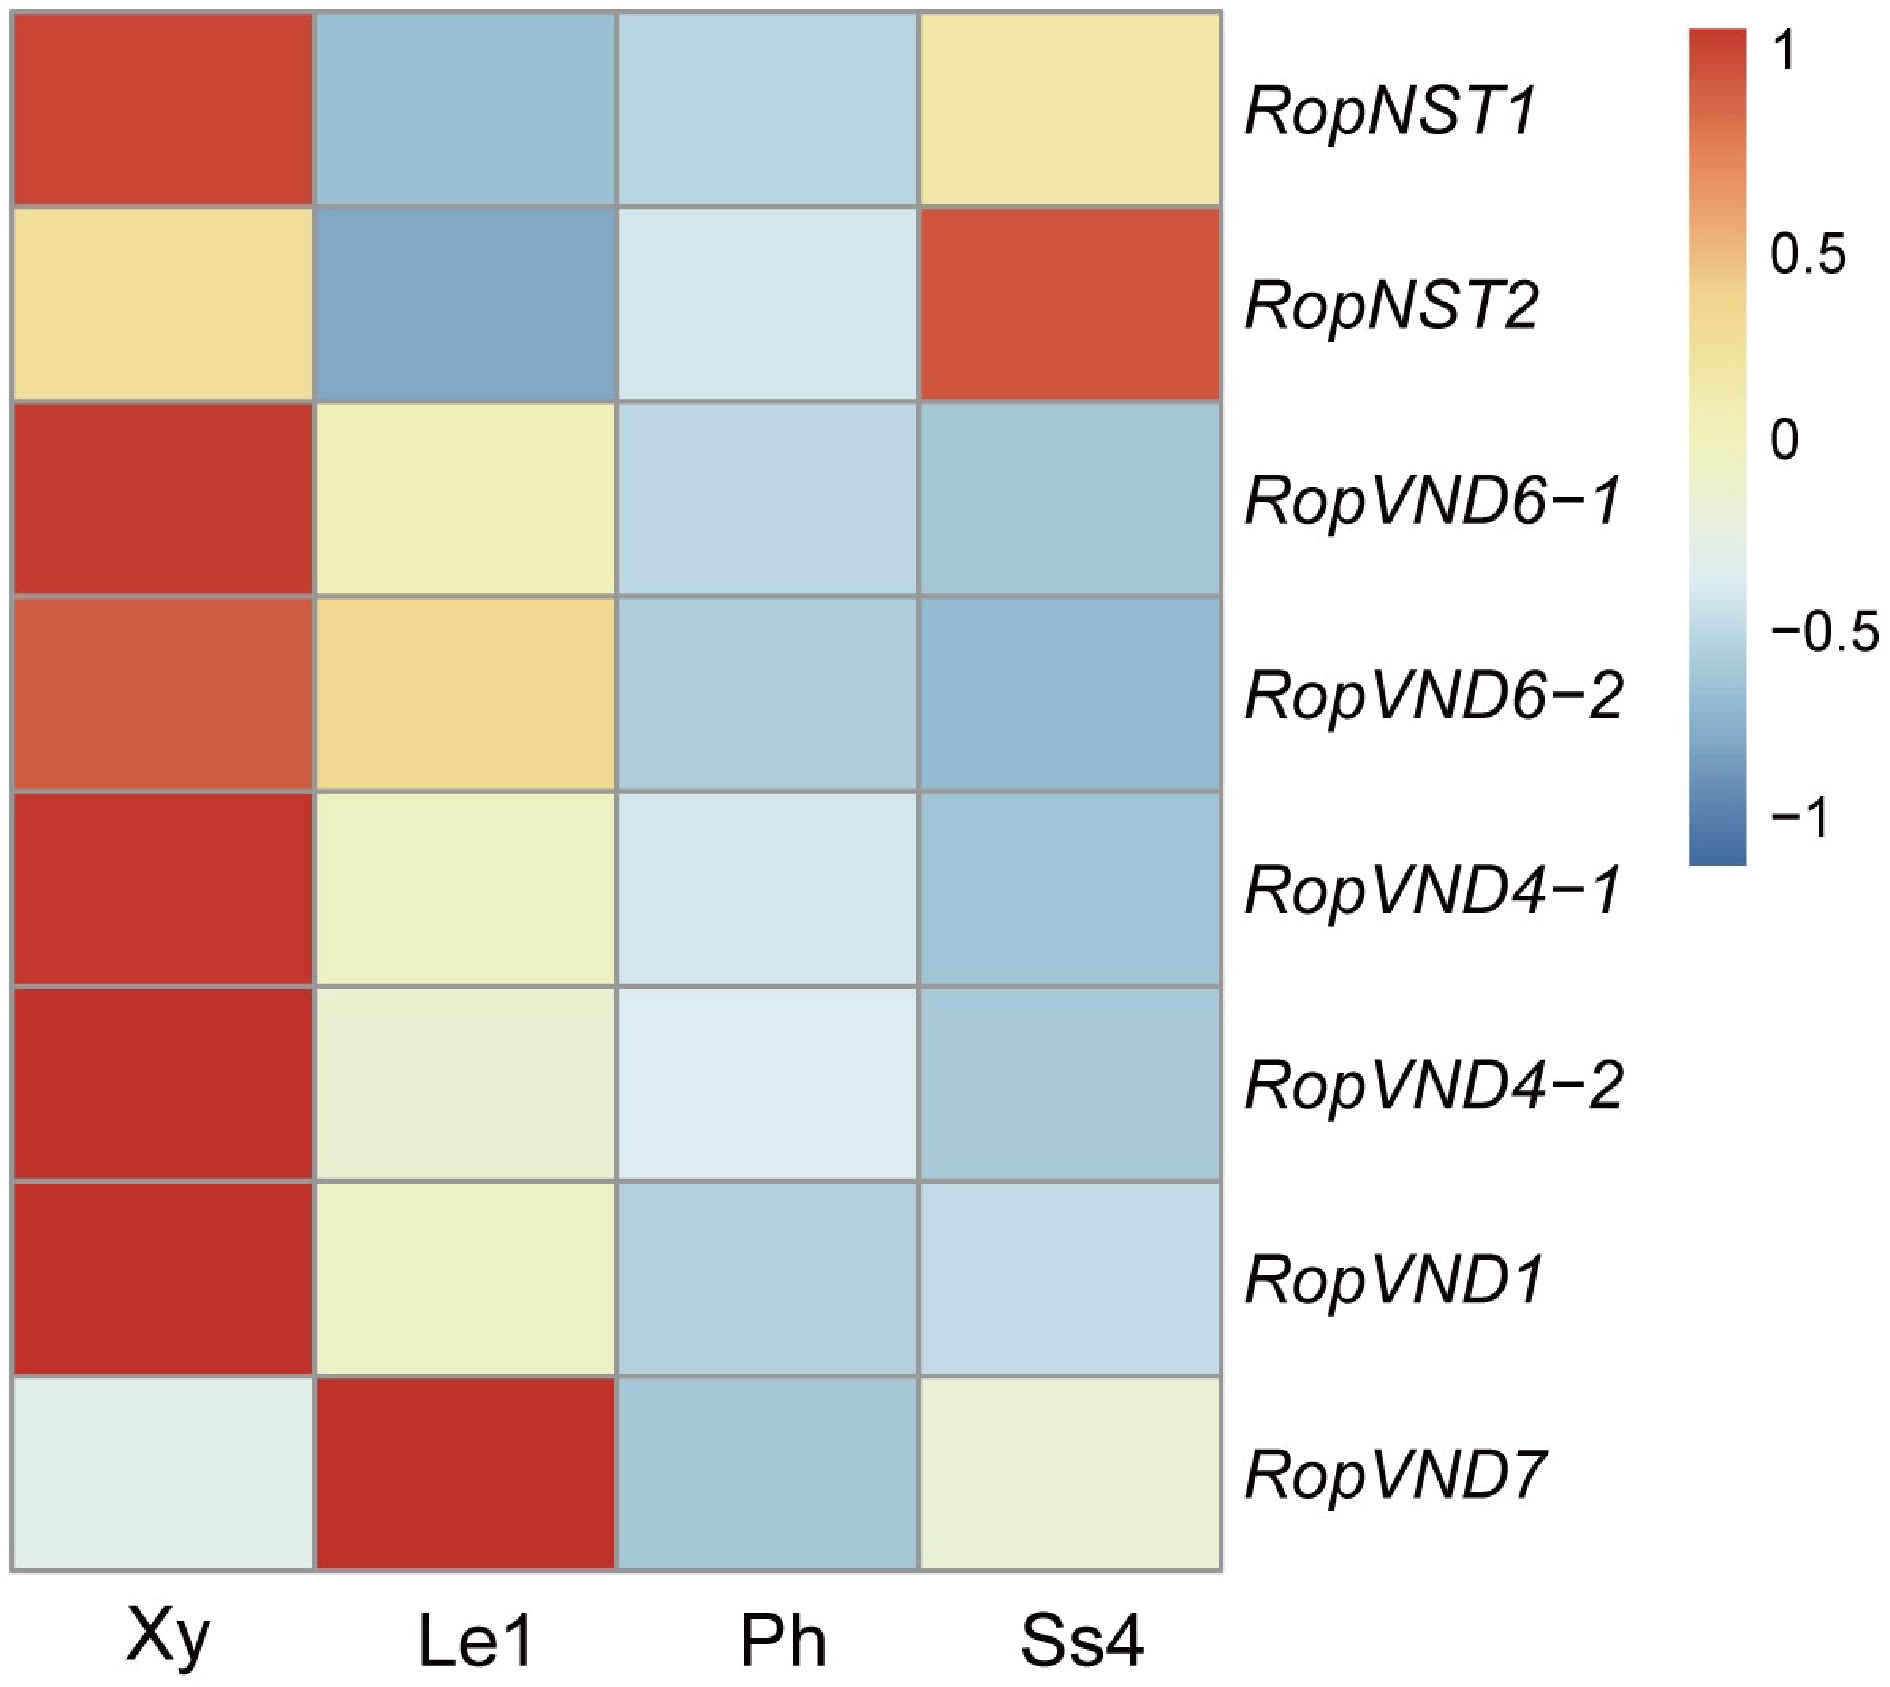
Figure 7.
Heat map shows the relative expression levels of six VND and two NST genes in developing xylem (Xy), leaf stage 1 (Le1), phloem (Ph) and stipular spine stage 4 (Ss4) of R. pseudoacacia. Fragments per kilobase million (FPKM) values were normalized using the Z-score method. 'Rop' is the abbreviation of Robinia pseudoacacia, representing the species-specific genes of this plant.
-
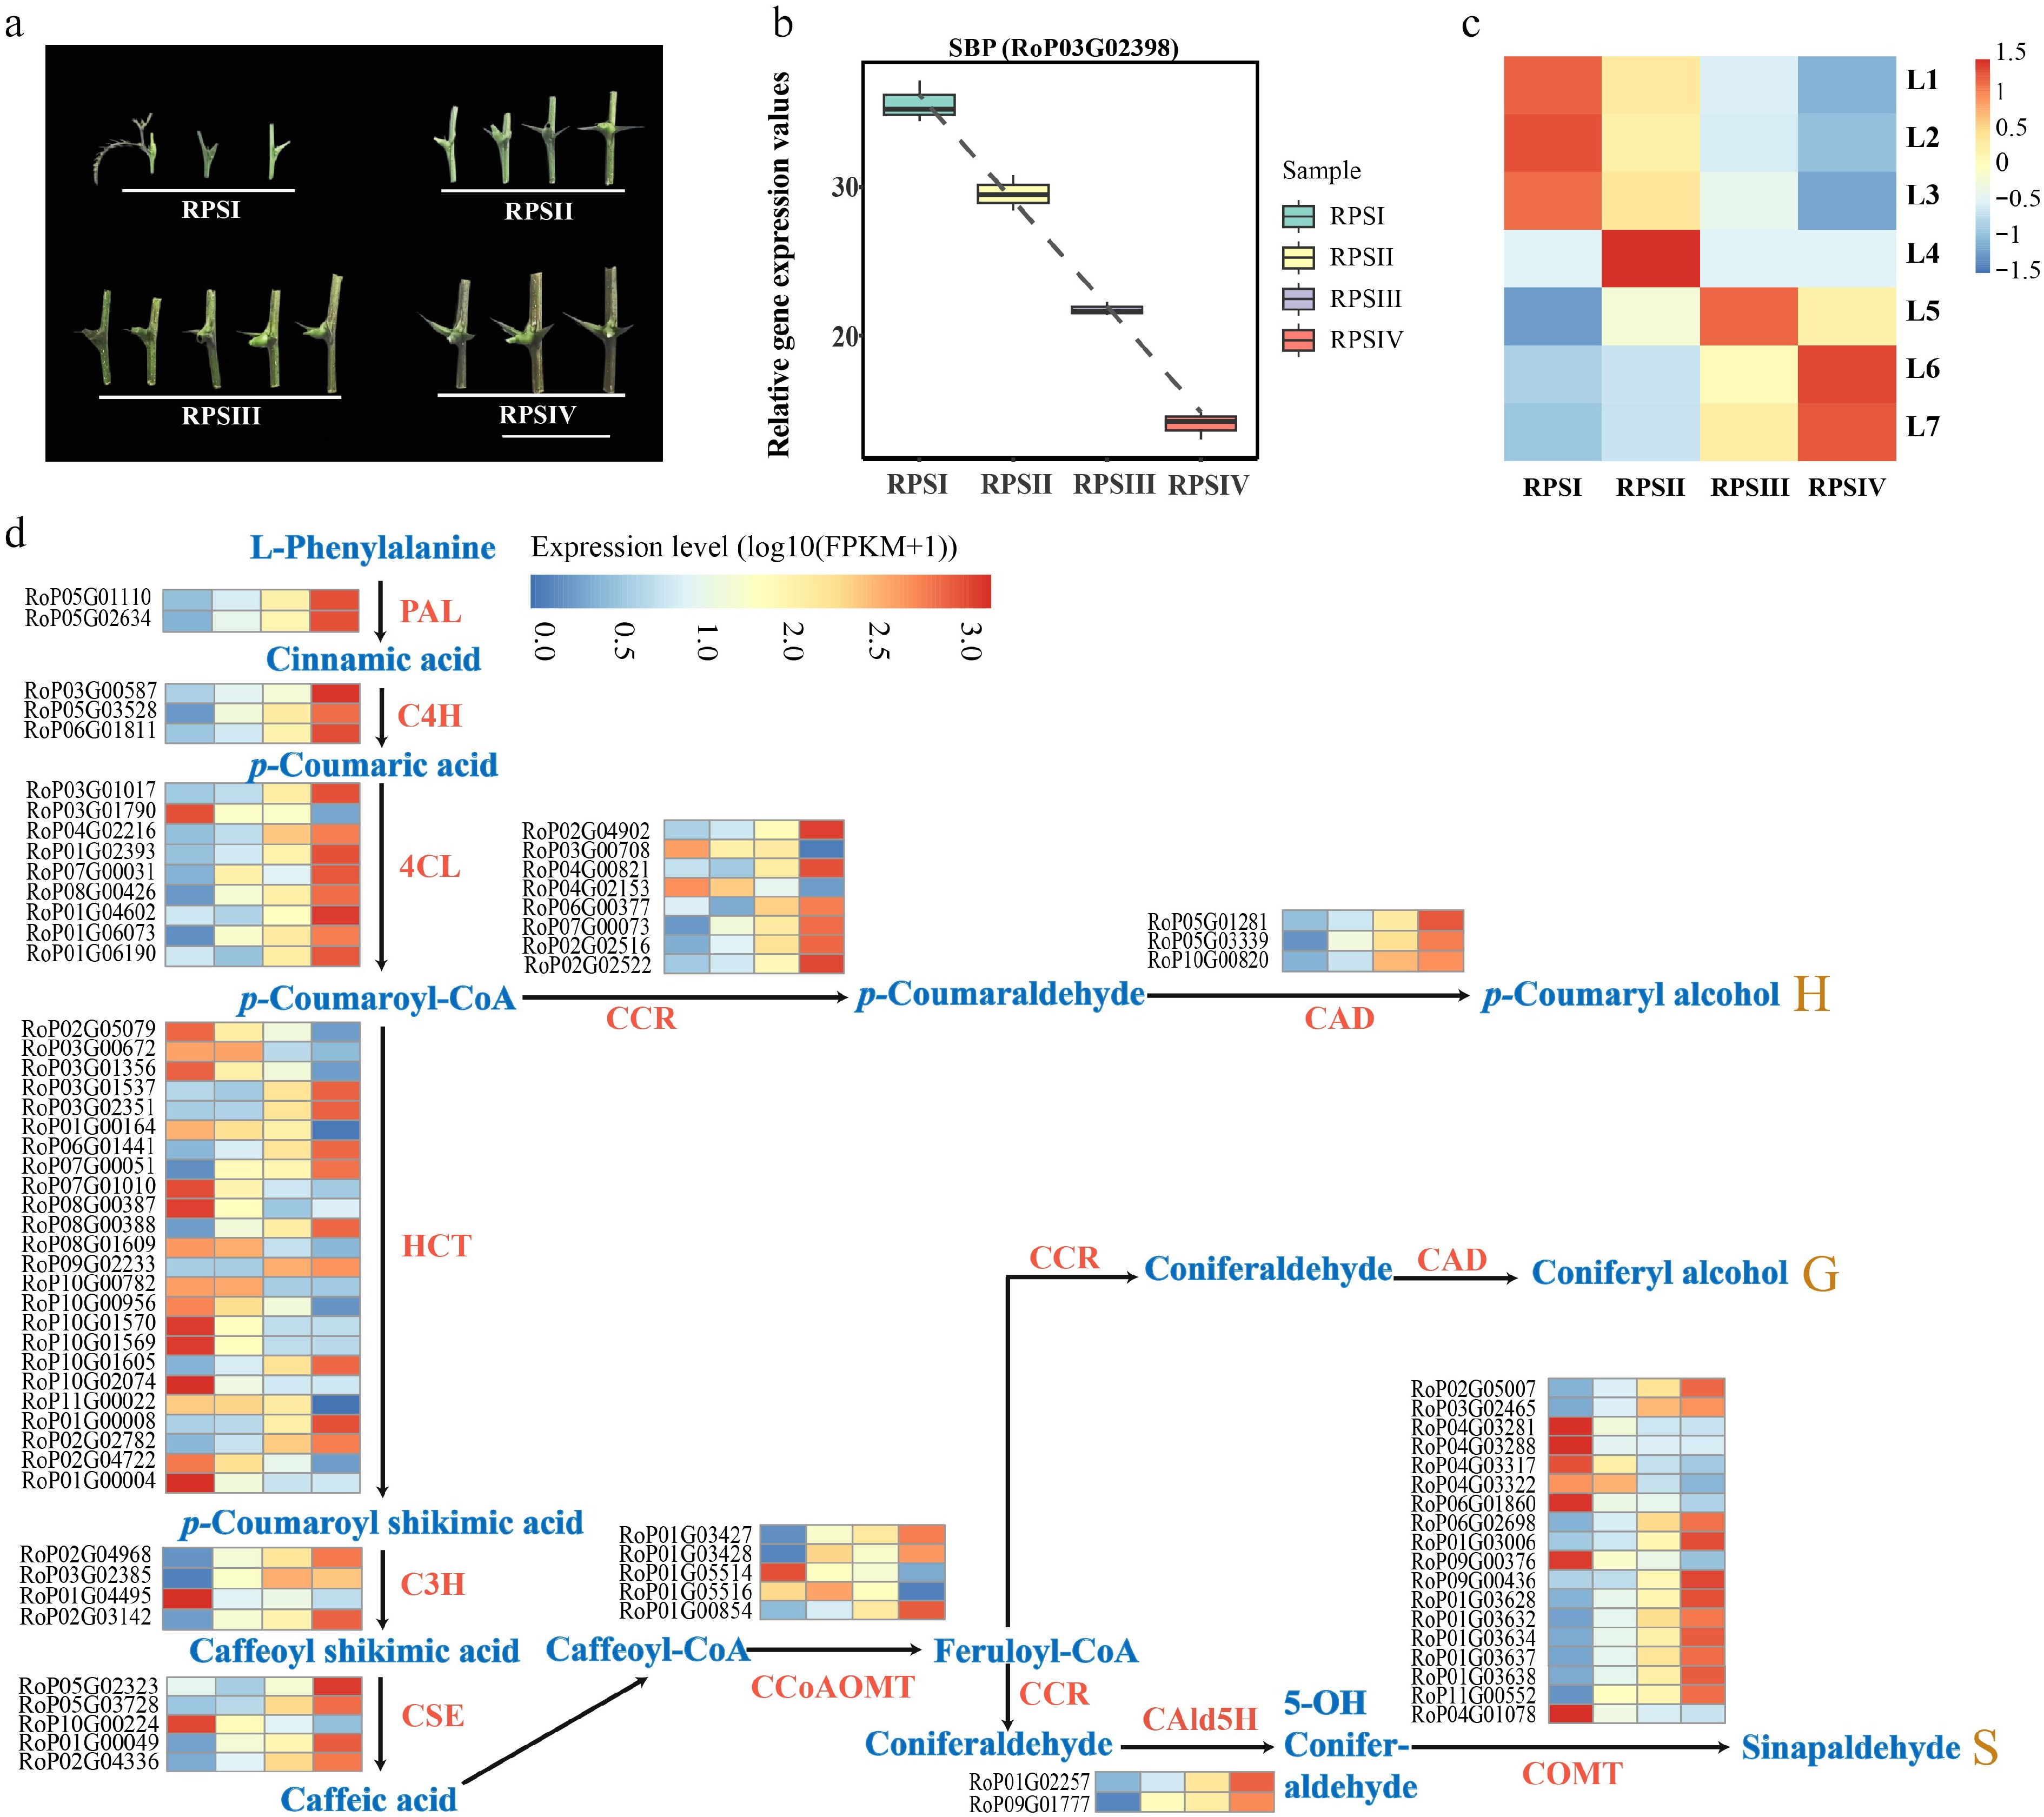
Figure 8.
Gene expression analysis in different developmental stage of stipular spines. (a) Four different developmental stages of stipular spines, including RPSI (1st to 3rd pair of stipular spines, counting from top), RPSII (the 5th pair), RPSIII (the 7th pair), and RPSIV (the 10th pair). (b) Relative expression values of SBP (RoP03G02398) which was used as the bait gene. (c) The heatmap of normalized TPMs (z-scores color-coded) at each time point is shown. (d) Heat map show the expression levels of differentially expressed enzyme genes of monolignol biosynthetic pathway. Blue color indicates low expression levels and red color indicates high expression levels. Abbreviations used in the figure: PAL, Phenylalanine Ammonia-Lyase; C4H, Cinnamate 4-Hydroxylase; 4CL, 4-Coumarate: CoA Ligase; CCR, Cinnamoyl CoA Reductase; CAD, Cinnamyl Alcohol Dehydrogenase; HCT, Hydroxycinnamoyl-CoA Shikimate/Quinate Hydroxycinnamoyl Transferase; C3H, p-Coumarate 3-Hydroxylase; CSE, Coumarate 5-Hydroxylase; CCoAOMT, Caffeoyl CoA O-Methyltransferase; CAld5H, Coumaraldehyde 5-Hydroxylase; COMT, Caffeic Acid O-Methyltransferase.
-
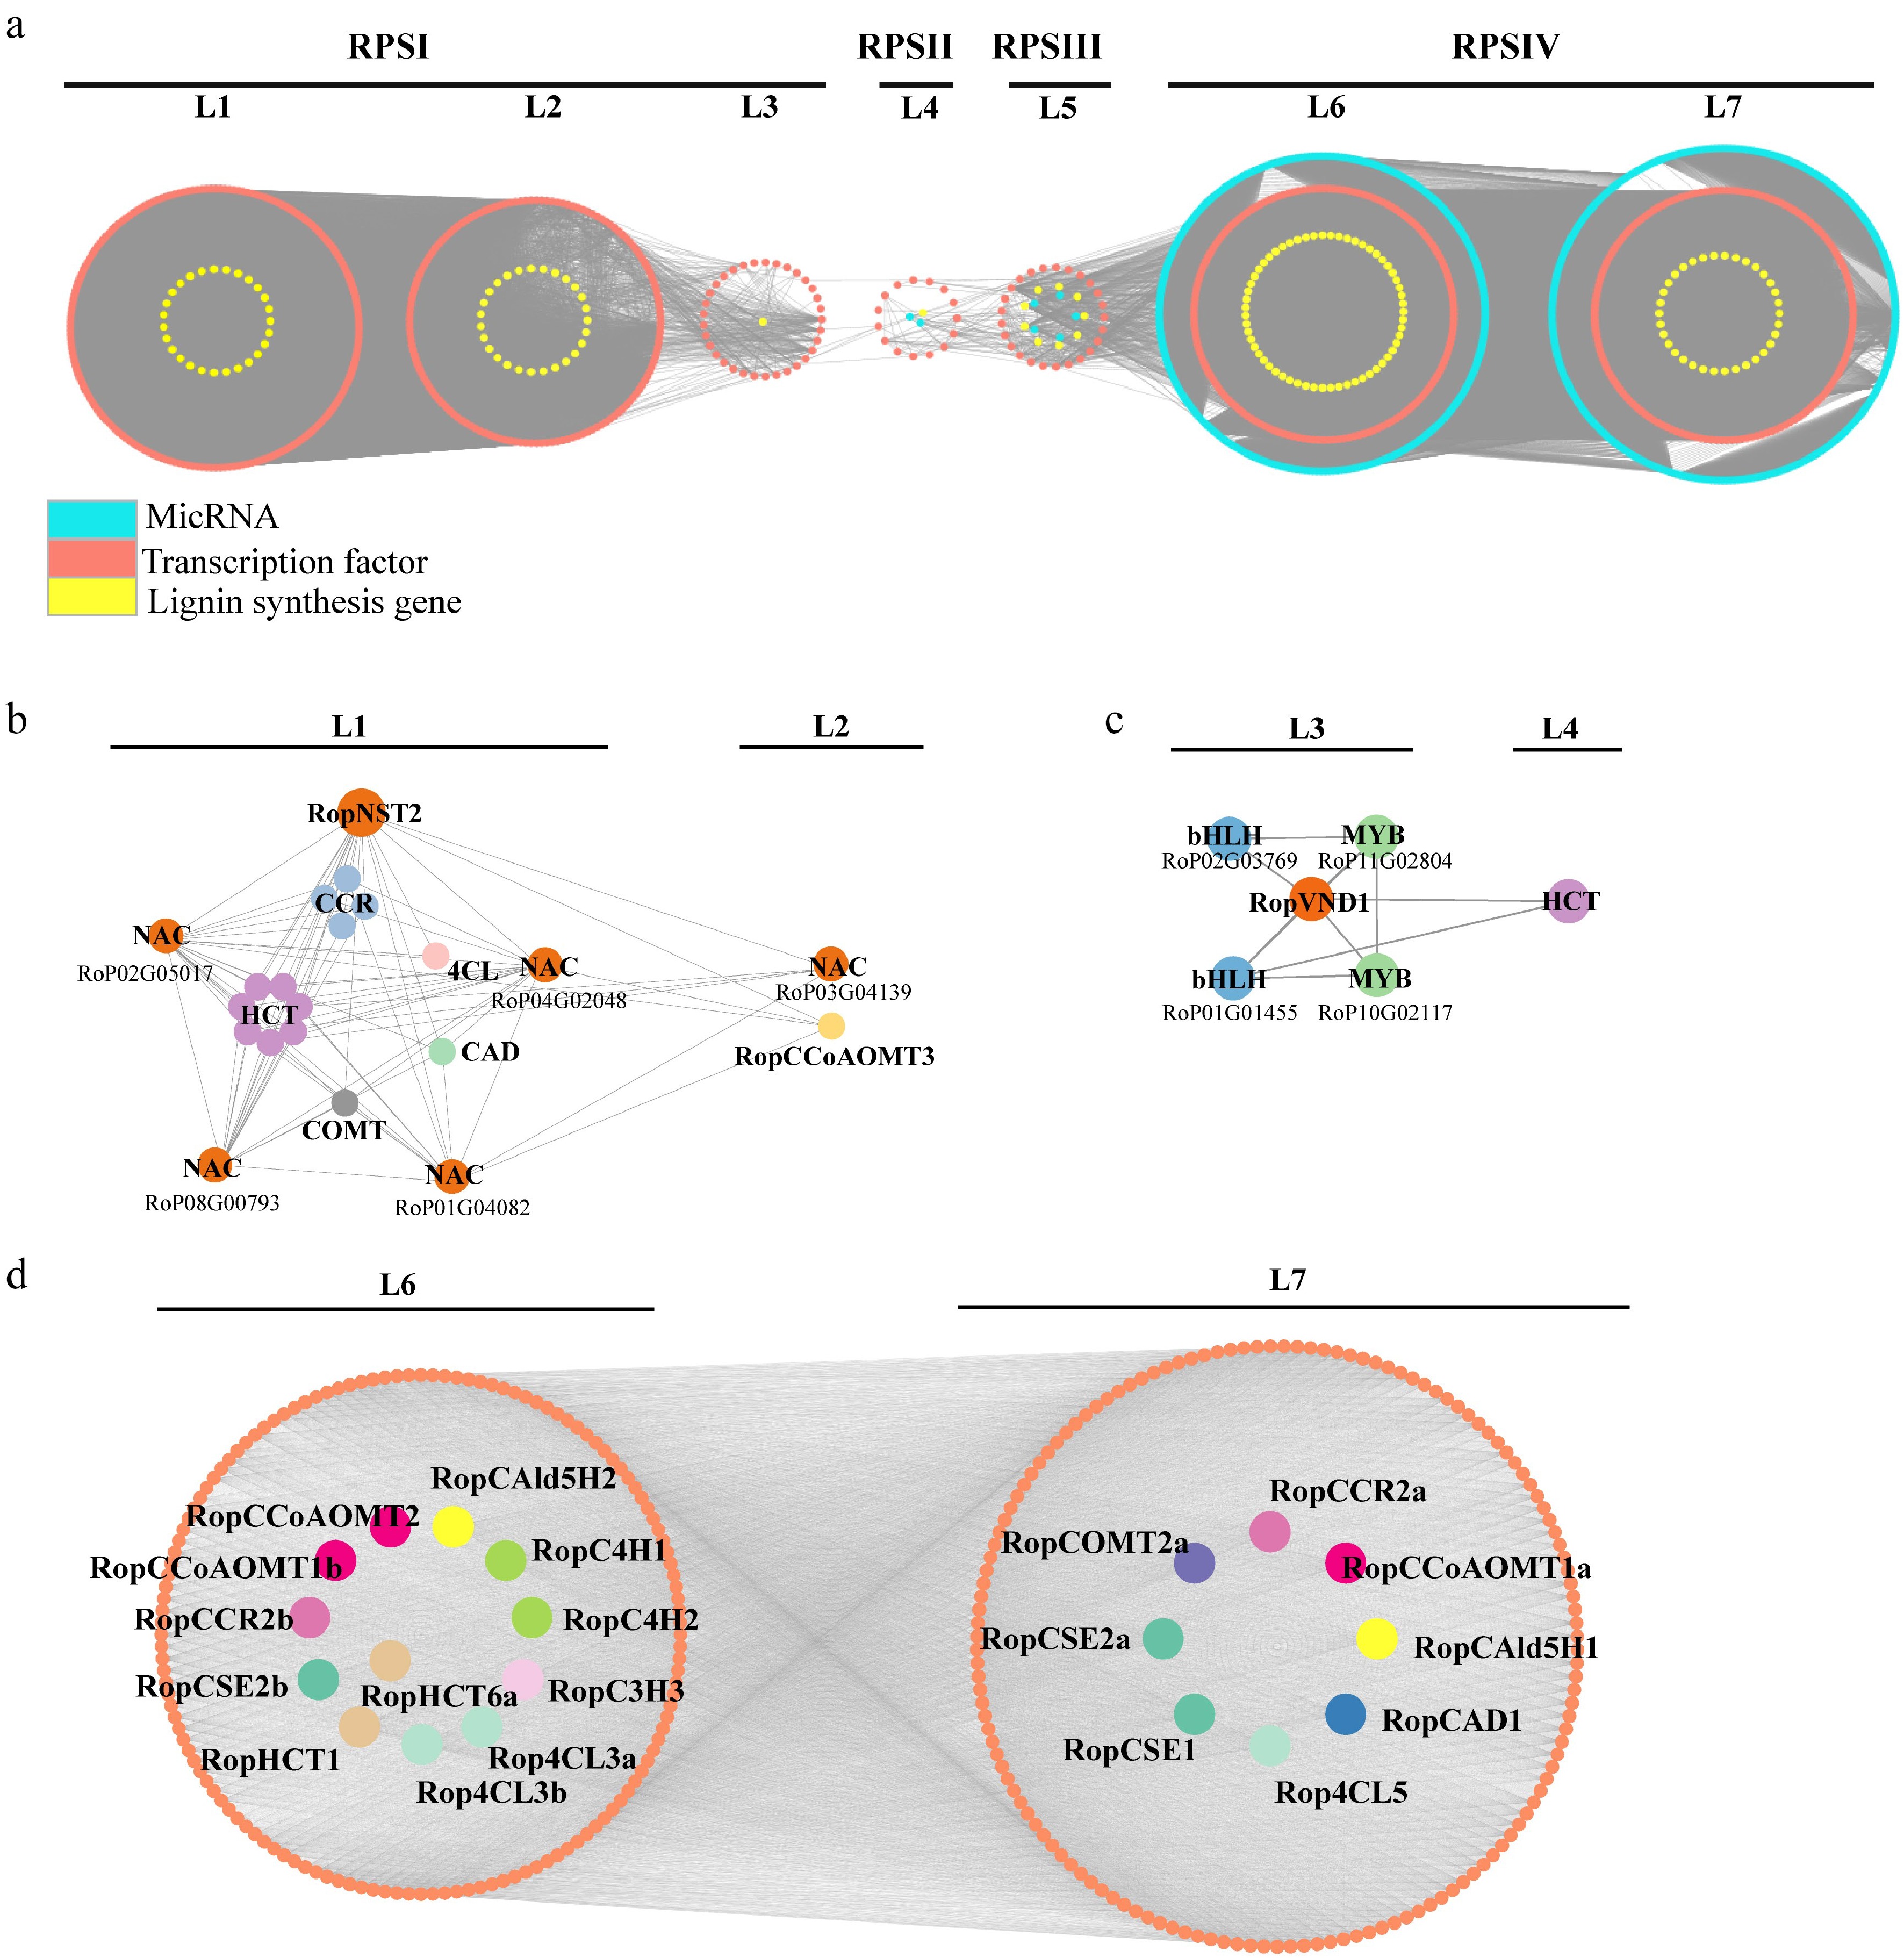
Figure 9.
Regulatory subnetwork of lignin biosynthesis. (a) Stipular spine development-related temporal gene co-expression network. L1–L7 represent seven levels based on the expression level of the seed gene. L1–L3 corresponds to the RPSI period, L4 corresponds to the RPSII period, Level 5 corresponds to the RPSIII period, and L6 and L7 corresponds to the RPSIV period. Orange circle indicates the genes related to lignin biosynthesis, yellow circle indicates transcription factors, and turquoise circle indicates miRNA. (b) Subnetwork of lignin biosynthesis-related genes regulated by RopNST2 at L1 and L2. The members for the 4CL, HCT, CCR, CAD, and COMT include Rop4CL12b, RopHCT13b/79/48/14b/20/86/9a, RopCCR3b/16/24/5a, RopCAD19, and RopCOMT37, respectively. (c) Subnetwork of lignin biosynthesis-related enzyme gene and transcription factors regulated by RopVND1 at L3 and L4. (d) Subnetwork of lignin biosynthesis-related genes at L6 and L7 levels, where orange circles represent transcription factors, and different lignin genes are represented by circles with different colors. The prefix 'Rop' in the gene names is the abbreviation of Robinia pseudoacacia.
-
Sample Klason
lignin (%)Acid-soluble
lignin (%)Total
lignin (%)Significance
(Sx vs Ss)AGT-Sx 22.43 5.56 27.99 ± 0.35 a AGT-Ss 43.36 5.21 48.57 ± 0.55 b LC-Sx 19.31 5.26 24.57 ± 0.26 a LC-Ss 58.45 5.26 63.71 ± 0.33 b LC110-Sx 20.78 5.74 26.52 ± 0.51 a LC110-Ss 48.42 5.39 53.81 ± 0.44 b LC179-Sx 19.87 5.22 25.09 ± 0.28 a LC179-Ss 48.81 5.20 54.01 ± 0.41 b Statistical analysis was performed using paired t-test to compare lignin content between stem xylem (Sx) and stipular spine (Ss) of the same variety. AGT and LC179 are the varieties with large stipular spines, and LC and LC110 are the varieties with small stipular spines. Total lignin contents are presented as mean values ± SD, and the error bars represent standard deviation derived from three independent measurements. Different lowercase letters (a, b) in the 'Significance (Sx vs Ss)' column indicate highly significant differences at the p ≤ 0.001 level (consistent with the obvious numerical gap between Sx and Ss in each variety). Table 1.
The total lignin content of stem xylem and stipular spines in four varieties of Robinia pseudoacacia trees. Sx: Stem xylem; Ss: Stipular spine.
Figures
(9)
Tables
(1)