-
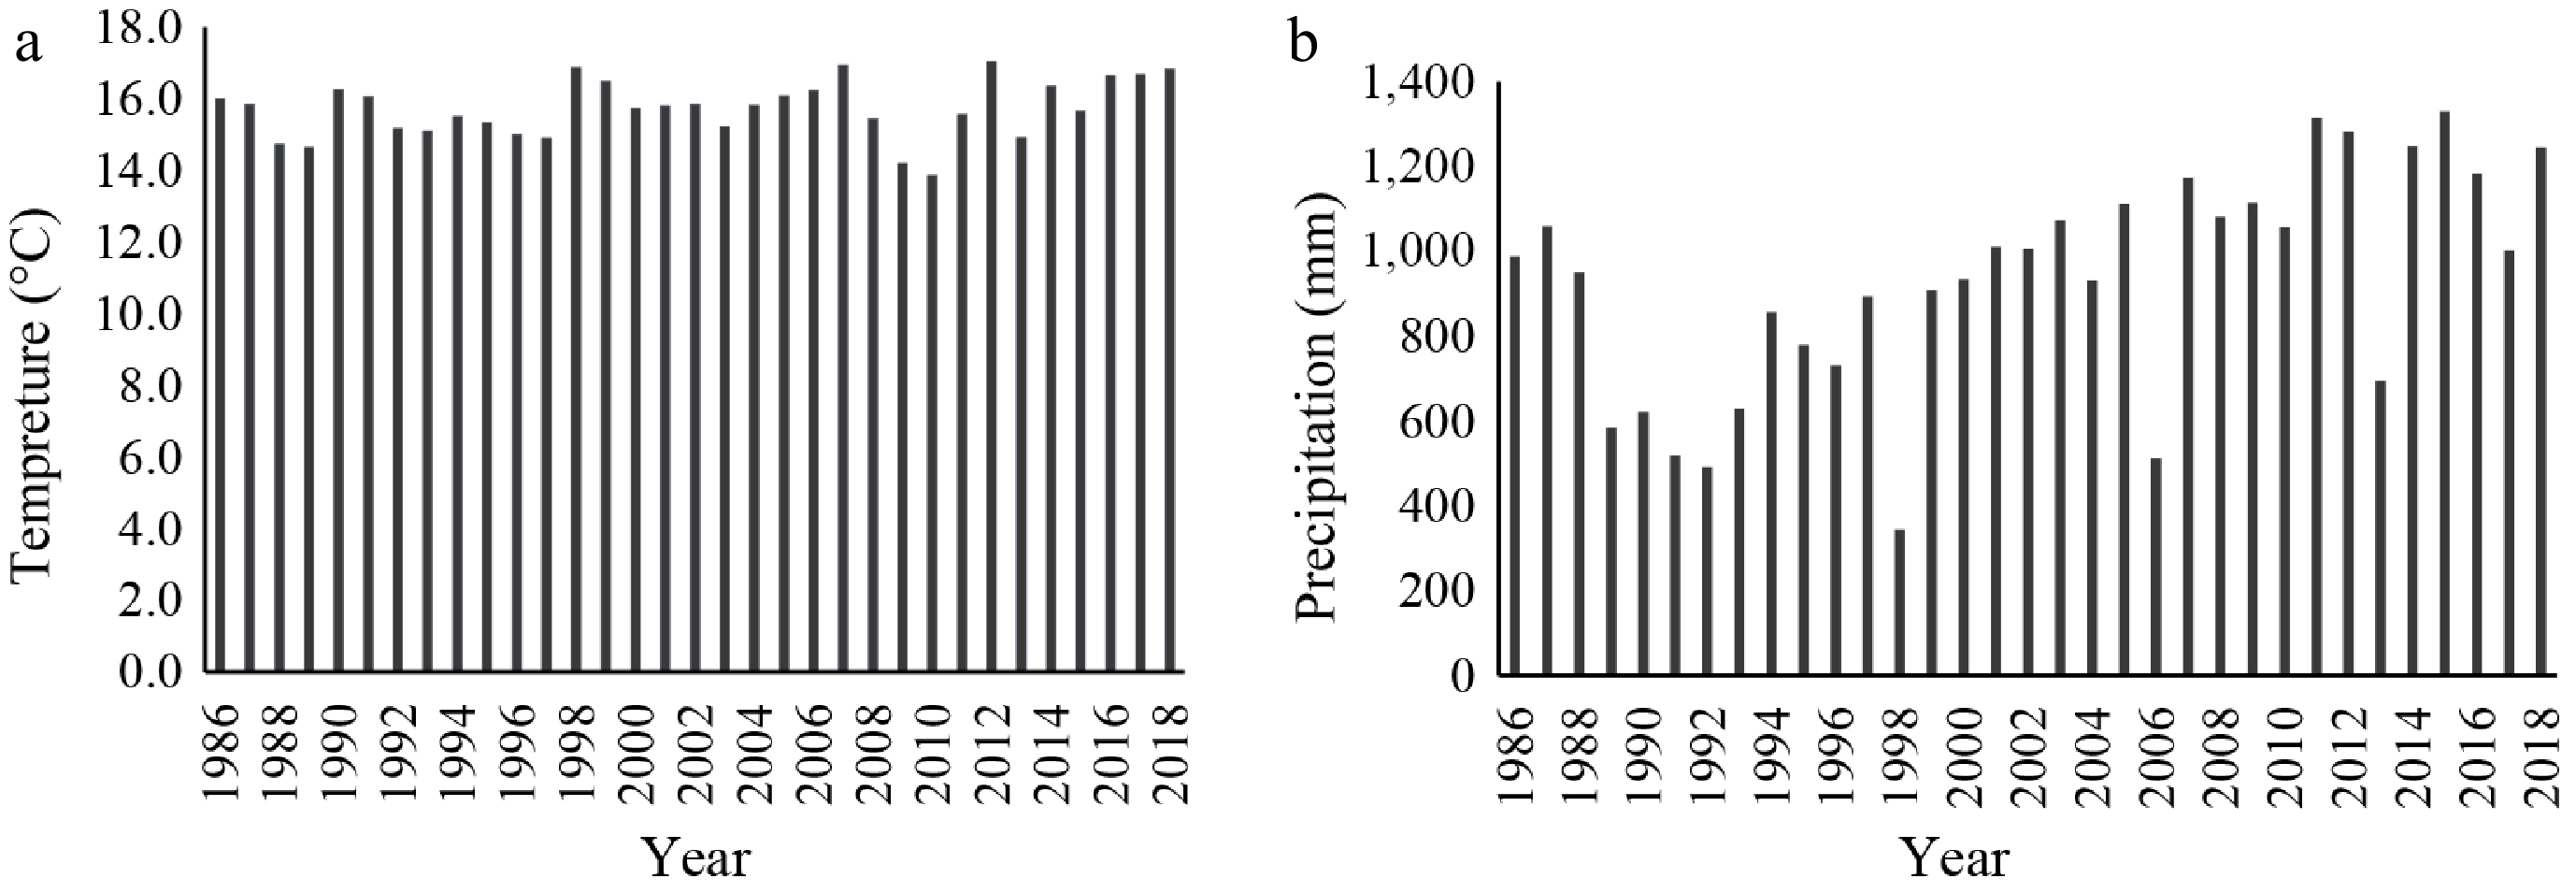
Figure 1.
(a) Annual temperatures, and (b) precipitation during 1986–2018 at Jackson, TN, USA.
-
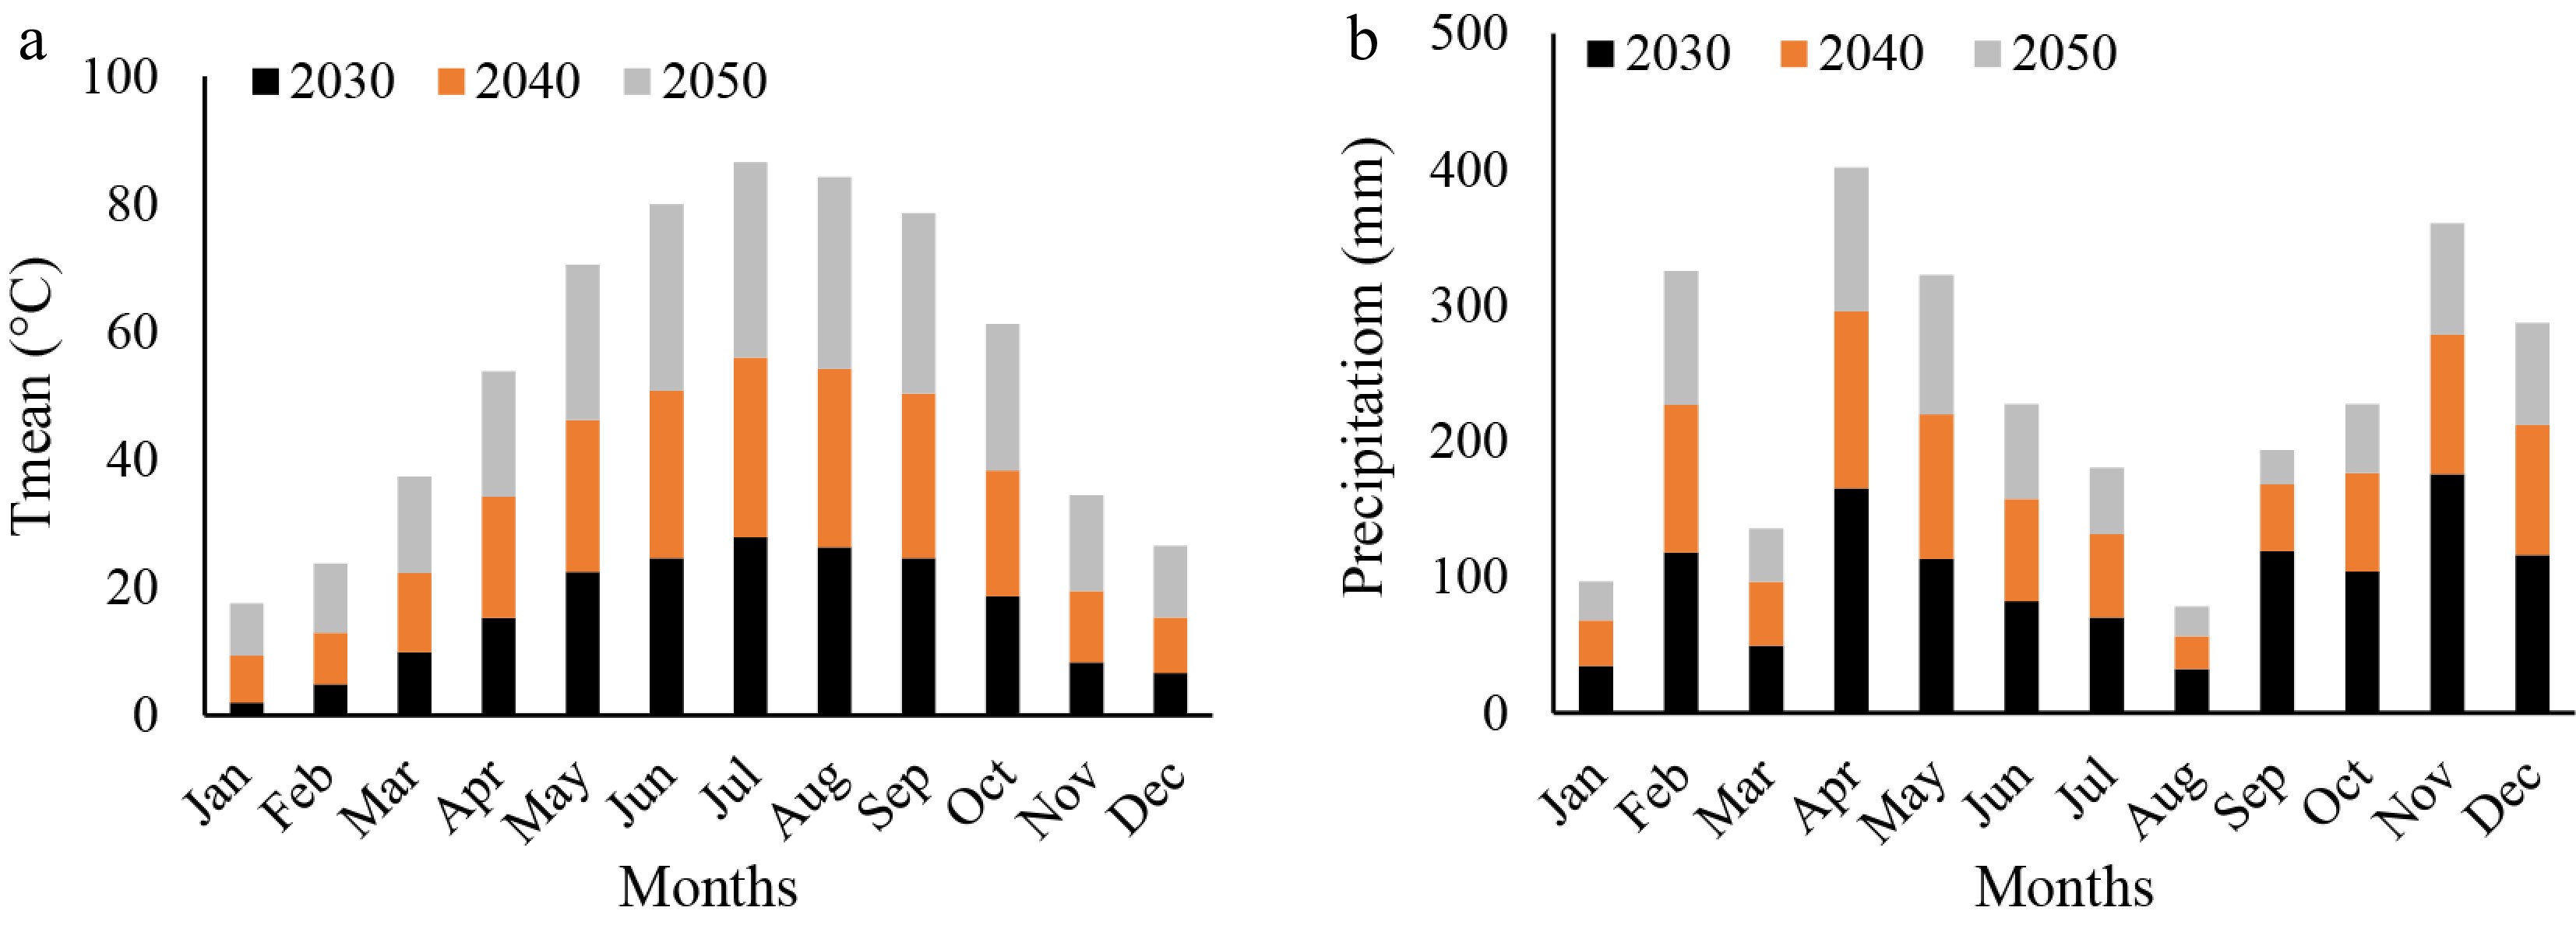
Figure 2.
(a) Monthly average temperature, and (b) precipitation during 2030, 2040, and 2050 in Jackson, TN, USA.
-
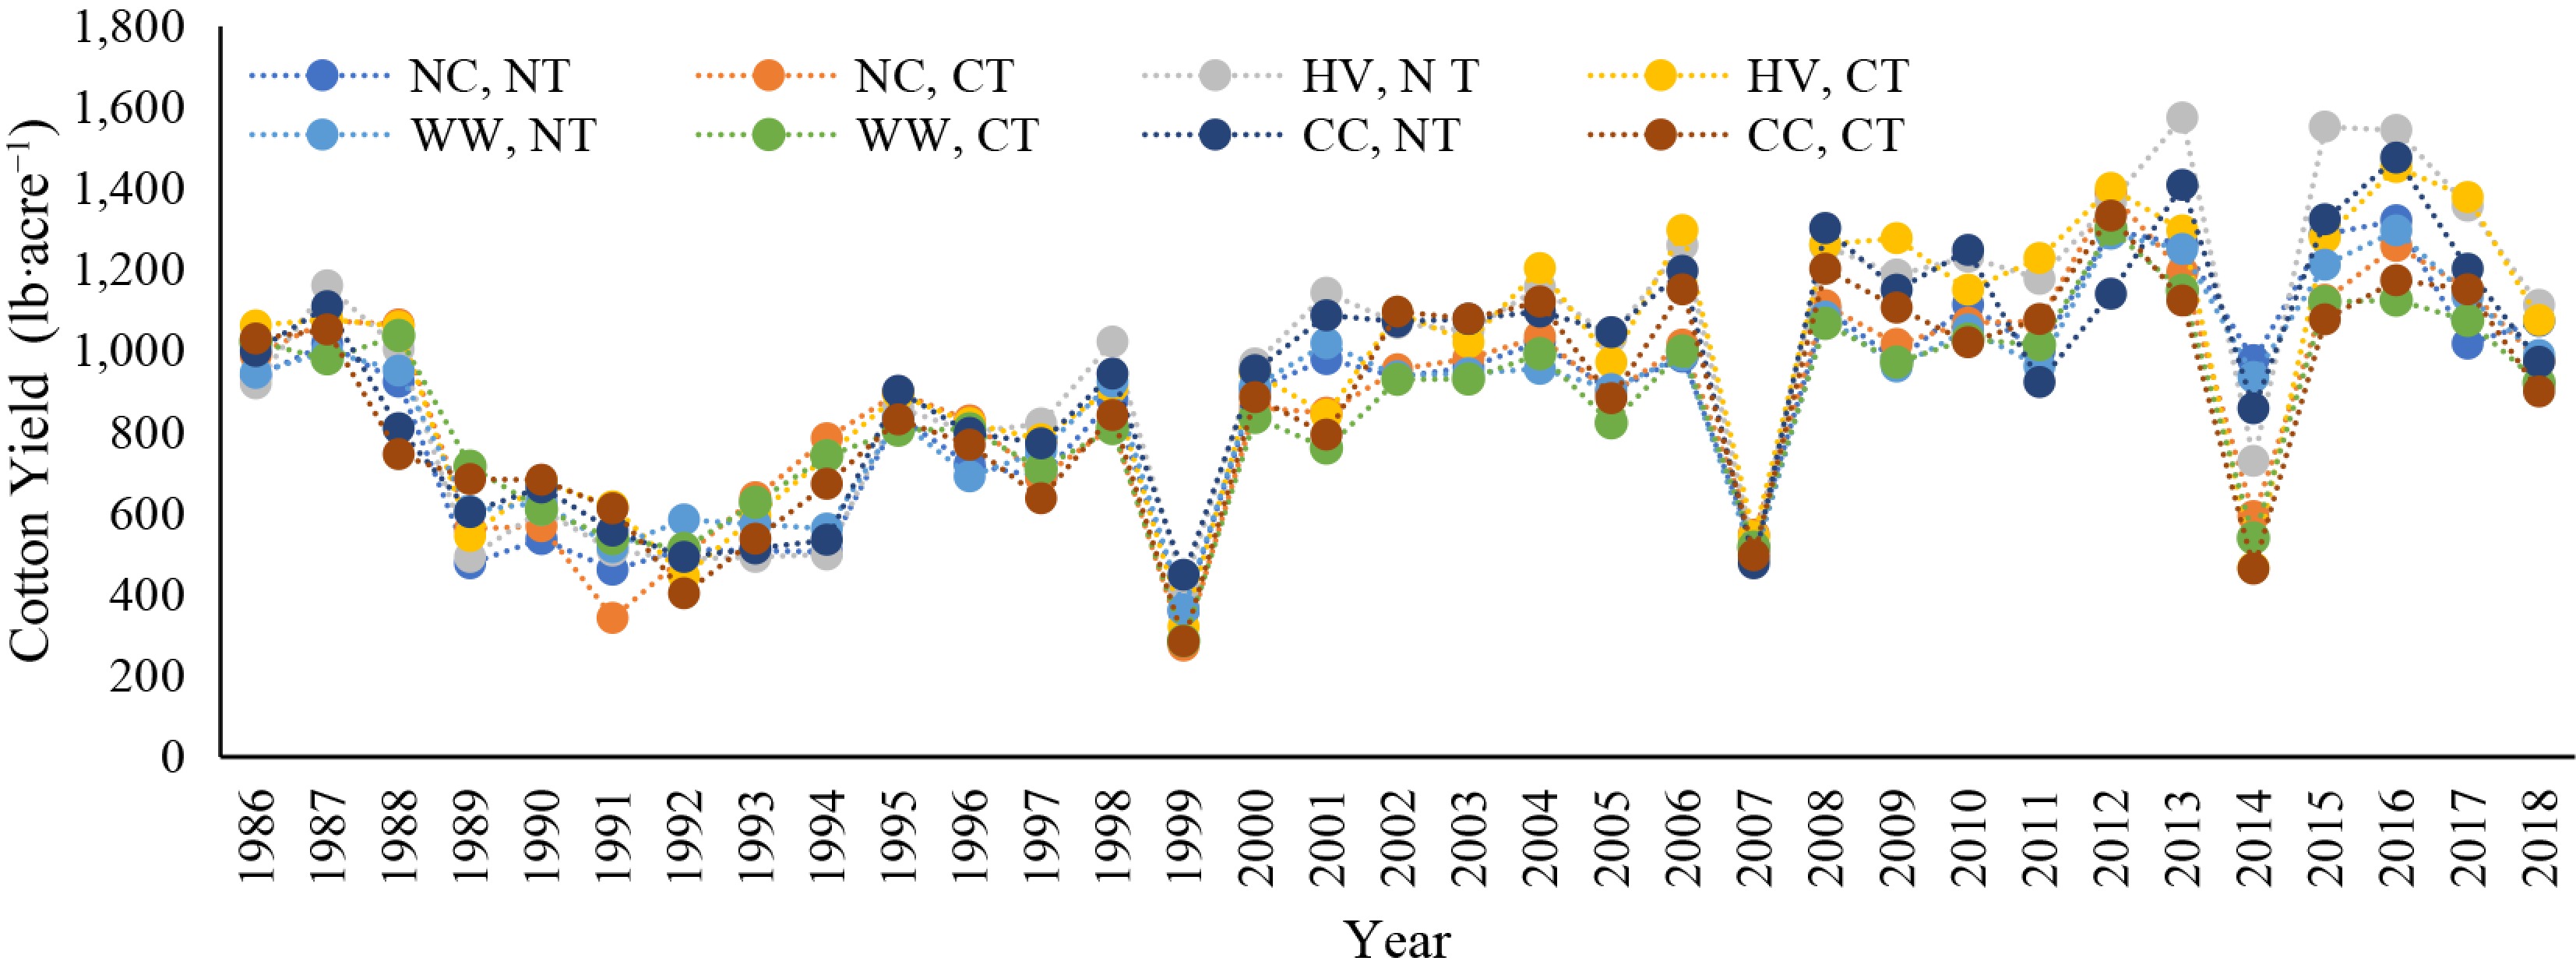
Figure 3.
Trends in cotton lint yield from 1986 to 2018 under four cover crop treatments and two tillage systems.
-
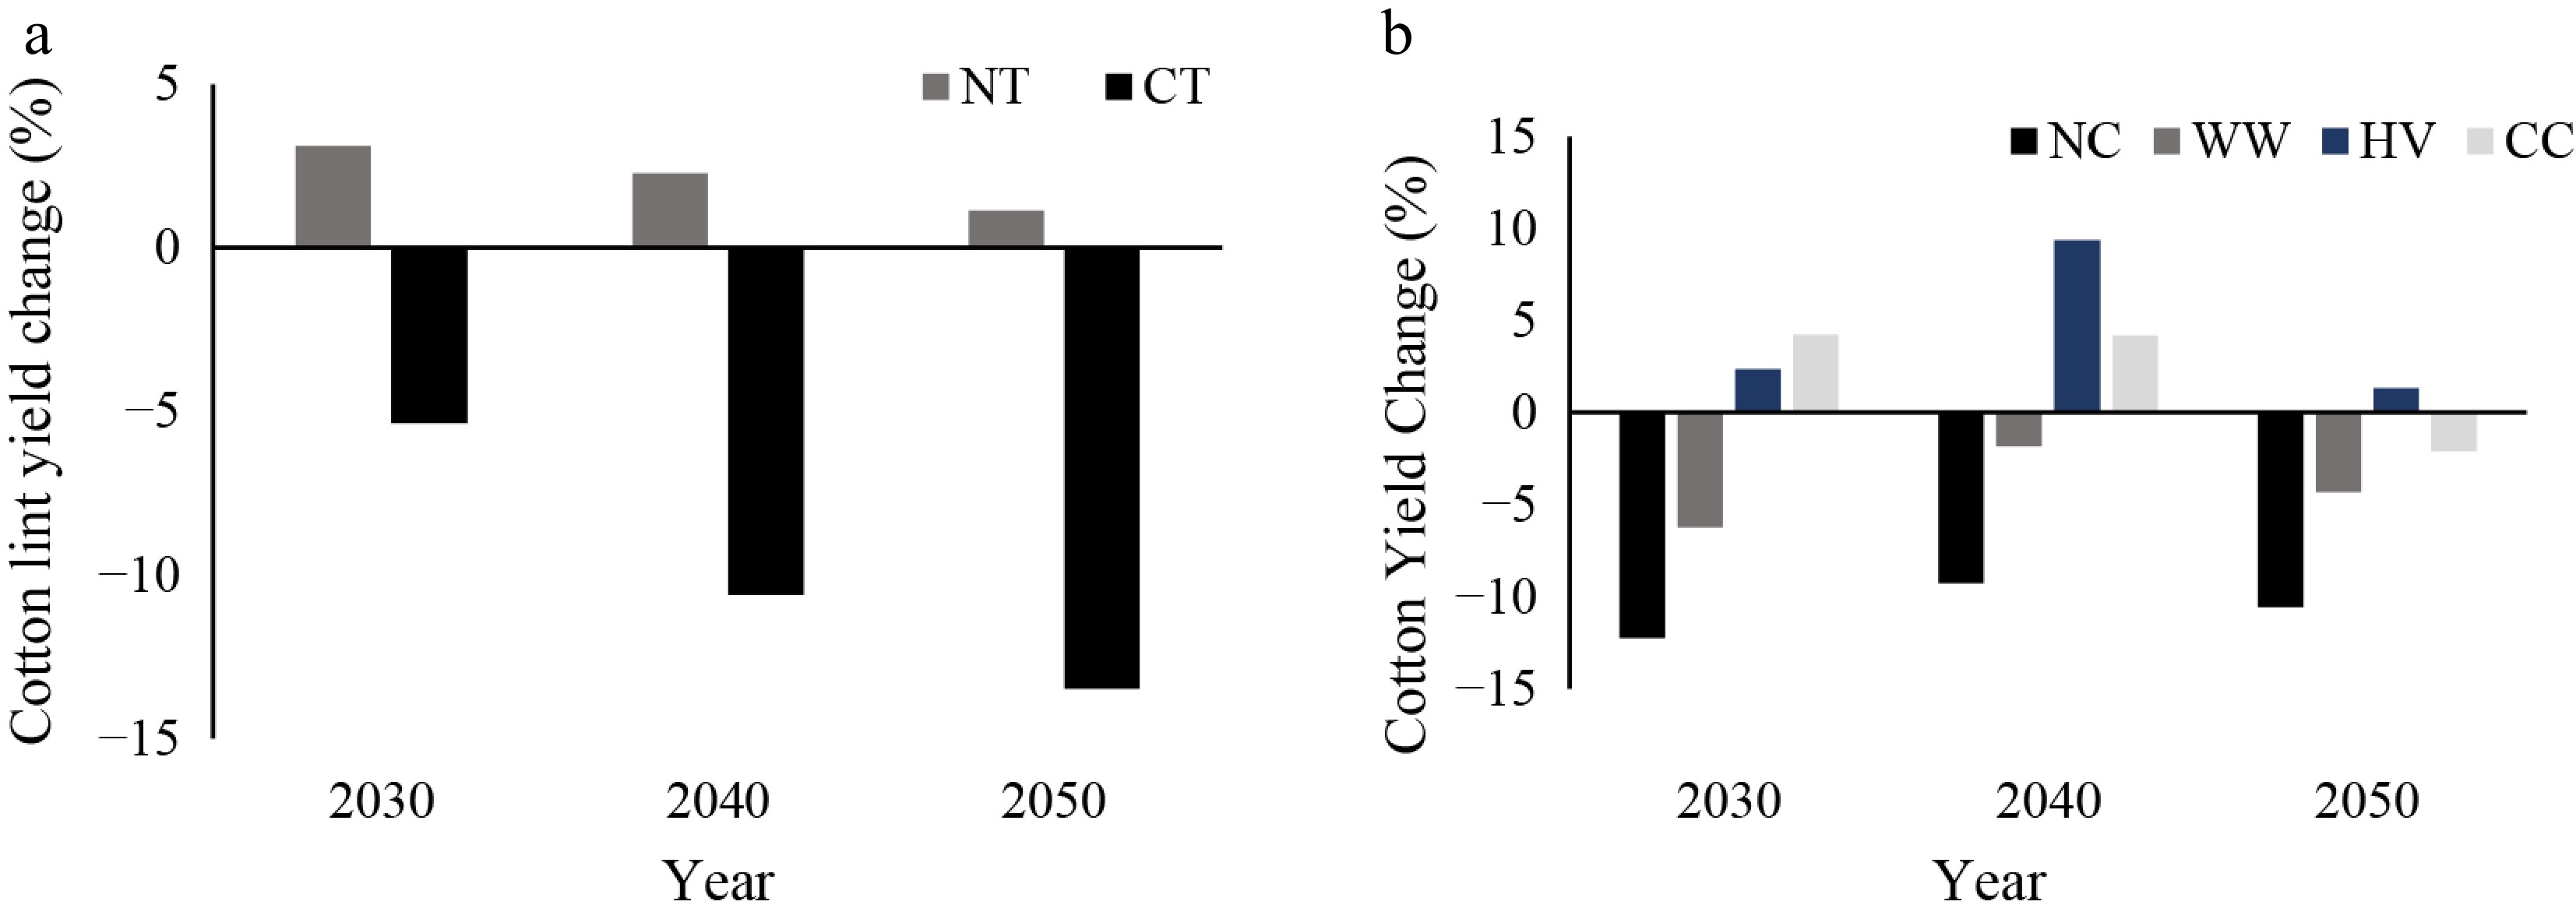
Figure 4.
(a) Simulated changes in cotton lint yield across tillage practices, and (b) cover crop treatments in 2030, 2040, and 2050 under projected climate conditions.
-
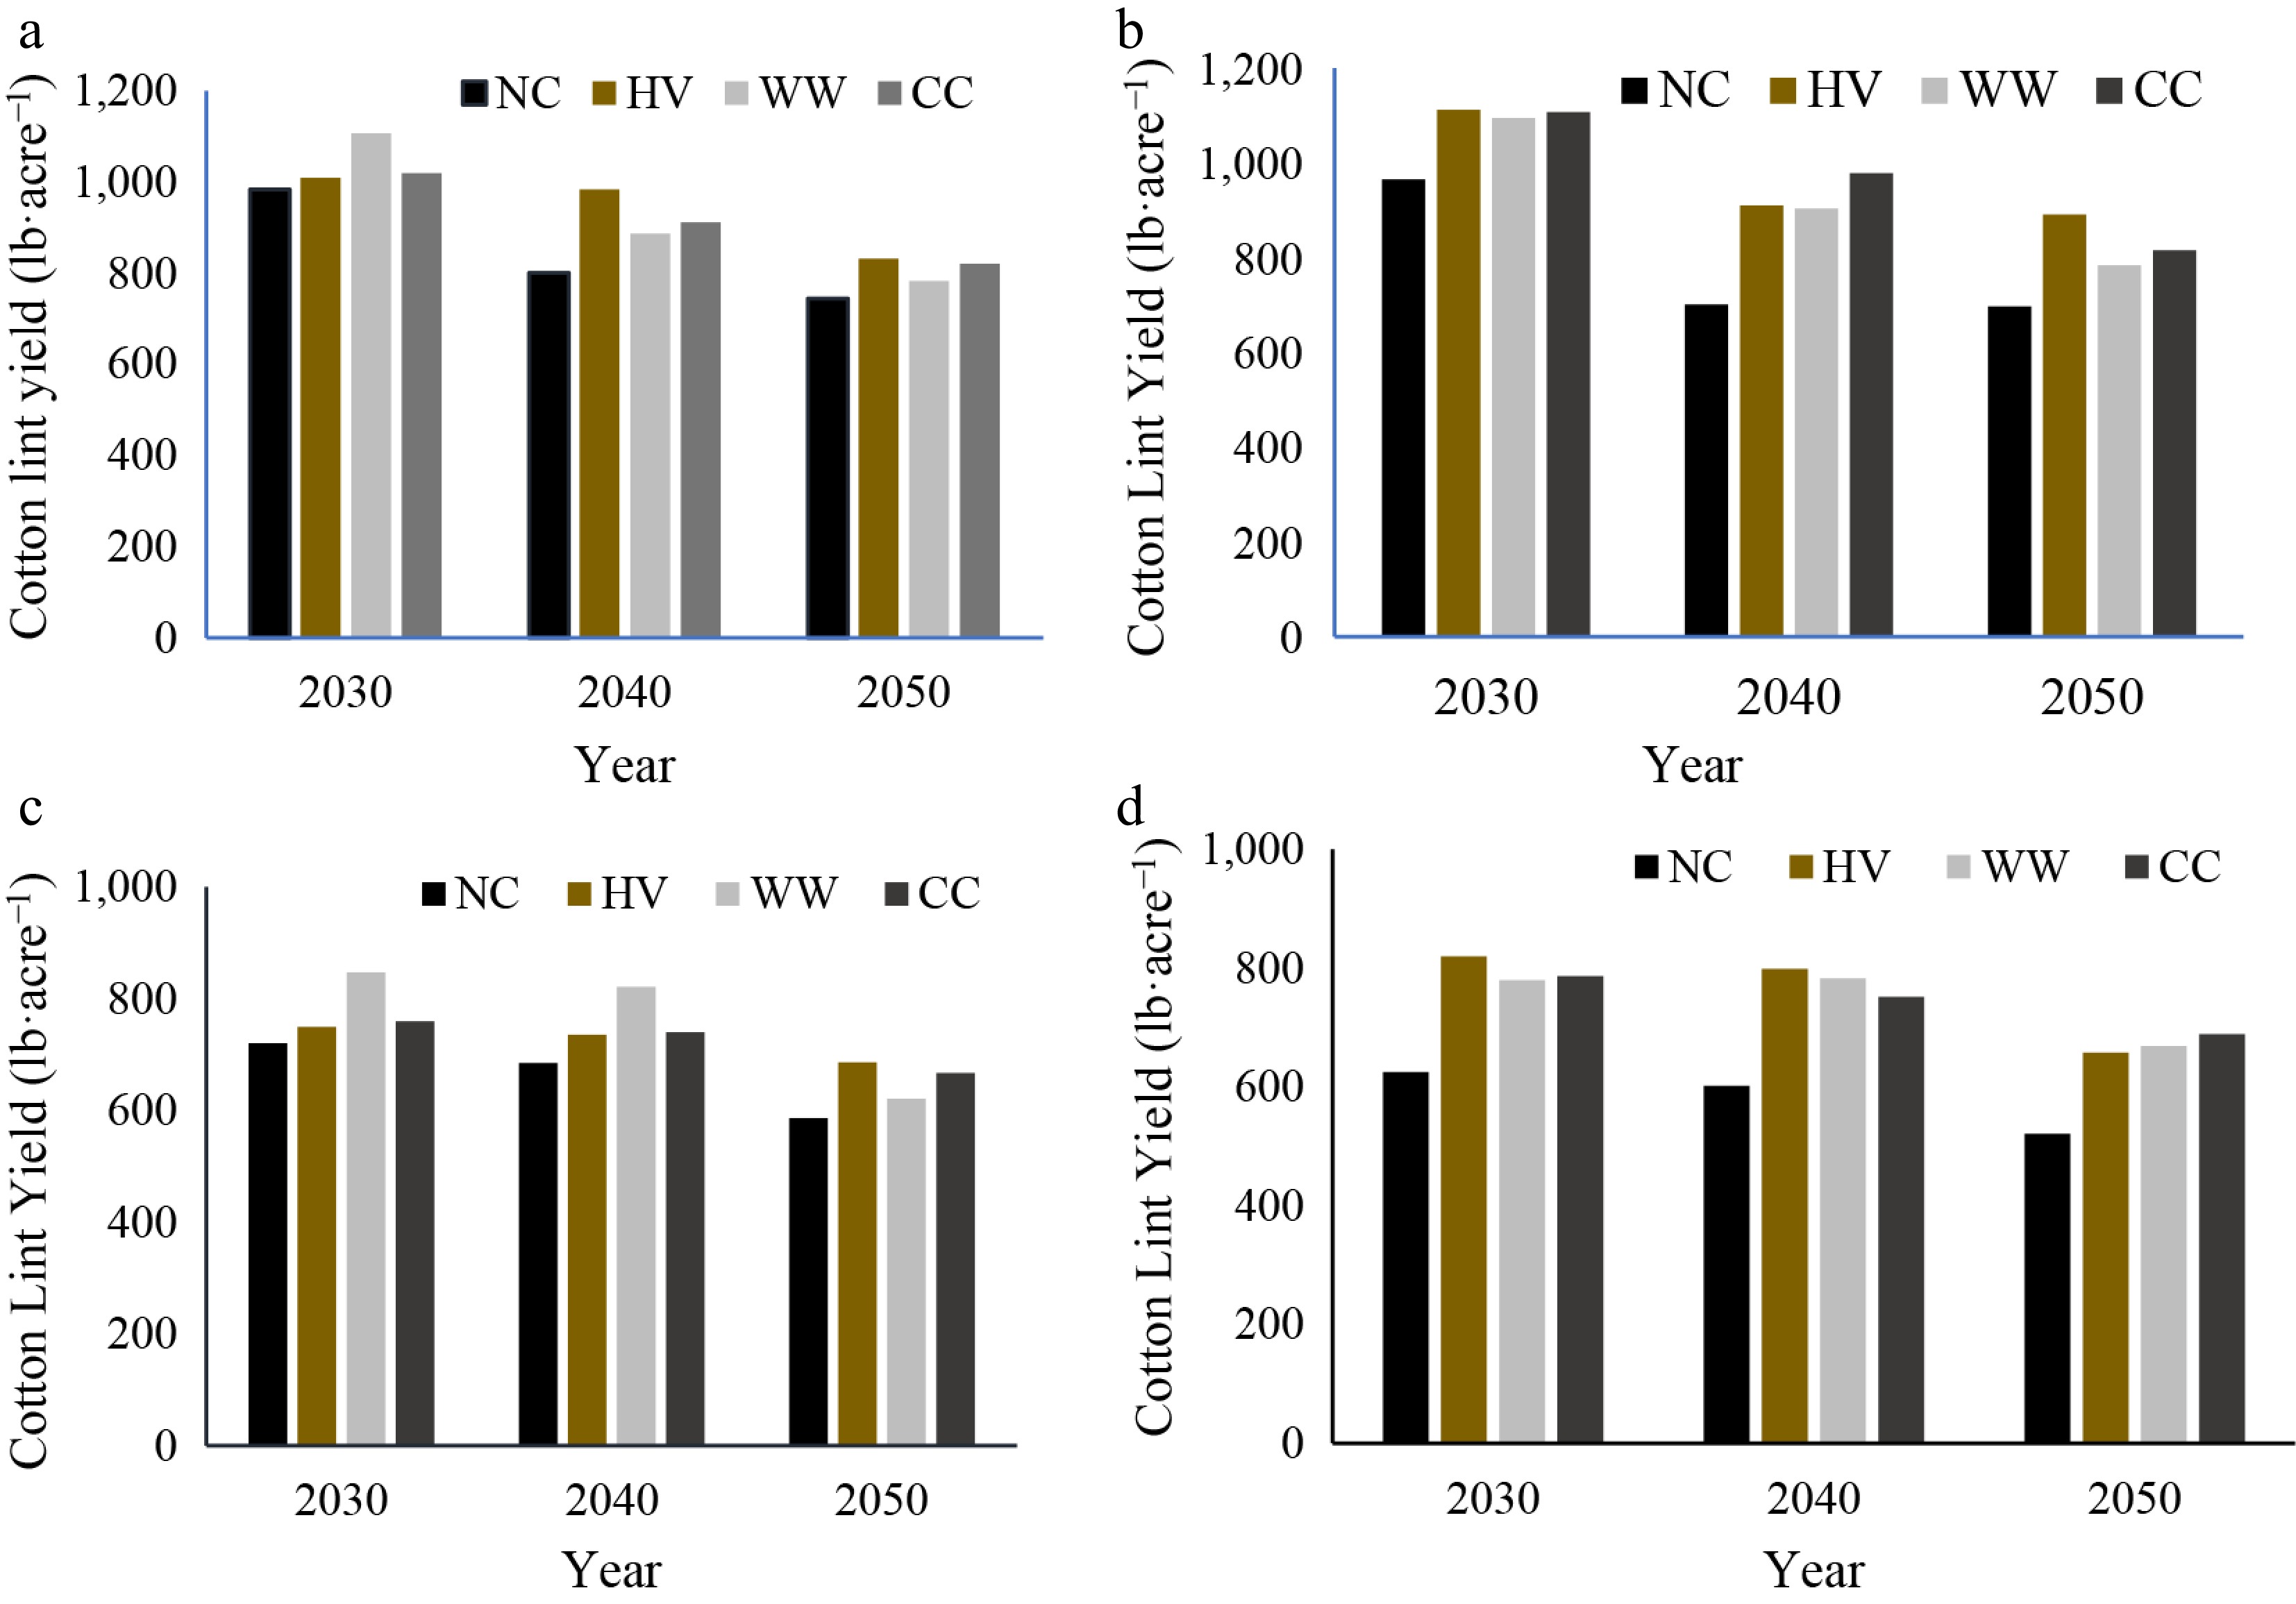
Figure 5.
Comparison of cotton lint yield under (b), (d) conventional, and (a), (c) no-tillage systems with different cover crops (CC, NC, WW, HV) under (a), (b) RCP 4.5, and (c), (d) RCP 8.5 climate scenarios.
-
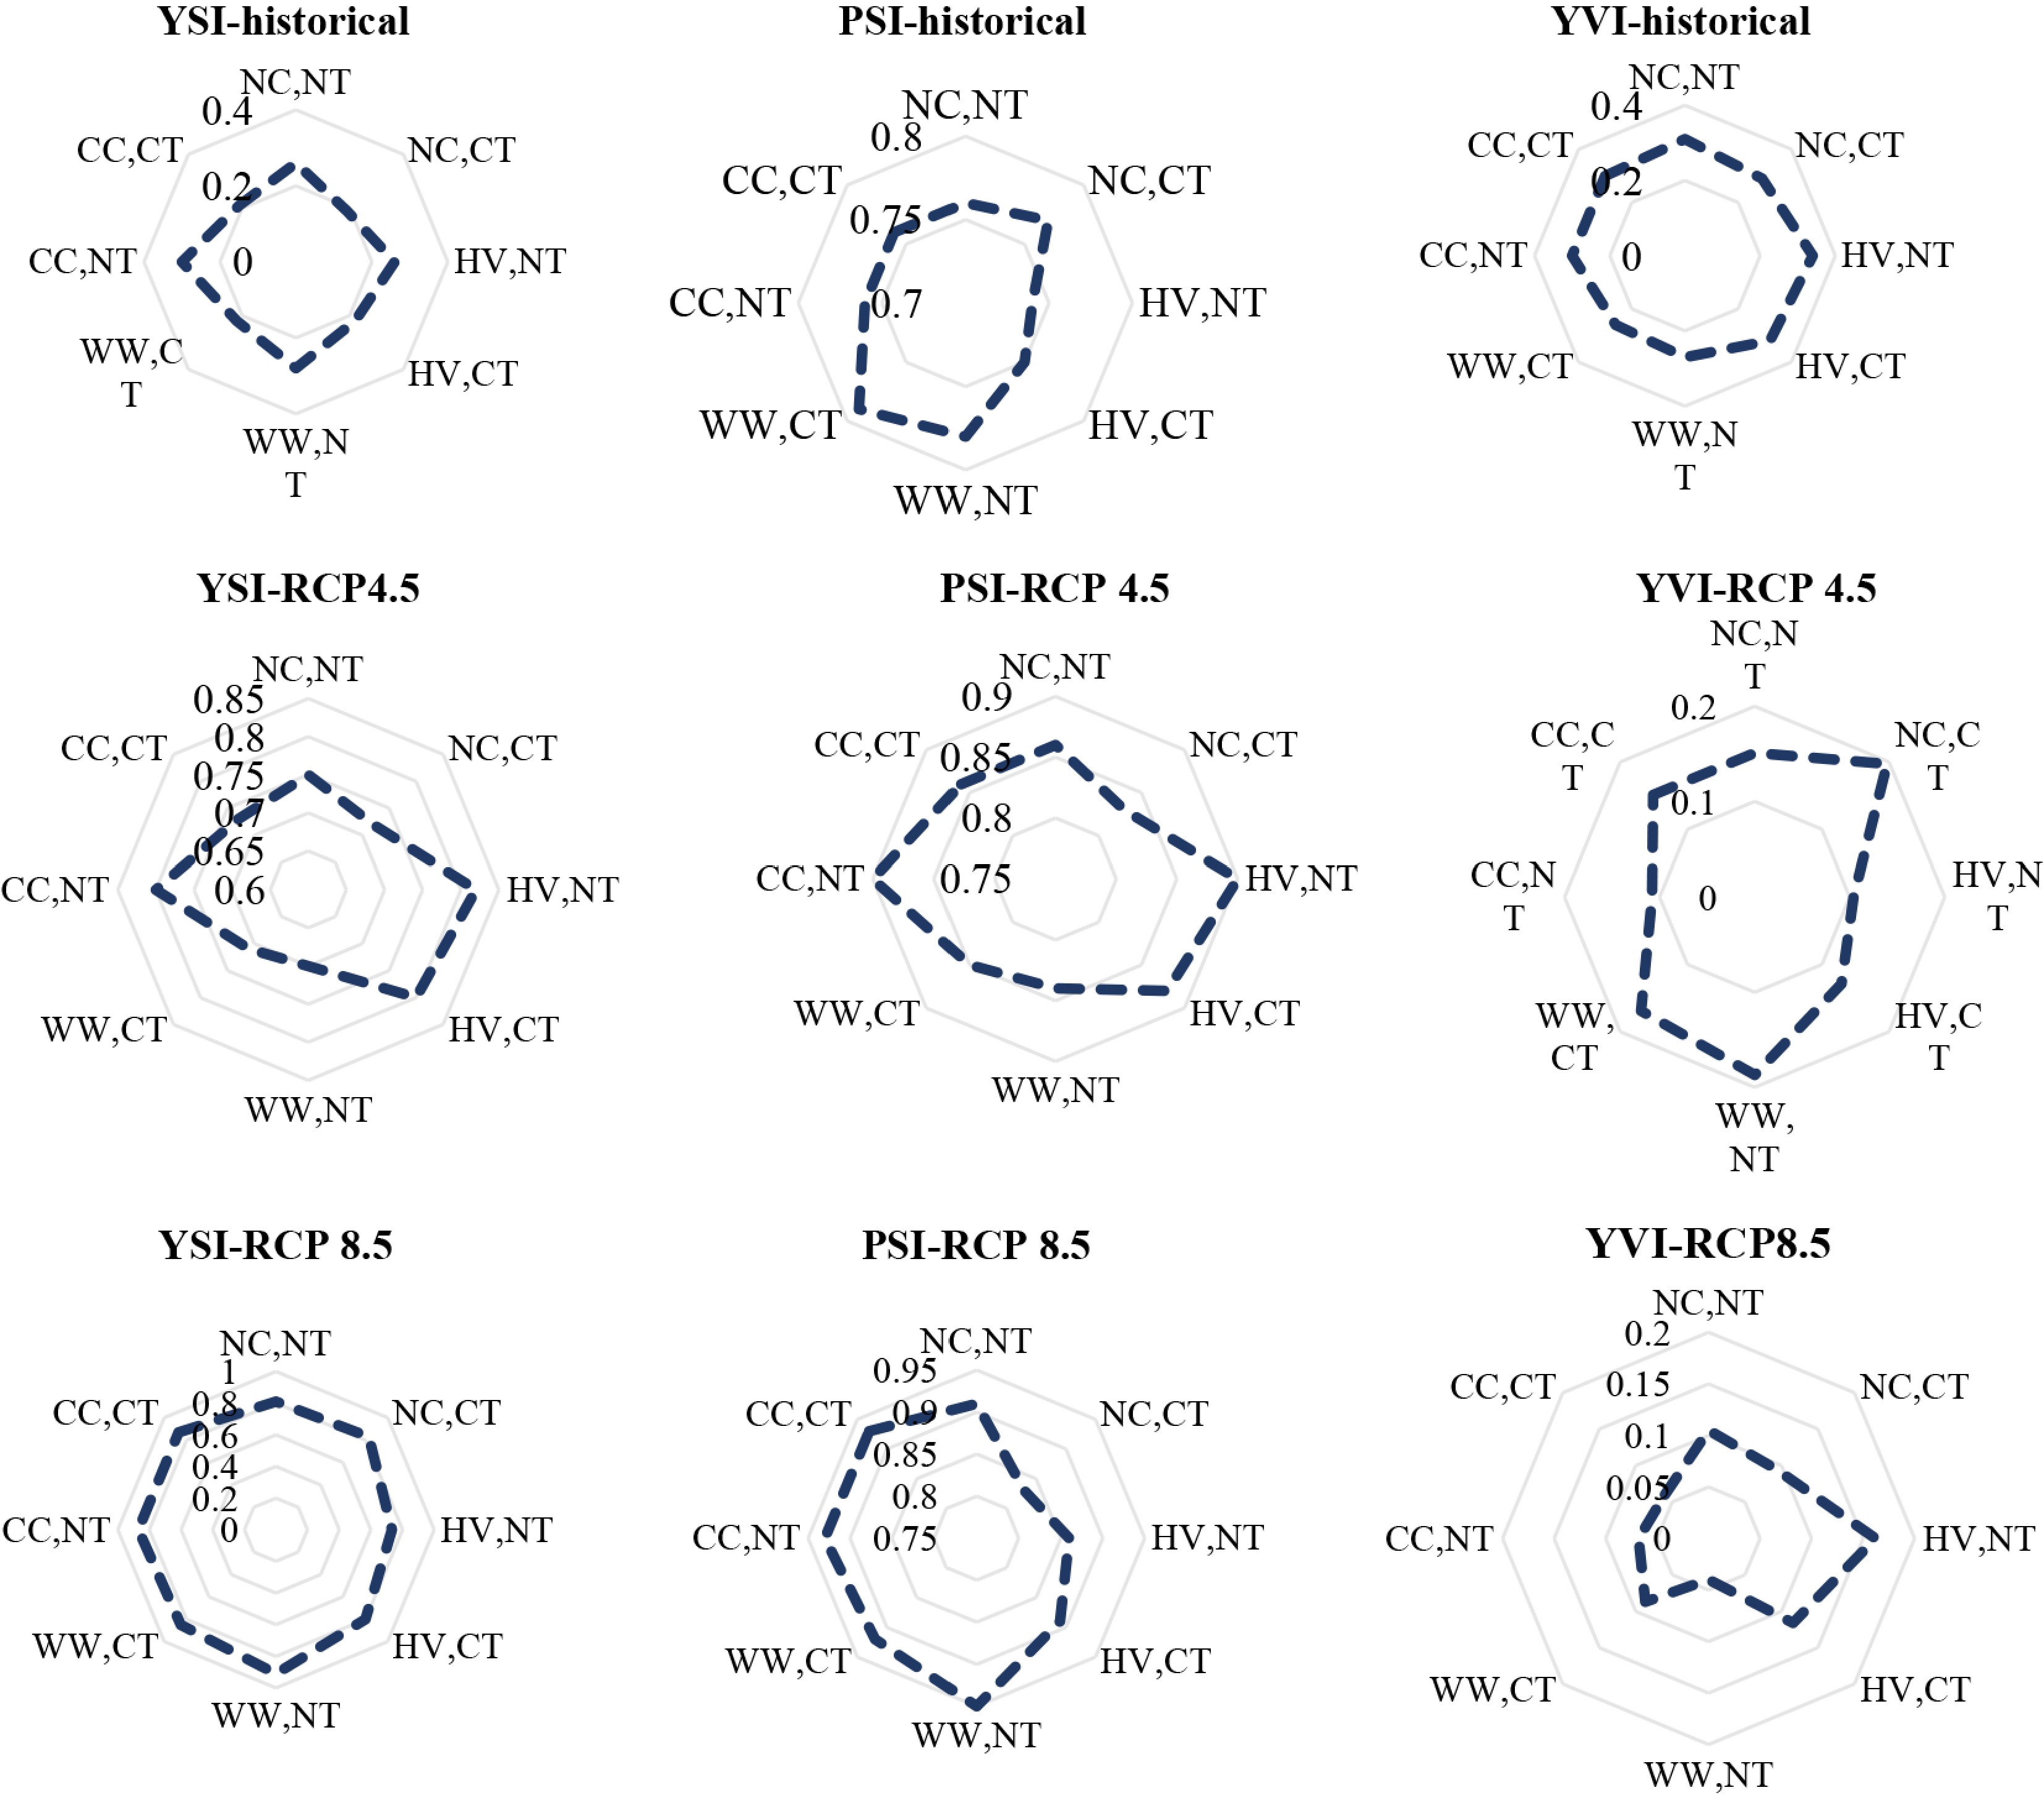
Figure 6.
Effect of cover crop and tillage combinations on yield stability (YSI), production stability (PSI), and yield variability (YVI) of cotton across (a)–(c) historical, and (d)–(f) future climate scenarios RCP 4.5, and (g)–(i) RCP 8.5.
-
Depth (cm) Texture (g·kg−1) Organic C (mg·g−1) pH CEC (cmol·kg−1) Total N (mg·g−1) Bulk density (g·cm−3) 0−15 Silt: 660, clay: 165, sand: 175 6.1 6.4 20 1.01 1.51 15−30 Silt: 662, clay: 210, sand: 128 4.5 6.4 20 1.01 1.52 Table 1.
Soil physical and chemical properties at 0–15 and 15–30 cm depths in Jackson, TN, USA.
-
Parameters Description Testing range Calibrated value Cultivar parameters EM-FL Time between plant emergence and flower appearance (photothermal days) 34–44 39 FL-SH Time between first flower and first pod (photothermal days) 6–12 8 FL-SD Time between first flower and first seed (photothermal days) 12–18 15 SD-PM Time between first seed and physiological maturity (photothermal days) 42–50 40 FL-LF Time between first flower and end of leaf expansion (photothermal days) 55–75 57 LFMAX Maximum leaf photosynthesis rate at 30 °C, 350 ppm CO2, and high light (mg CO2 m−2·s−1) 0.7−1.4 1.05 SLAVR Specific leaf area of cultivar under standard growth conditions (cm2·g−1) 170−175 170 SIZLF Maximum size of full leaf (three leaflets) (cm2) 250−320 300 XFRT Maximum fraction of daily growth that is partitioned to seed + shell 0.7−0.9 0.7 SFDUR Seed filling duration for pod cohort at standard growth conditions (photothermal days) 22−35 34 PODUR Time required for cultivar to reach final pod load under optimal conditions (photothermal days) 8−14 14 THRSH Threshing percentage. The maximum ratio of (seed / [seed + shell]) at maturity. 68−72 70 Ecotype parameters PL-EM Time between planting and emergence (thermal days) 3−5 4 EM-V1 Time required from emergence to first true leaf (thermal days) 3−5 4 RWDTH Relative width of the ecotype in comparison to the standard width per node 0.8−1.0 1 RHGHT Relative height of the ecotype in comparison to the standard height per node 0.8−0.95 0.9 FL-VS Time from first flower to last leaf on main stem (photothermal days) 40−75 57 Table 2.
Parameters adjusted during the CSM-CROPGRO-Cotton model calibration.
-
Crop phenological stage Observed* (days
after planting)Simulated (days
after planting)Calibration Emergence 4−9 8 Anthesis 60−70 64 Physiological maturity 130−160 156 Validation Emergence 4−9 7 Anthesis 60−70 63 Physiological maturity 130−160 145 * Robertson et al.[15]. Table 3.
Comparisons of simulated and generally observed dates of onset of cotton phenological stages.
Figures
(6)
Tables
(3)