-
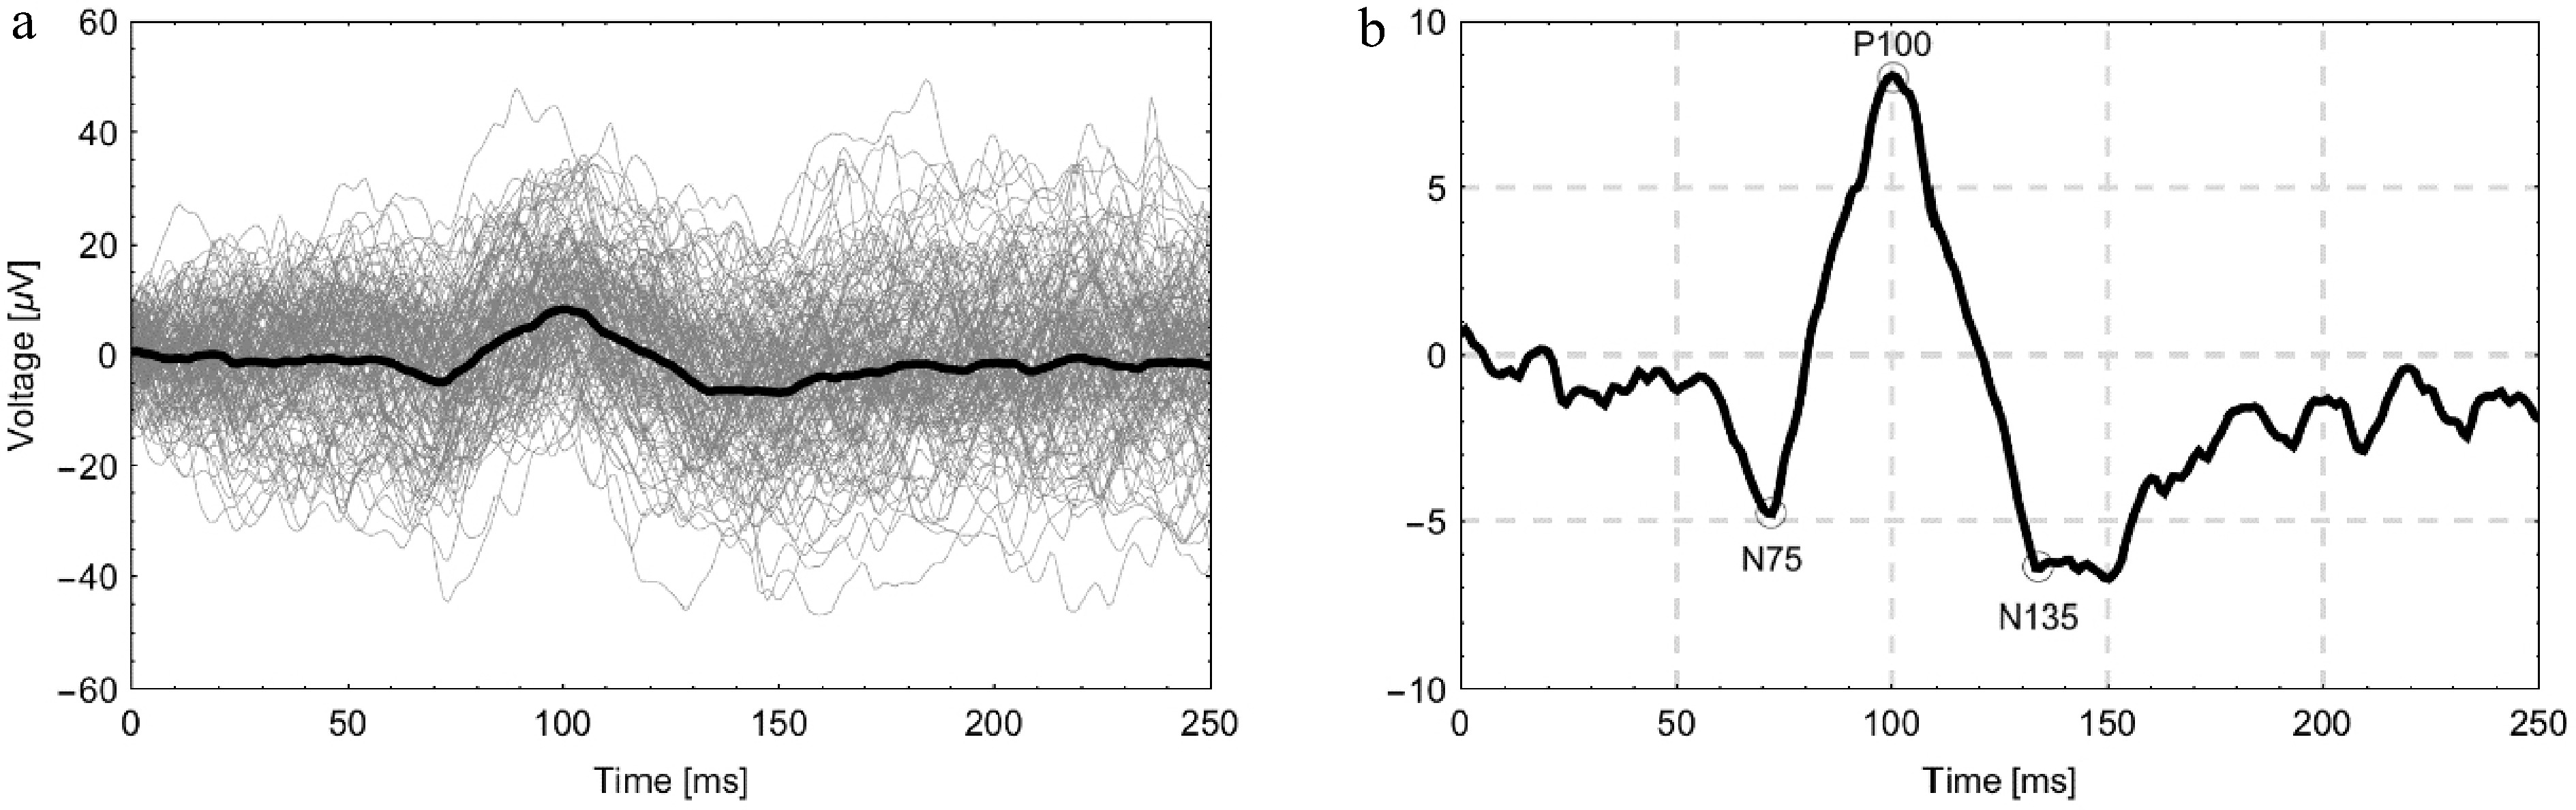
Figure 1.
(a) Illustrative graph of VEP signals from the right eye of a healthy male volunteer showing 80 individual trials (gray) along with the averaged signal (bold dark line). (b) The same averaged signal is shown on an enlarged scale with the characteristic components N75, P100, and N135 indicated.
-
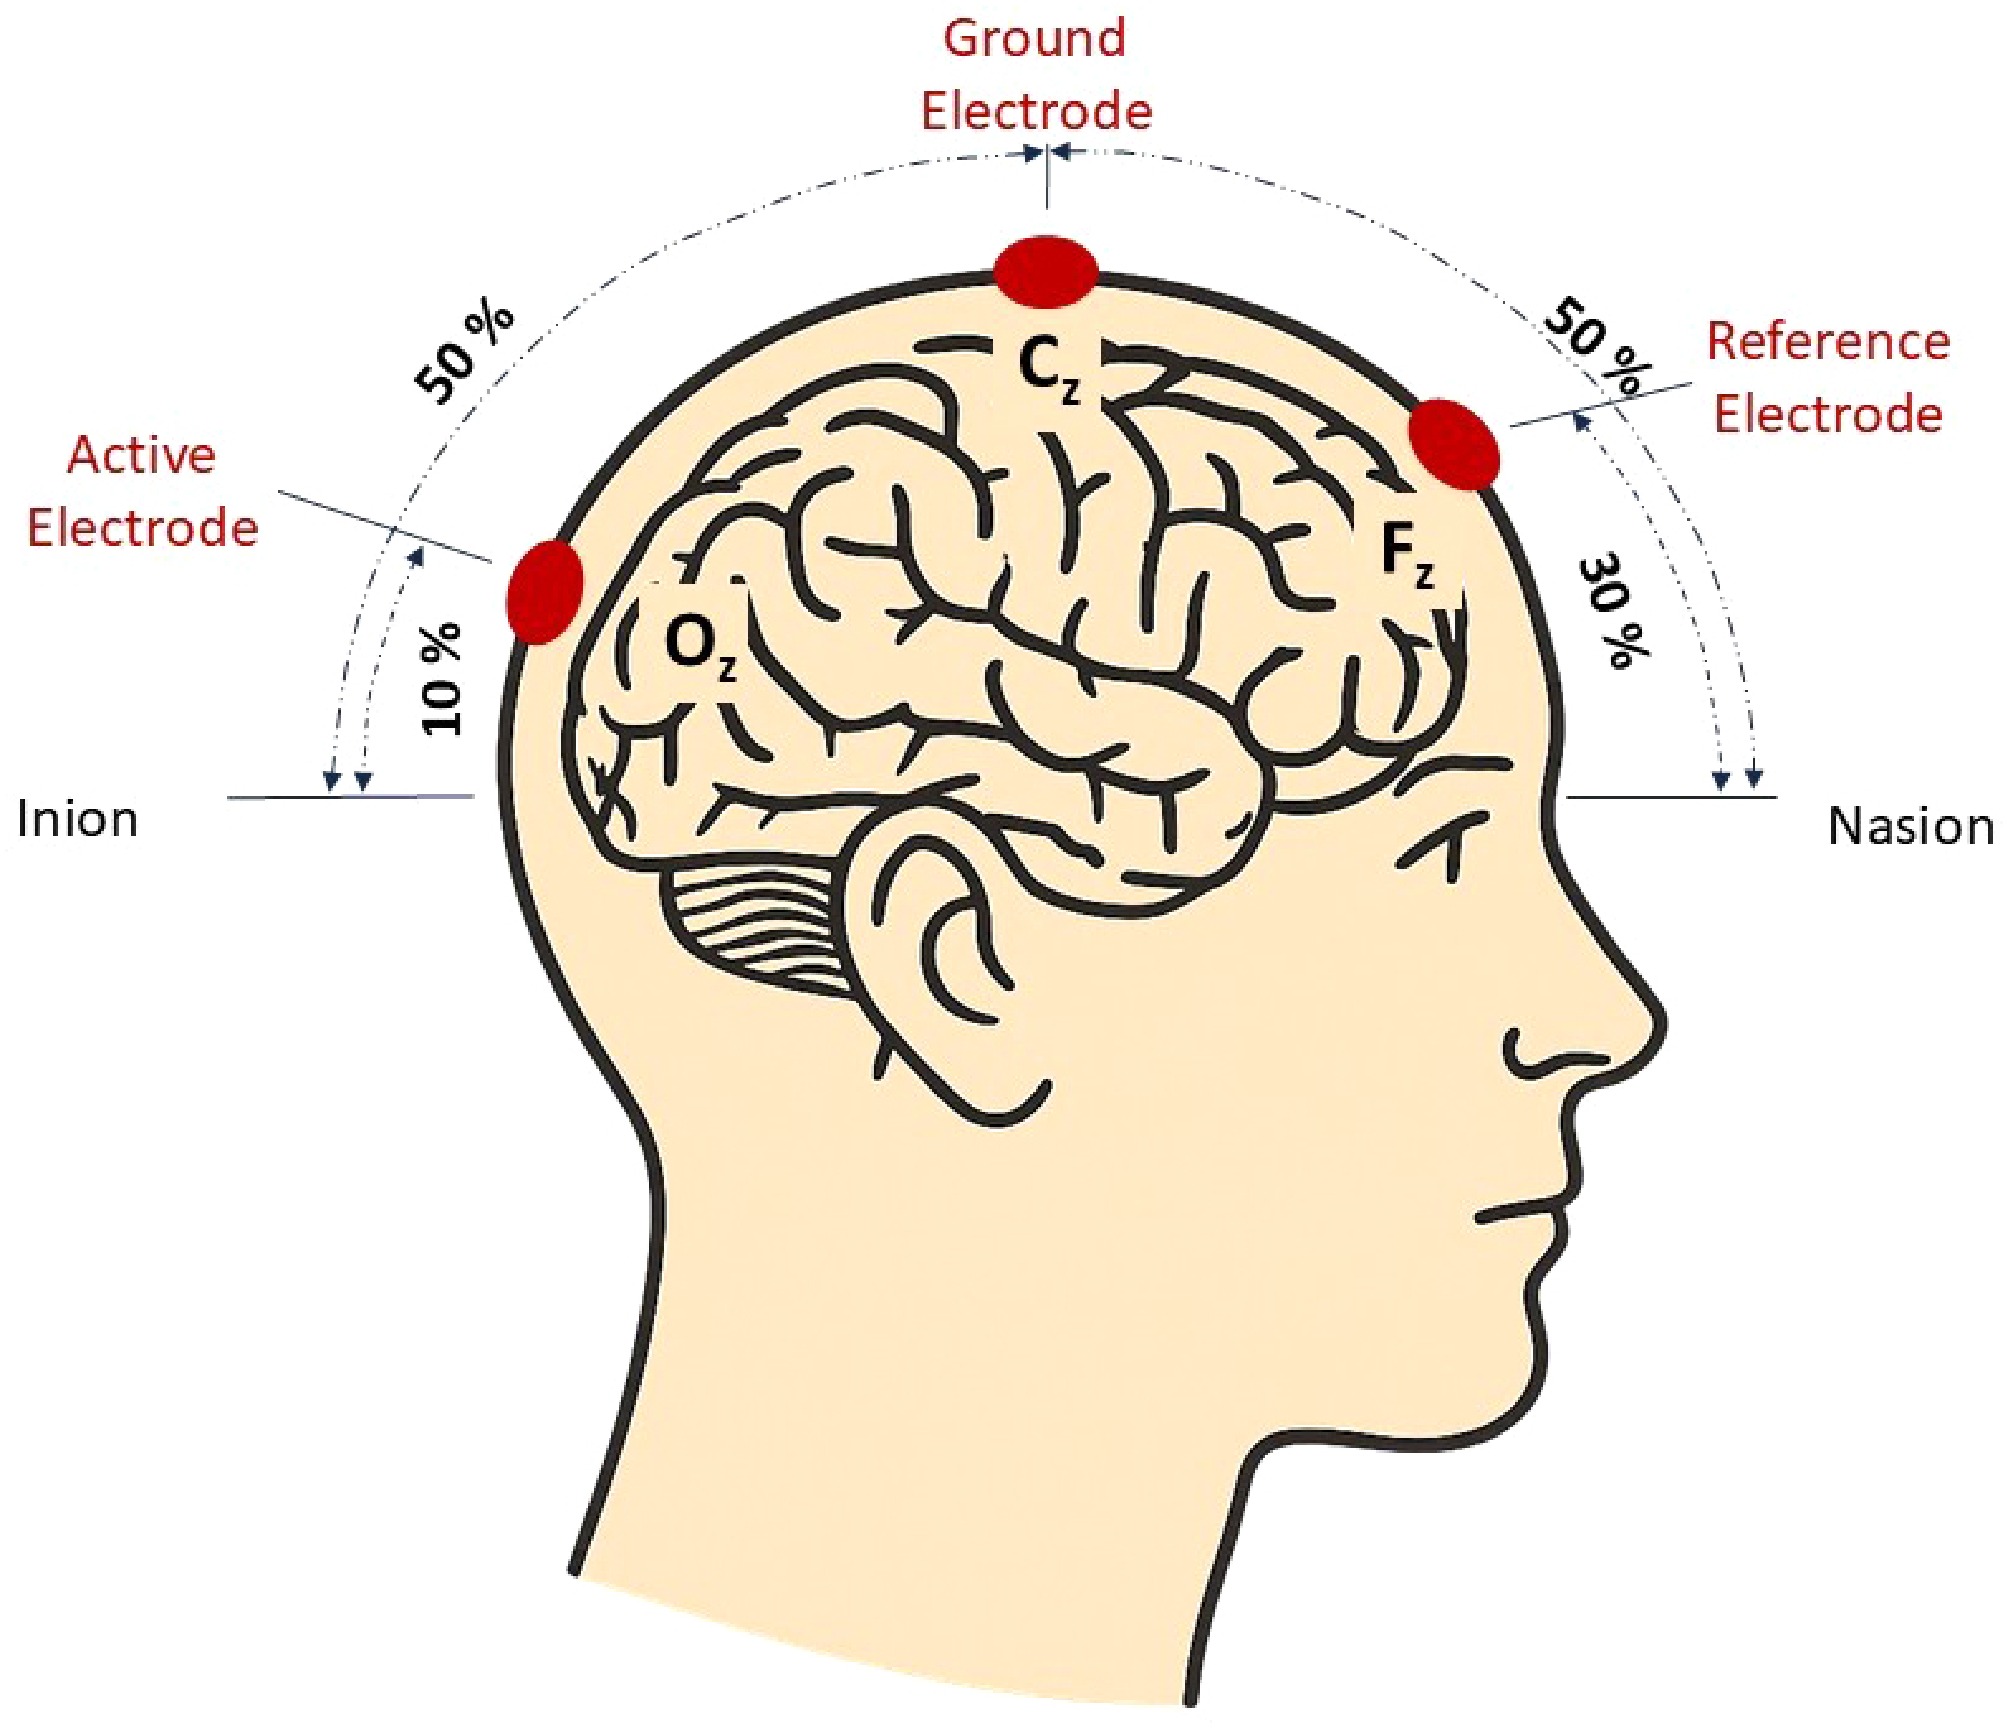
Figure 2.
Diagram of the electrode placement along the midline of the scalp used in visual evoked potential examination. (Original illustration by the authors).
-
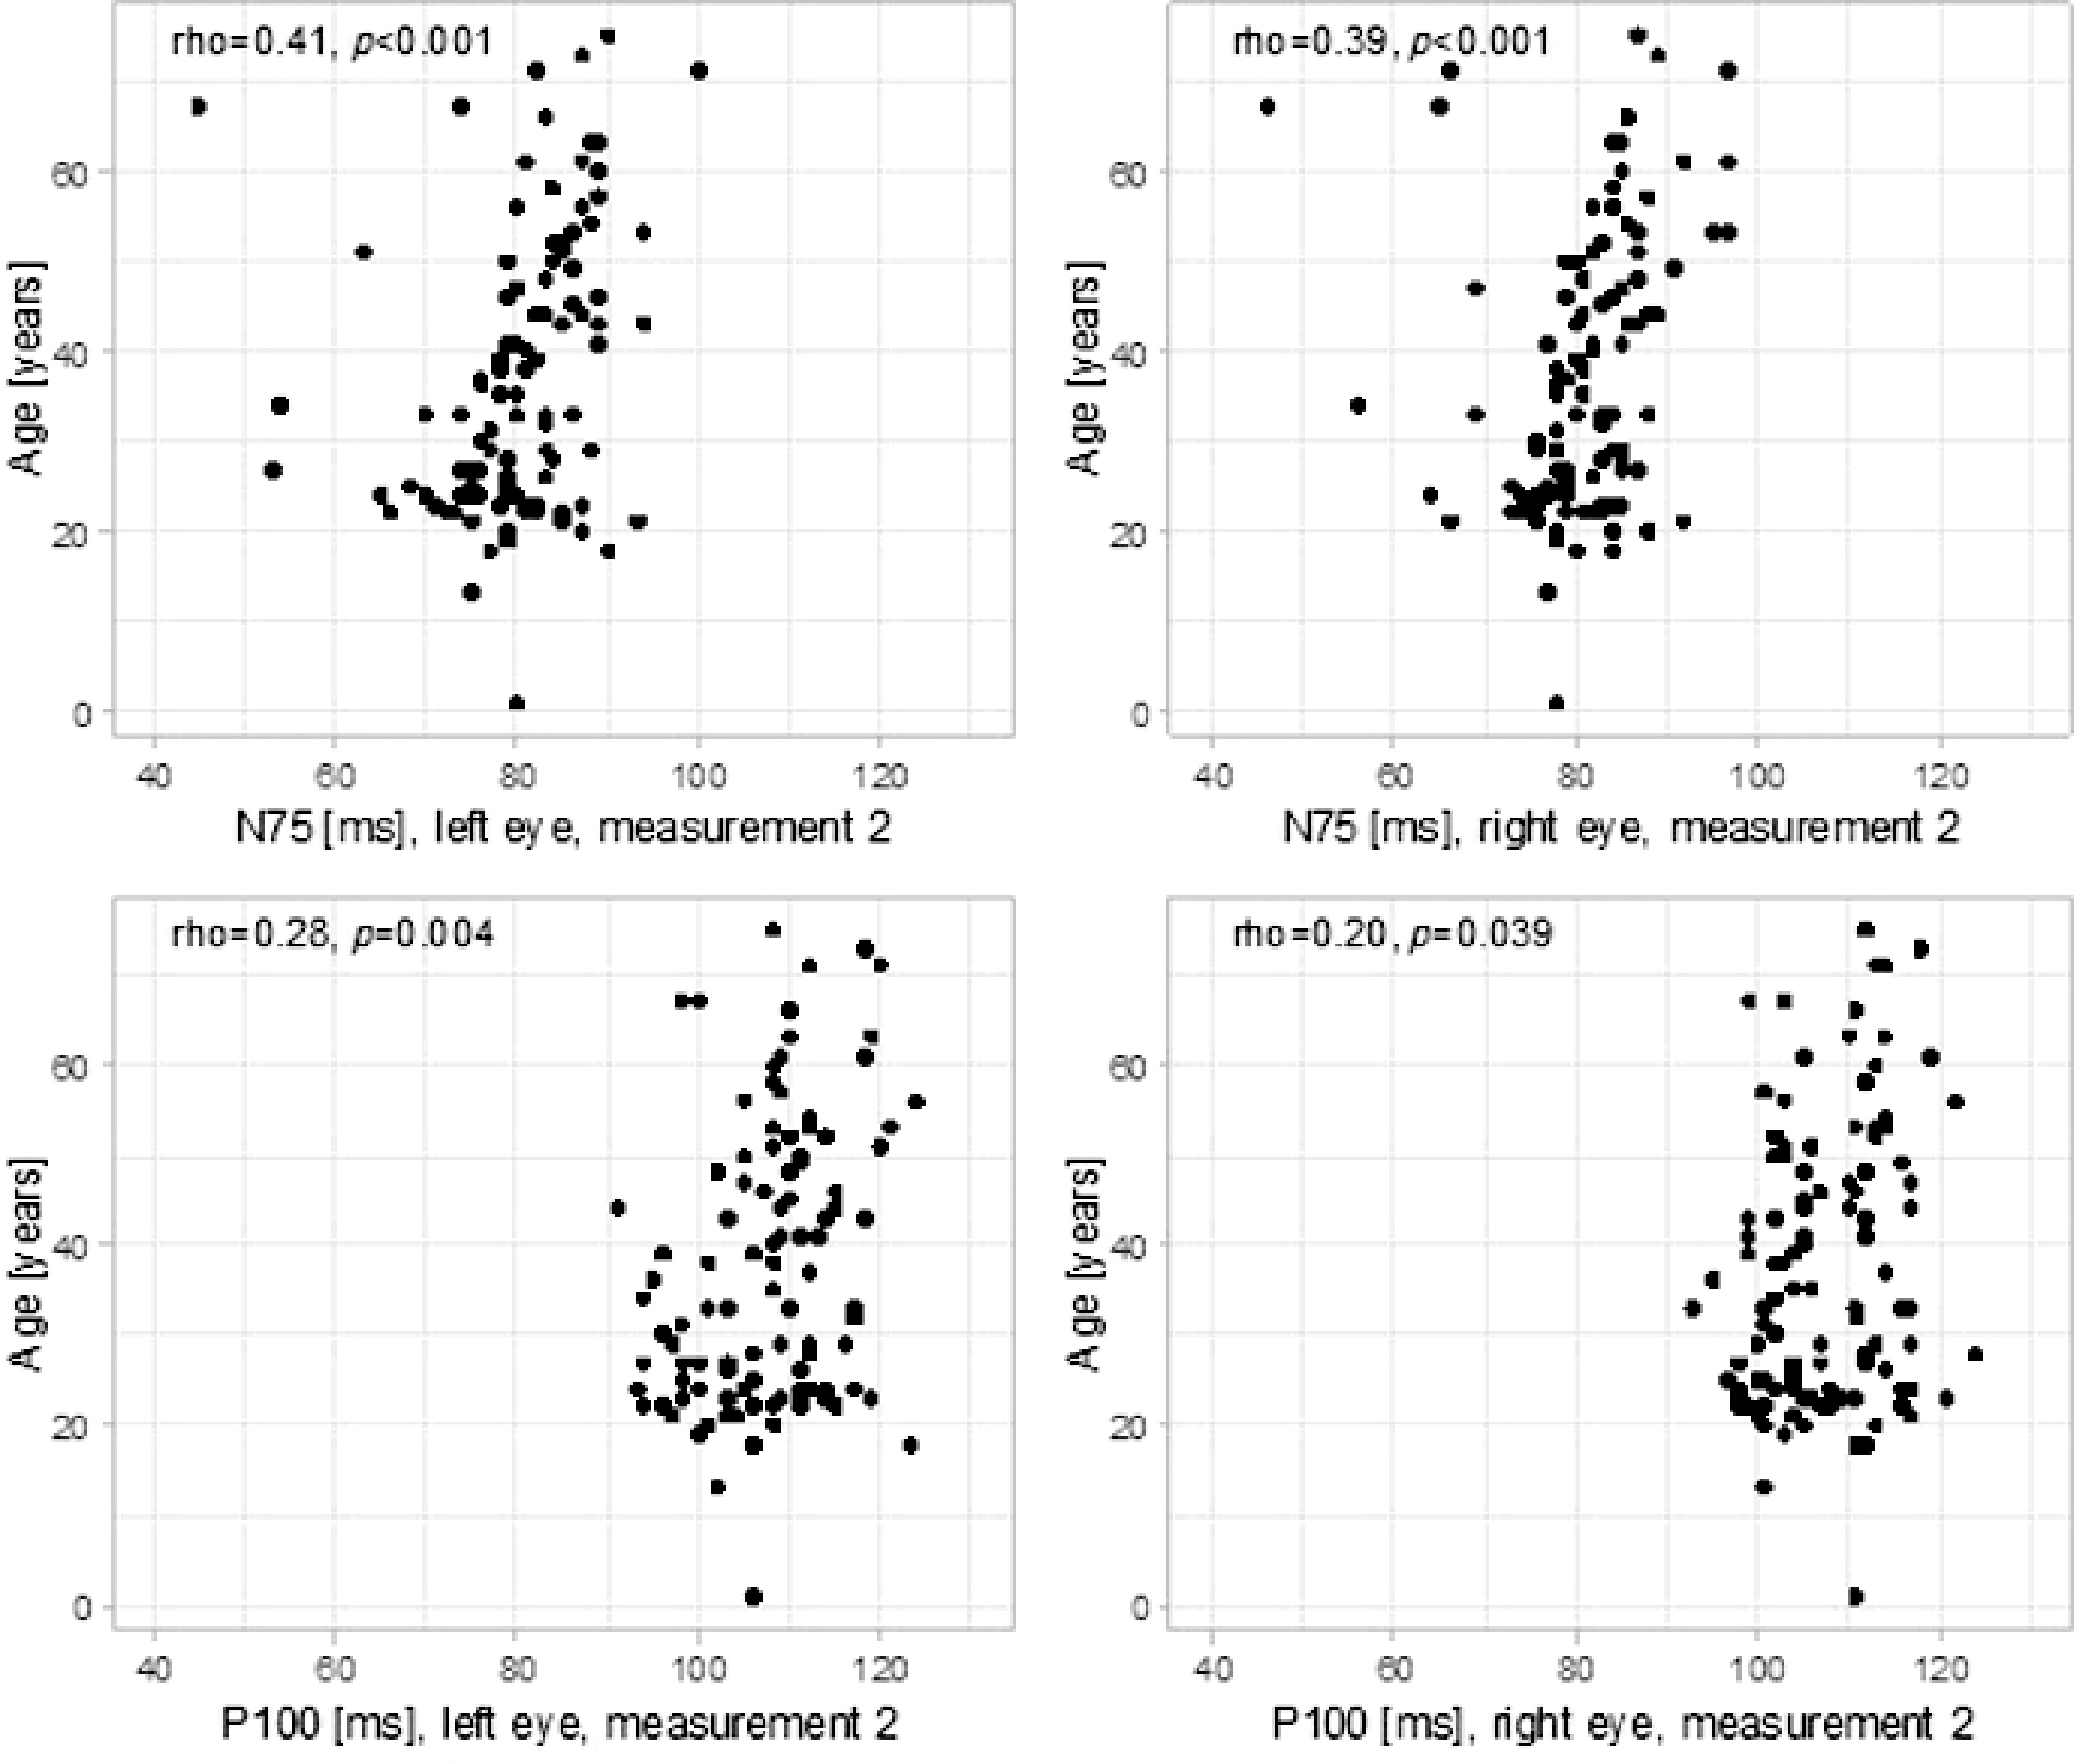
Figure 3.
Correlations between age and analyzed parameters.
-
Variable n (%) / M ± SD Me (IQR) Range N 108 (100.0) − − Sex Male 55 (50.9) − − Female 53 (49.1) − − Age (years) 37.19 ± 15.58 33.00 (24.00; 48.25) 18.00–75.00 Males (years*) 33.49 ± 13.94 31.00 (23.00; 42.00) 18.00–71.00 Females (years*) 41.04 ± 16.38 41.00 (25.00; 53.00) 18.00–75.00 Data are presented as n (%) for sex and mean ± SD for continuous variables. M, mean; SD, standard deviation; Me, median; IQR, interquartile range. * Only for males/females. Table 1.
Demographic characteristics of the study group.
-
Variable Correlation between age and left-eye parameters Correlation between age and right-eye parameters Rho p p-adj Rho p p-adj N75 μV 1 0.20 0.043 0.208 0.06 0.542 0.867 N75 ms 1 0.16 0.101 0.304 0.06 0.538 0.867 P100 μV 1 −0.18 0.061 0.244 −0.16 0.101 0.304 P100 ms 1 −0.05 0.594 0.891 −0.03 0.743 0.892 N175 μV 1 −0.05 0.633 0.892 0.04 0.719 0.892 N135 ms 1 0.00 0.977 0.977 −0.10 0.327 0.654 N75 μV 2 0.10 0.302 0.654 0.07 0.483 0.867 N75 ms 2 0.41 < 0.001 < 0.001 0.39 < 0.001 < 0.001 P100 μV 2 0.10 0.300 0.654 0.00 0.975 0.977 P100 ms 2 0.28 0.004 0.029 0.20 0.039 0.208 N135 μV 2 −0.14 0.141 0.377 −0.02 0.819 0.936 N135 ms 2 0.02 0.864 0.943 0.04 0.678 0.892 Rho–Spearman correlation coefficient. p-adj are the p-values corrected with Benjamini–Hochberg adjustment for multiple comparisons. Confounding factors not considered. Bold values indicate statistically significant correlations after Benjamini–Hochberg correction for multiple comparisons (p-adj < 0.05). Table 2.
Correlation between age and analyzed parameters.
-
Variable Males Females MD (95% CI) p p-adj n M ± SD / Me (IQR) n M ± SD / Me (IQR) N75 OP μV 1 53 −2.03 (−3.49; −0.69) 53 −1.98 (−4.24; −0.95) −0.05 (−0.66; 1.09) 0.565 0.678 N75 OP ms 1 53 70.00 (66.00; 75.00) 53 71.00 (68.00; 74.00) −1.00 (−3.00; 2.00) 0.537 0.678 P100 OP μV 1 53 8.45 (6.21; 11.27) 53 10.58 (7.19; 13.46) −2.13 (−3.02;0.23) 0.083 0.284 P100 OP ms 1 53 101.26 ± 5.43 53 101.26 ± 6.55 0.00 (−2.32;2.32) > 0.9991 > 0.999 N135 OP μV 1 53 −9.40 (−12.44; −6.52) 53 −11.08 (−14.92; − 7.23) 1.68 (−0.29; 3.50) 0.102 0.307 N135 OP ms 1 53 141.53 ± 13.03 53 140.77 ± 12.98 0.75 (−4.25; 5.76) 0.7661 0.875 N75 OP μV 2 54 −4.34 (−5.61; −2.55) 53 −4.63 (−6.48; −2.51) 0.01 (−0.69; 1.60) 0.378 0.620 N75 OP ms 2 55 81.00 (78.00; 84.00) 53 82.00 (78.00; 87.00) −1.00 (−4.00; 1.00) 0.133 0.349 P100 OP μV 2 55 9.64 (6.00; 13.25) 53 12.71 (7.76; 18.02) −3.07 (−5.15; −0.44) 0.021 0.196 P100 OP ms 2 55 106.78 ± 6.46 53 108.19 ± 6.65 −1.41 (−3.91; 1.09) 0.2671 0.535 N135 OP μV 2 54 −10.02 (−16.12; −5.95) 53 −12.45 (−16.93; −8.82) 2.43 (−0.29; 4.91) 0.077 0.284 N135 OP ms 2 55 150.22 ± 12.78 53 154.83 ± 13.18 −4.61 (−9.57; 0.34) 0.0681 0.284 N75 OL μV 1 54 −2.39 (−3.91; −1.09) 53 −2.75 (−4.13; −1.40) 0.36 (−0.49; 1.18) 0.413 0.620 N75 OL ms 1 54 70.00 (65.00; 74.00) 53 71.00 (69.00; 74.00) −1.00 (−4.00; 1.00) 0.153 0.349 P100 OL μV 1 54 8.53 (5.95; 10.74) 53 10.42 (7.19; 13.52) −1.89 (−3.18; −0.11) 0.033 0.196 P100 OL ms 1 54 101.00 (98.00; 103.75) 53 101.00 (98.00; 104.00) 0.00 (−2.00; 2.00) 0.928 0.968 N135 OL μV 1 54 −9.19 (−12.46; −6.97) 53 −10.63 (−14.62; − 6.91) 1.44 (−0.57; 3.45) 0.160 0.349 N135 OL ms 1 54 141.98 ± 11.17 53 141.74 ± 13.97 0.25 (−4.60; 5.09) 0.9201 0.968 N75 OL μV 2 54 −3.77 (−5.74; −2.65) 53 −4.45 (−6.18; −2.40) 0.68 (−0.69; 1.58) 0.515 0.678 N75 OL ms 2 54 80.00 (76.00; 84.75) 53 82.00 (78.00; 85.00) −2.00 (−4.00; 2.00) 0.389 0.620 P100 OL μV 2 54 9.61 (6.44; 13.54) 53 12.70 (9.13; 15.34) −3.09 (−4.81; −0.71) 0.008 0.185 P100 OL ms 2 54 106.93 ± 7.24 53 108.08 ± 7.24 −1.15 (−3.93; 1.63) 0.4141 0.620 N135 OL μV 2 54 −9.76 (−14.40; −7.06) 53 −13.78 (−15.77; −9.49) 4.02 (0.32;5.02) 0.028 0.196 N135 OL ms 2 54 150.24 ± 11.93 53 151.89 ± 15.58 −1.65 (−6.96; 3.67) 0.5401 0.678 Groups were compared with the Student t-test or the Mann–Whitney U test, as appropriate. p-adj are the p-values corrected with Benjamini–Hochberg adjustment for multiple comparisons. Confounding factors not considered. M, mean; SD, standard deviation; Me, median; IQR, interquartile range; MD, mean or median difference (males vs females); CI, confidence interval. Table 3.
Comparison of analyzed parameters between males and females.
-
Variable n M ± SD, left eye M ± SD, right eye Me (IQR), left eye Me (IQR), right eye p (Wilcoxon) ICC 95% CI for ICC p (ICC) N75 μV 1 105 −2.81 ± 2.42 −2.47 ± 2.55 −2.53 (−4.00; −1.16) −2.01 (−3.99; −0.83) 0.102 0.676 0.558 to 0.768 < 0.001 N75 ms 1 105 70.27 ± 7.32 70.18 ± 7.02 70.00 (66.00; 74.00) 71.00 (68.00; 74.00) 0.861 0.431 0.262 to 0.574 < 0.001 P100 μV 1 105 9.75 ± 4.53 10.02 ± 4.70 8.97 (6.34; 11.61) 9.07 (7.04; 12.17) 0.193 0.864 0.806 to 0.905 < 0.001 P100 ms 1 105 100.69 ± 5.73 101.25 ± 6.01 101.00 (98.00; 104.00) 101.00 (98.00; 105.00) 0.404 0.632 0.501 to 0.734 < 0.001 N135 μV 1 105 −10.55 ± 5.65 −10.82 ± 5.52 −9.76 (−13.62; − 6.86) −10.22 (−13.39; −6.93) 0.326 0.891 0.844 to 0.925 < 0.001 N135 ms 1 105 141.70 ± 12.65 141.16 ± 13.01 141.00 (133.00; 148.00) 141.00 (134.00; 149.00) 0.845 0.699 0.587 to 0.785 < 0.001 N75 μV 2 106 −4.52 ± 3.17 −4.69 ± 3.71 −4.04 (−5.89; −2.42) −4.63 (−5.90; −2.55) 0.194 0.758 0.664 to 0.829 < 0.001 N75 ms 2 107 80.21 ± 8.19 80.85 ± 7.47 81.00 (76.50; 85.00) 81.00 (78.00; 85.00) 0.304 0.613 0.480 to 0.719 < 0.001 P100 μV 2 107 11.70 ± 5.95 11.96 ± 6.88 10.99 (7.56; 14.21) 10.95 (6.77; 15.61) 0.283 0.890 0.844 to 0.924 < 0.001 P100 ms 2 107 107.50 ± 7.23 107.38 ± 6.53 108.00 (103.00; 112.00) 106.00 (102.00; 112.00) 0.925 0.654 0.531 to 0.750 < 0.001 N135 μV 2 106 −12.11 ± 6.87 −12.25 ± 7.04 −11.12 (−15.67; −7.75) −11.48 (−16.76; −7.03) 0.794 0.880 0.829 to 0.917 < 0.001 N135 ms 2 107 151.06 ± 13.82 152.51 ± 13.18 151.00 (141.00; 162.00) 153.00 (143.50; 164.00) 0.496 0.629 0.499 to 0.731 < 0.001 Correlations between eyes were analyzed using the Wilcoxon test and ICC. M, mean; SD, standard deviation; Me, median; IQR, interquartile range; ICC, intraclass correlation coefficient; CI, confidence interval. Bold values indicate statistically significant intraclass correlation coefficients (p < 0.05) Table 4.
Interocular correlations.
Figures
(3)
Tables
(4)