-
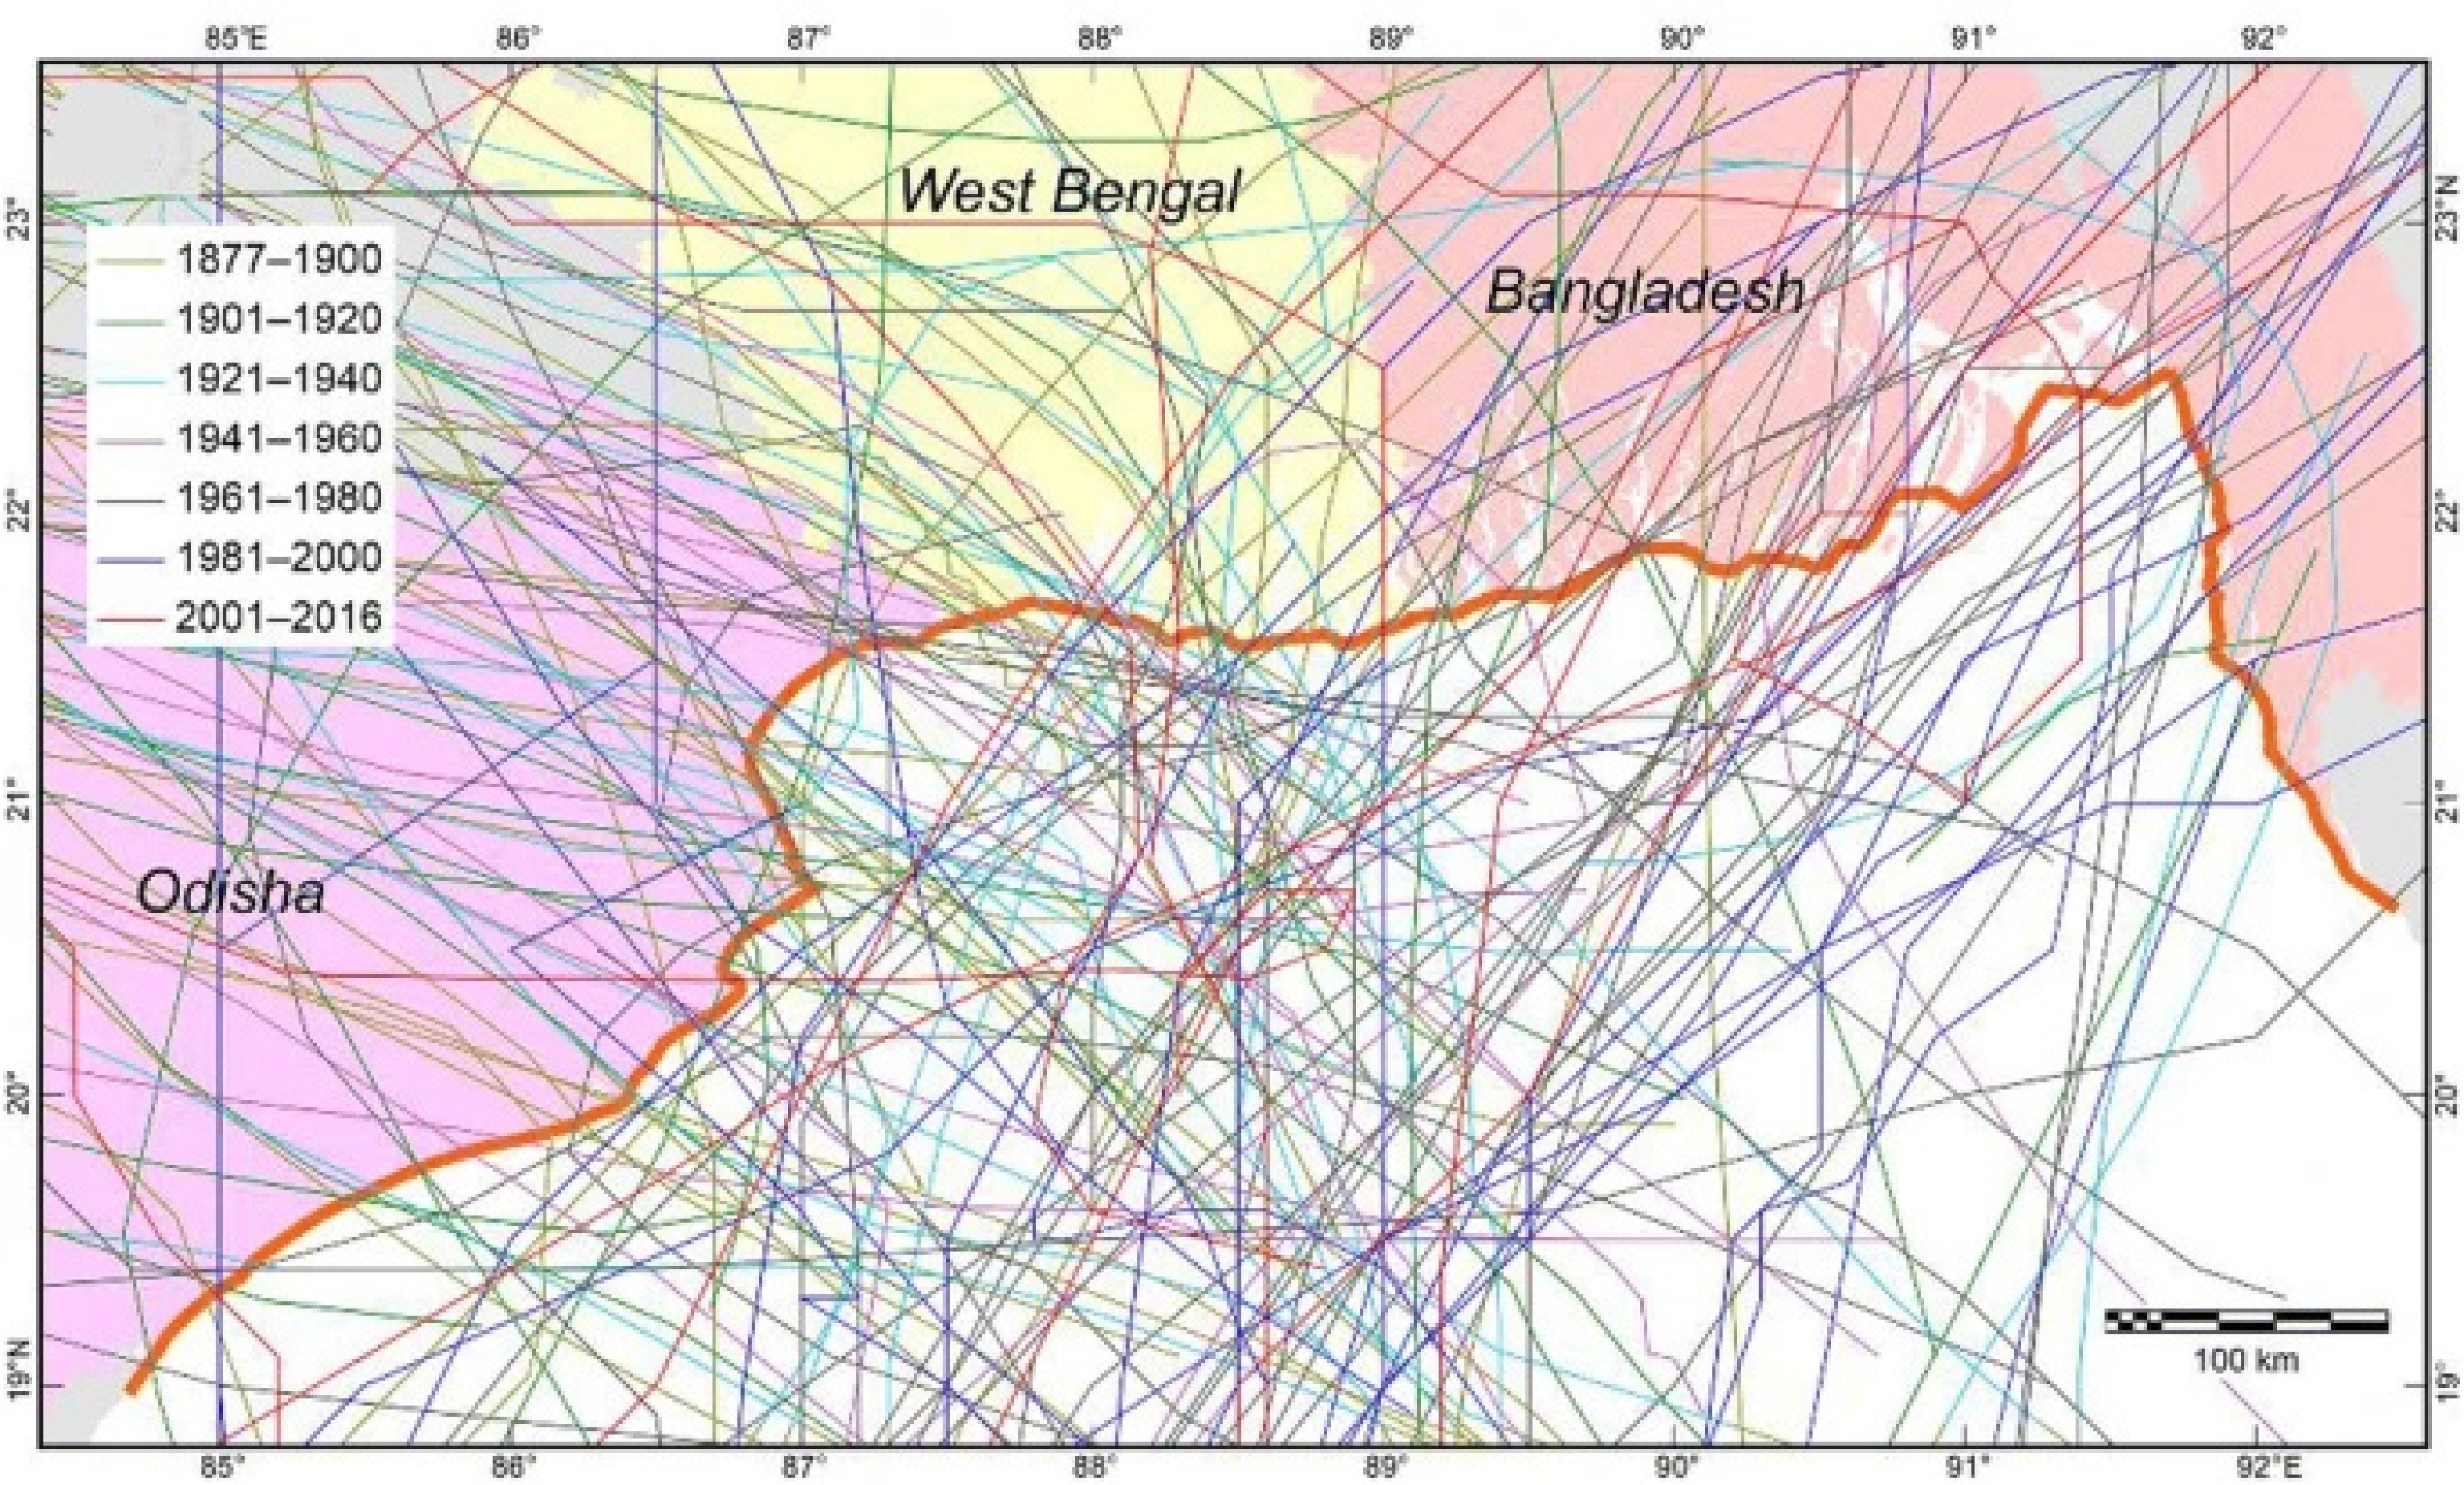
Figure 1.
The path of cyclones and their landfall location generated in the Bay of Bengal from 1877 to 2016 (source: storm track data from IBTrACS, IMD).
-
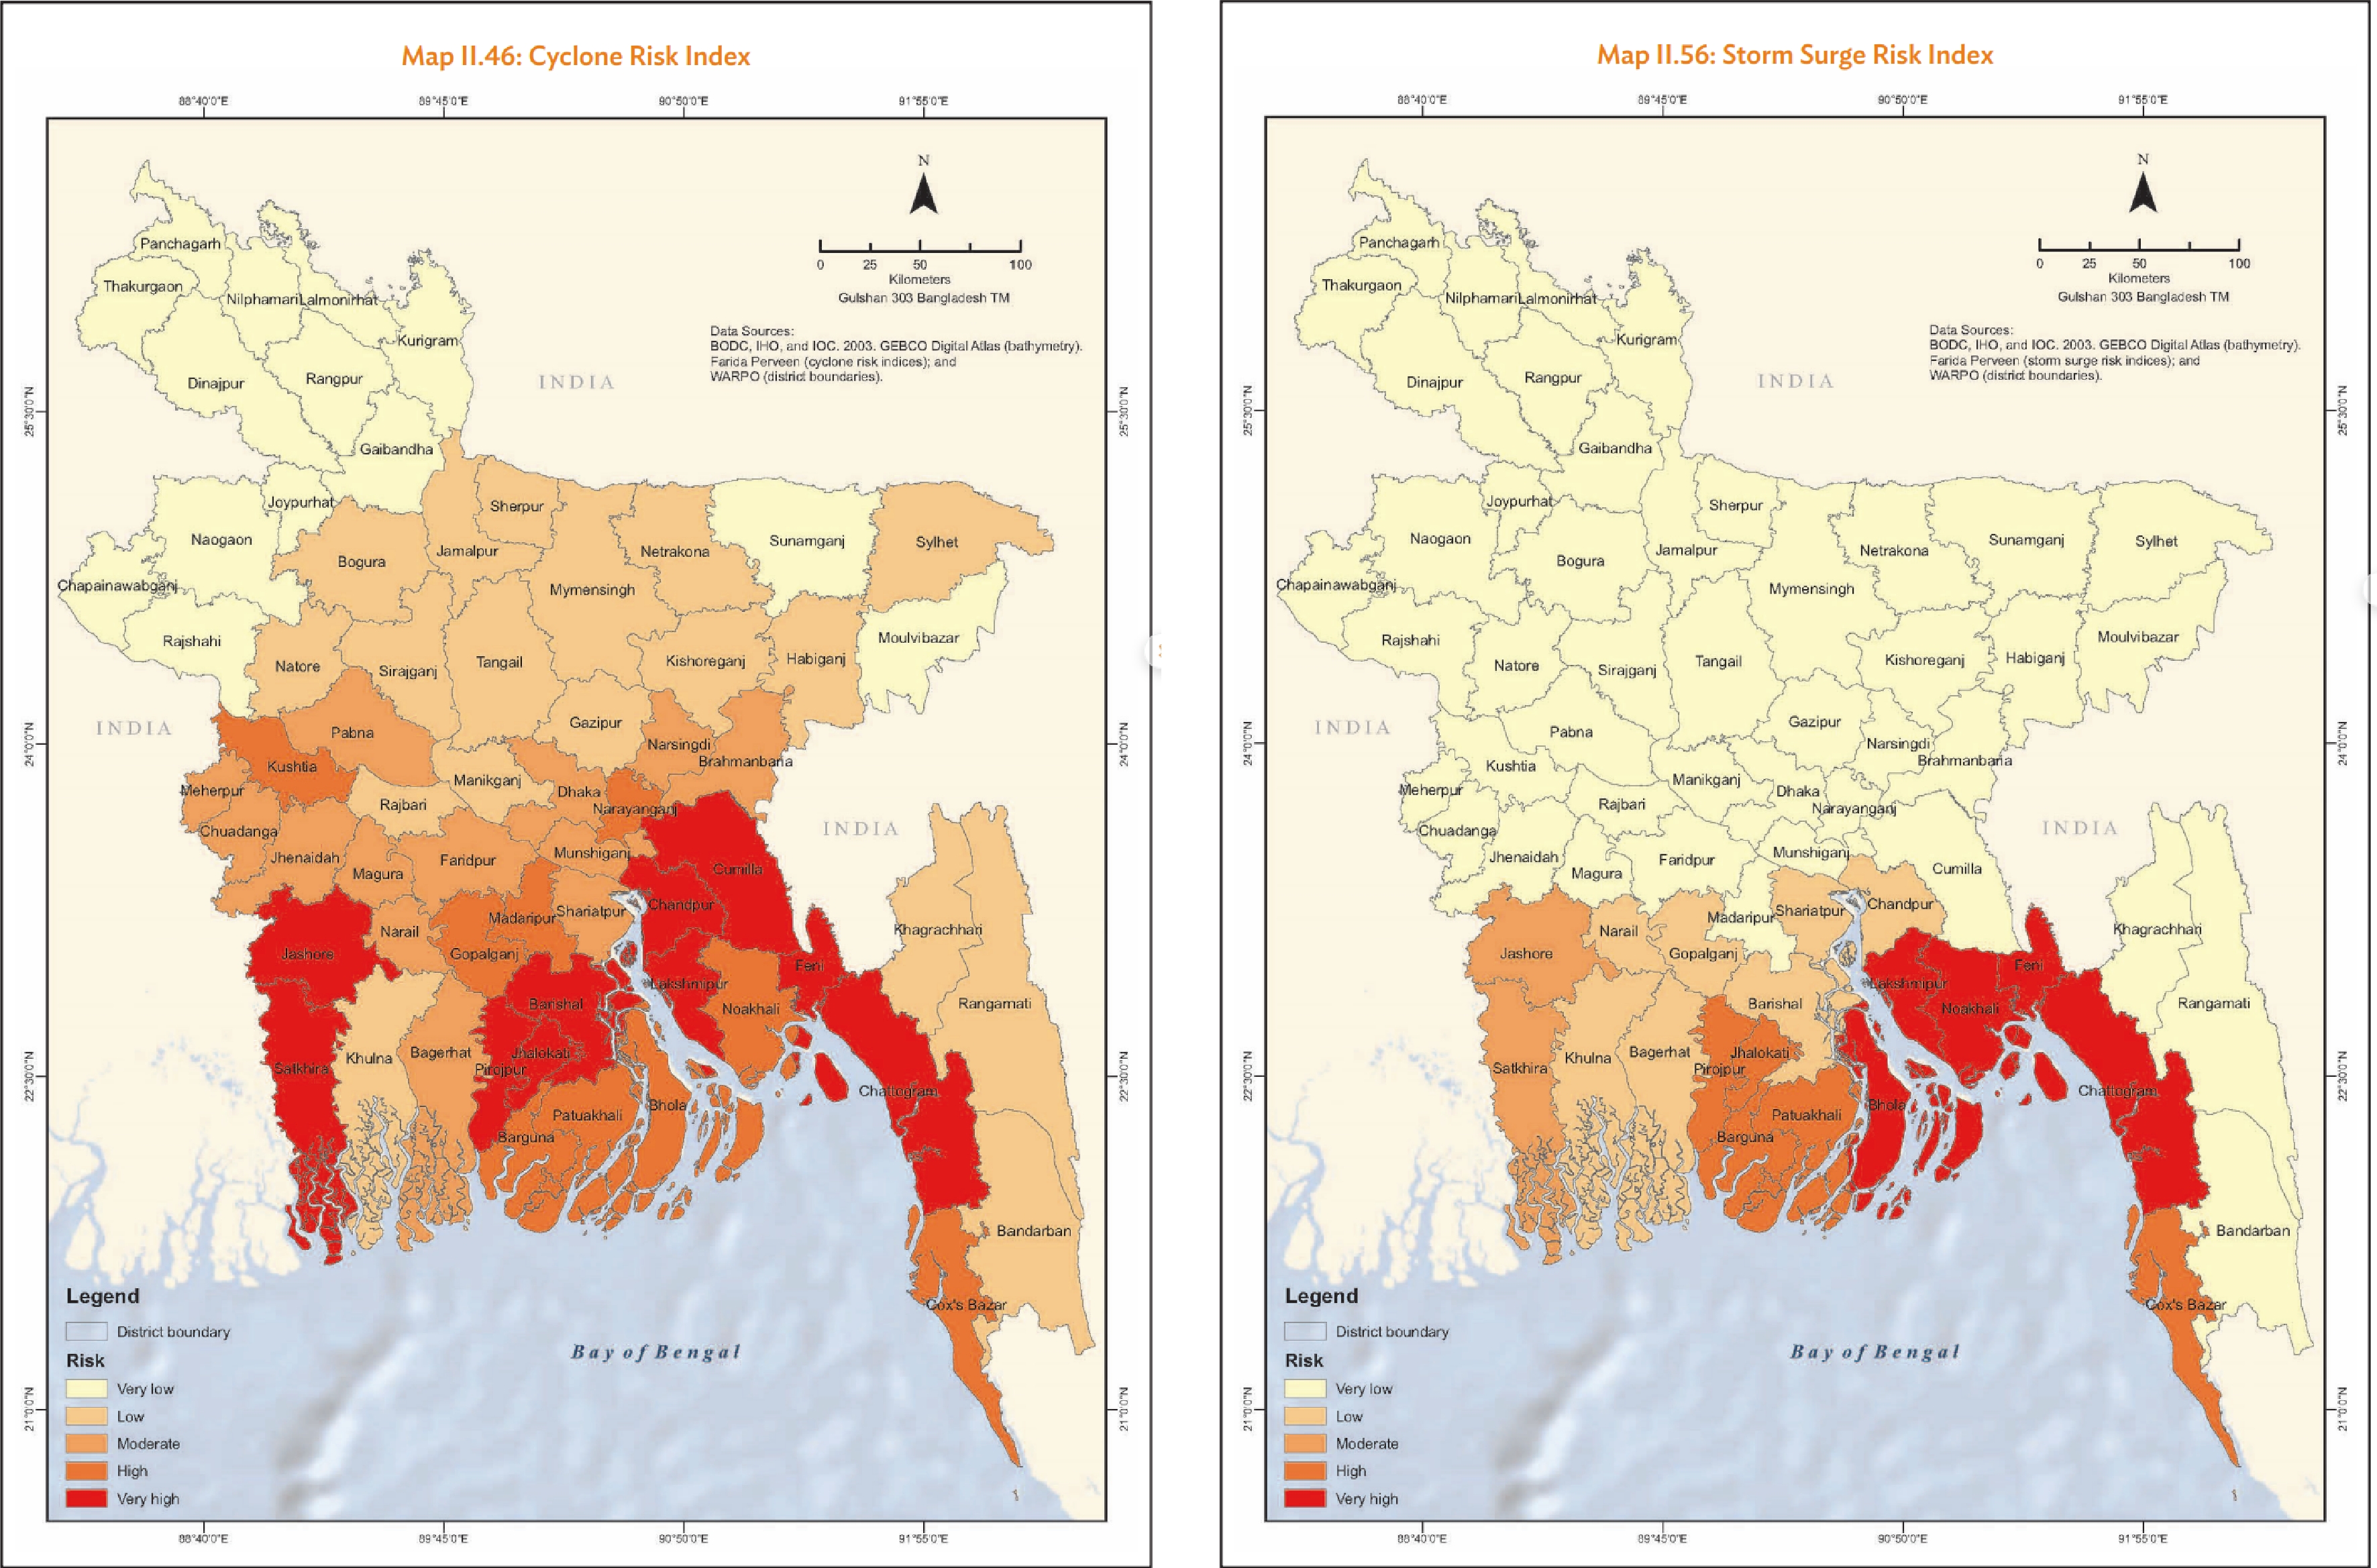
Figure 2.
Cyclone and storm surges risk indexes[18].
-
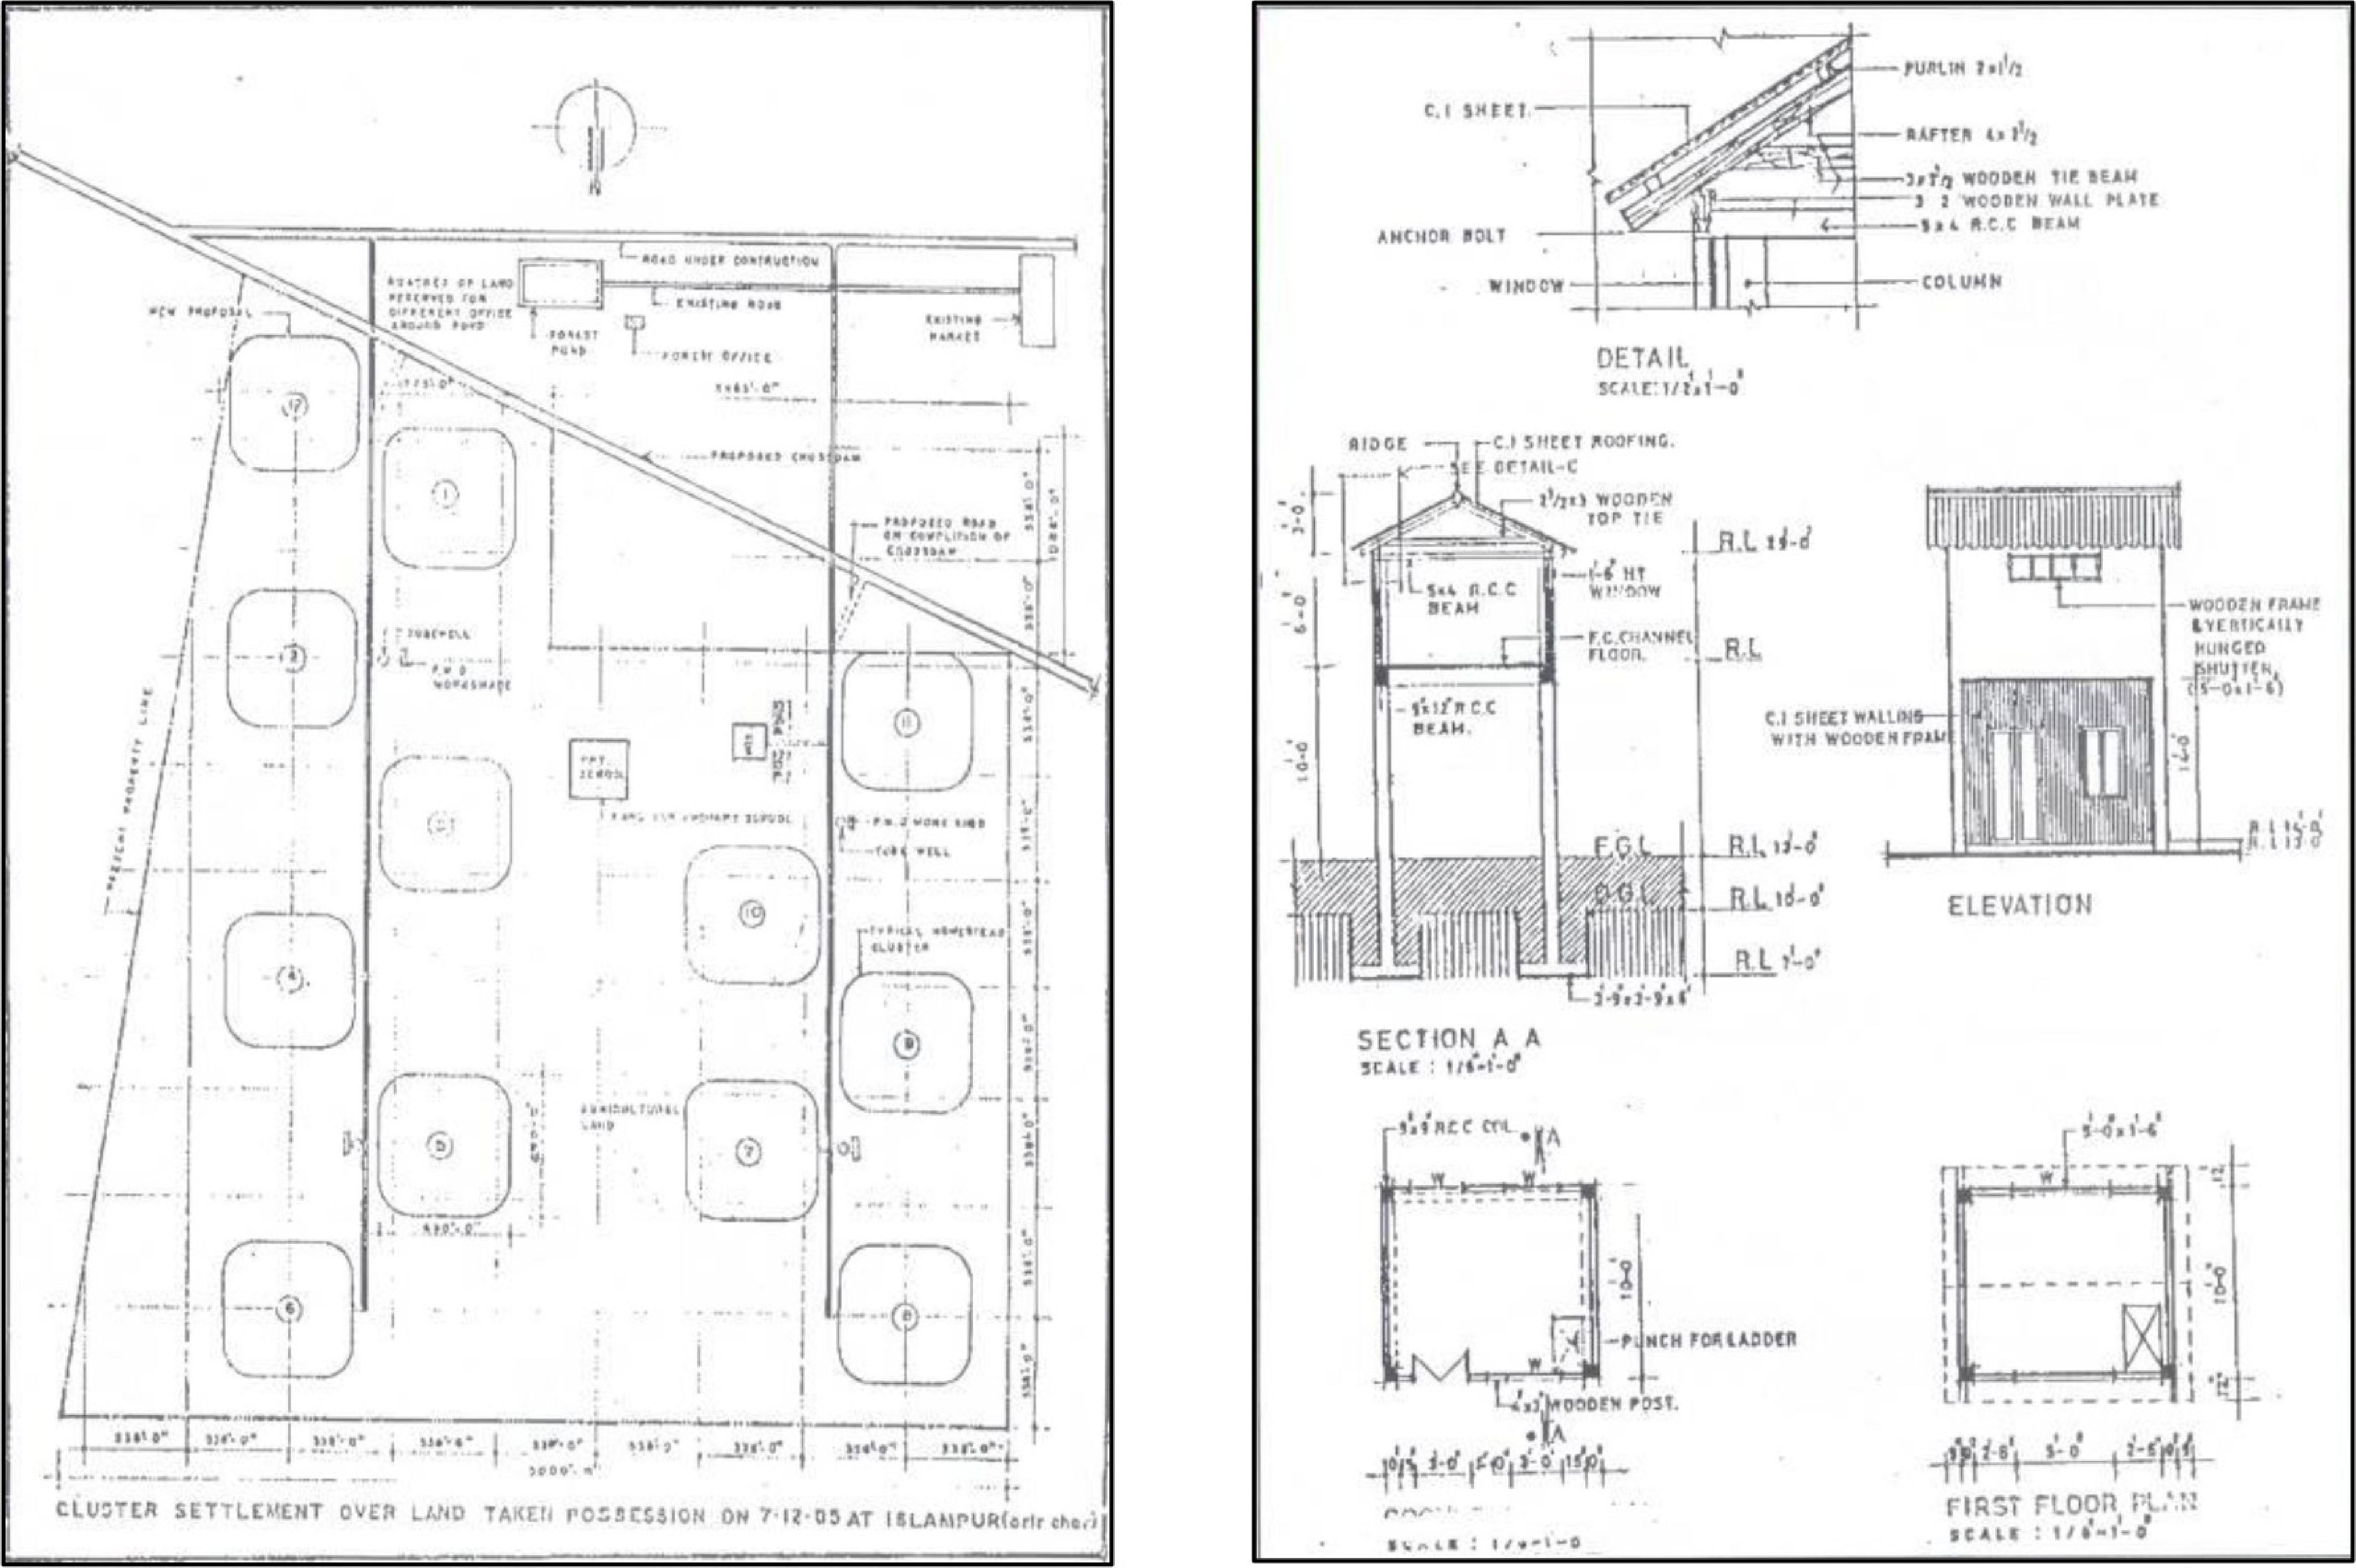
Figure 3.
Houses in Urir Char project 1985[24].
-
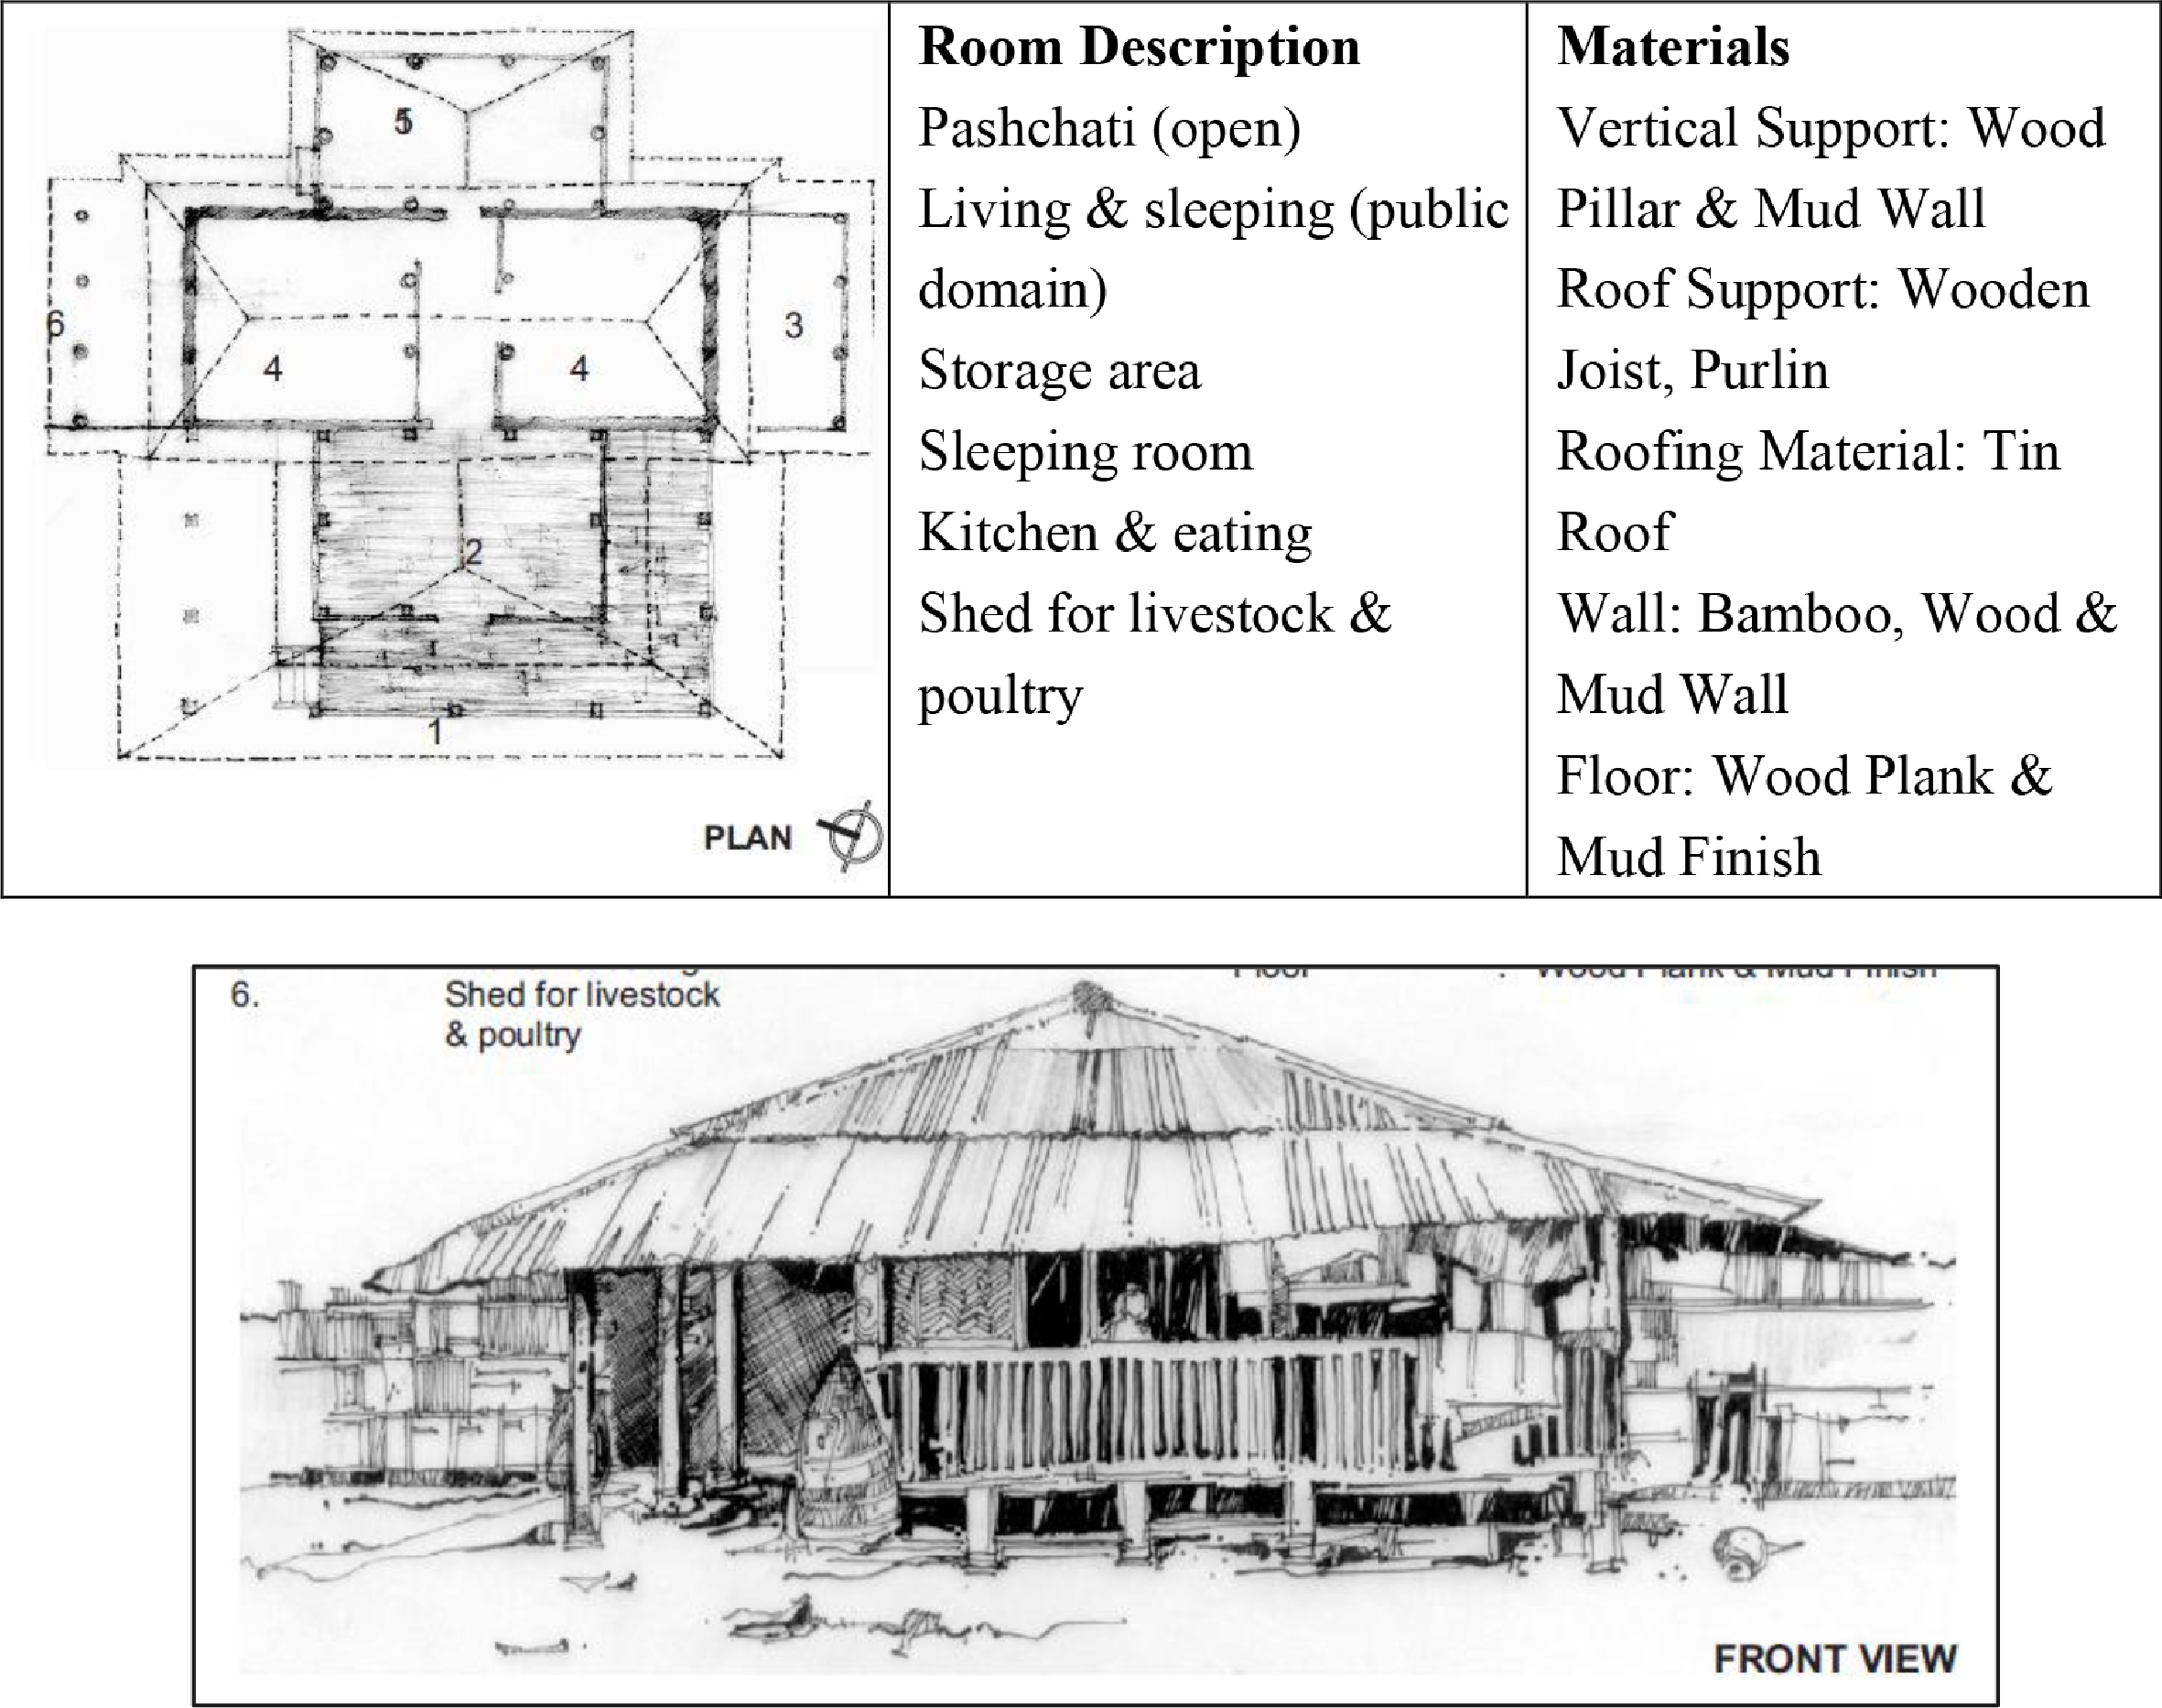
Figure 4.
House of Abdul Jalil, Dangor Para, Teknaf (source: Battling The Storm, Study on Cyclone resistant housing, author).
-
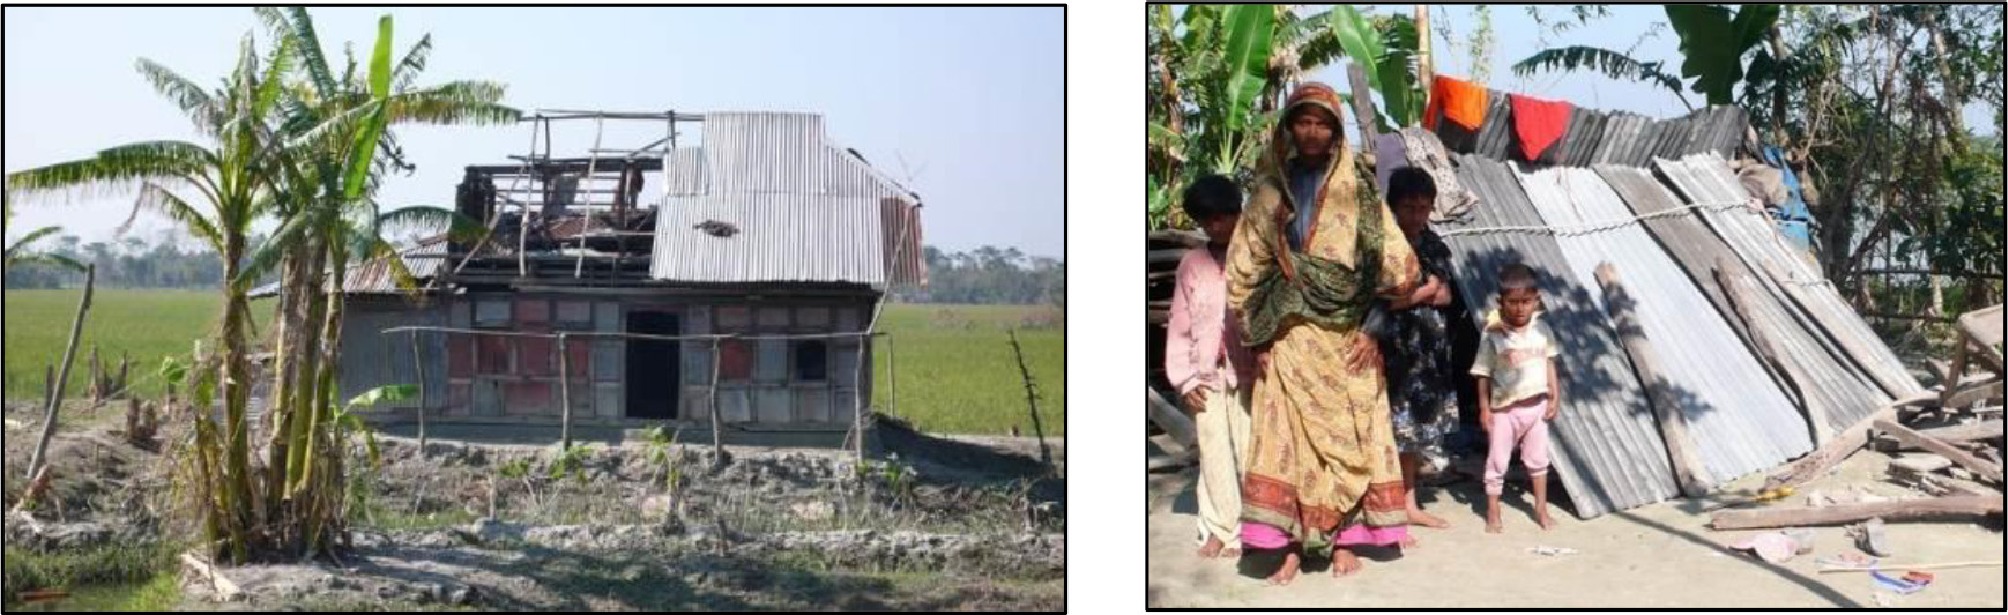
Figure 5.
Damaged house and temporary shelter after SIDR (source: author).
-
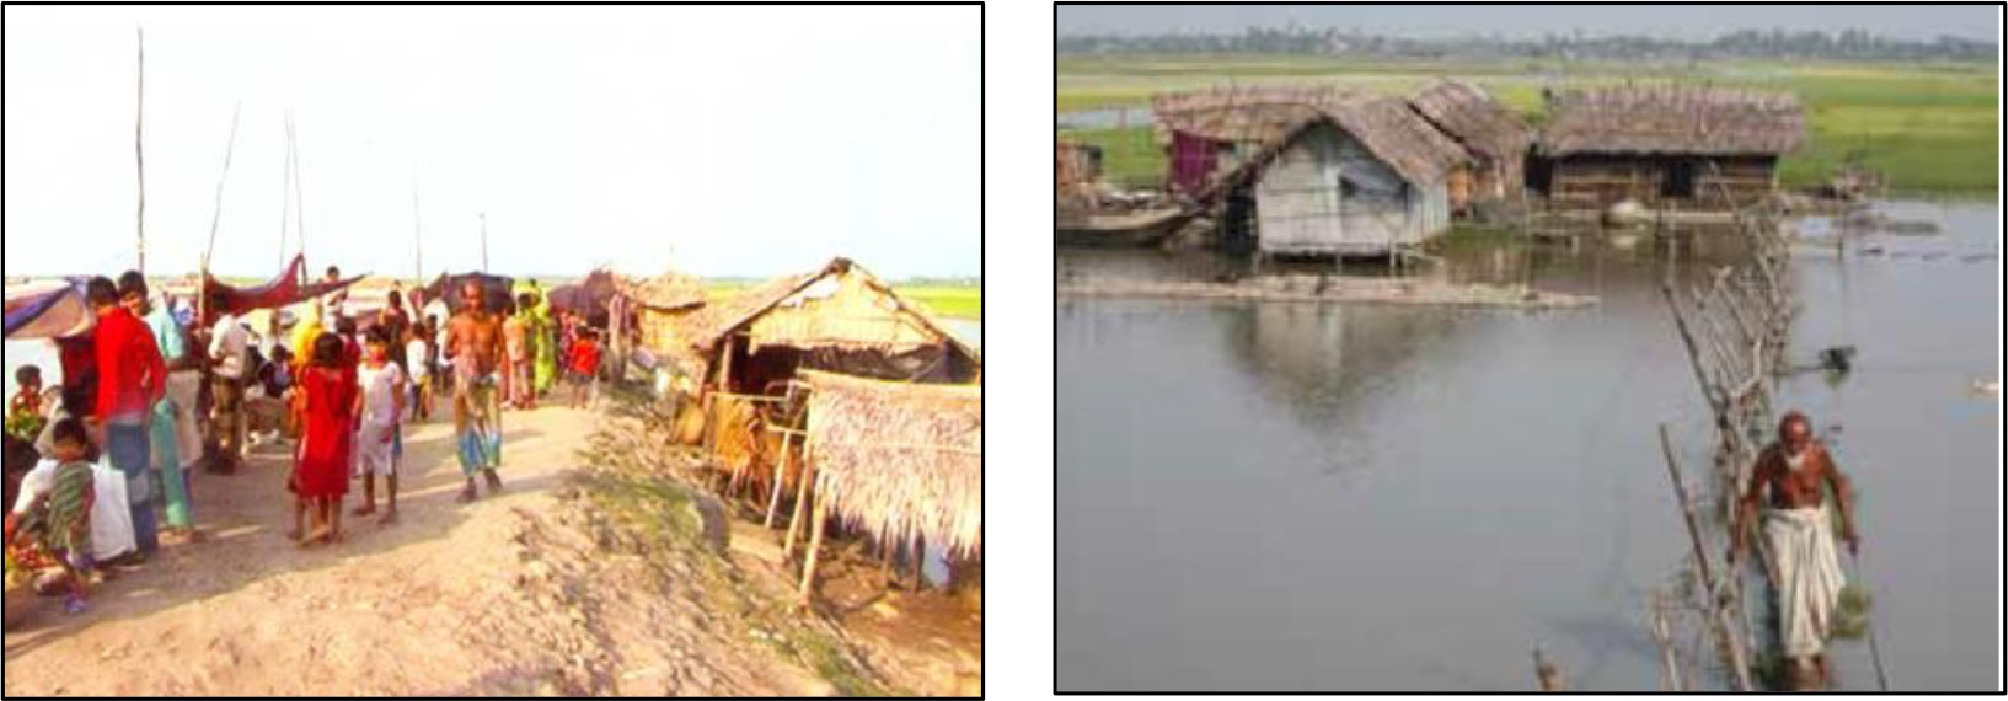
Figure 6.
Left, shelter on an embankment after Aila (source: CDMP). Right, Bainpara was inundated by tidal water (source: CDMP).
-
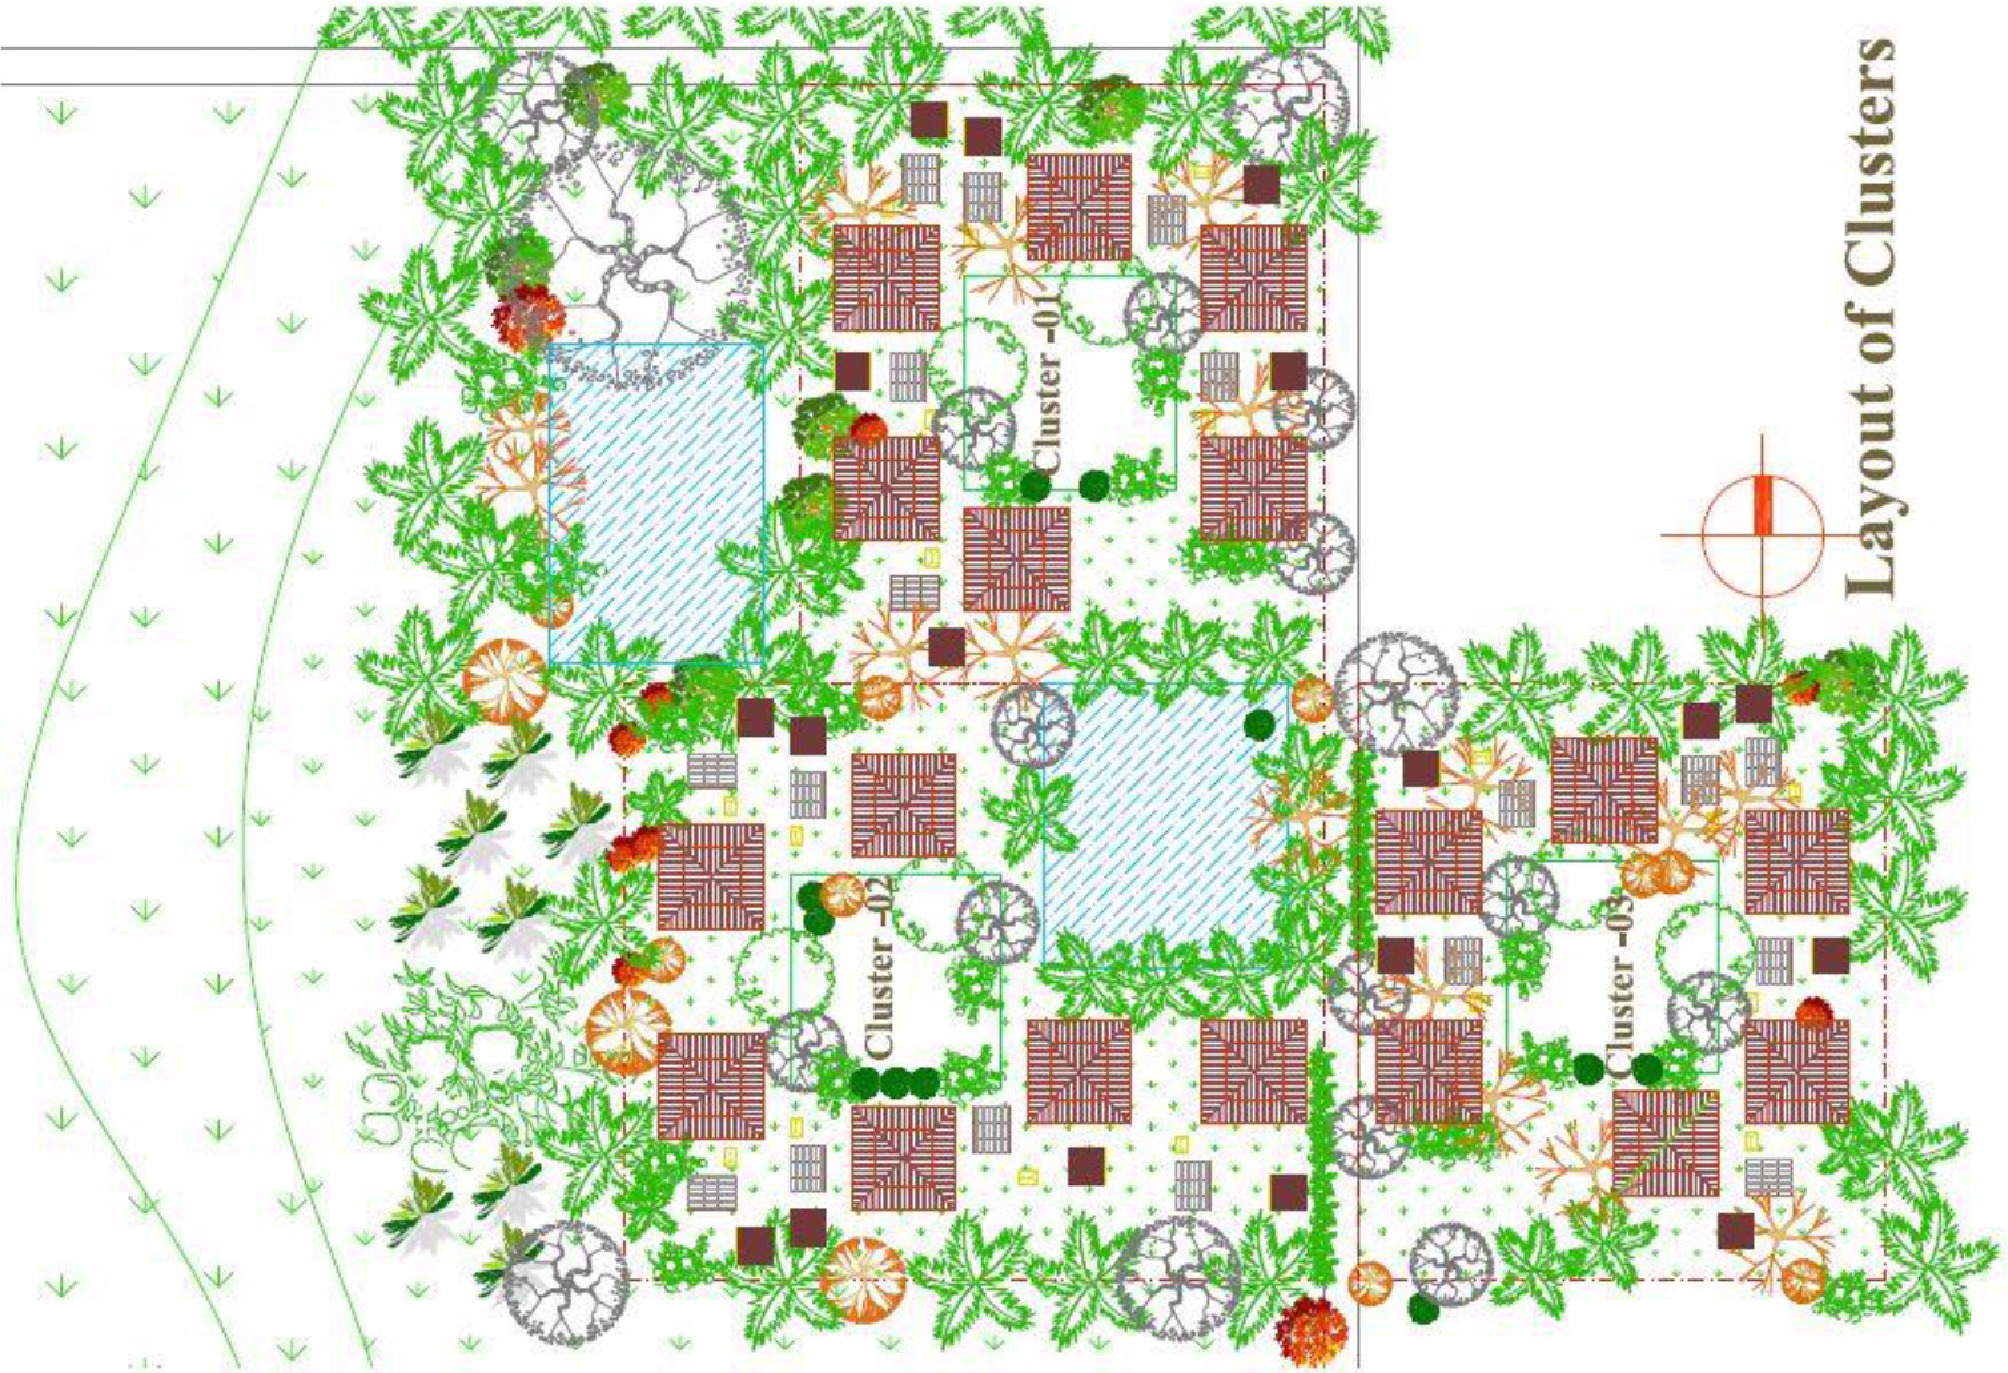
Figure 7.
A modular house block considering its layout and plantation. Source: Author.
-
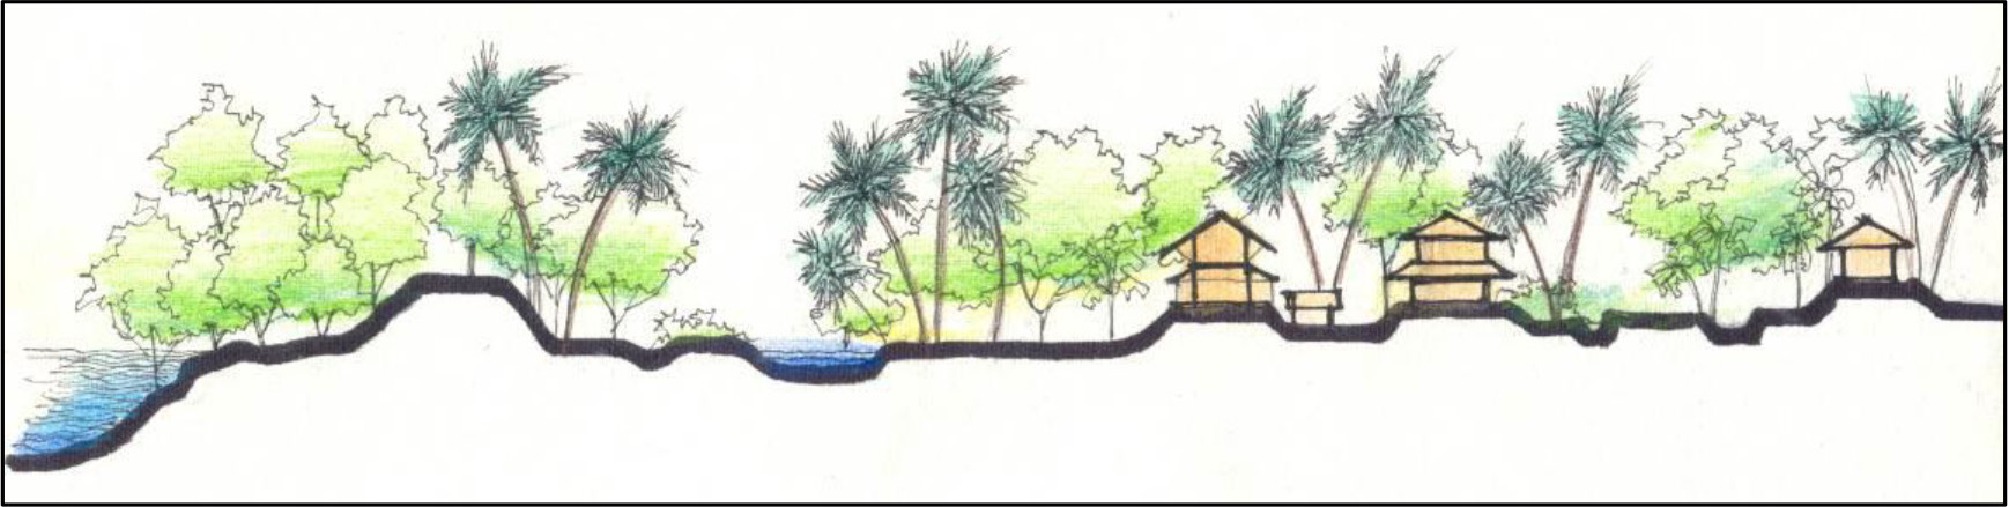
Figure 8.
A safer settlement with mangrove forest, embankment and plantation. Source: Author.
-
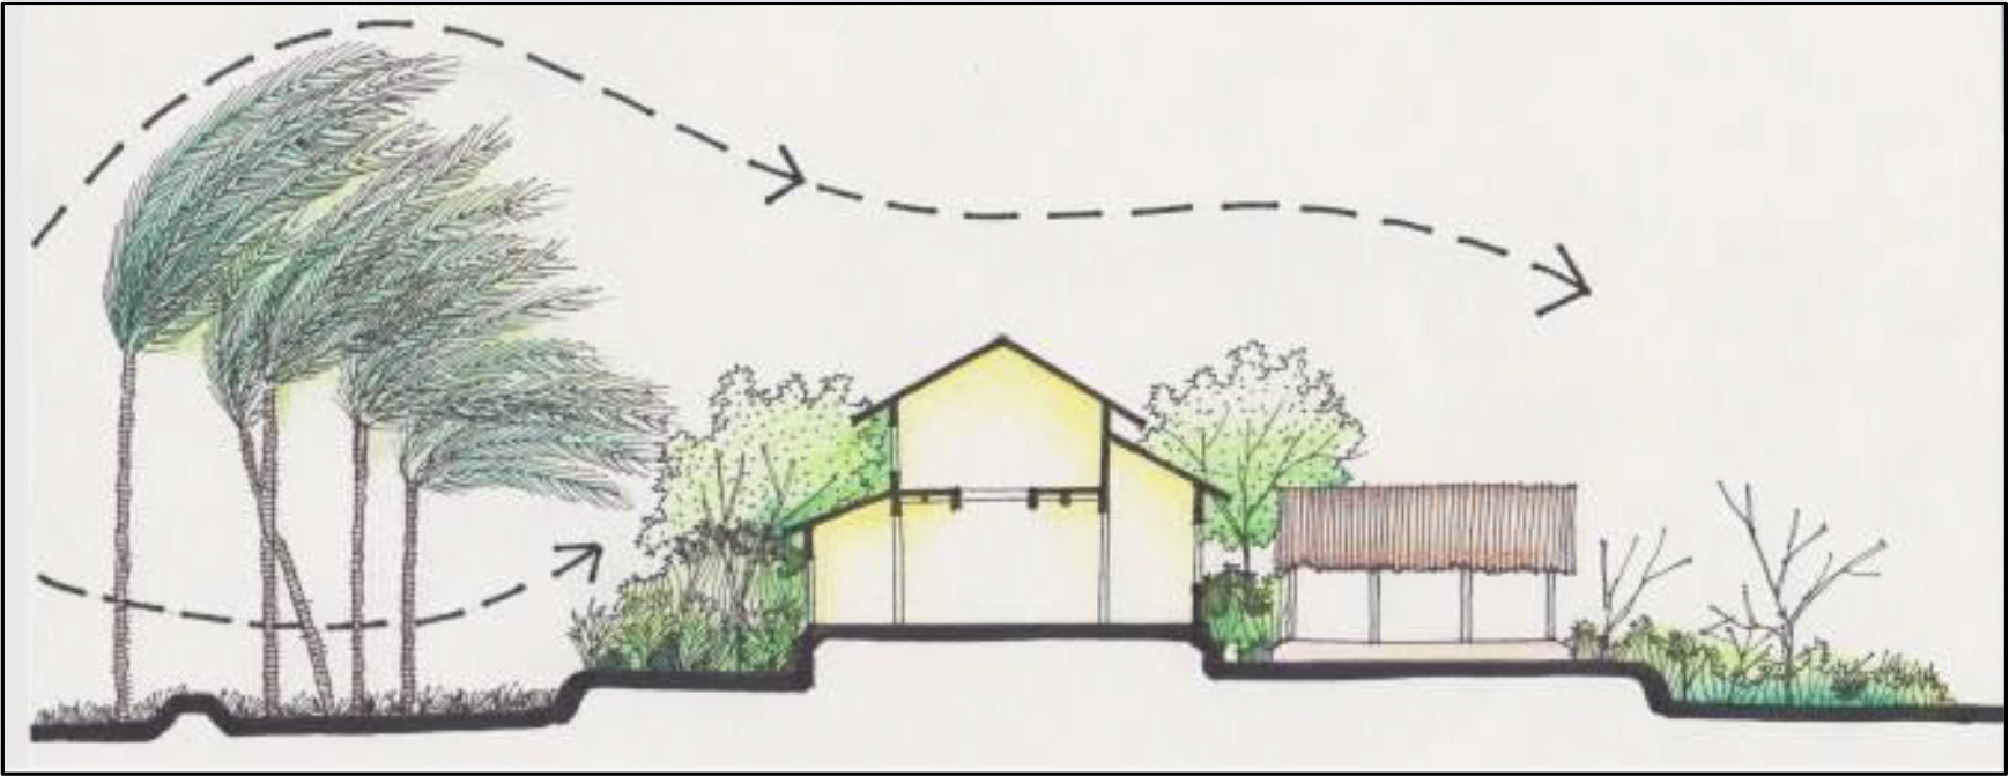
Figure 9.
Layers of plantation with height progression can act like a secondary wind barrier during the cyclone (source: author).
-
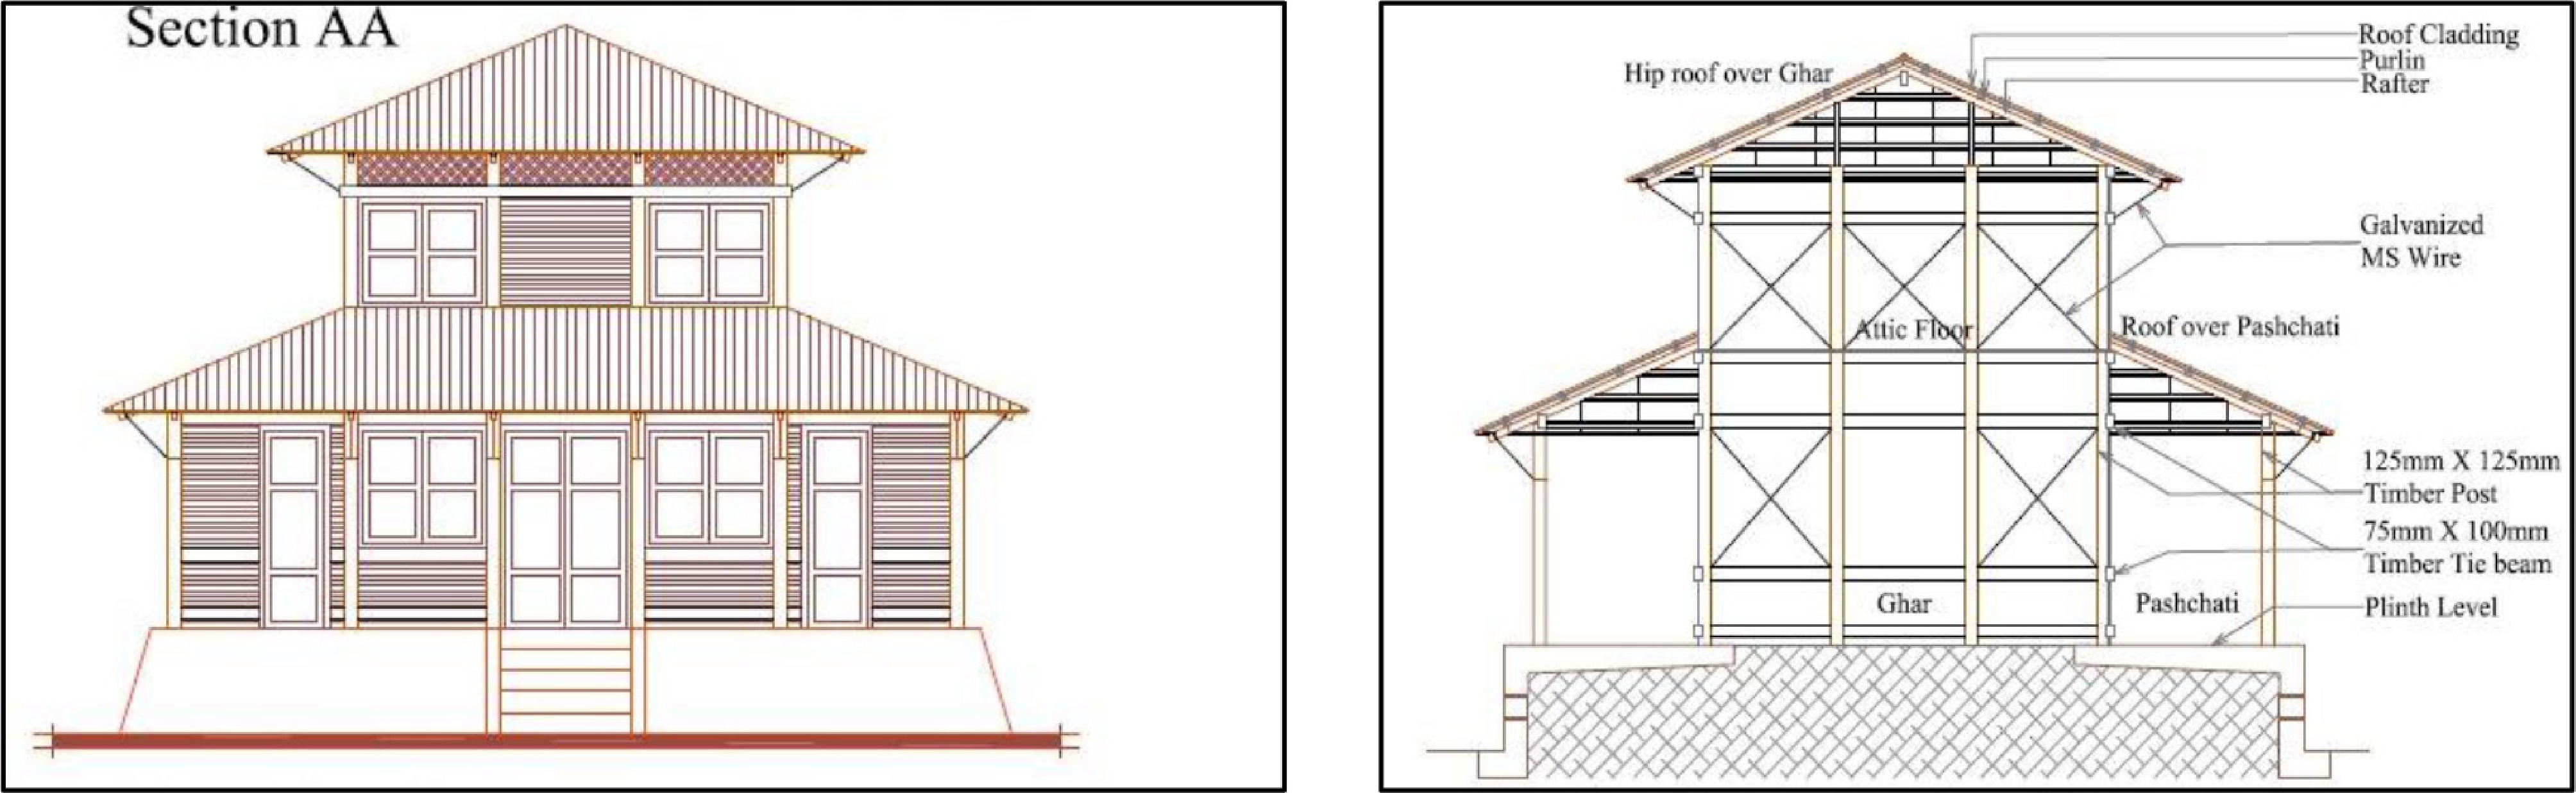
Figure 10.
Double-layered house shelter during tidal surge (source: author).
-
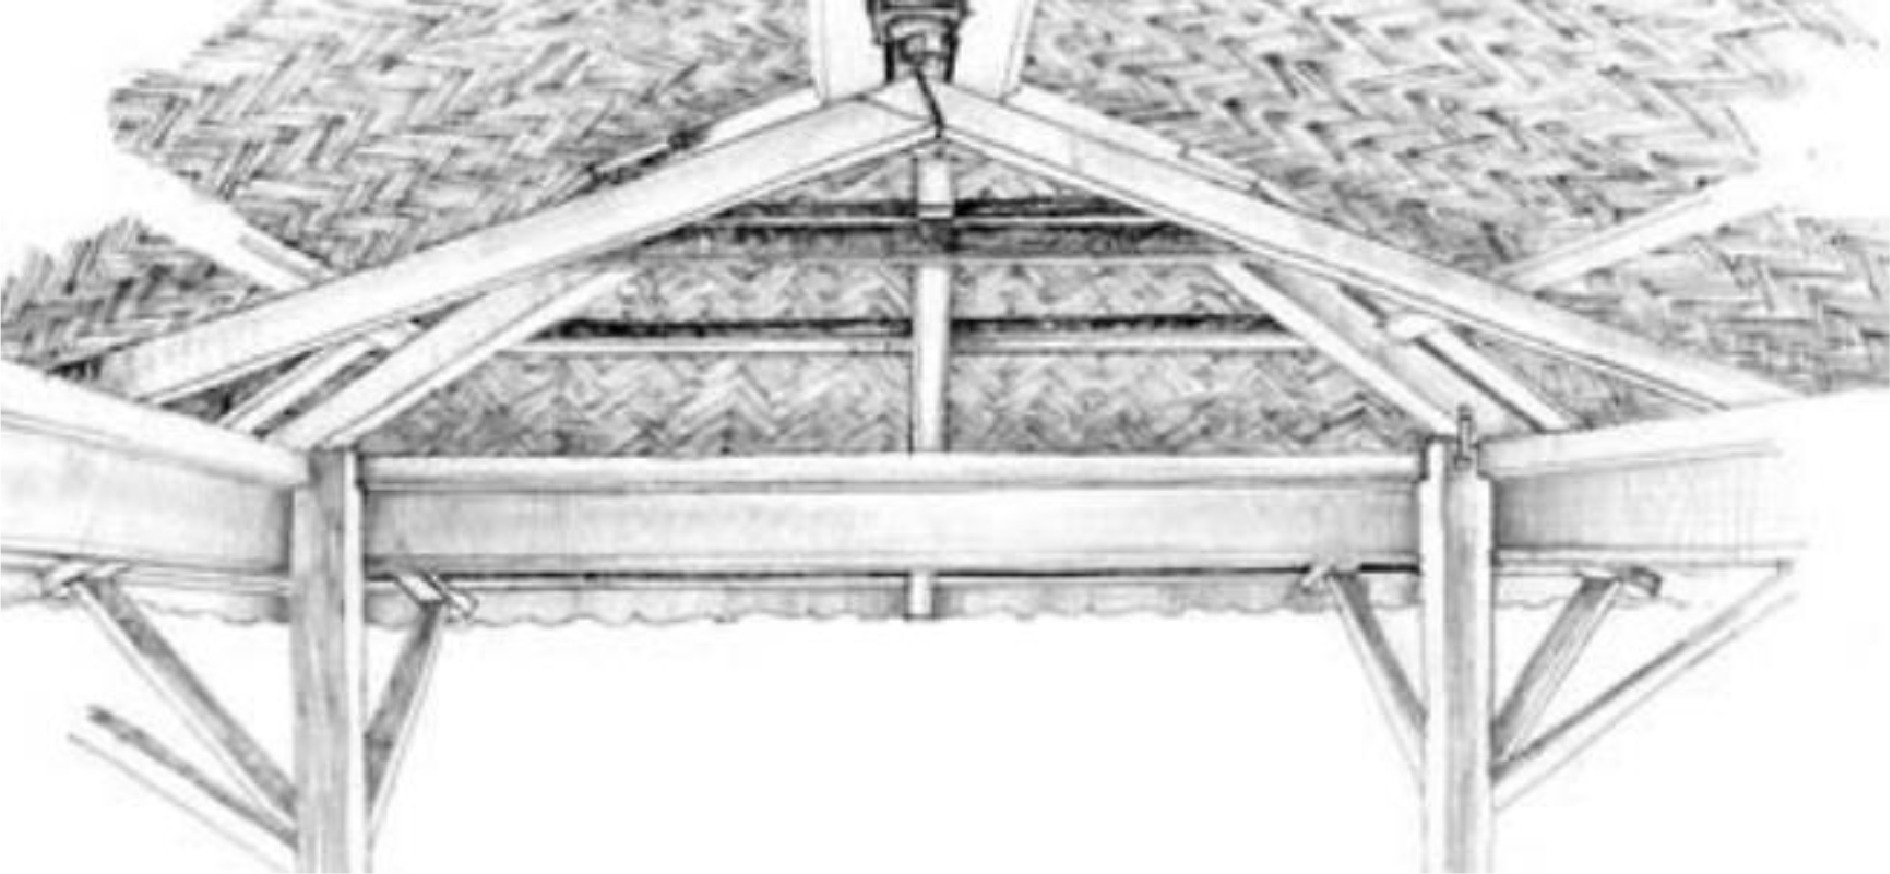
Figure 11.
Entry of a resilient house with indigenous joinery details found during field survey at Chakaria, Coxs' Bazar (source: Battling The Storm, Study on Cyclone Resistant Housing).
-
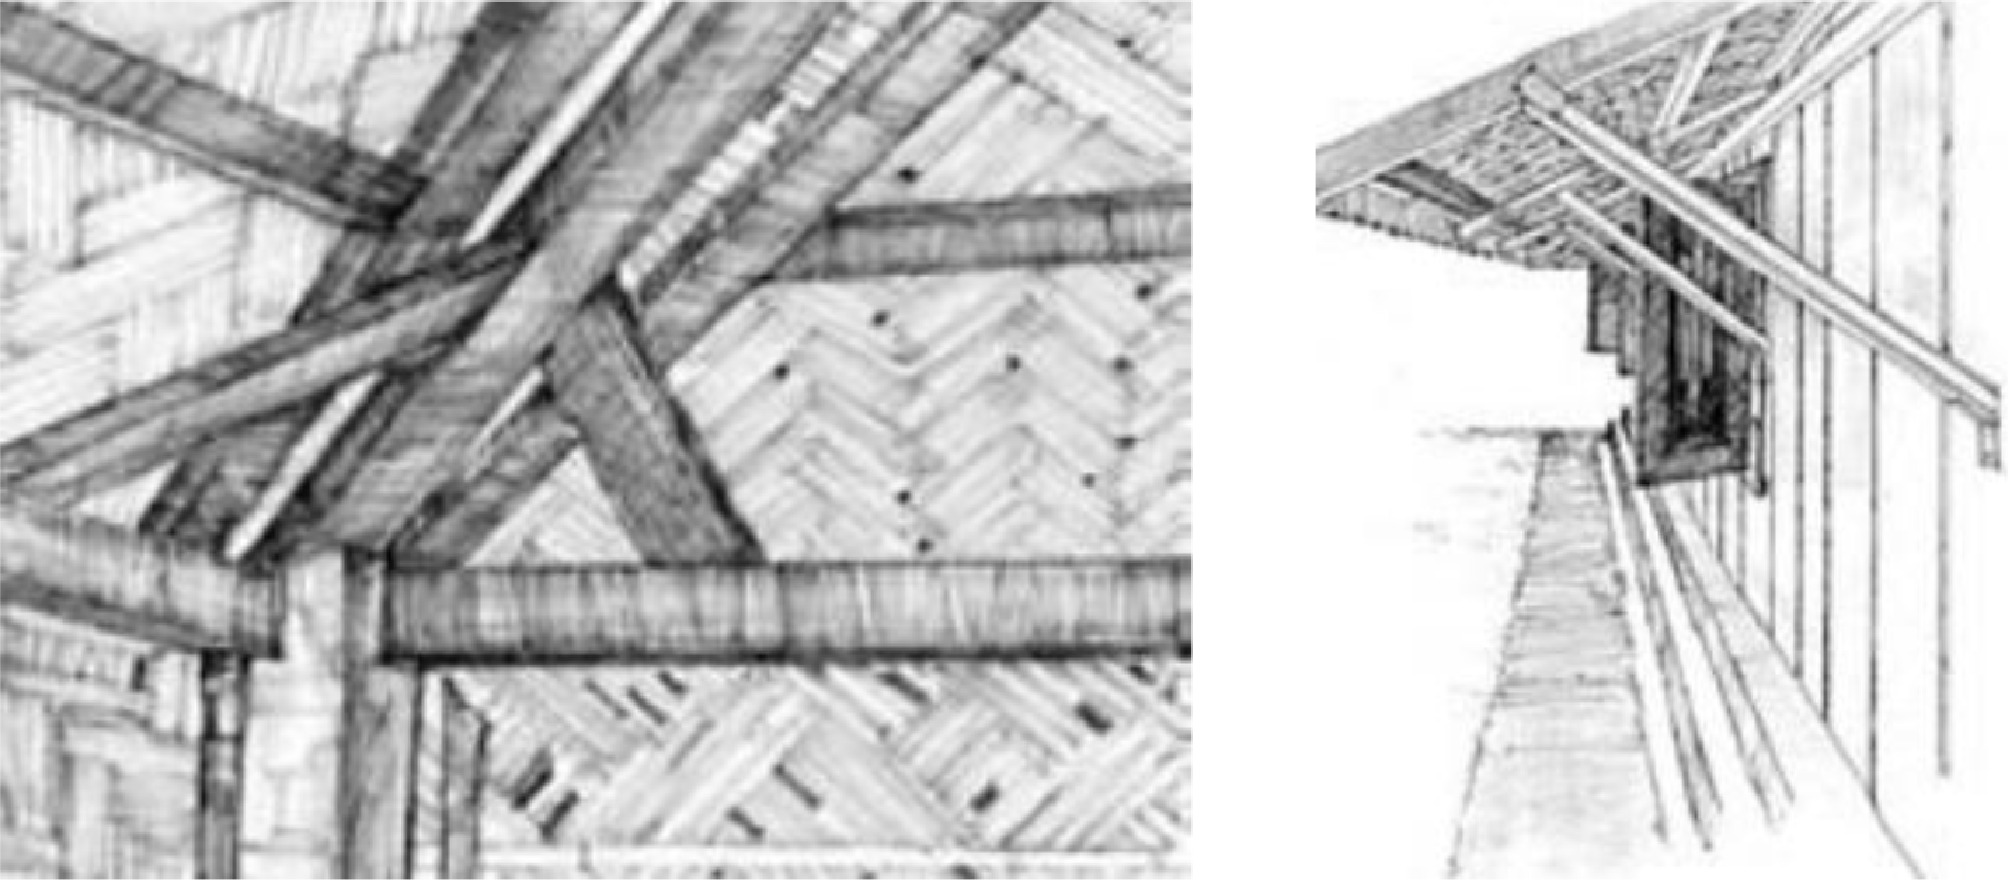
Figure 12.
An Indigenous style of corner details and roof supporting buttresses found during field survey at Chakaria, Coxs' Bazar (source: Battling The Storm, Study on Cyclone Resistant Housing).
-
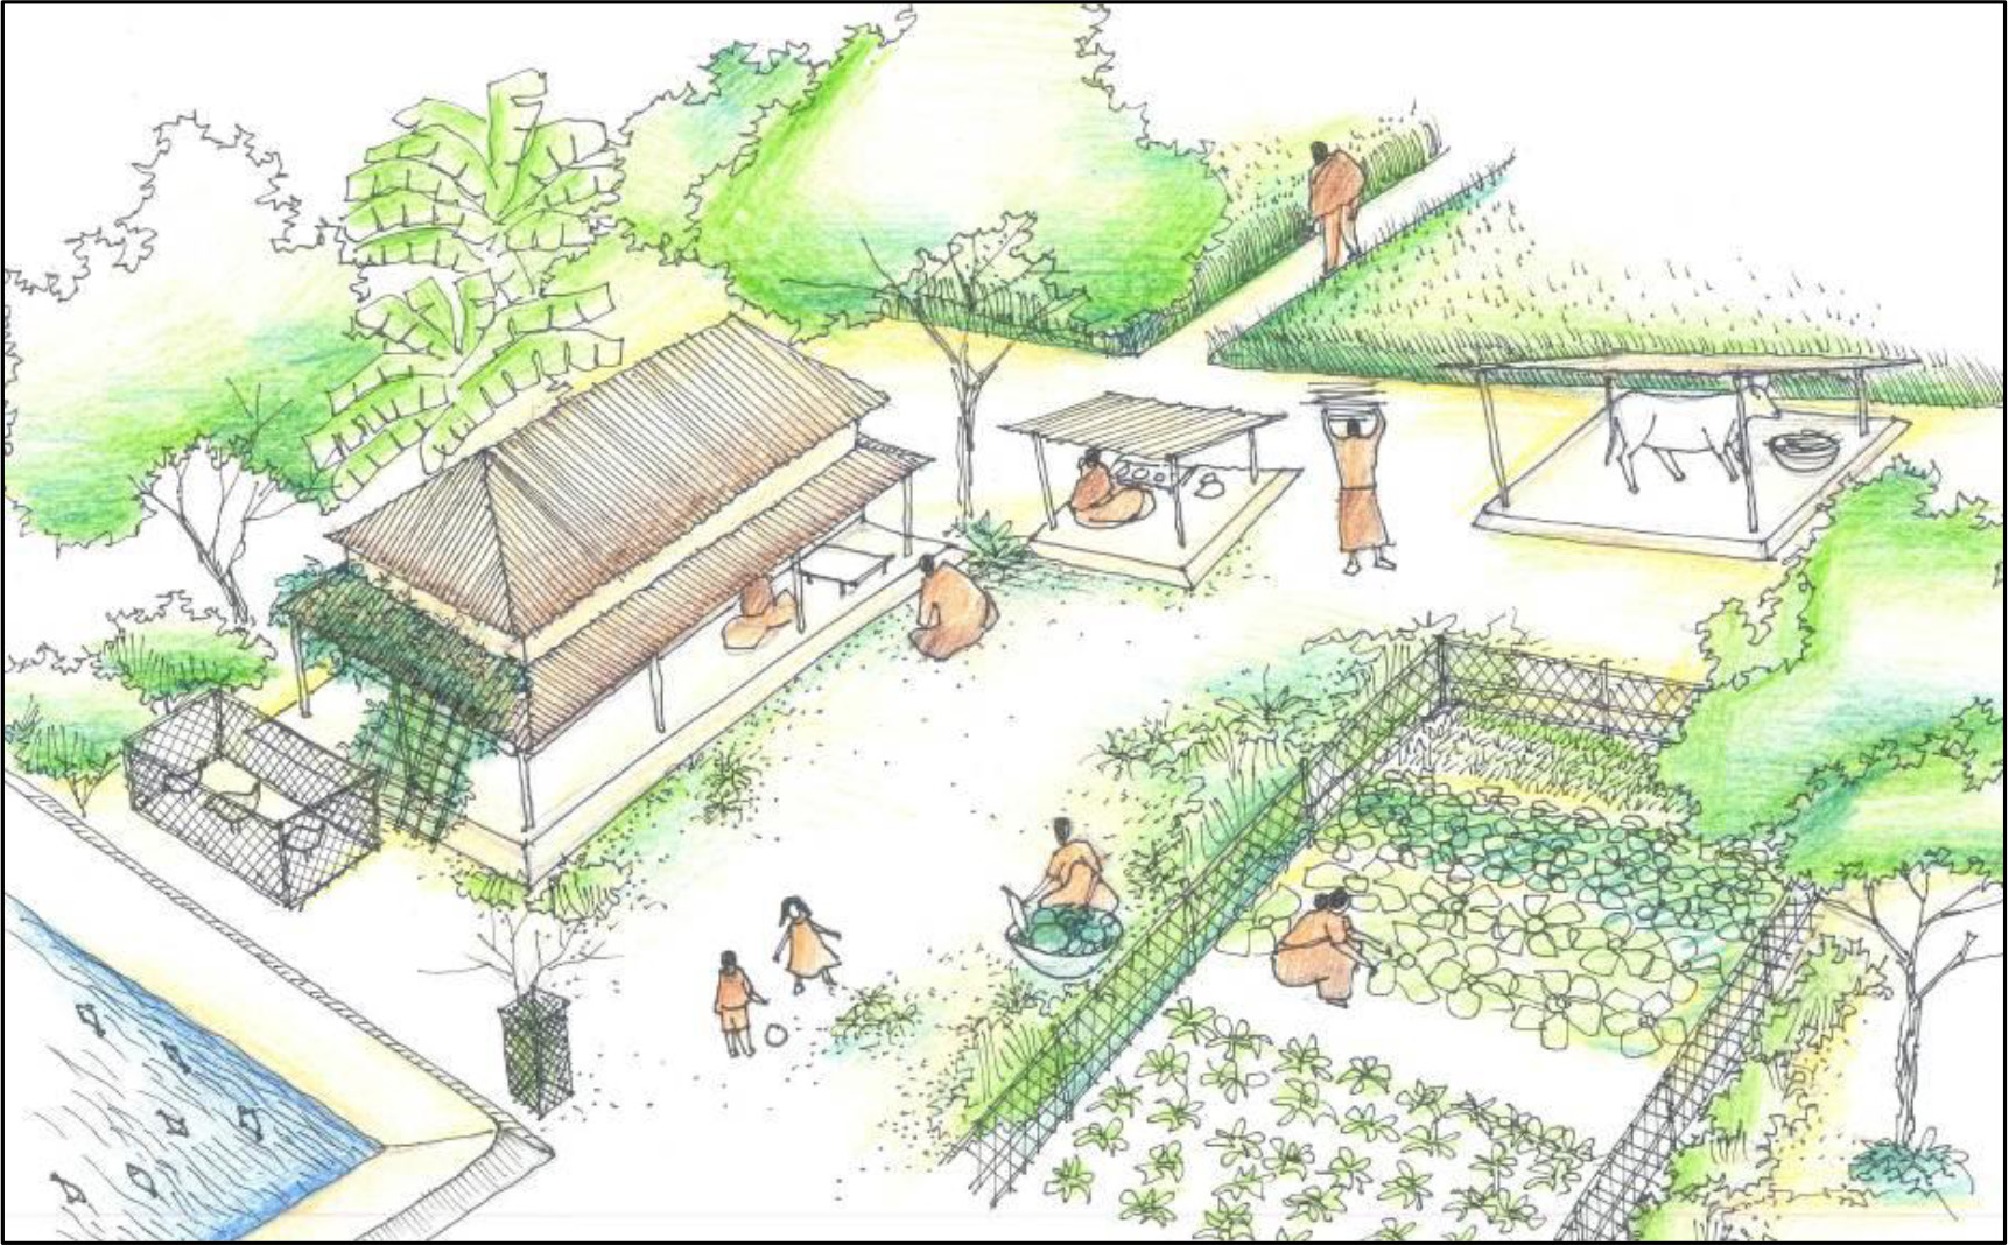
Figure 13.
Integrated homestead farming as a sustainable livelihood approach (SLA) (source: author).
Figures
(13)
Tables
(0)