-
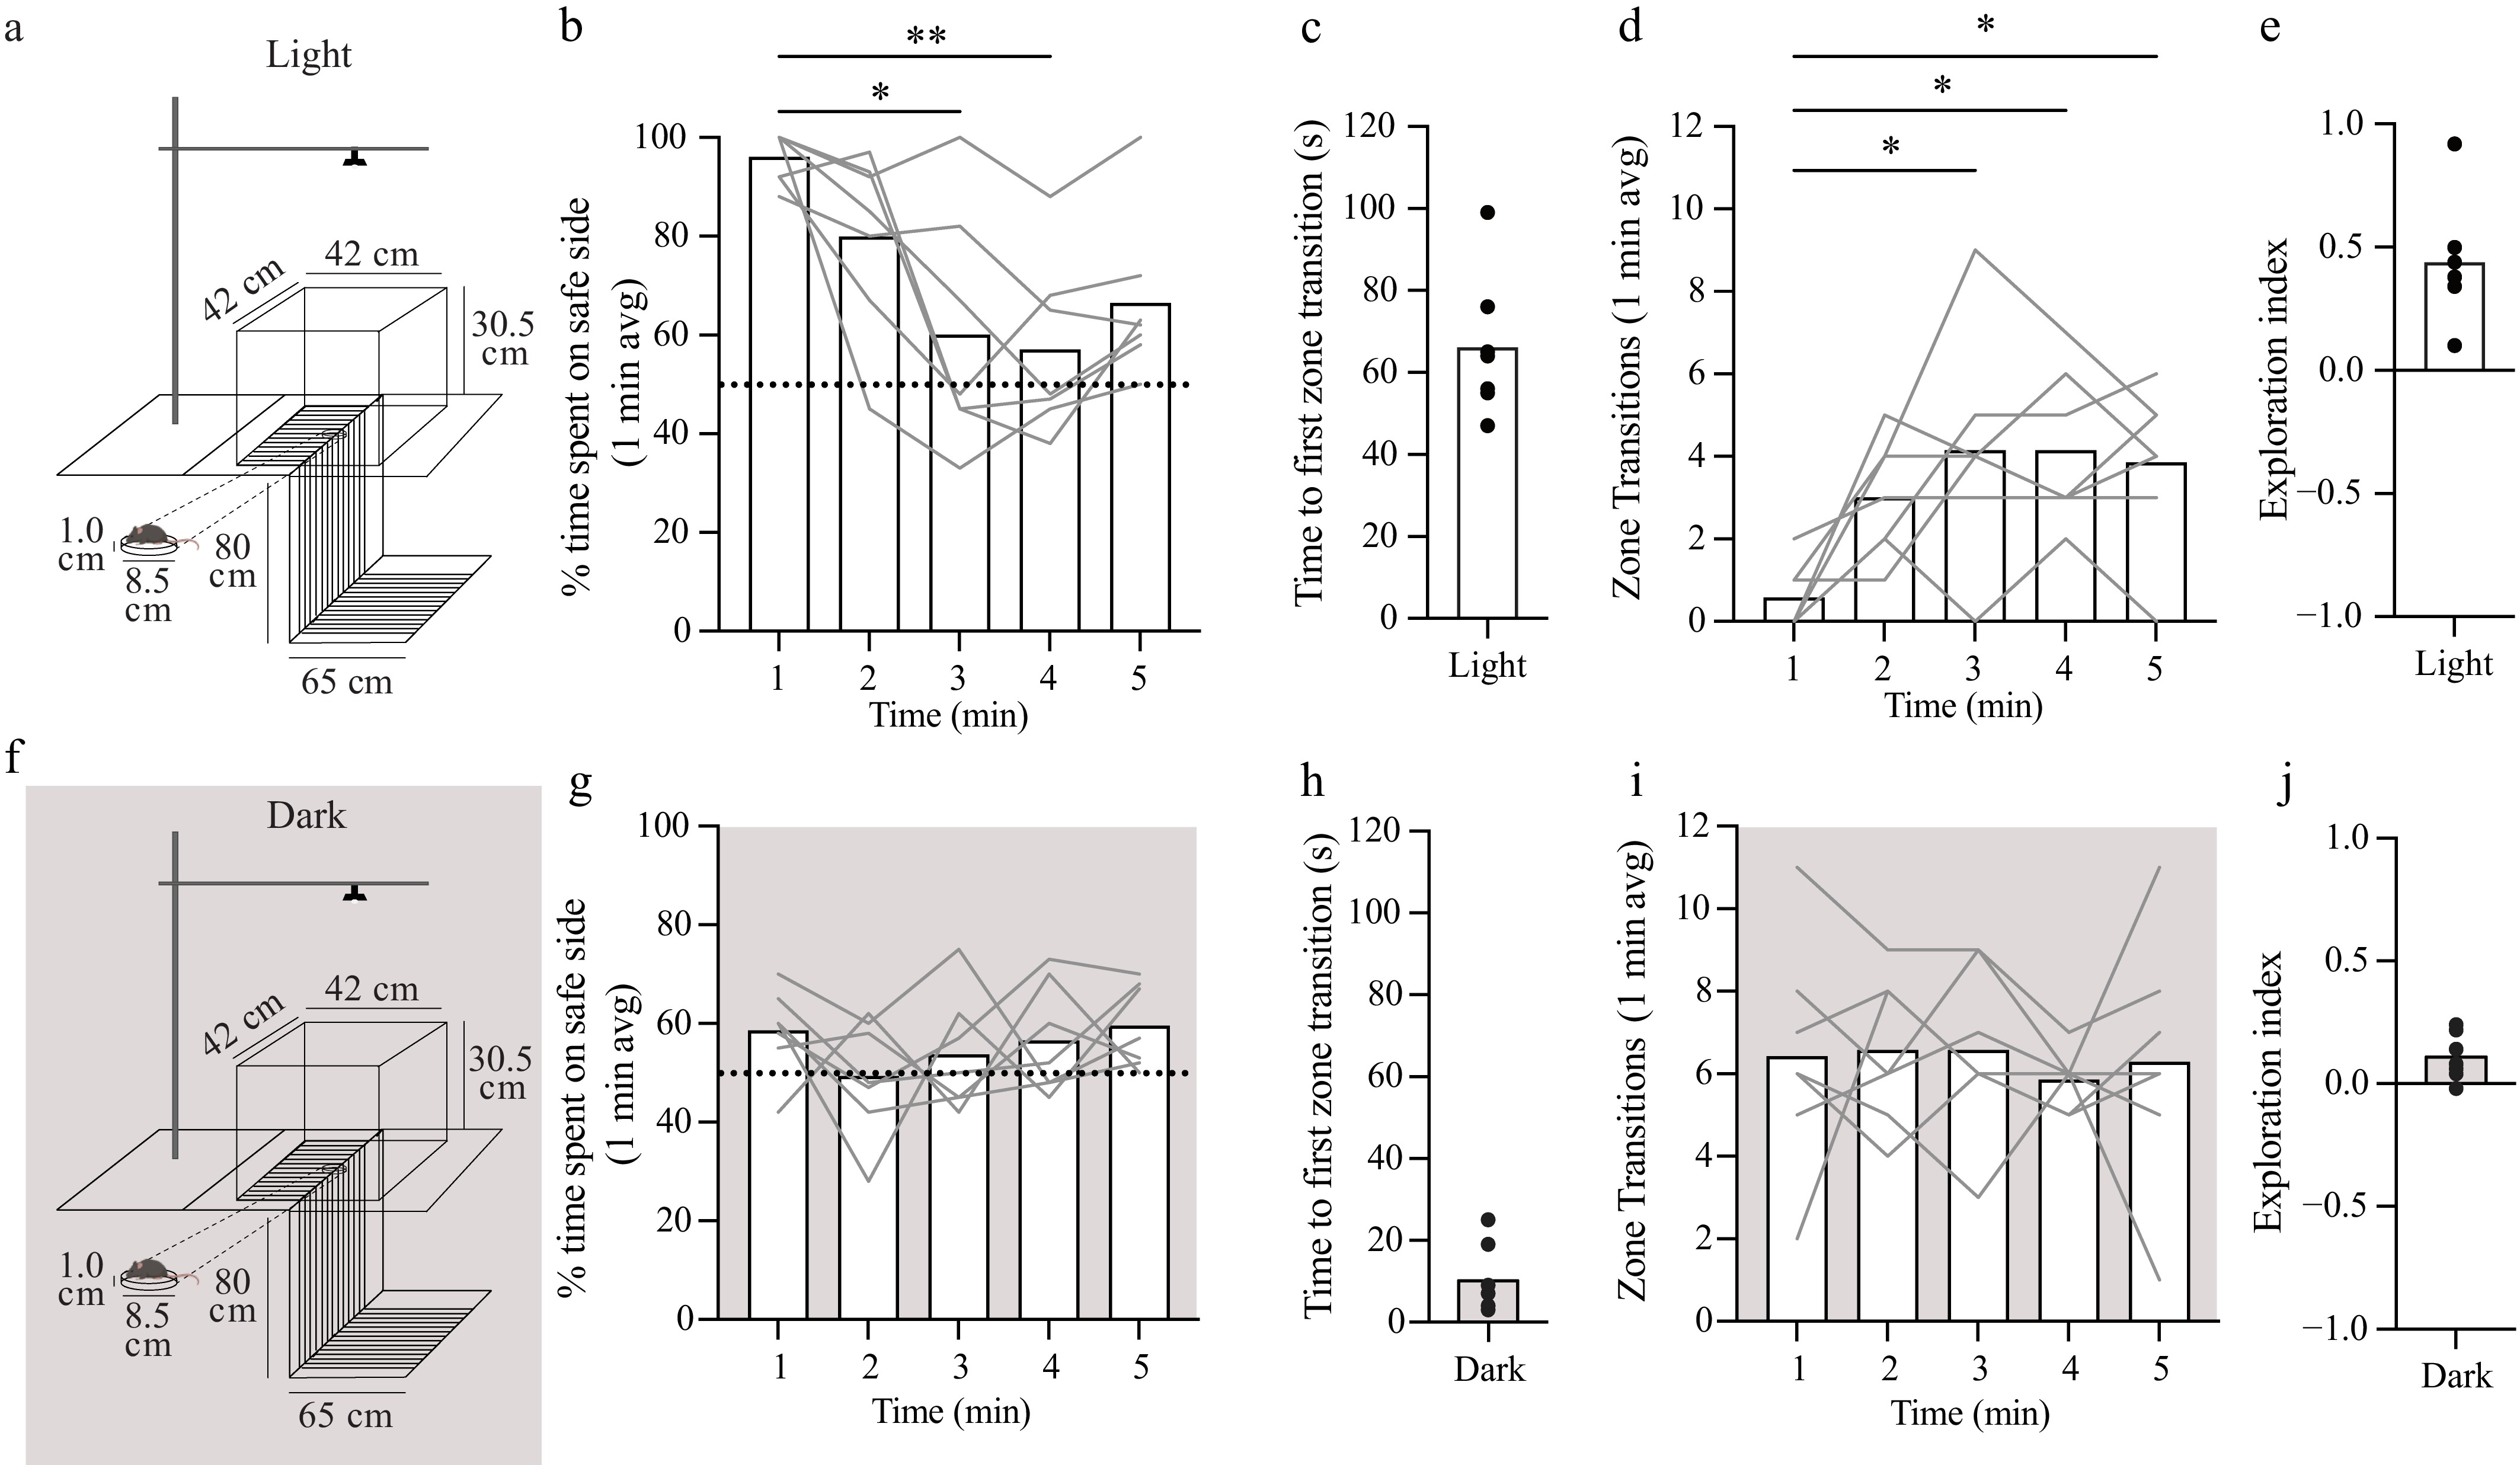
Figure 1.
VCA performance requires visual input. (a) Graphical design of the VCA with measurements of the box and table that were used. Animals were placed on a Petri dish (1 cm in height) in the middle of the platform facing the safe side and allowed to explore the arena for 5 min. (b) Percentage of time spent on the safe side (per minute) plotted as a function of test time. The dotted line (y = 50%) represents chance performance. (c) Time to the first zone transition from the safe to cliff side plotted as a function of test time. (d) The total number of transitions between zones plotted as a function of test time. (e) Exploration index ([Time on safe – Time on cliff] / Total time) over the 5-min test. (f) Graphical design of the VCA in the dark using a different cohort of animals. (g) Percentage of time spent on safe side in the dark (per min) plotted as a function of test time. Dotted line (y = 50%) represents chance performance. (h) Time to the first zone transition from the safe to cliff side in the dark plotted as a function of test time. (i) The total number of transitions between zones in the dark plotted as a function of test time. (j) Exploration index over the 5-min test in the dark. Mean values are represented as bars for each minute in each condition. Individual animals are represented as gray lines. Dunn's multiple comparison indicates statistical significance compared with the first minute in each condition: * < 0.05, ** < 0.01.
-
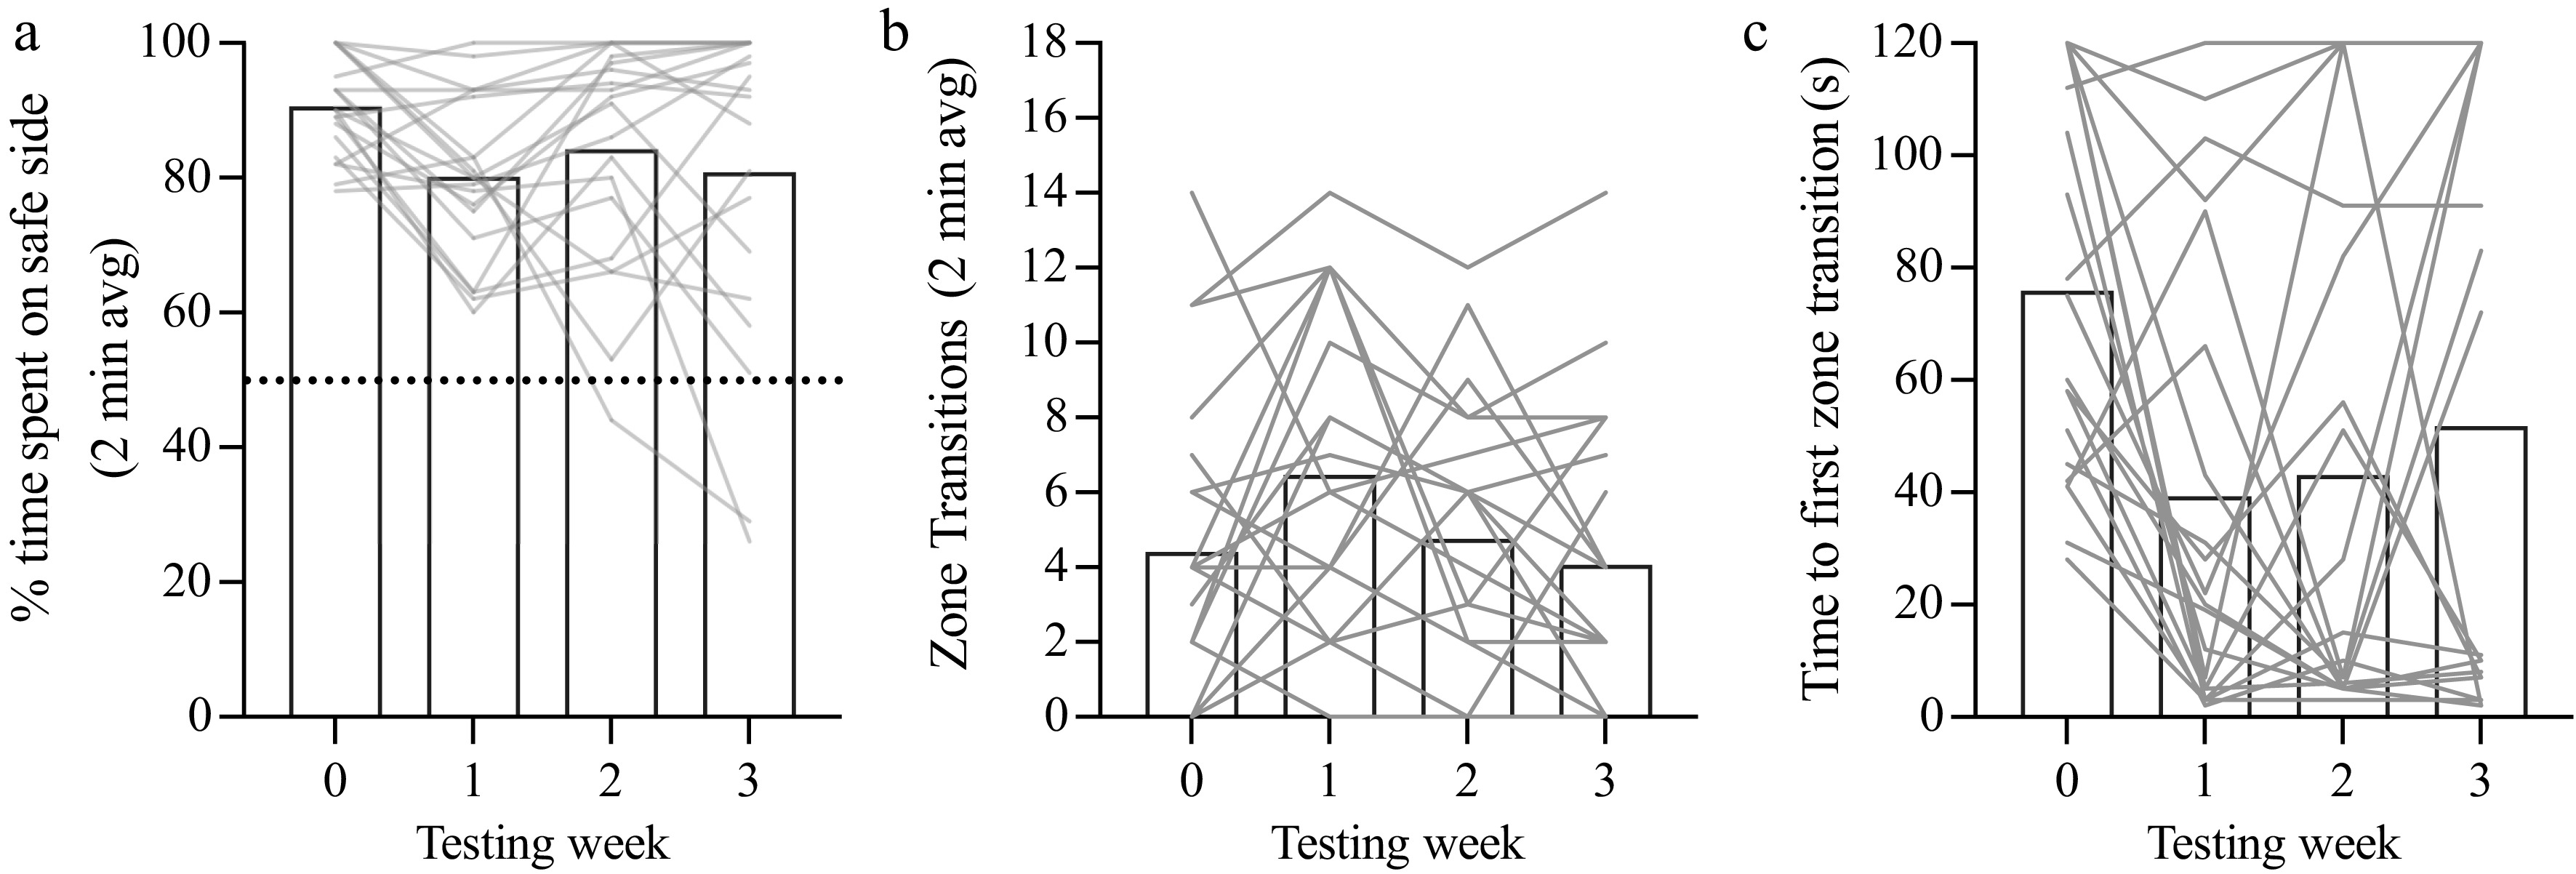
Figure 2.
Test–retest stability of VCA performance. (a) Percentage of time spent on the safe side (average over each 2-min trial) plotted as a function of testing week (1-week trial interval). The dotted line (y = 50%) represents chance performance. (b) Time to the first zone transition from the safe to cliff side plotted as a function of testing week. (c) The total number of transitions between zones plotted as a function of testing week. Mean values are represented as bars for each test week. Individual animals are represented as gray lines. Dunn's multiple comparison indicates statistical significance compared with Week 0: * < 0.05.
-
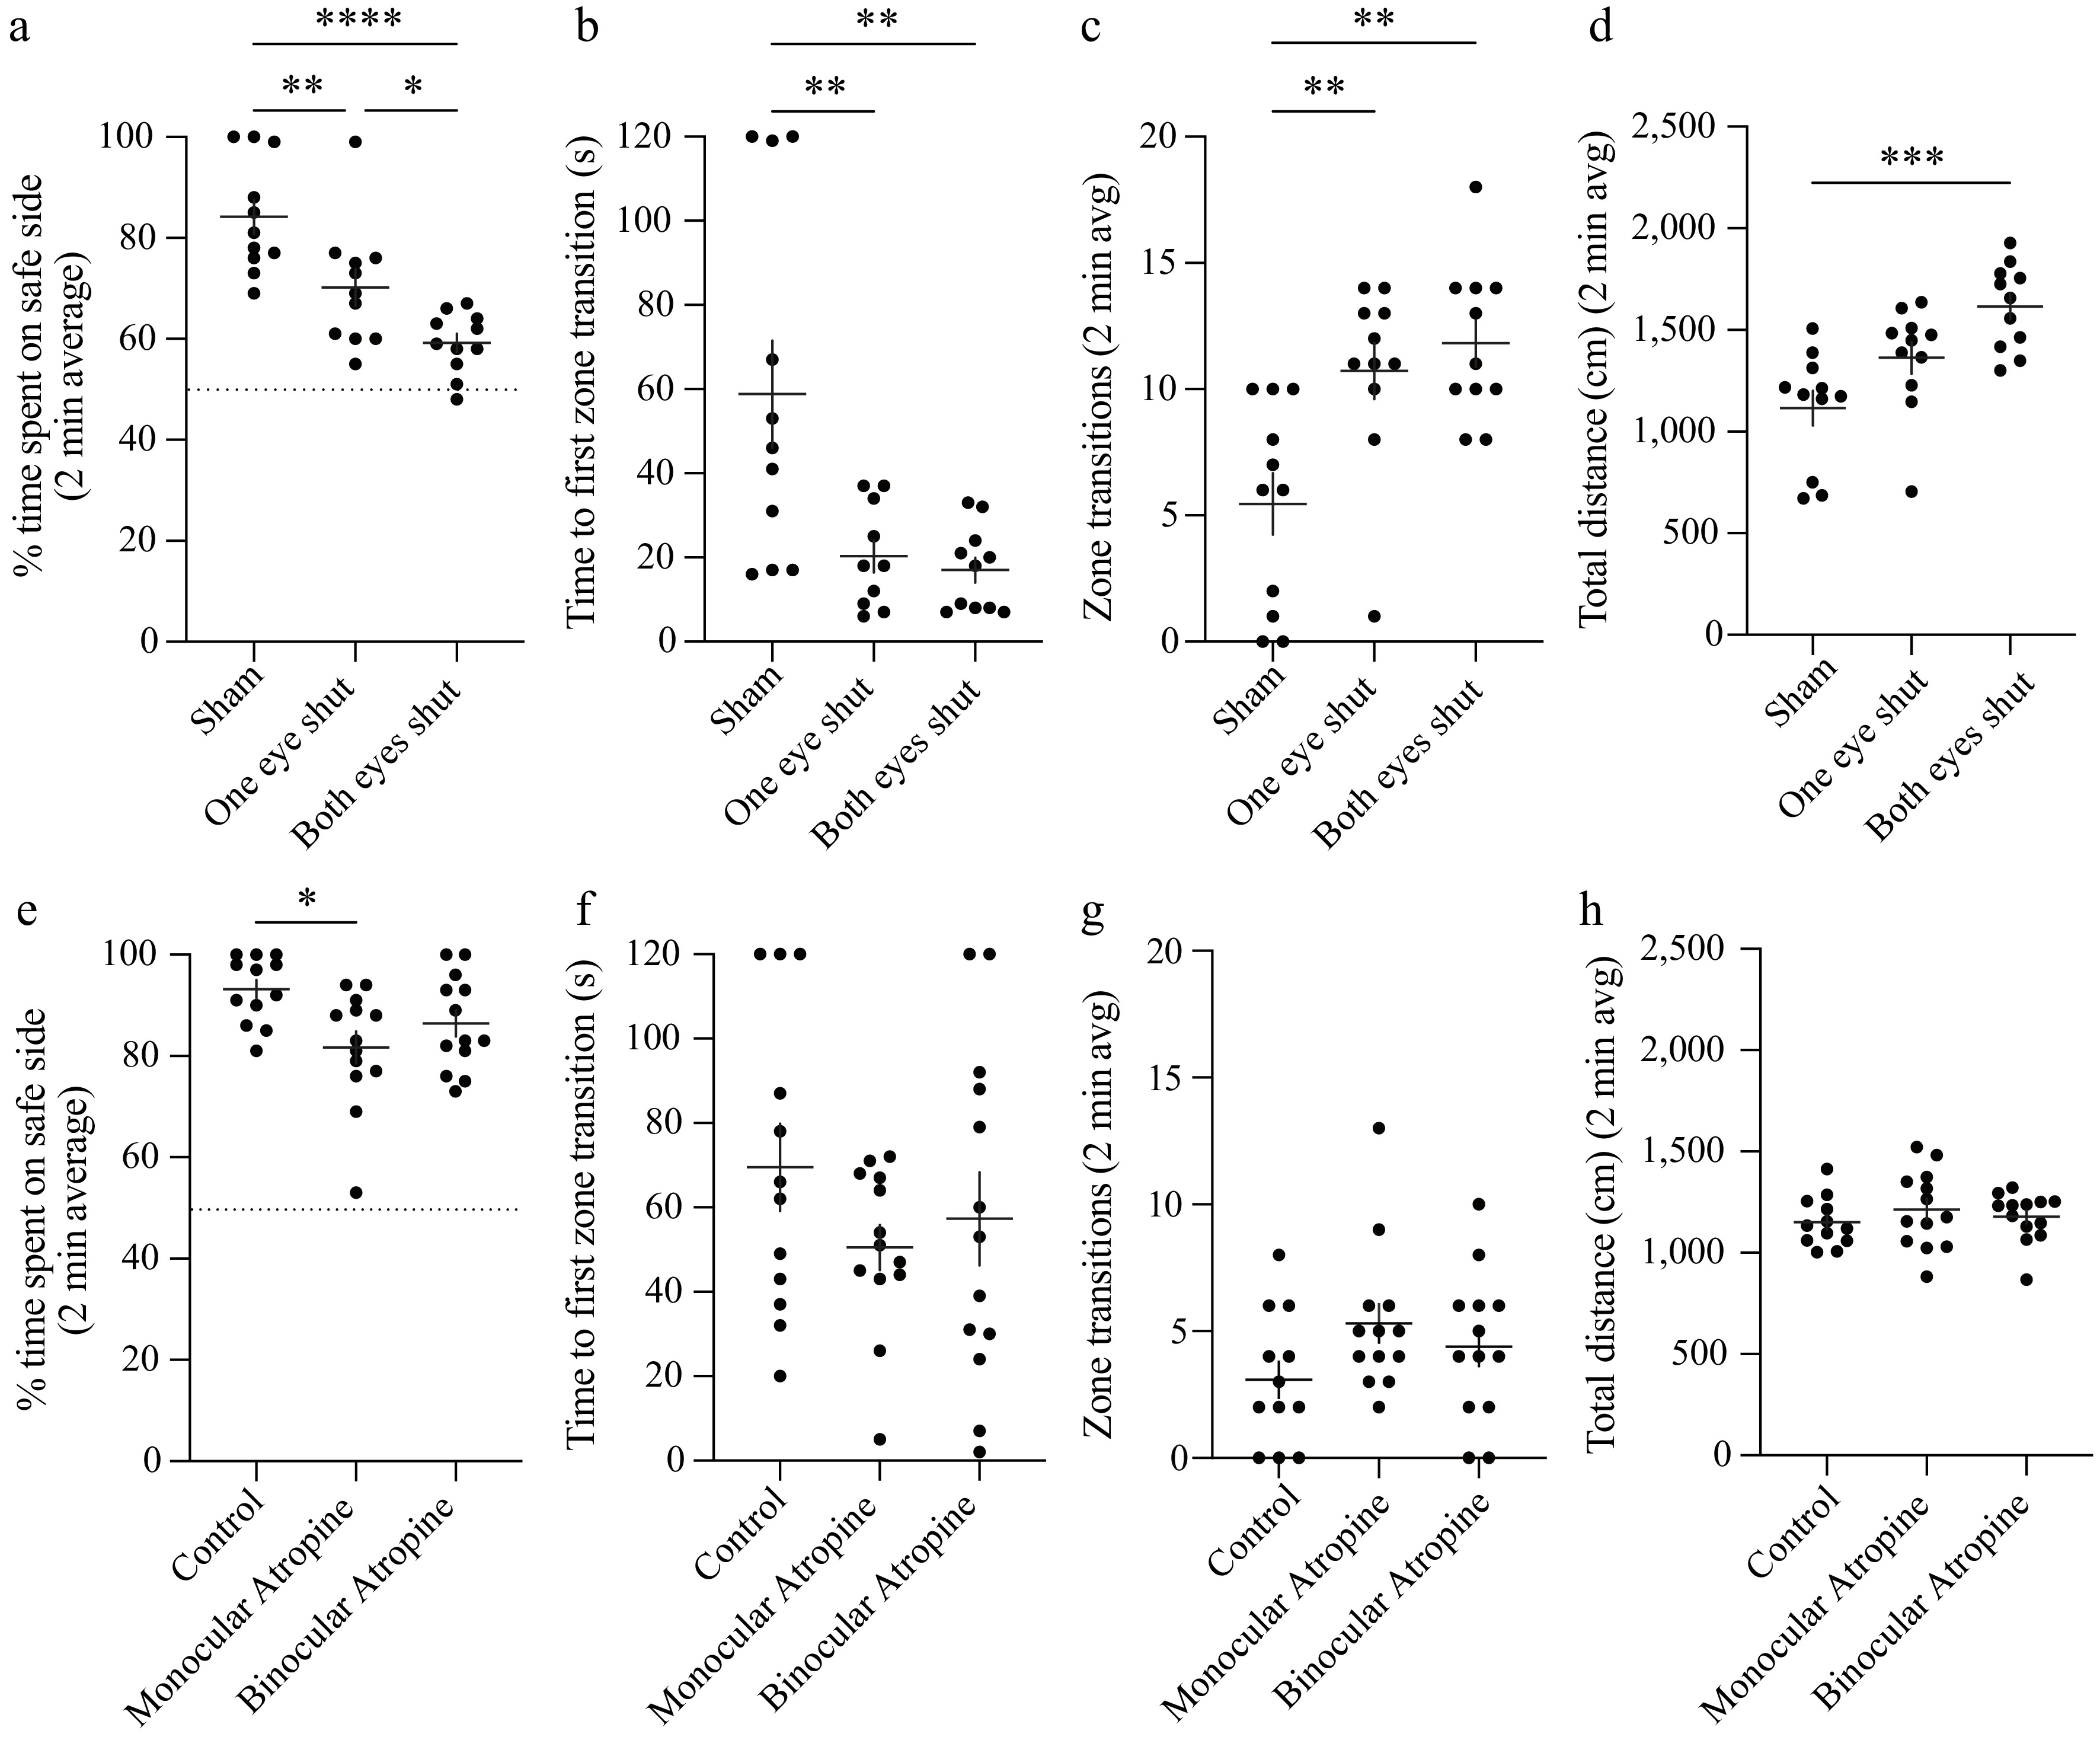
Figure 3.
Disruptions of binocularity impair VCA performance. (a)–(d) Animals performed the 2-min VCA with neither (sham), one, or both eyes sutured shut. (a) Percentage of time spent on the safe side plotted for each eye closure group. The dotted line (y = 50%) represents chance performance. (b) Time to the first zone transition from the safe to cliff side plotted for each eye closure group. (c) The total number of transitions between zones plotted for each eye closure group. (d) Total distance traveled during the test plotted for each eye closure group. (e)–(h) Animals performed the 2-min VCA after neither unilateral or bilateral pupillary dilation via administration of atropine eye drops. (e) Percentage of time spent on the safe side plotted for each atropine group. The dotted line (y = 50%) represents chance performance. (f) Time to the first zone transition from the safe to cliff side plotted for each atropine group. (g) The total number of transitions between zones plotted for each atropine group. (h) Total distance traveled during the test plotted for each atropine group. Individual animals are represented as circles, and the mean ± standard error of the mean (SEM) as black horizontal and vertical lines. Dunn's multiple comparison indicates statistical significance between groups: * < 0.05, ** < 0.01, *** < 0.001, **** < 0.0001.
-
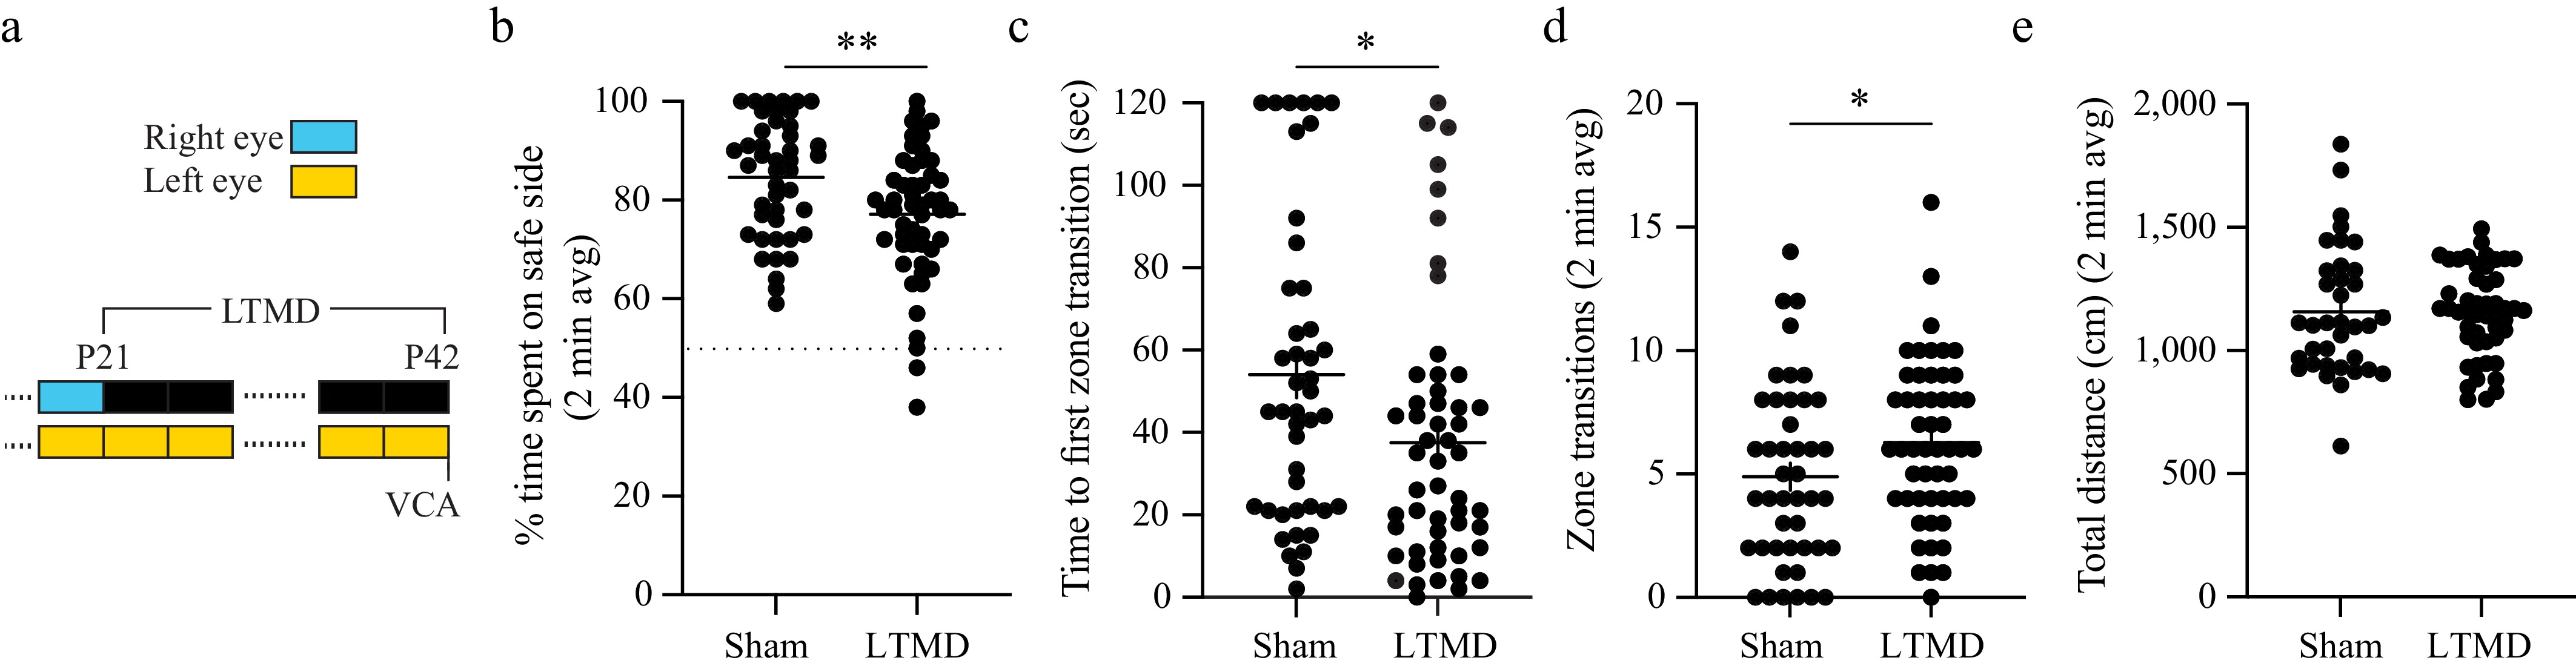
Figure 4.
LTMD causes stable binocular dysfunction in the VCA. (a) Experimental timeline showing LTMD (or sham closure) performed from P21 to P42. VCA was performed 1–3 h after eye opening (b)–(e). (b) Percentage of time spent on safe side plotted for each group. The dotted line (y = 50%) represents chance performance. (c) Time to the first zone transition from the safe to cliff side plotted for each group. (d) The total number of transitions between zones plotted for each group. (e) Total distance traveled during the test plotted for each group. Individual animals are represented as circles, and the mean ±SEM as black horizontal and vertical lines. Comparison representations of statistical significance between groups (Mann–Whitney) or between tests (paired Wilcoxon): * < 0.05, ** < 0.01.
-
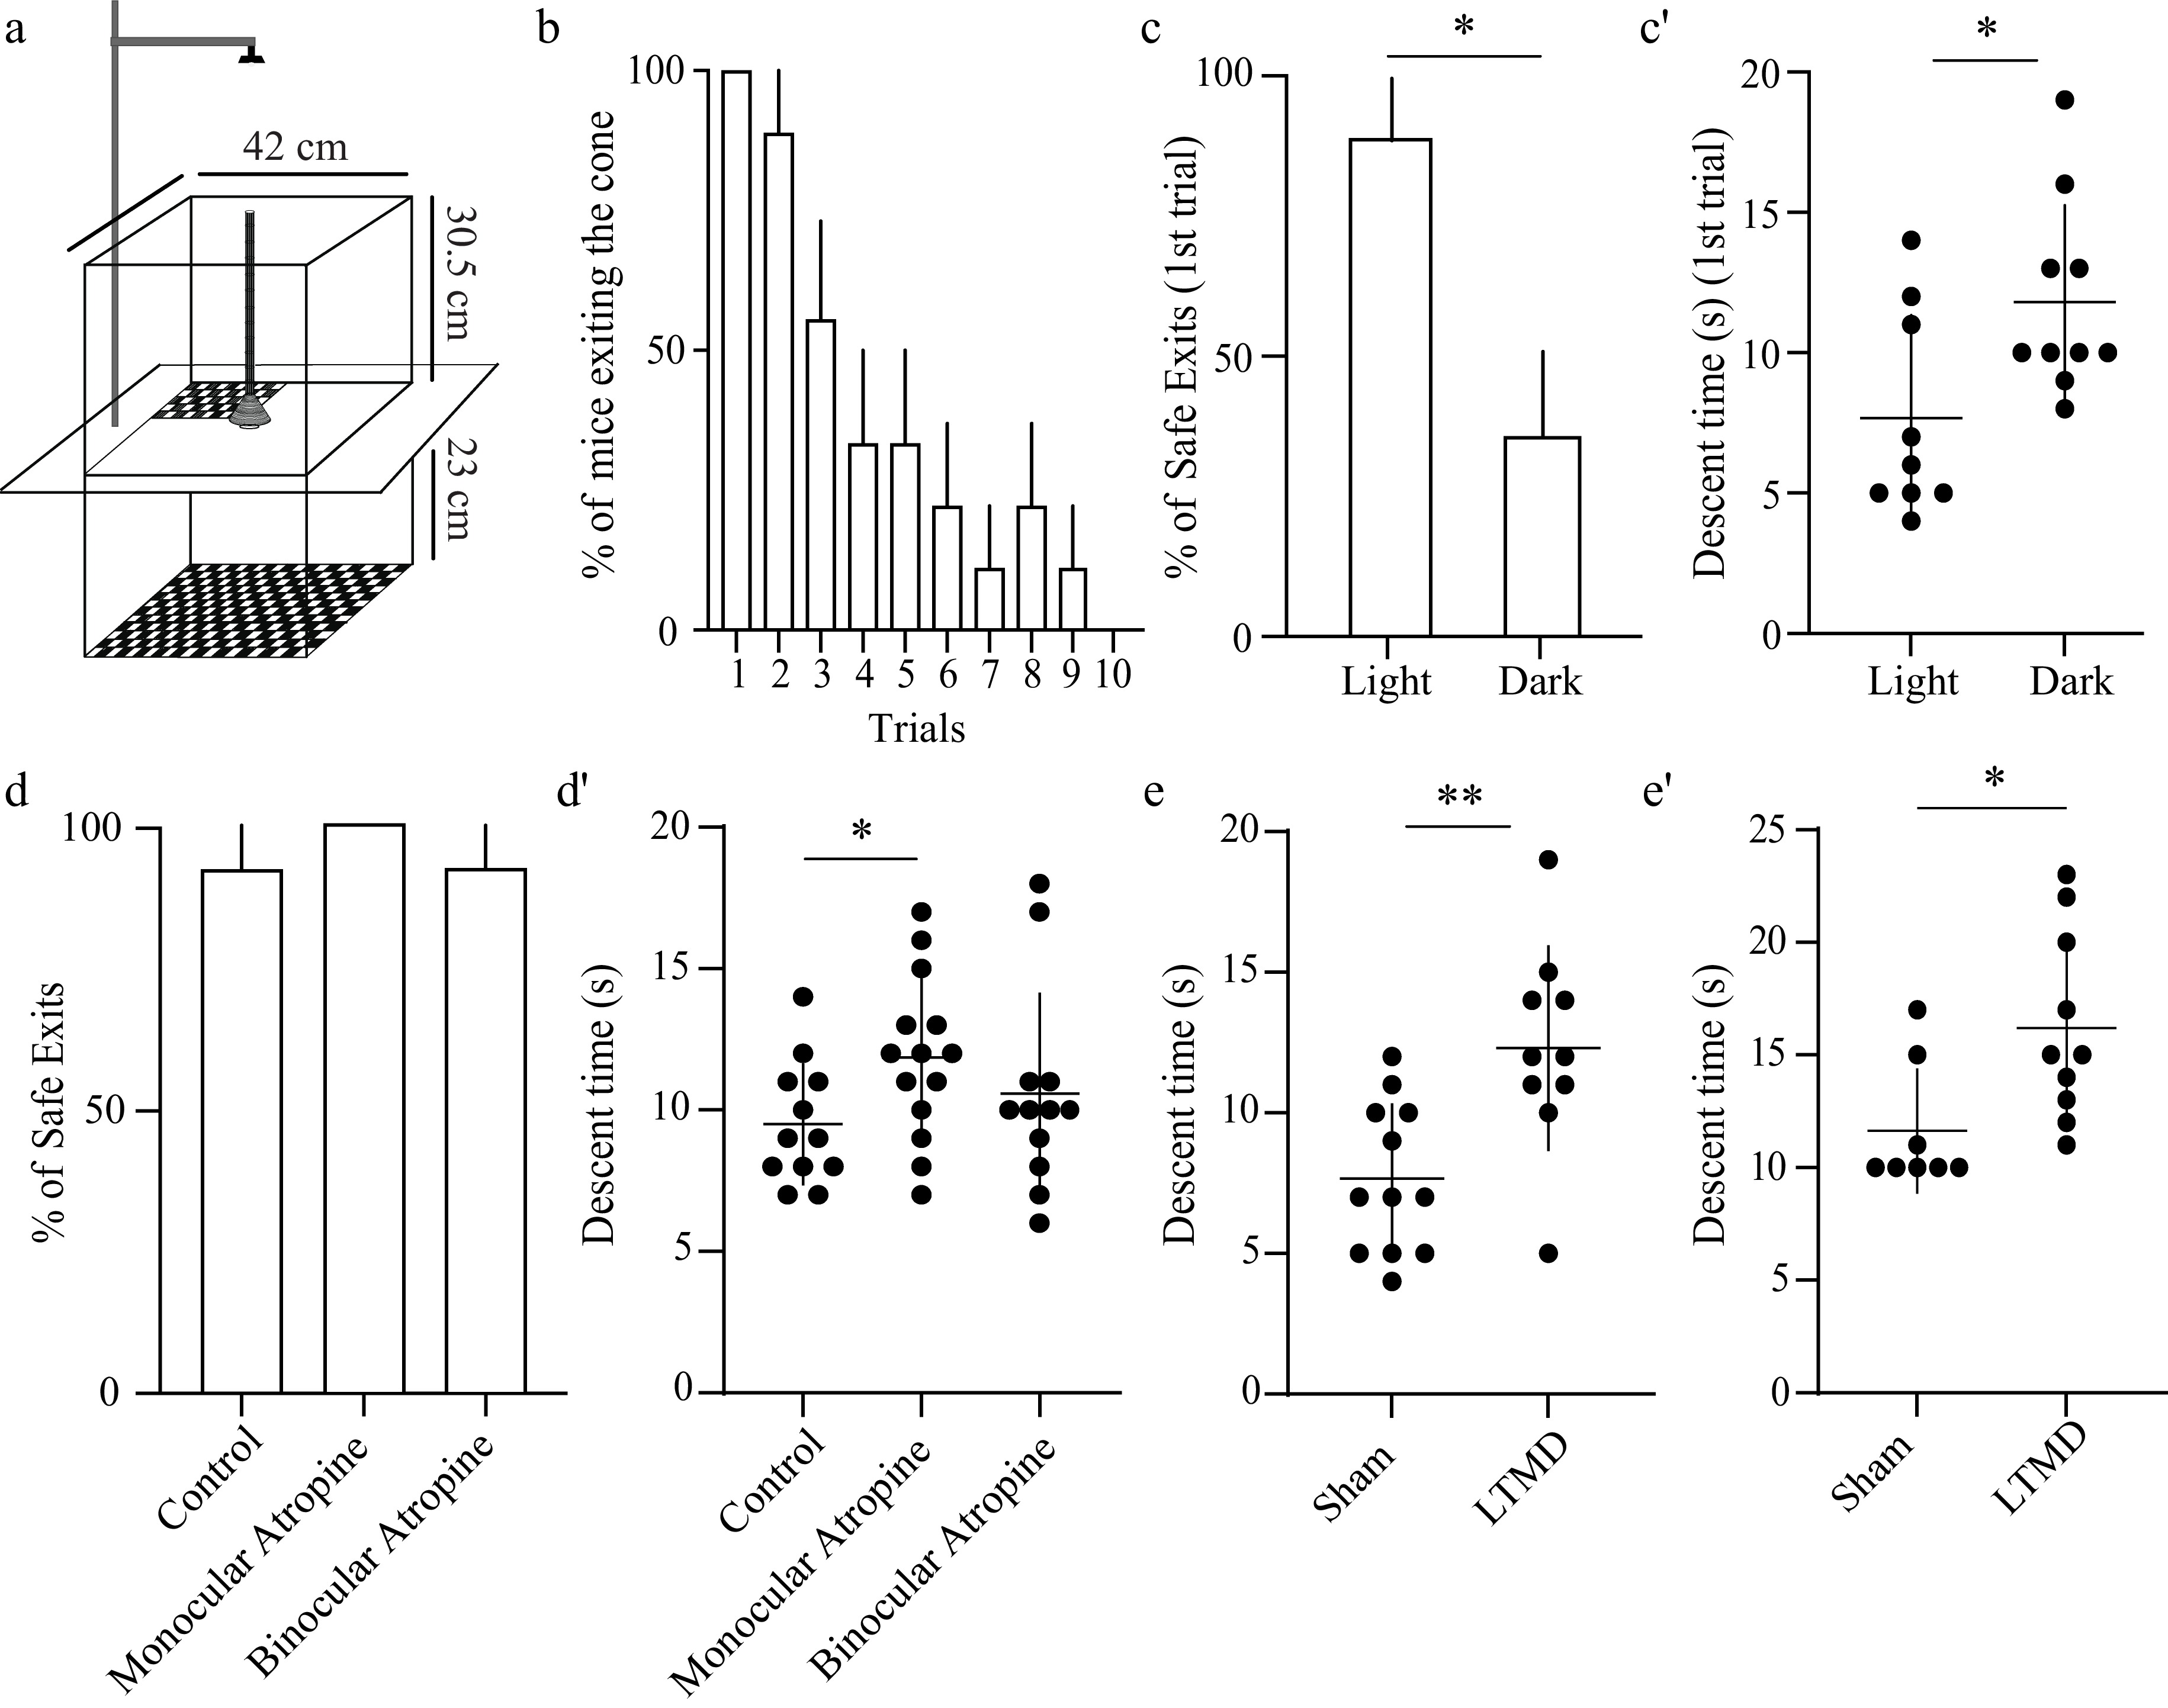
Figure 5.
Disruptions of binocularity and LTMD impair descent time in the PDCT. (a) Graphical design of the PDCT apparatus with measurements that were used. Mice descend a pole positioned above a cone (9 cm in diameter) placed on a glass plate. One quadrant is positioned 1.5 cm below the cone; the remaining three are 24.5 cm below the cone. All quadrants are covered with black and white checkerboard. (b) Percentage of mice that exit the pole and cone onto any quadrant across 10 interleaved trials, each lasting 3 min. Dunnett's multiple comparisons testing relative to Trial 1 revealed p < 0.05 or less for Trials 4–10. (c) Percentage of safe exits (exit to the quadrant 1.5 cm below the cone) under normal lighting conditions and in complete darkness. (c') Descent time (the time taken to descend the pole) under normal lighting conditions and in complete darkness. (d) Percentage of safe exits of animals after neither unilateral nor bilateral pupillary dilation via administration of atropine ointment. (d') Descent time plotted for each atropine group. (e) Descent time plotted for the sham and LTMD animals. (e') Independent replication of LTMD's effects on descent time using the modified configuration. Bar graphs: mean ± SEM; scatter plots: mean ± SD. Individual animals are represented as circles. Unpaired t-test between groups: * p < 0.05, ** p < 0.01.
Figures
(5)
Tables
(0)