-
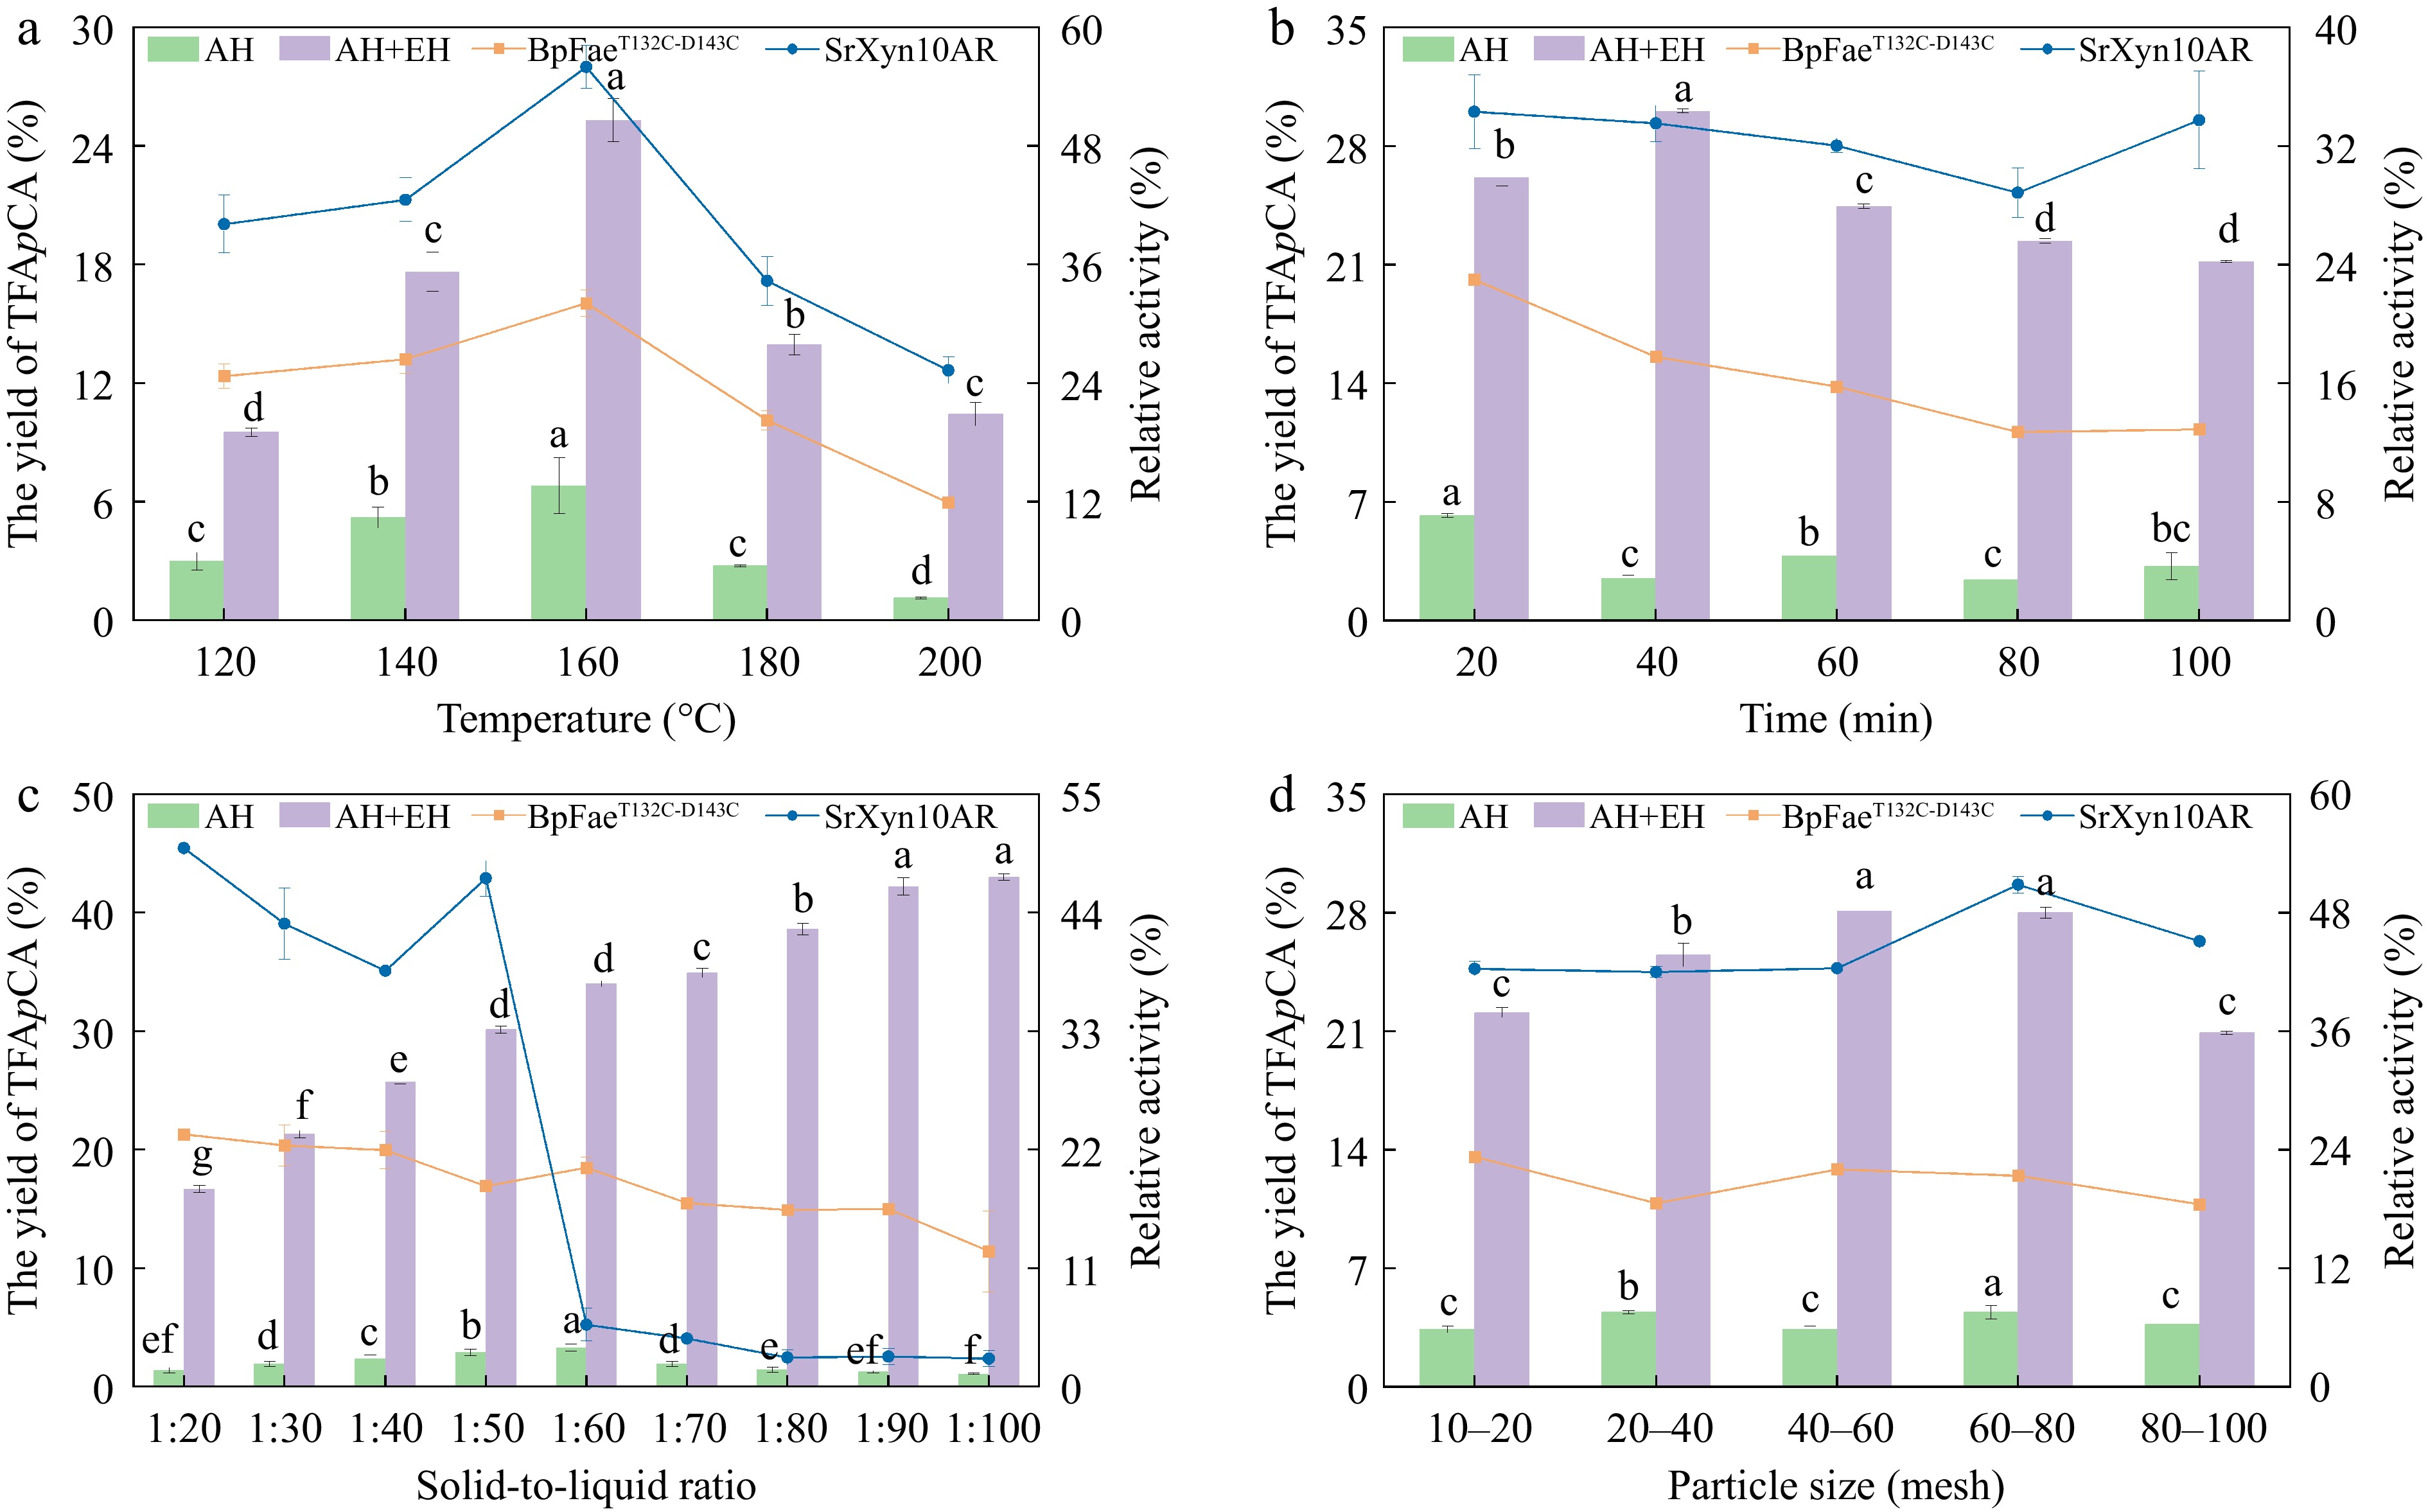
Figure 1.
Effects of (a) temperature, (b) time, (c) solid-to-liquid ratio, and (d) particle size on the yield of TFApCA. AH, autohydrolysis only treatment, no enzymatic hydrolysis treatment; AH+EH, autohydrolysis plus enzymatic hydrolysis treatment. Squares, residual enzyme activity of BpFaeT132C-D143C; circles, residual enzyme activity of SrXyn10AR. Residual enzyme activity is defined as the ratio of the enzyme activity measured in the system to the initial enzyme activity.
-
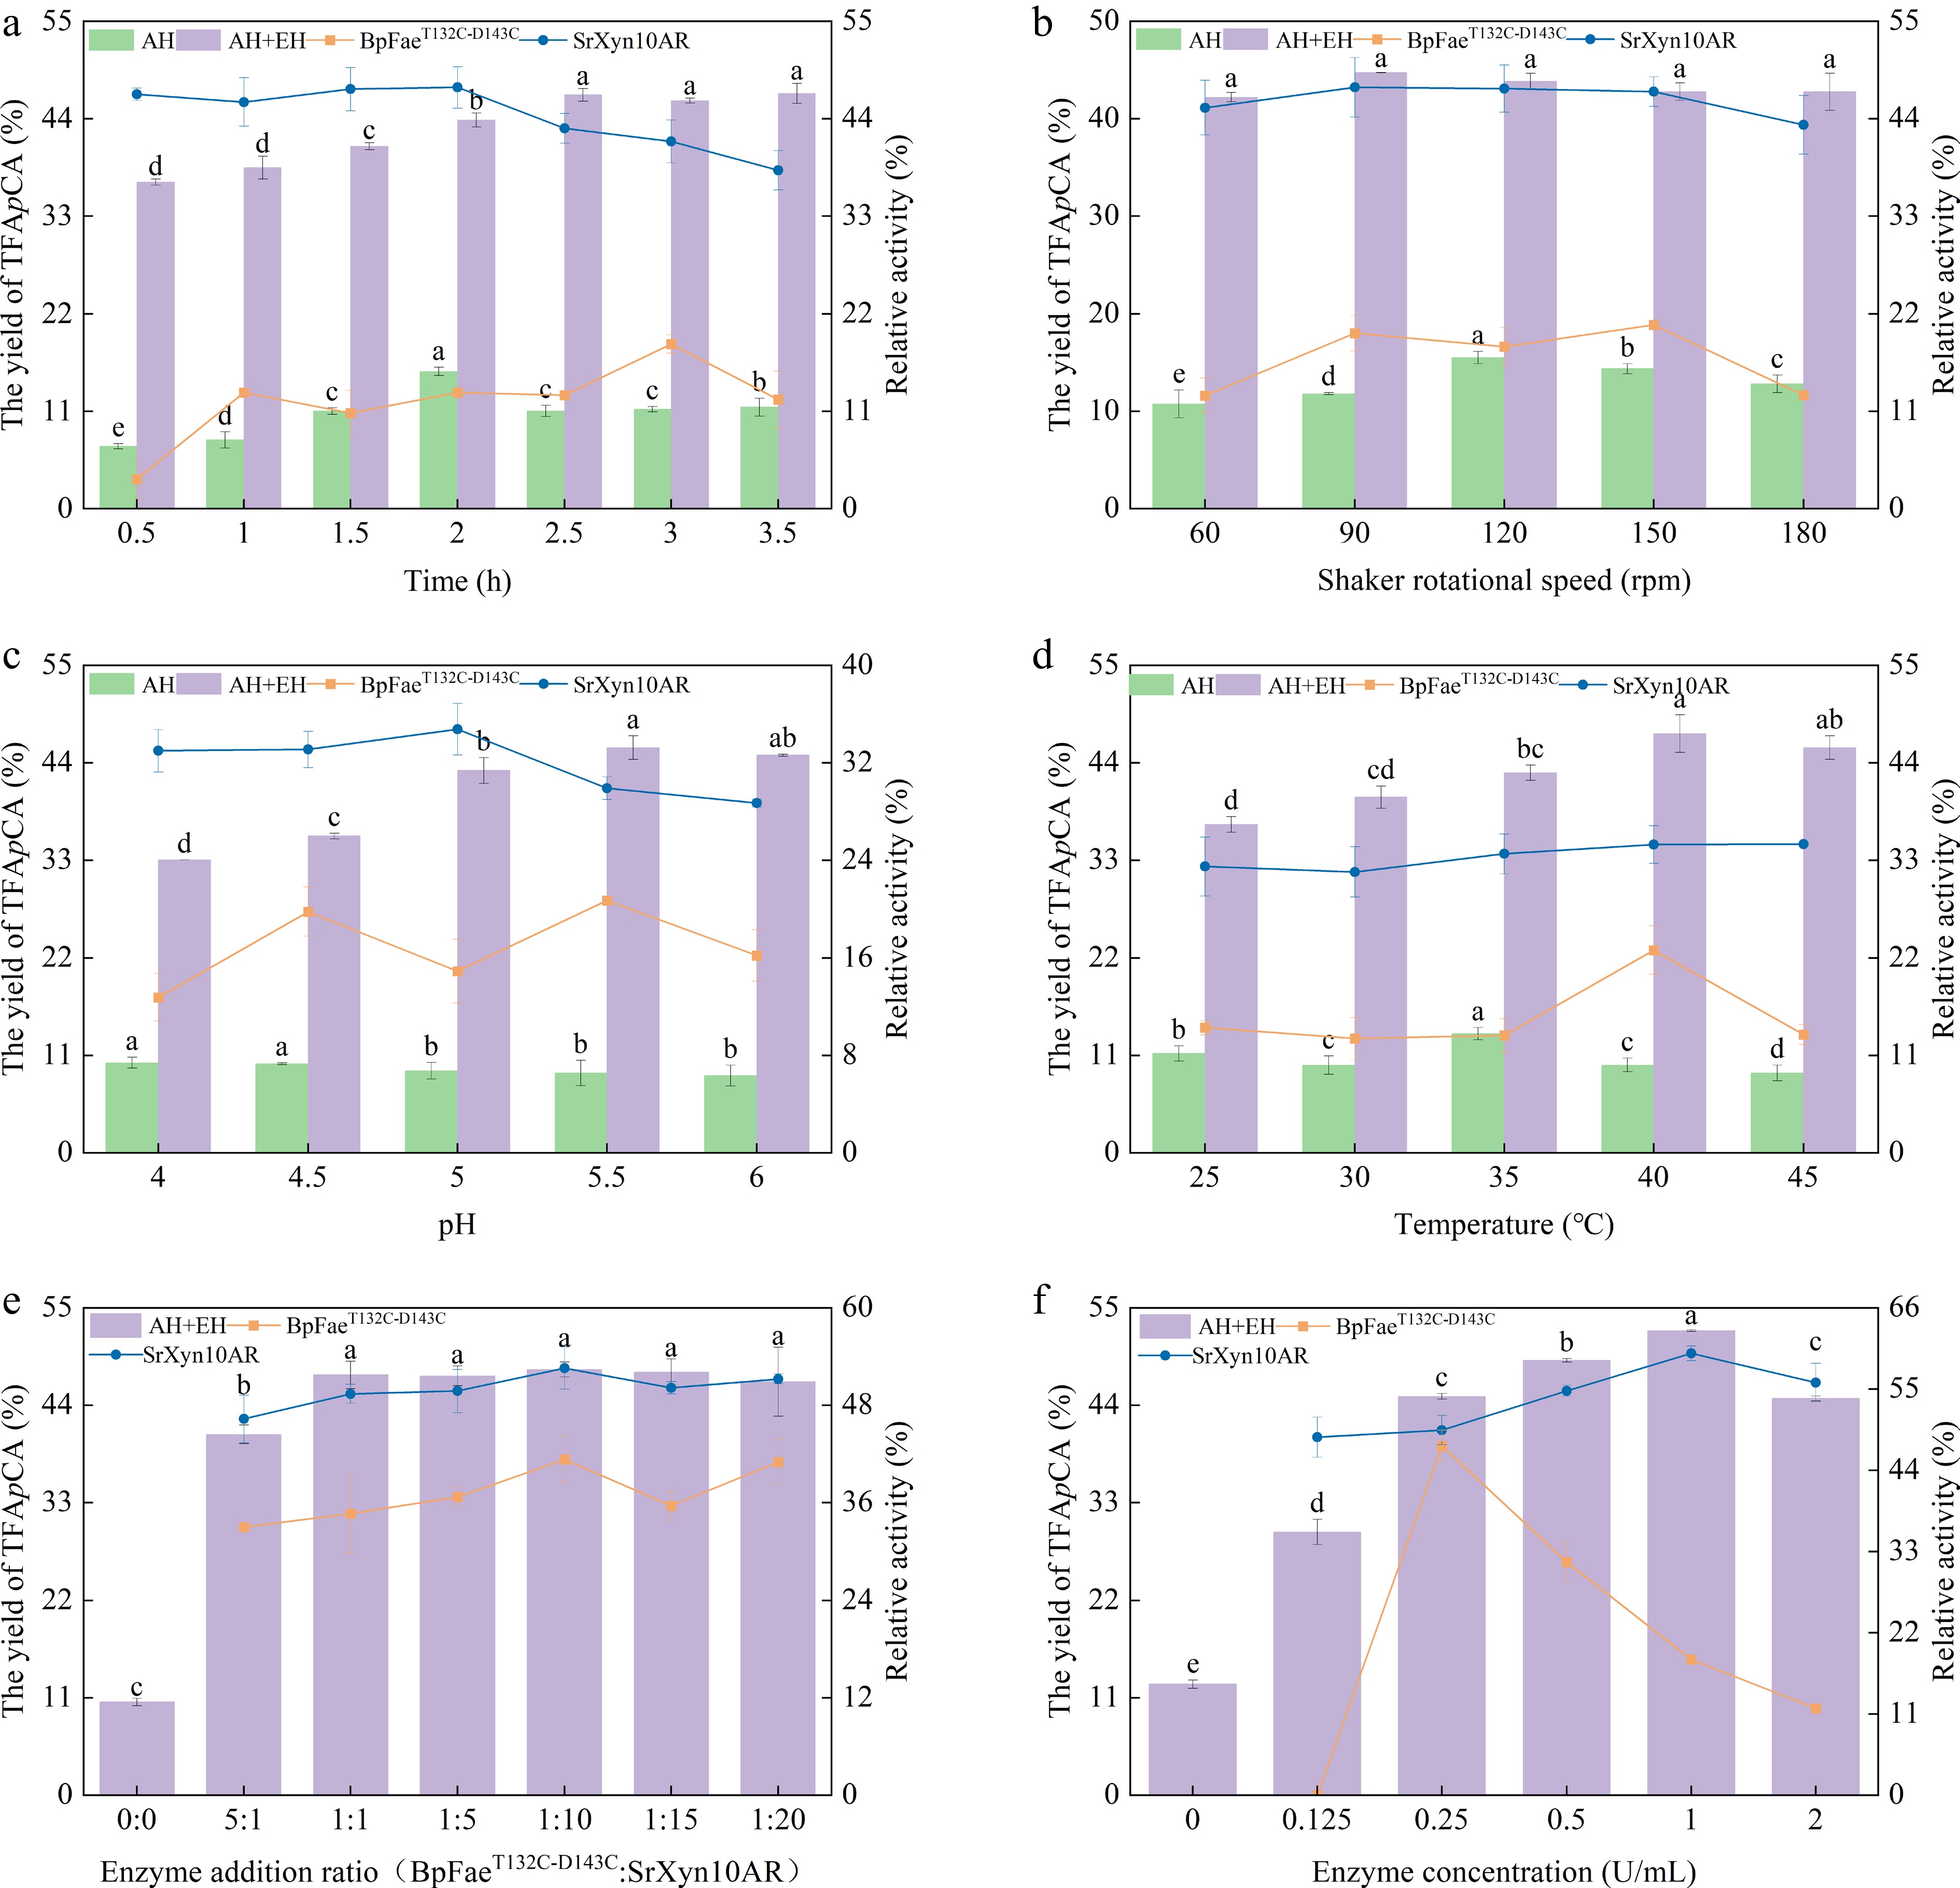
Figure 2.
Effect of (a) time, (b) shaker rotational speed, (c) pH, (d) temperature, (e) enzyme addition ratio, and (f) enzyme concentration on the yield of TFApCA. AH, autohydrolysis only treatment, no enzymatic hydrolysis treatment; AH + EH, autohydrolysis plus enzymatic hydrolysis treatment. Squares, residual enzyme activity of BpFaeT132C-D143C; circles, residual enzyme activity of SrXyn10AR.
-
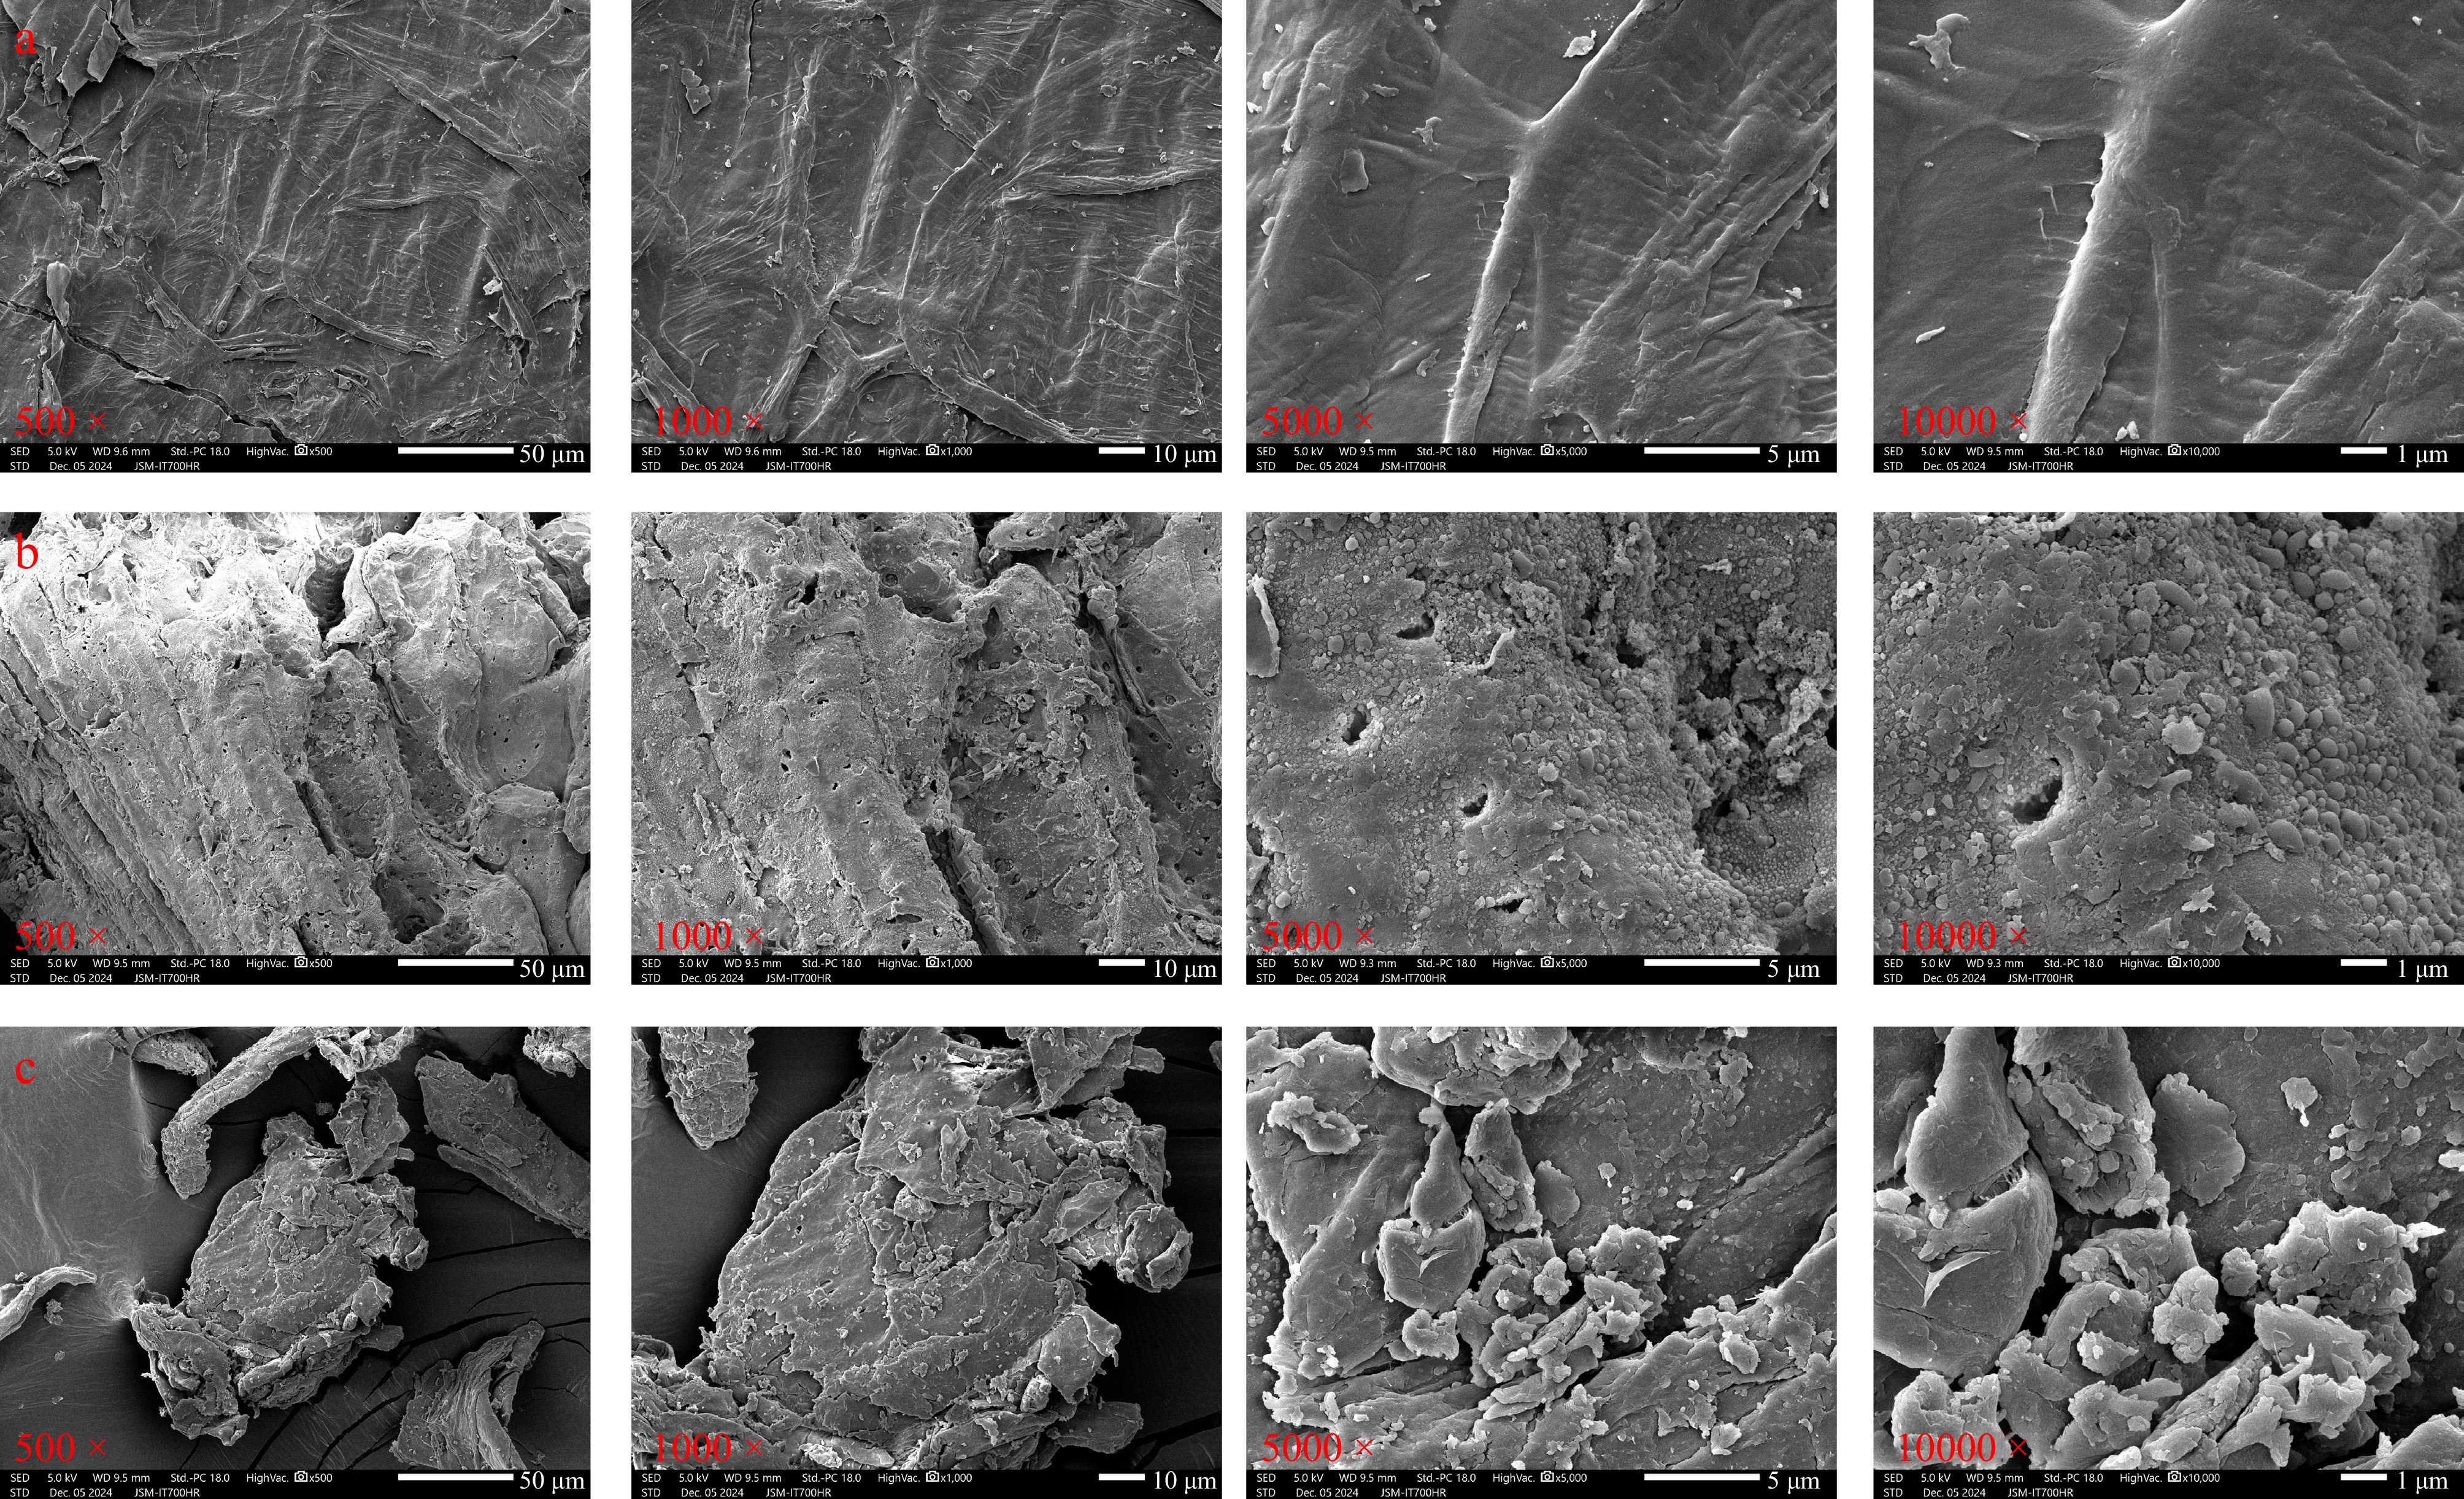
Figure 3.
SEM of (a) corncob, (b) corncob after autohydrolysis treatment, and (c) corncob after autohydrolysis and enzymatic hydrolysis treatments. Scale bars: 500 μm (500 ×), 10 μm (1,000 ×), 5 μm (5,000 ×), 1 μm (10,000 ×).
-
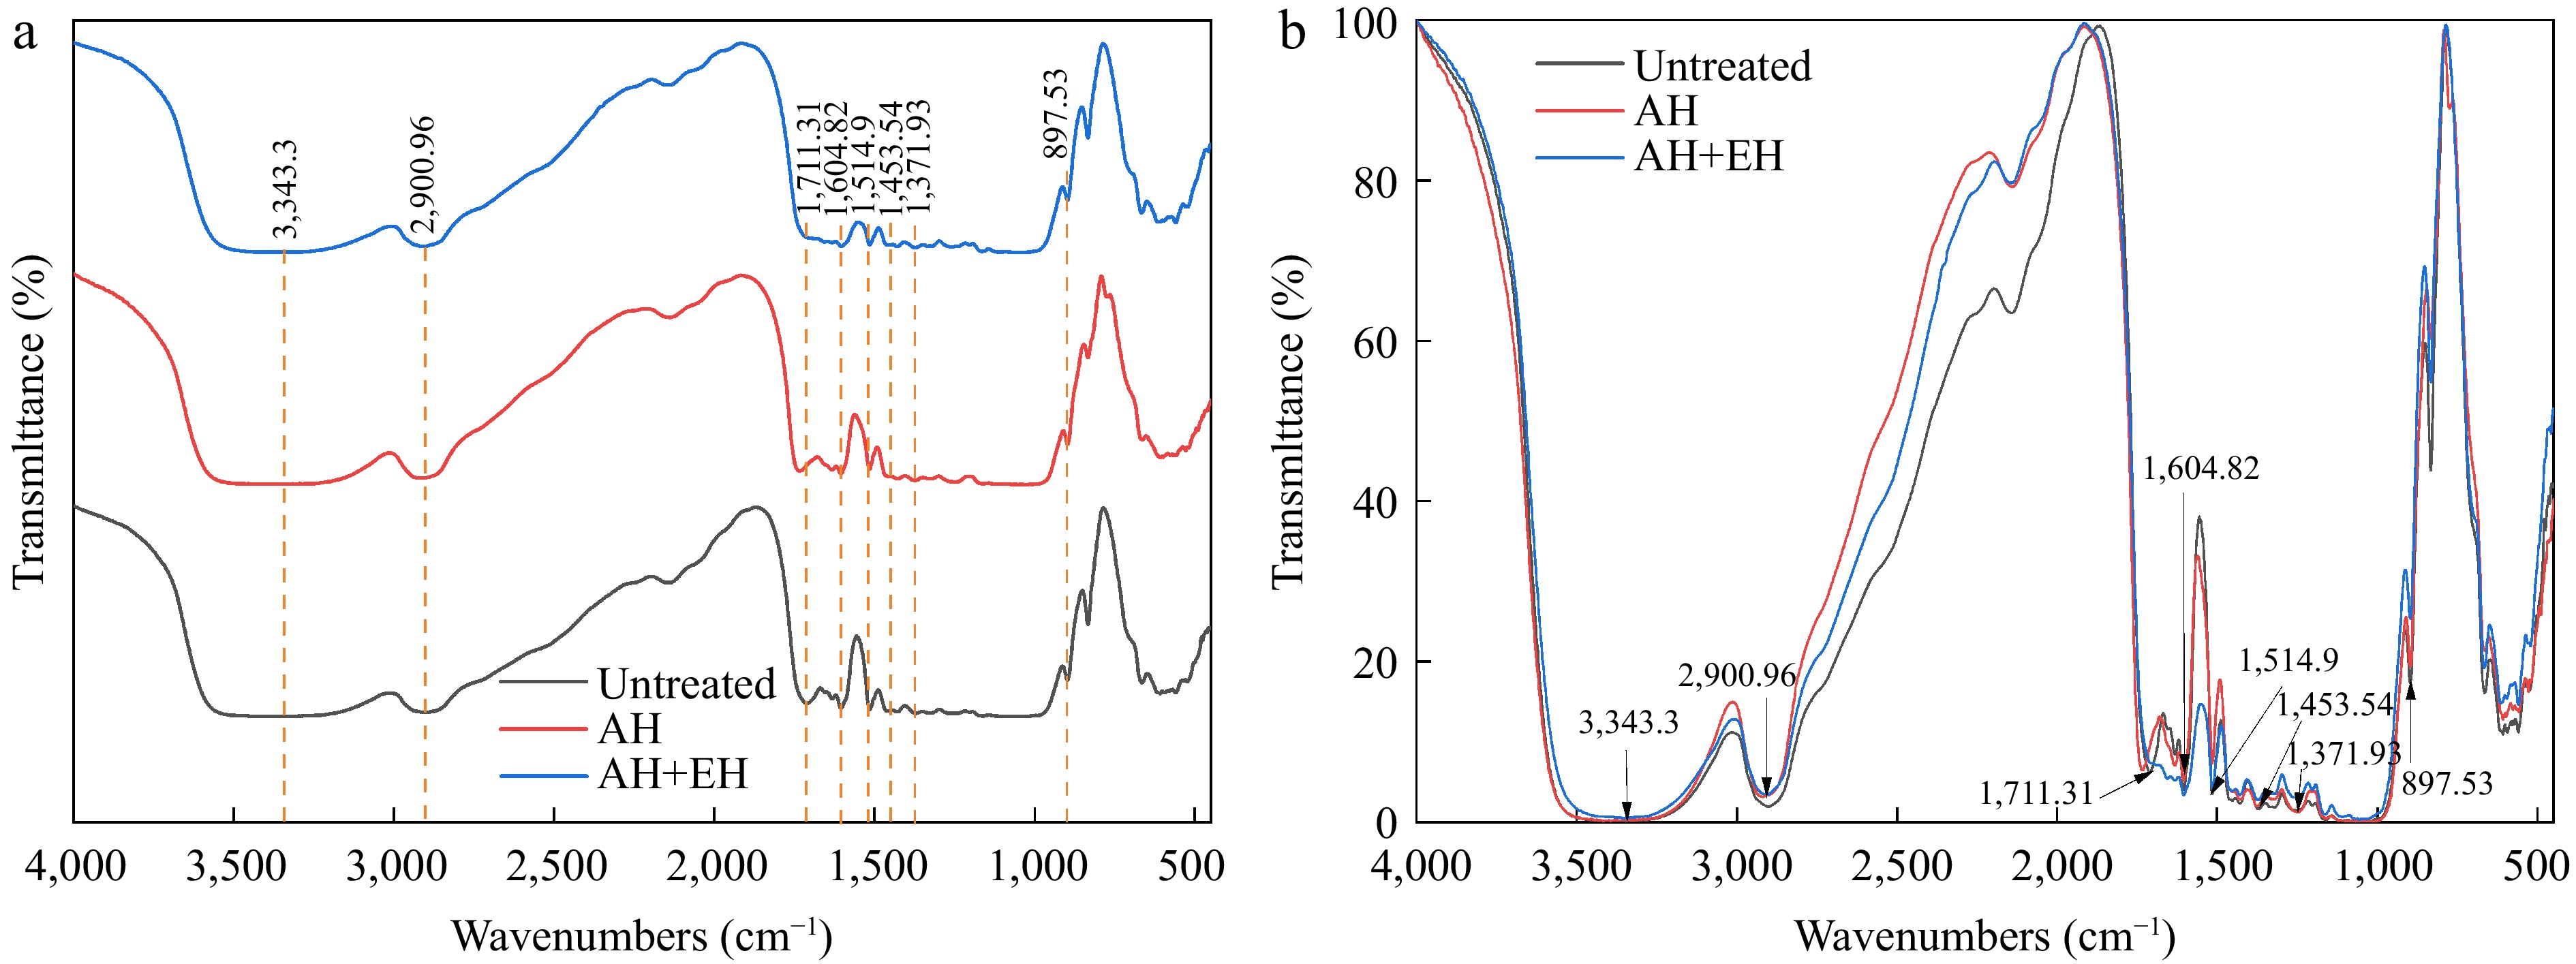
Figure 4.
FTIR spectra of corncob (untreated), corncob after autohydrolysis treatment (AH), and corncob after autohydrolysis and enzymatic hydrolysis treatments (AH+EH). AH, autohydrolysis only treatment, no enzymatic hydrolysis treatment; AH+EH, autohydrolysis plus enzymatic hydrolysis treatment.
-
Table 1.
FA and pCA content in corncob across different studies.
-
Test
No.Temperature (°C) Time (min) Solid-to-liquid ratio Yield of
TFApCA (%)A Code A B Code B C Code C 1 160 0 60 1 1:80 −1 20.77 ± 0.42 2 140 −1 40 0 1:80 −1 14.97 ± 0.37 3 140 −1 60 1 1:90 0 23.87 ± 0.24 4 160 0 20 −1 1:100 1 30.00 ± 0.30 5 160 0 20 −1 1:80 −1 25.00 ± 0.68 6 160 0 40 0 1:90 0 44.96 ± 0.07 7 140 −1 40 0 1:100 1 17.58 ± 0.05 8 160 0 60 1 1:100 1 24.67 ± 0.80 9 180 1 40 0 1:80 −1 23.72 ± 0.78 10 180 1 60 1 1:90 0 15.97 ± 0.58 11 180 1 20 −1 1:90 0 38.03 ± 0.58 12 180 1 40 0 1:100 1 26.43 ± 0.32 13 160 0 40 0 1:90 0 44.29 ± 0.69 14 140 −1 20 −1 1:90 0 16.88 ± 0.35 15 160 0 40 0 1:90 0 44.24 ± 0.89 Table 2.
The BBD and the responses of the dependent variables for autohydrolysis conditions.
-
Test
No.Temperature (°C) Time (h) Enzyme concentration (U/mL) Yield of
TFApCA (%)A Code A B Code B C Code C 1 40 0 2 −1 1.5 1 46.55 ± 0.12 2 45 1 2.5 0 0.5 −1 52.87 ± 0.24 3 40 0 2.5 0 1 0 60.85 ± 0.87 4 40 0 3 1 1.5 1 49.36 ± 0.10 5 45 1 3 1 1 0 53.19 ± 0.53 6 45 1 2.5 0 1.5 1 56.87 ± 0.55 7 40 0 2.5 0 1 0 66.32 ± 0.43 8 40 0 2.5 0 1 0 60.11 ± 0.15 9 35 −1 2.5 0 1.5 1 47.39 ± 0.37 10 35 −1 3 1 1 0 46.33 ± 0.46 11 45 1 2 −1 1 0 51.30 ± 0.12 12 40 0 2 −1 0.5 −1 42.60 ± 0.65 13 35 −1 2 1 1 0 44.20 ± 0.26 14 35 −1 2.5 0 0.5 −1 50.46 ± 0.60 15 40 0 3 1 0.5 −1 46.19 ± 0.51 Table 3.
The BBD and the responses of the dependent variables for the enzymatic hydrolysis conditions.
-
Total FA content (mg/g) Feruloyl esterase concentration Xylanase concentration Time
(h)Yield of
FA (%)Ref. 18.8 0.04 U/mL 24 9.63 [35] 4 U/mL 4.31 0.04 U/mL 4 U/mL 14.89 10.13 0.8 mg/mL − 1 43.24 [34] 10.78 46 μg/mL 46 μg/mL 24 67.70 [10] 17.85 (FA) and 11.29 (pCA) 1.1 U/mL 1.1 U/mL 2.5 63.42 (TFApCA) In this study Table 4.
Summary of representative FA productions from corncob.
Figures
(4)
Tables
(4)