-
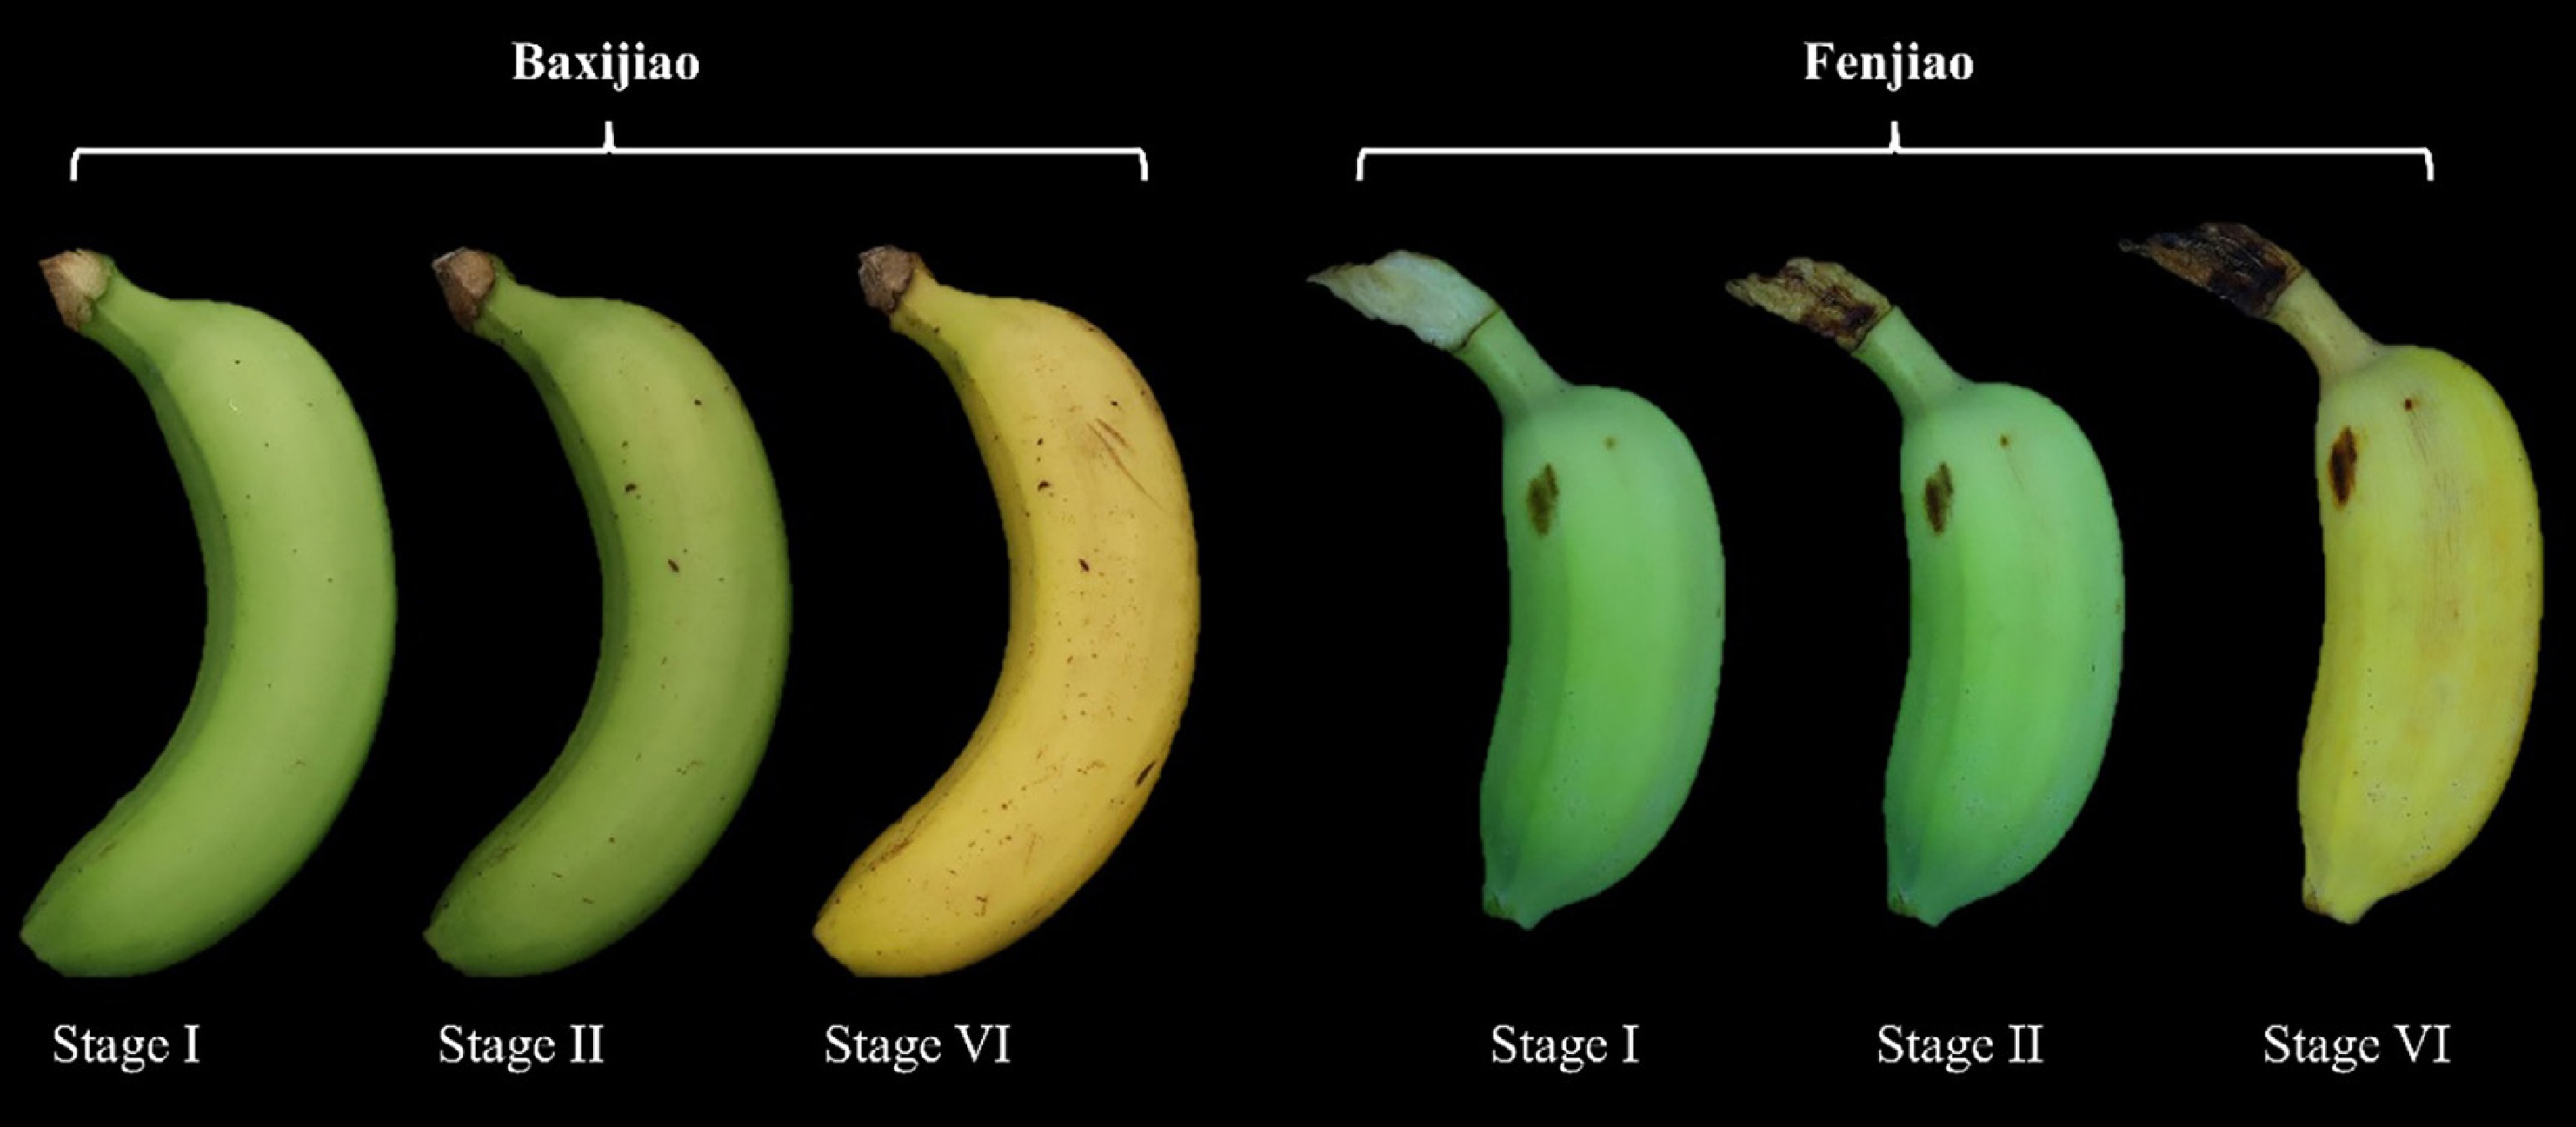
Figure 1.
Maturity stages of banana (Musa spp.) fruit used in this study. Fruit of the cultivars 'Baxijiao' and 'Fenjiao' were harvested at the first maturity stage (I; approximately 80 d after flowering) and subsequently stored at 22 °C until reaching the second (II), and sixth (VI) maturity stages, as defined by the USDA Agricultural Marketing Service Banana Ripening Guide.
-
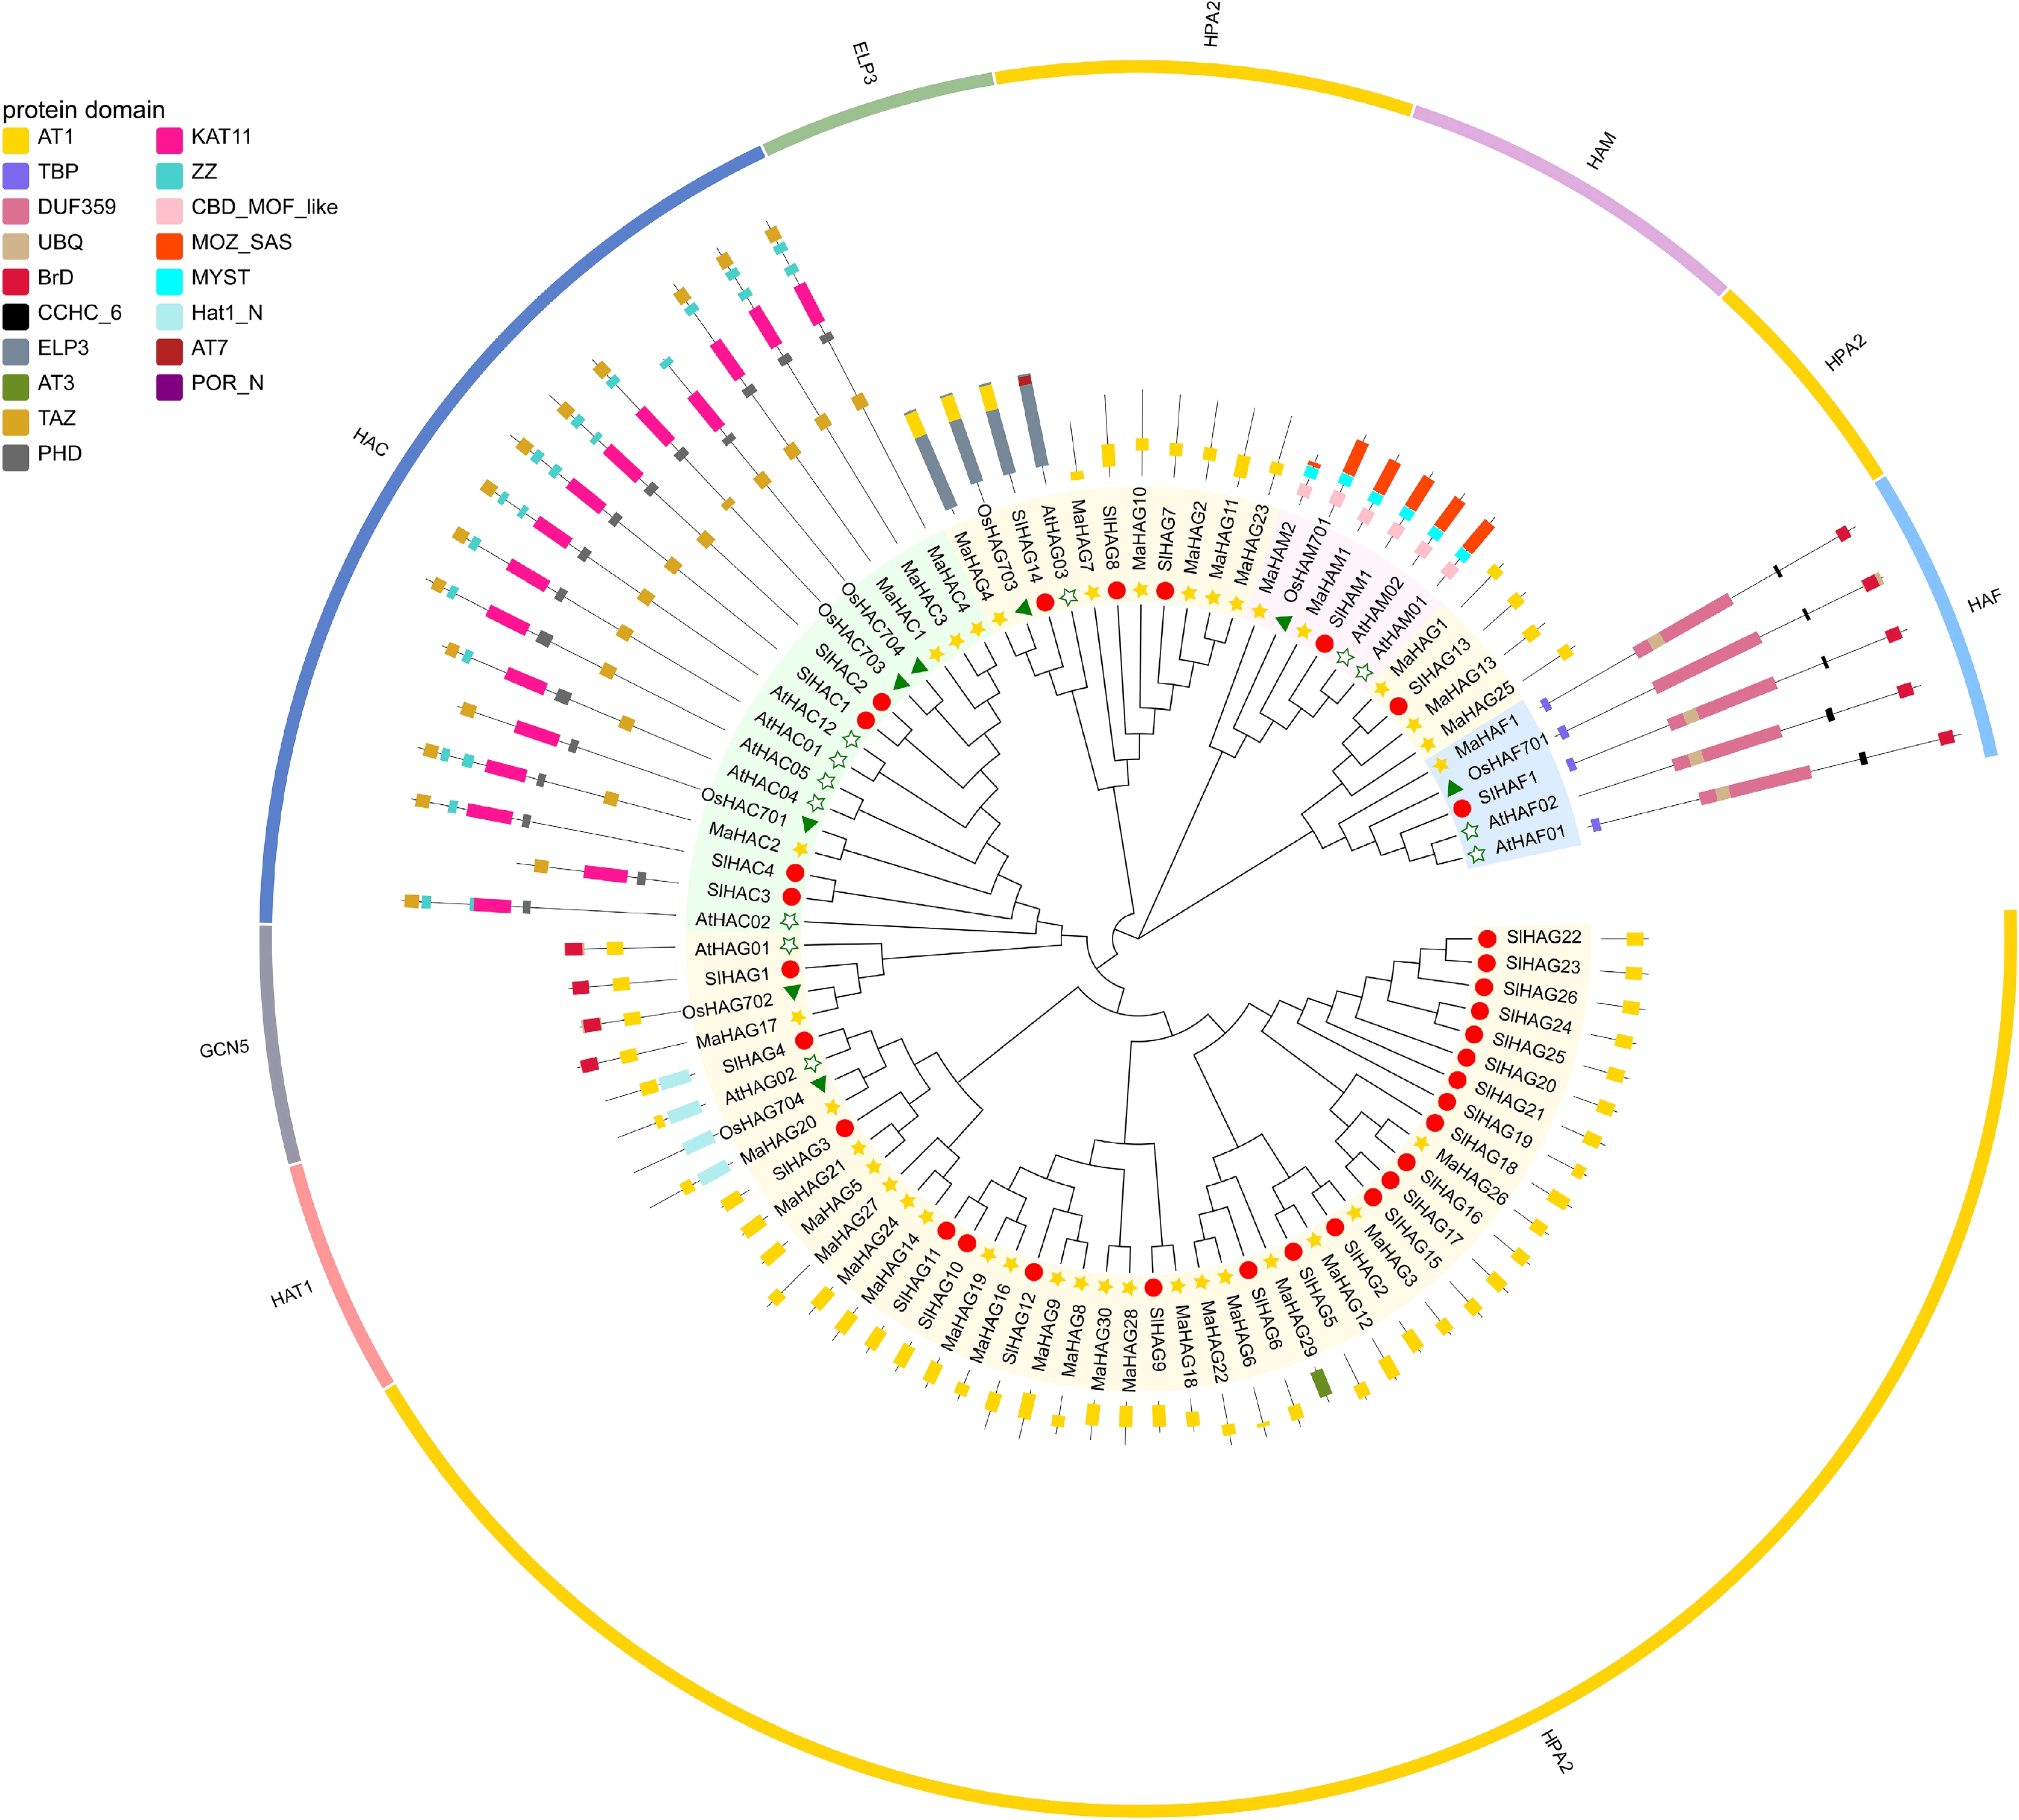
Figure 2.
Phylogenetic analysis of HATs proteins from the banana A genome, A. thaliana, S. lycopersicum, and O. sativa. The outermost ring indicates the family classification, and the middle ring annotates conserved domains identified within the amino acid sequences.
-
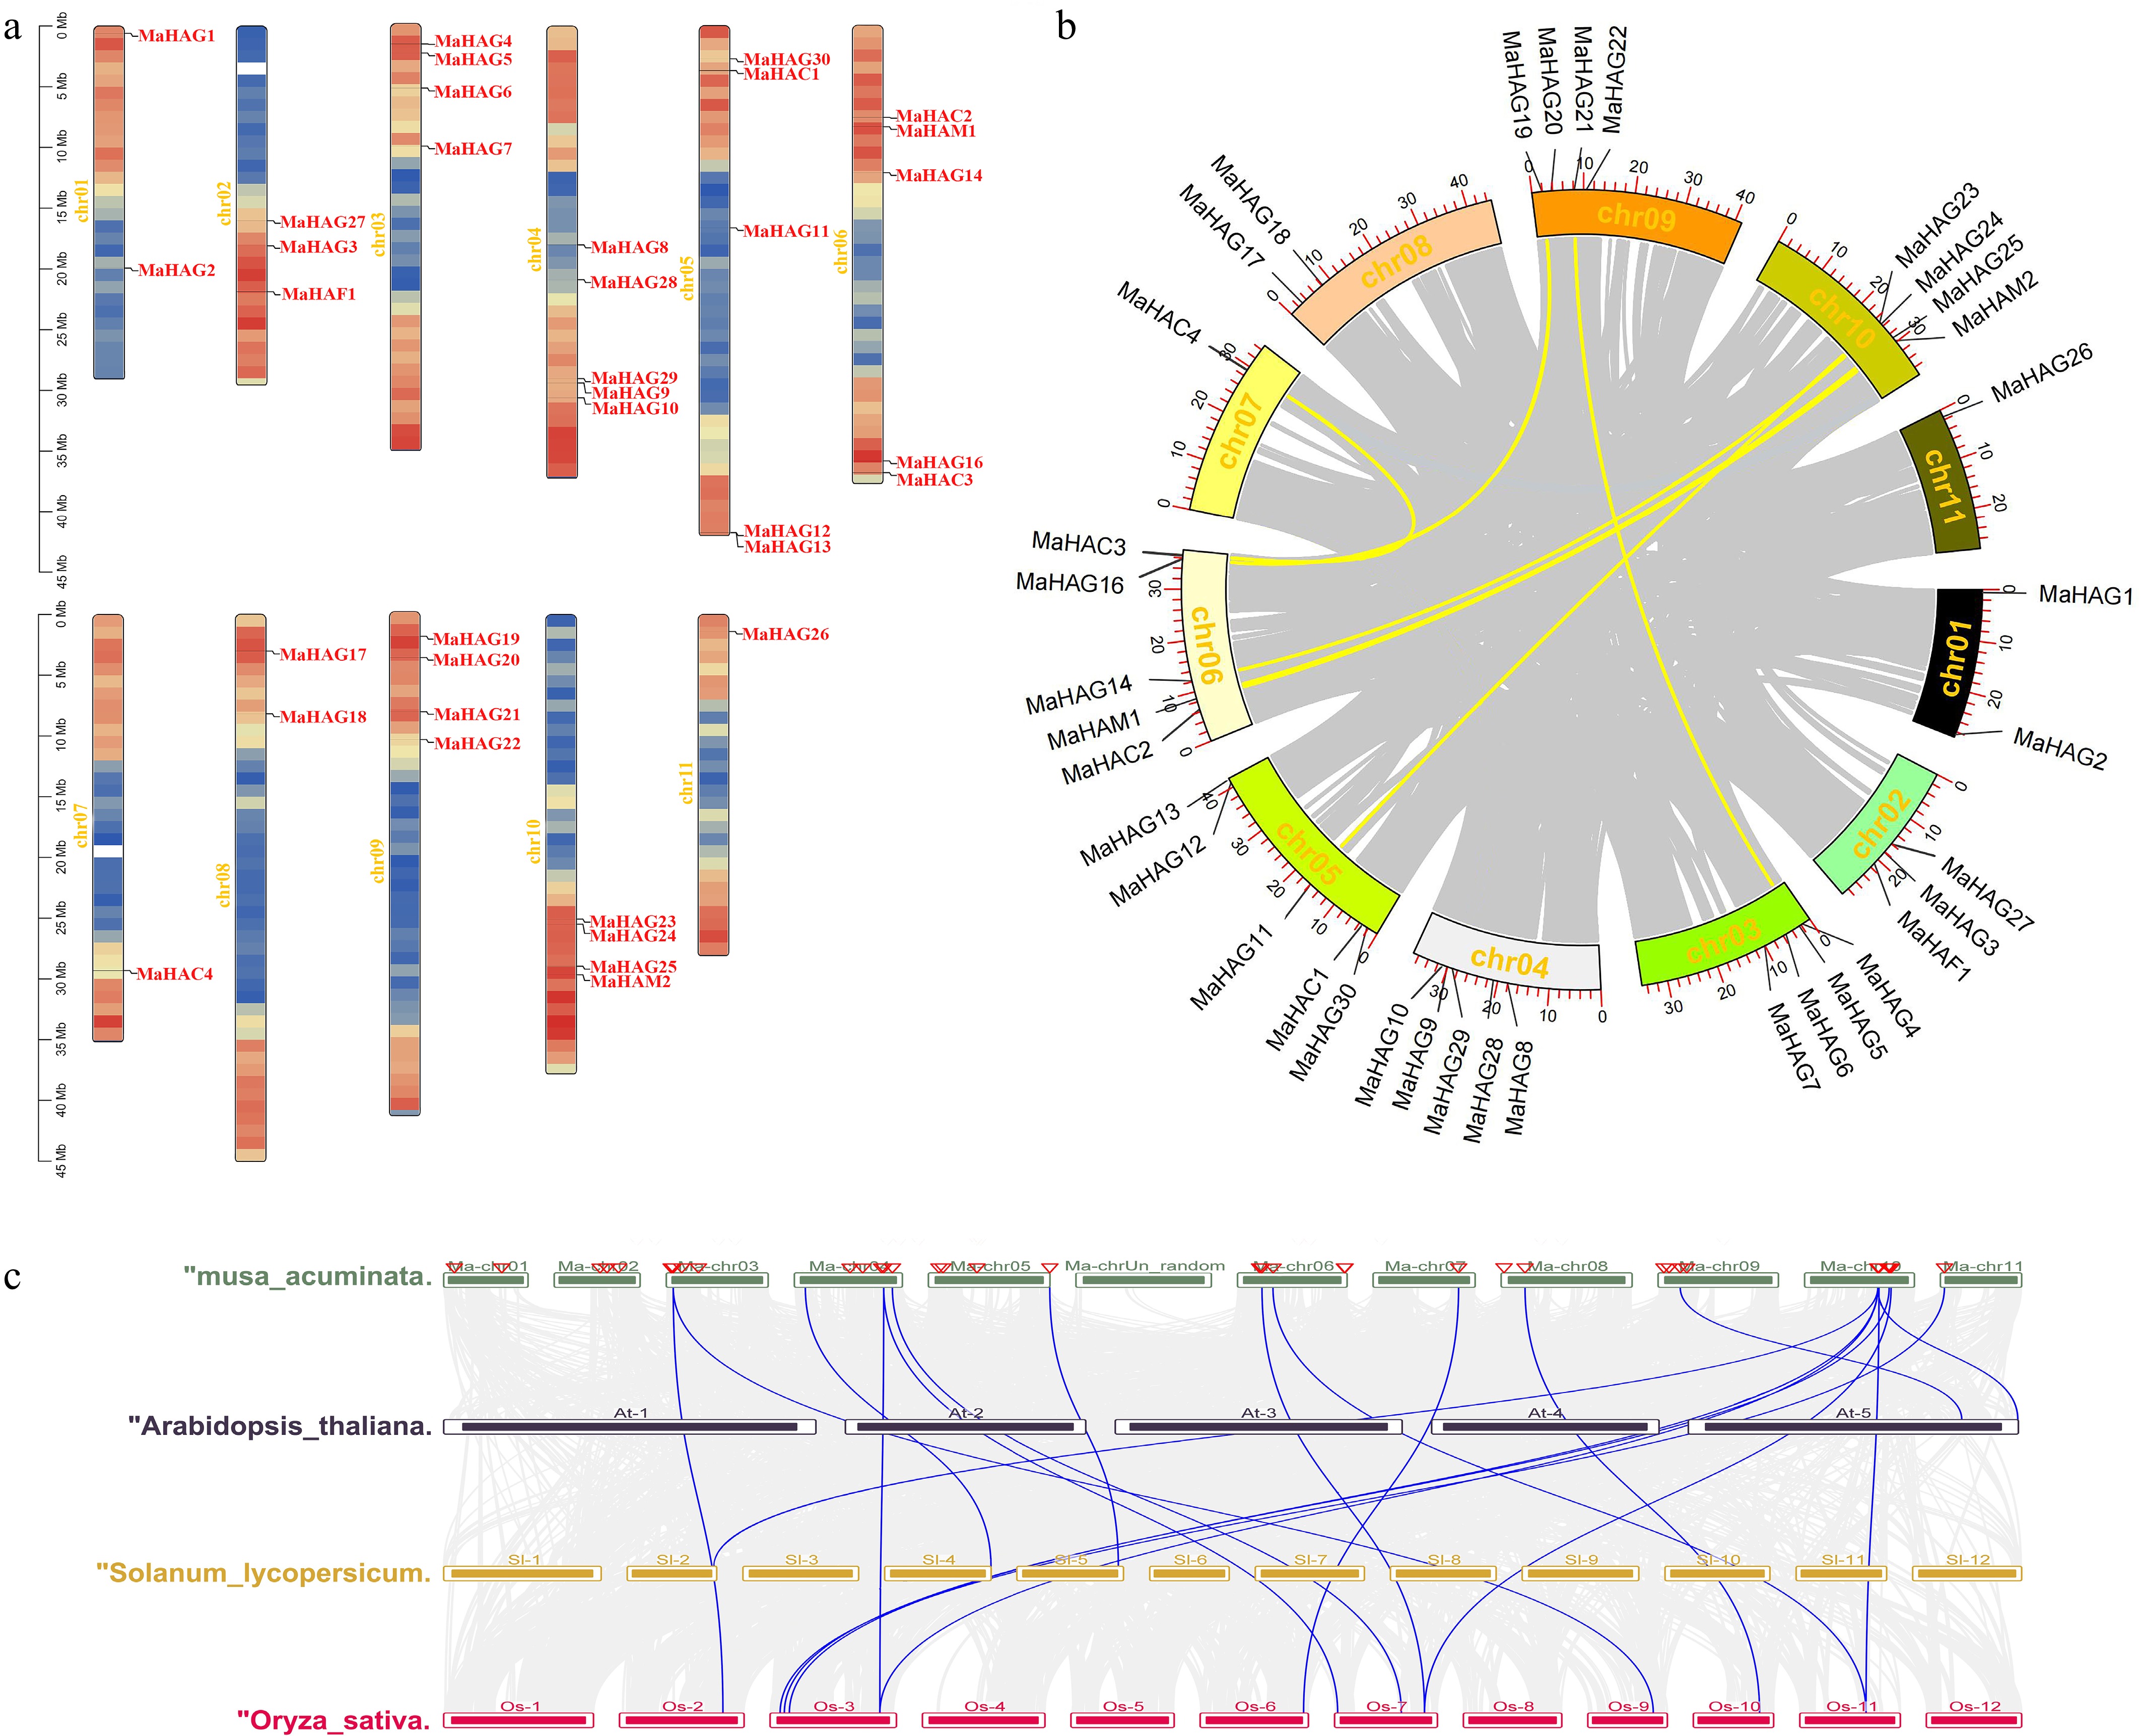
Figure 3.
(a) Chromosomal localization of identified MaHATs across the 11 banana chromosomes. (b) Intra-specific synteny analysis of the MaHATs loci. (c) Interspecific synteny analysis between MaHATs and AtHATs, SlHATs, and OsHATs.
-
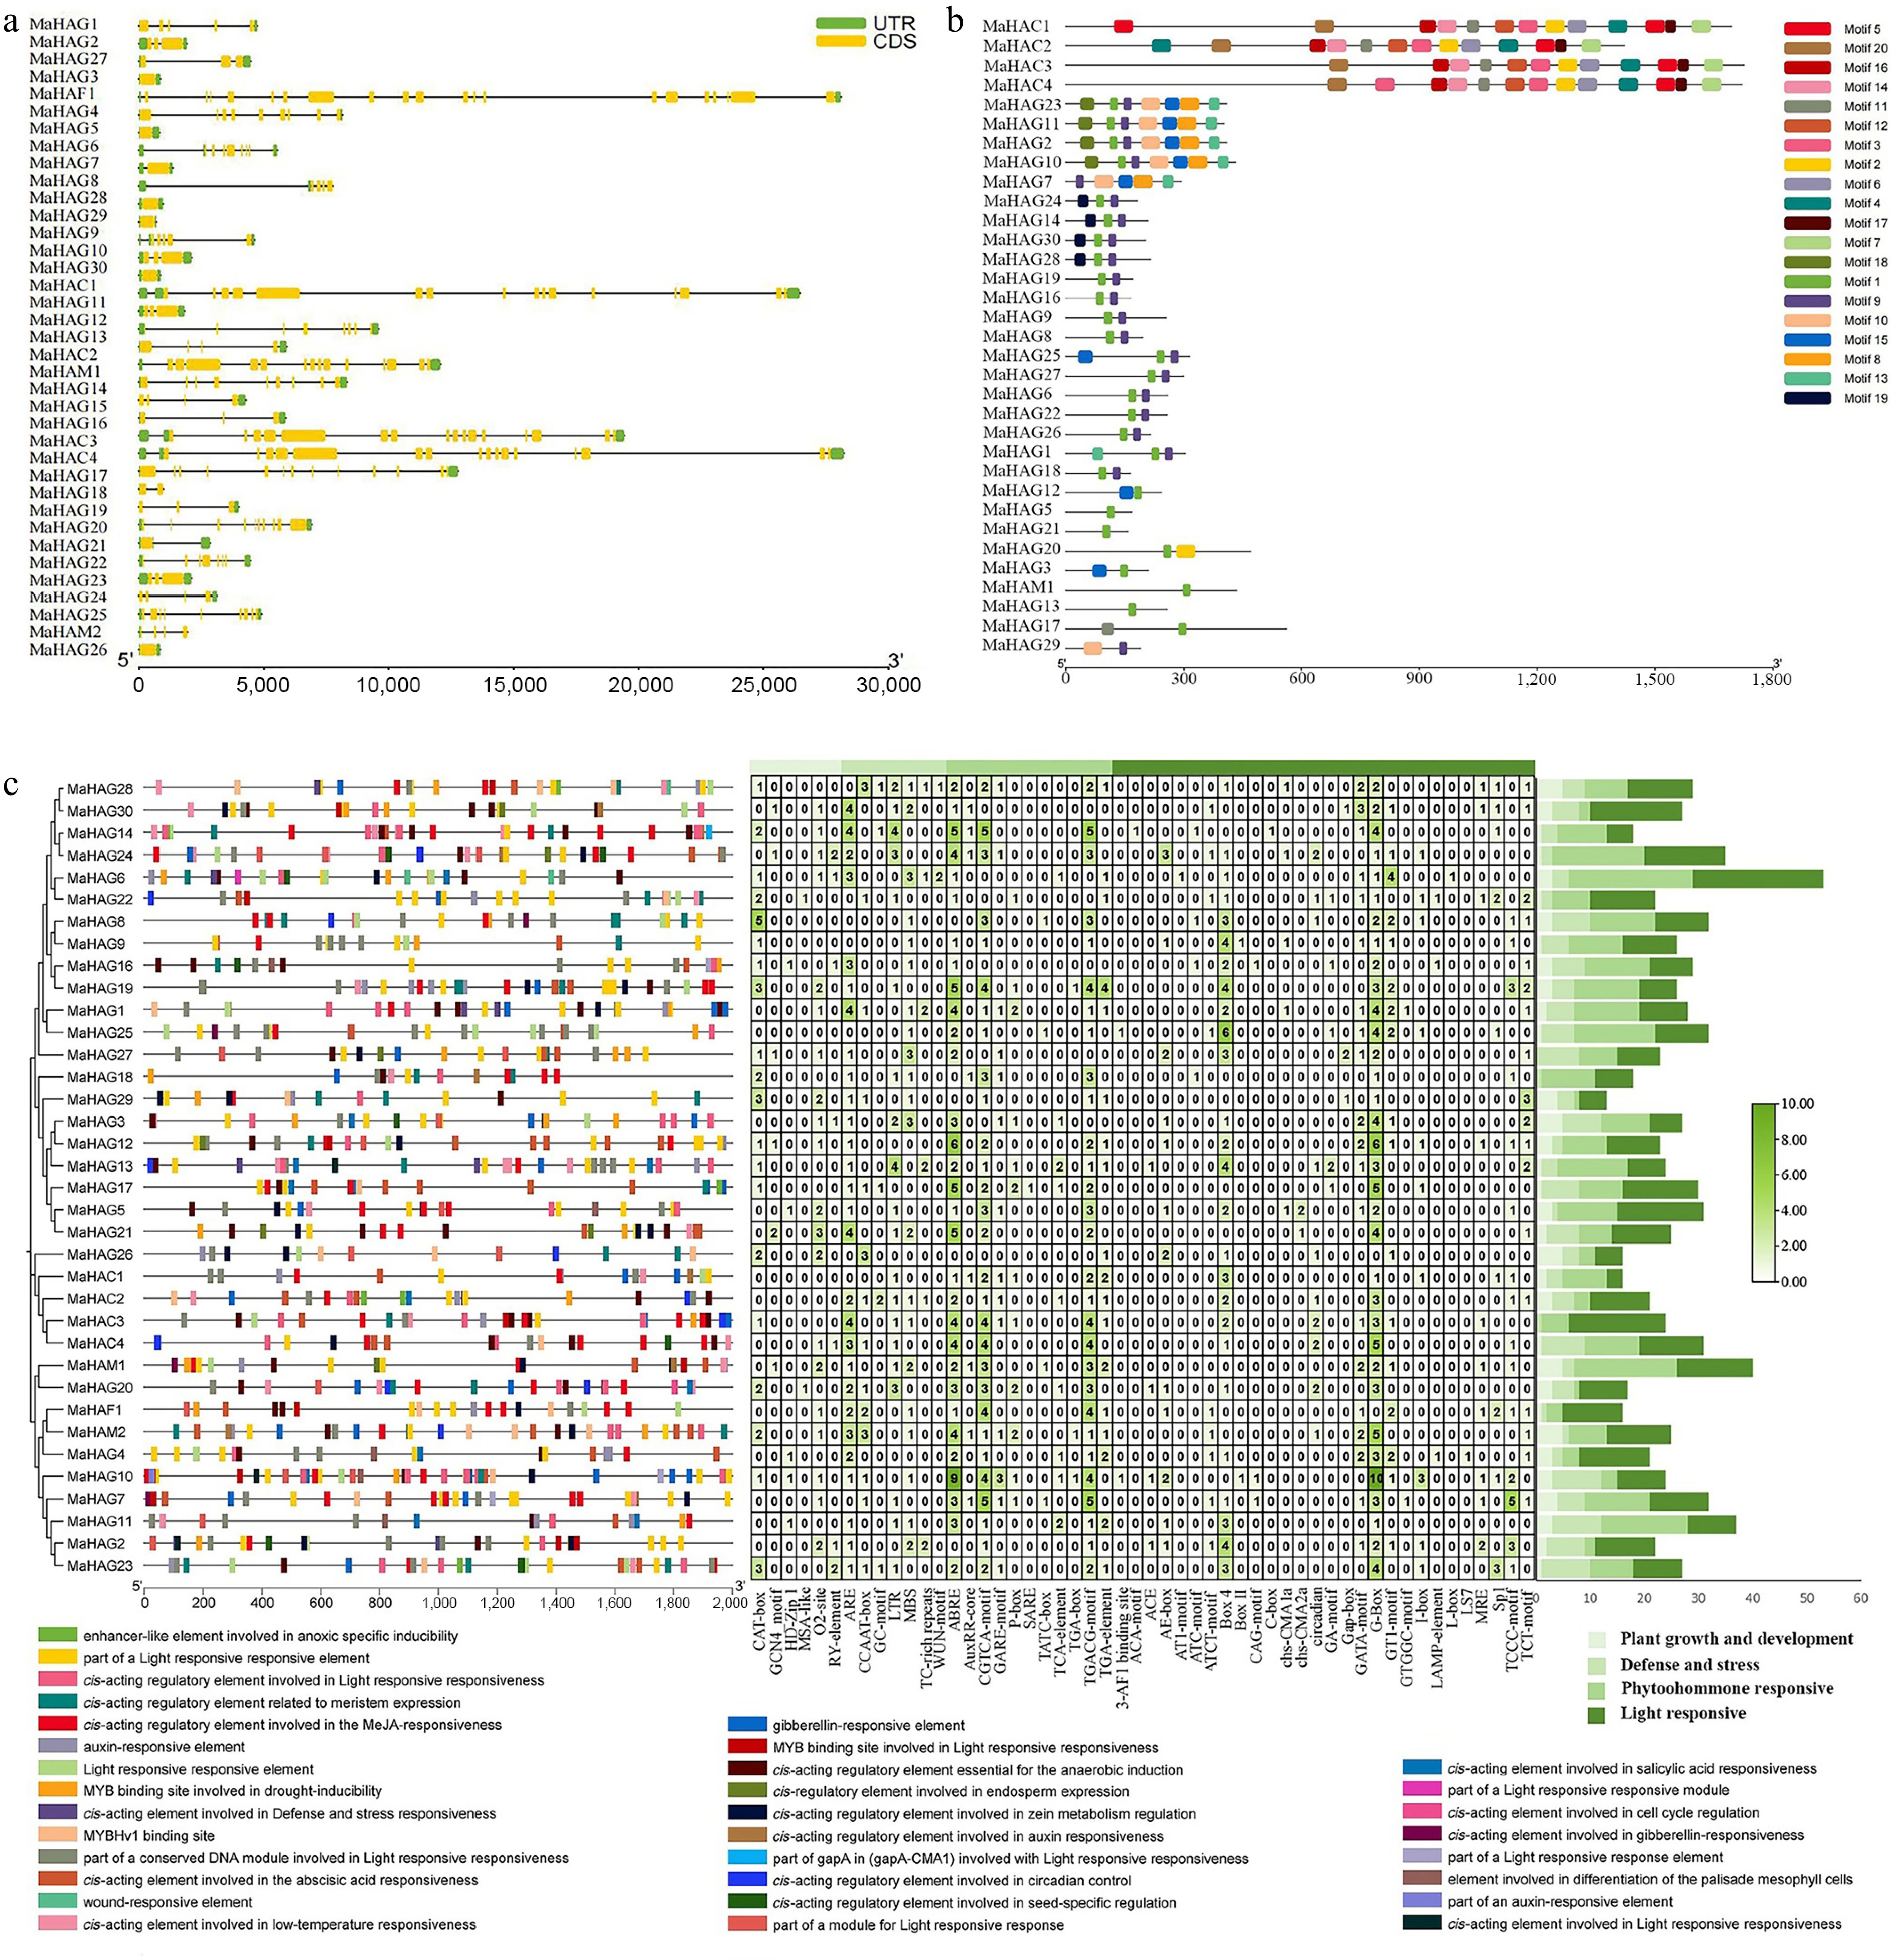
Figure 4.
(a) Analysis of cis-regulatory elements in the promoter regions of MaHATs. (b) Characterization of the coding sequence (CDS) architecture of MaHATs. (c) Analysis of conserved protein motifs in MaHATs sequences.
-
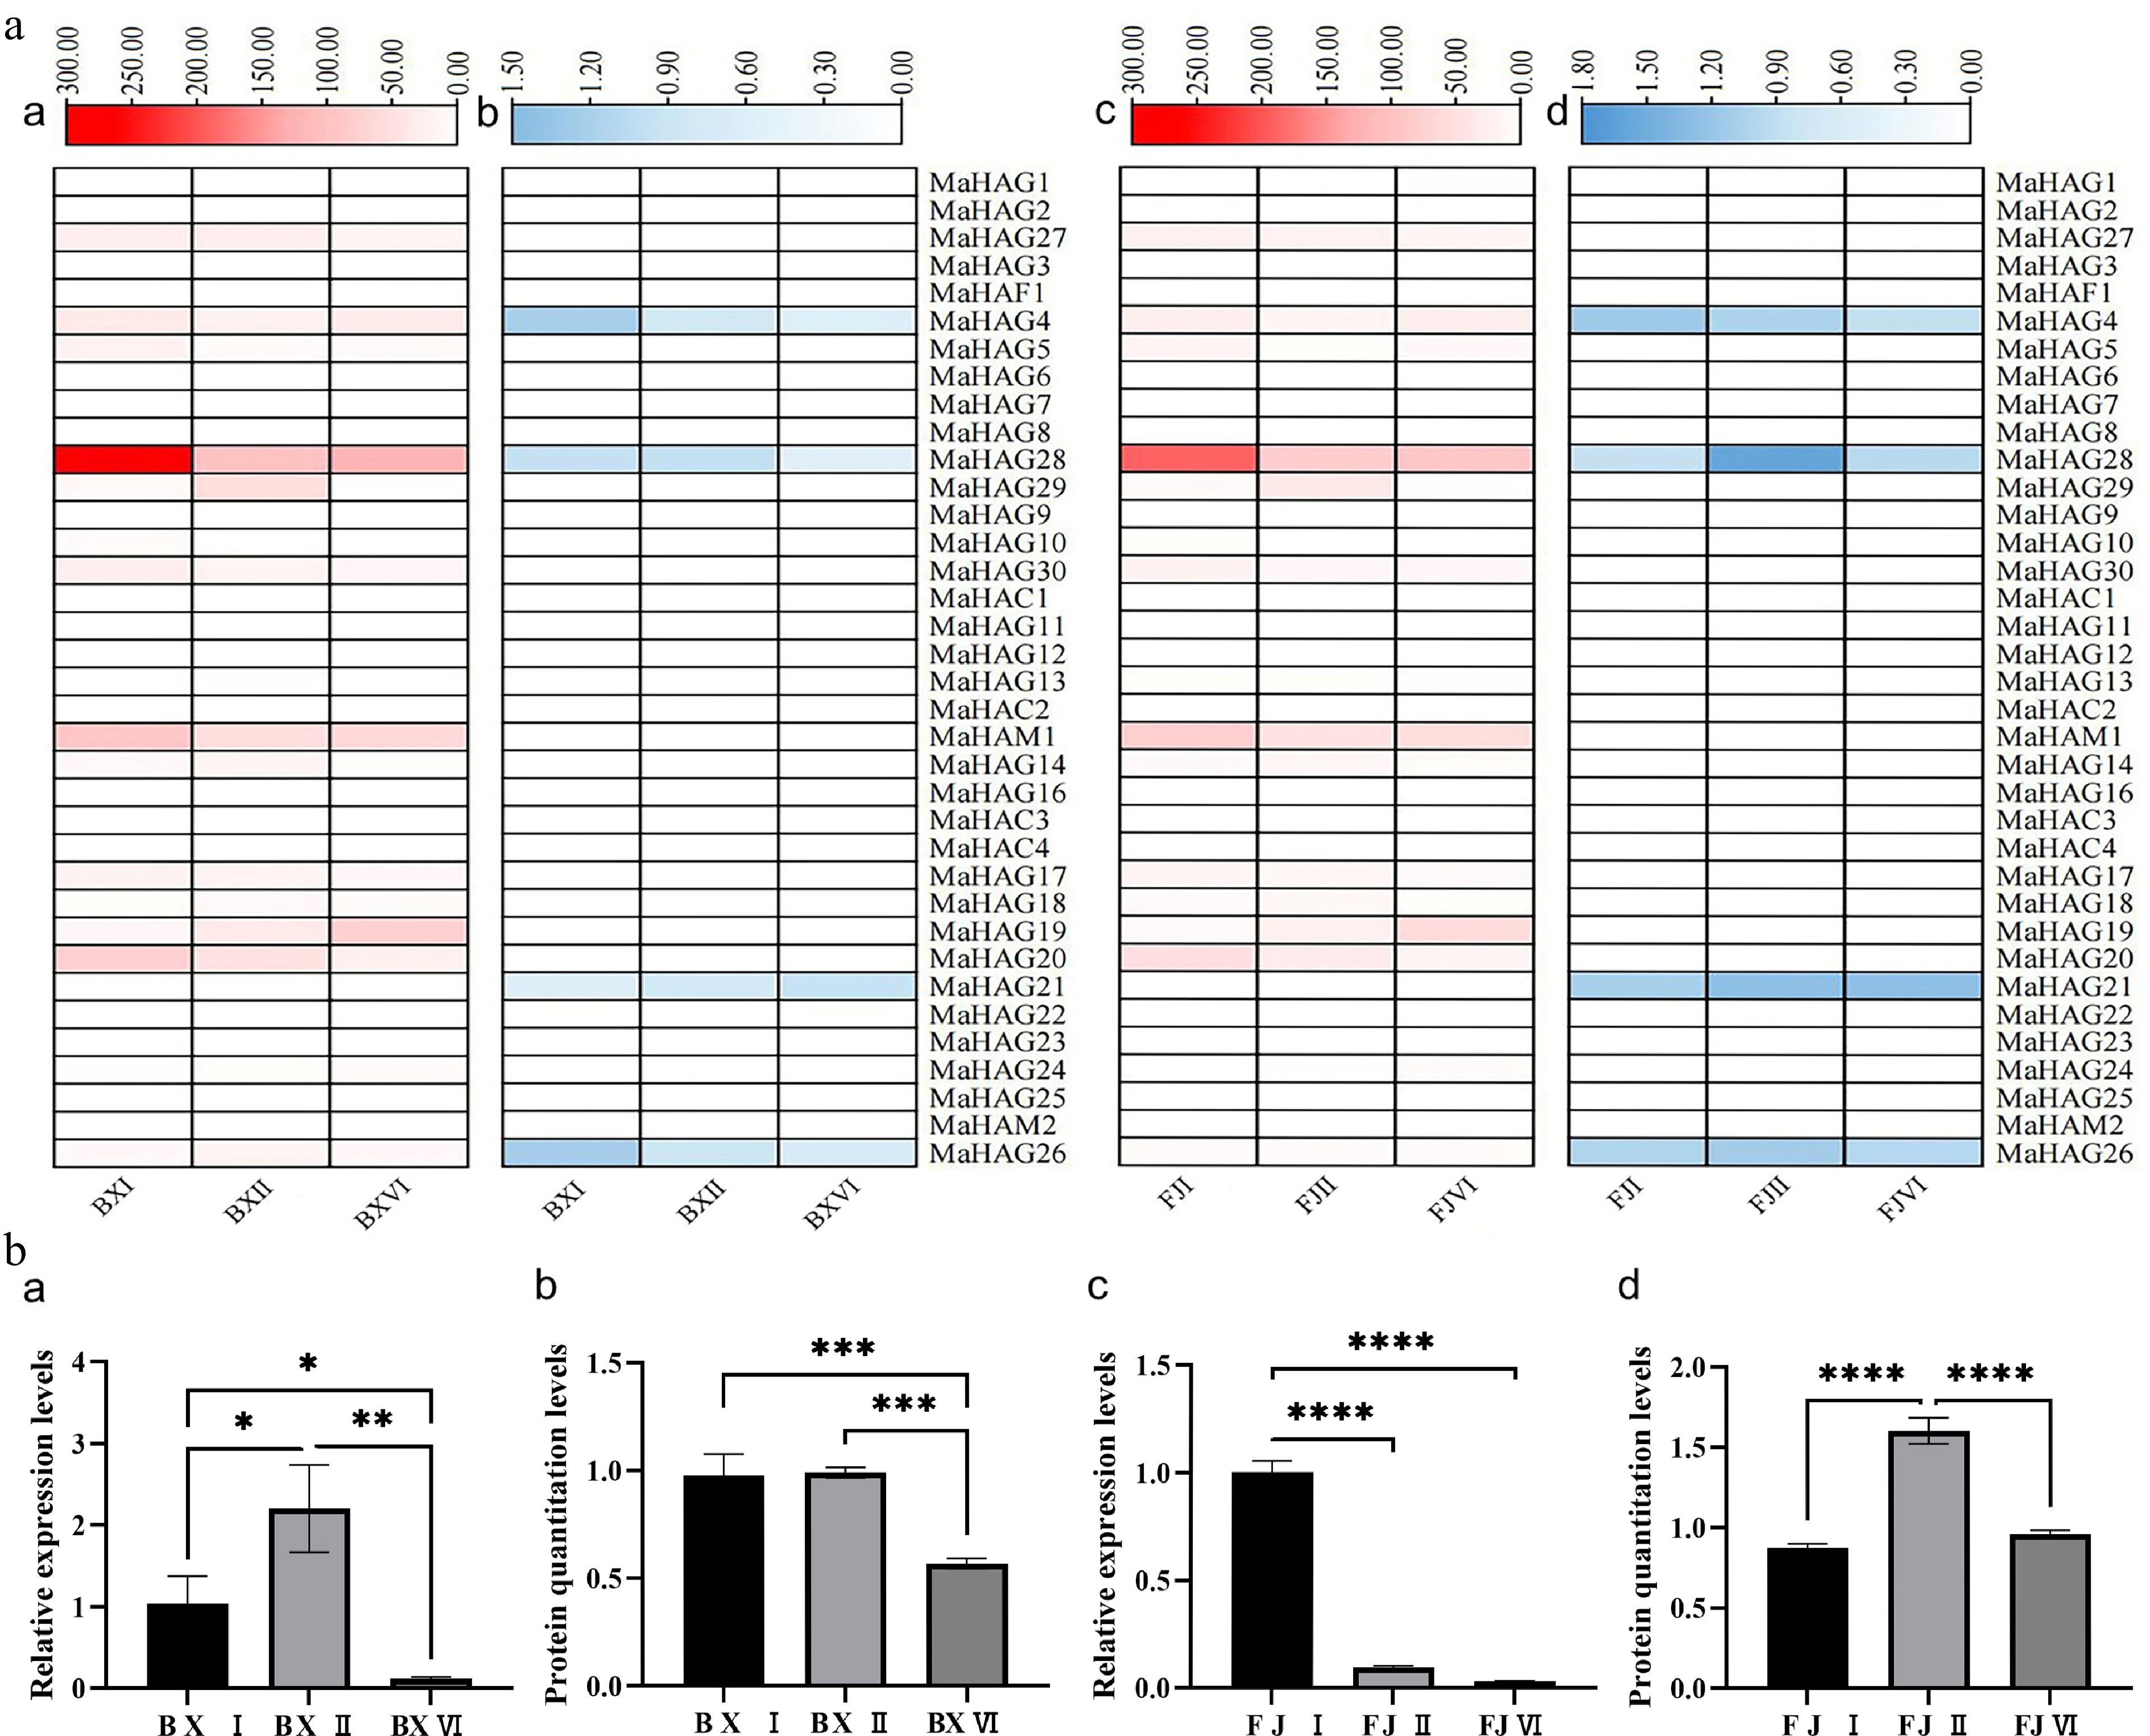
Figure 5.
(a) Integrated transcriptomic and proteomic data of MaHATs. Heatmaps (a) and (c) display the transcriptome profiles of the 'Baxijiao' and 'Fenjiao' varieties, respectively. Corresponding proteome profiles are presented in heatmaps (b) and (d) for the 'Baxijiao' and 'Fenjiao' varieties, respectively (both transcriptomic and proteomic analyses were performed with three biological replicates). (b) Expression and protein accumulation analysis of MaHAG28. Panels (a) and (c) show qRT-PCR analysis of MaHAG28 transcript levels in 'Baxijiao' and 'Fenjiao' fruit at different ripening stages, respectively. The corresponding protein abundance levels are quantified in panels (b) and (d).
-
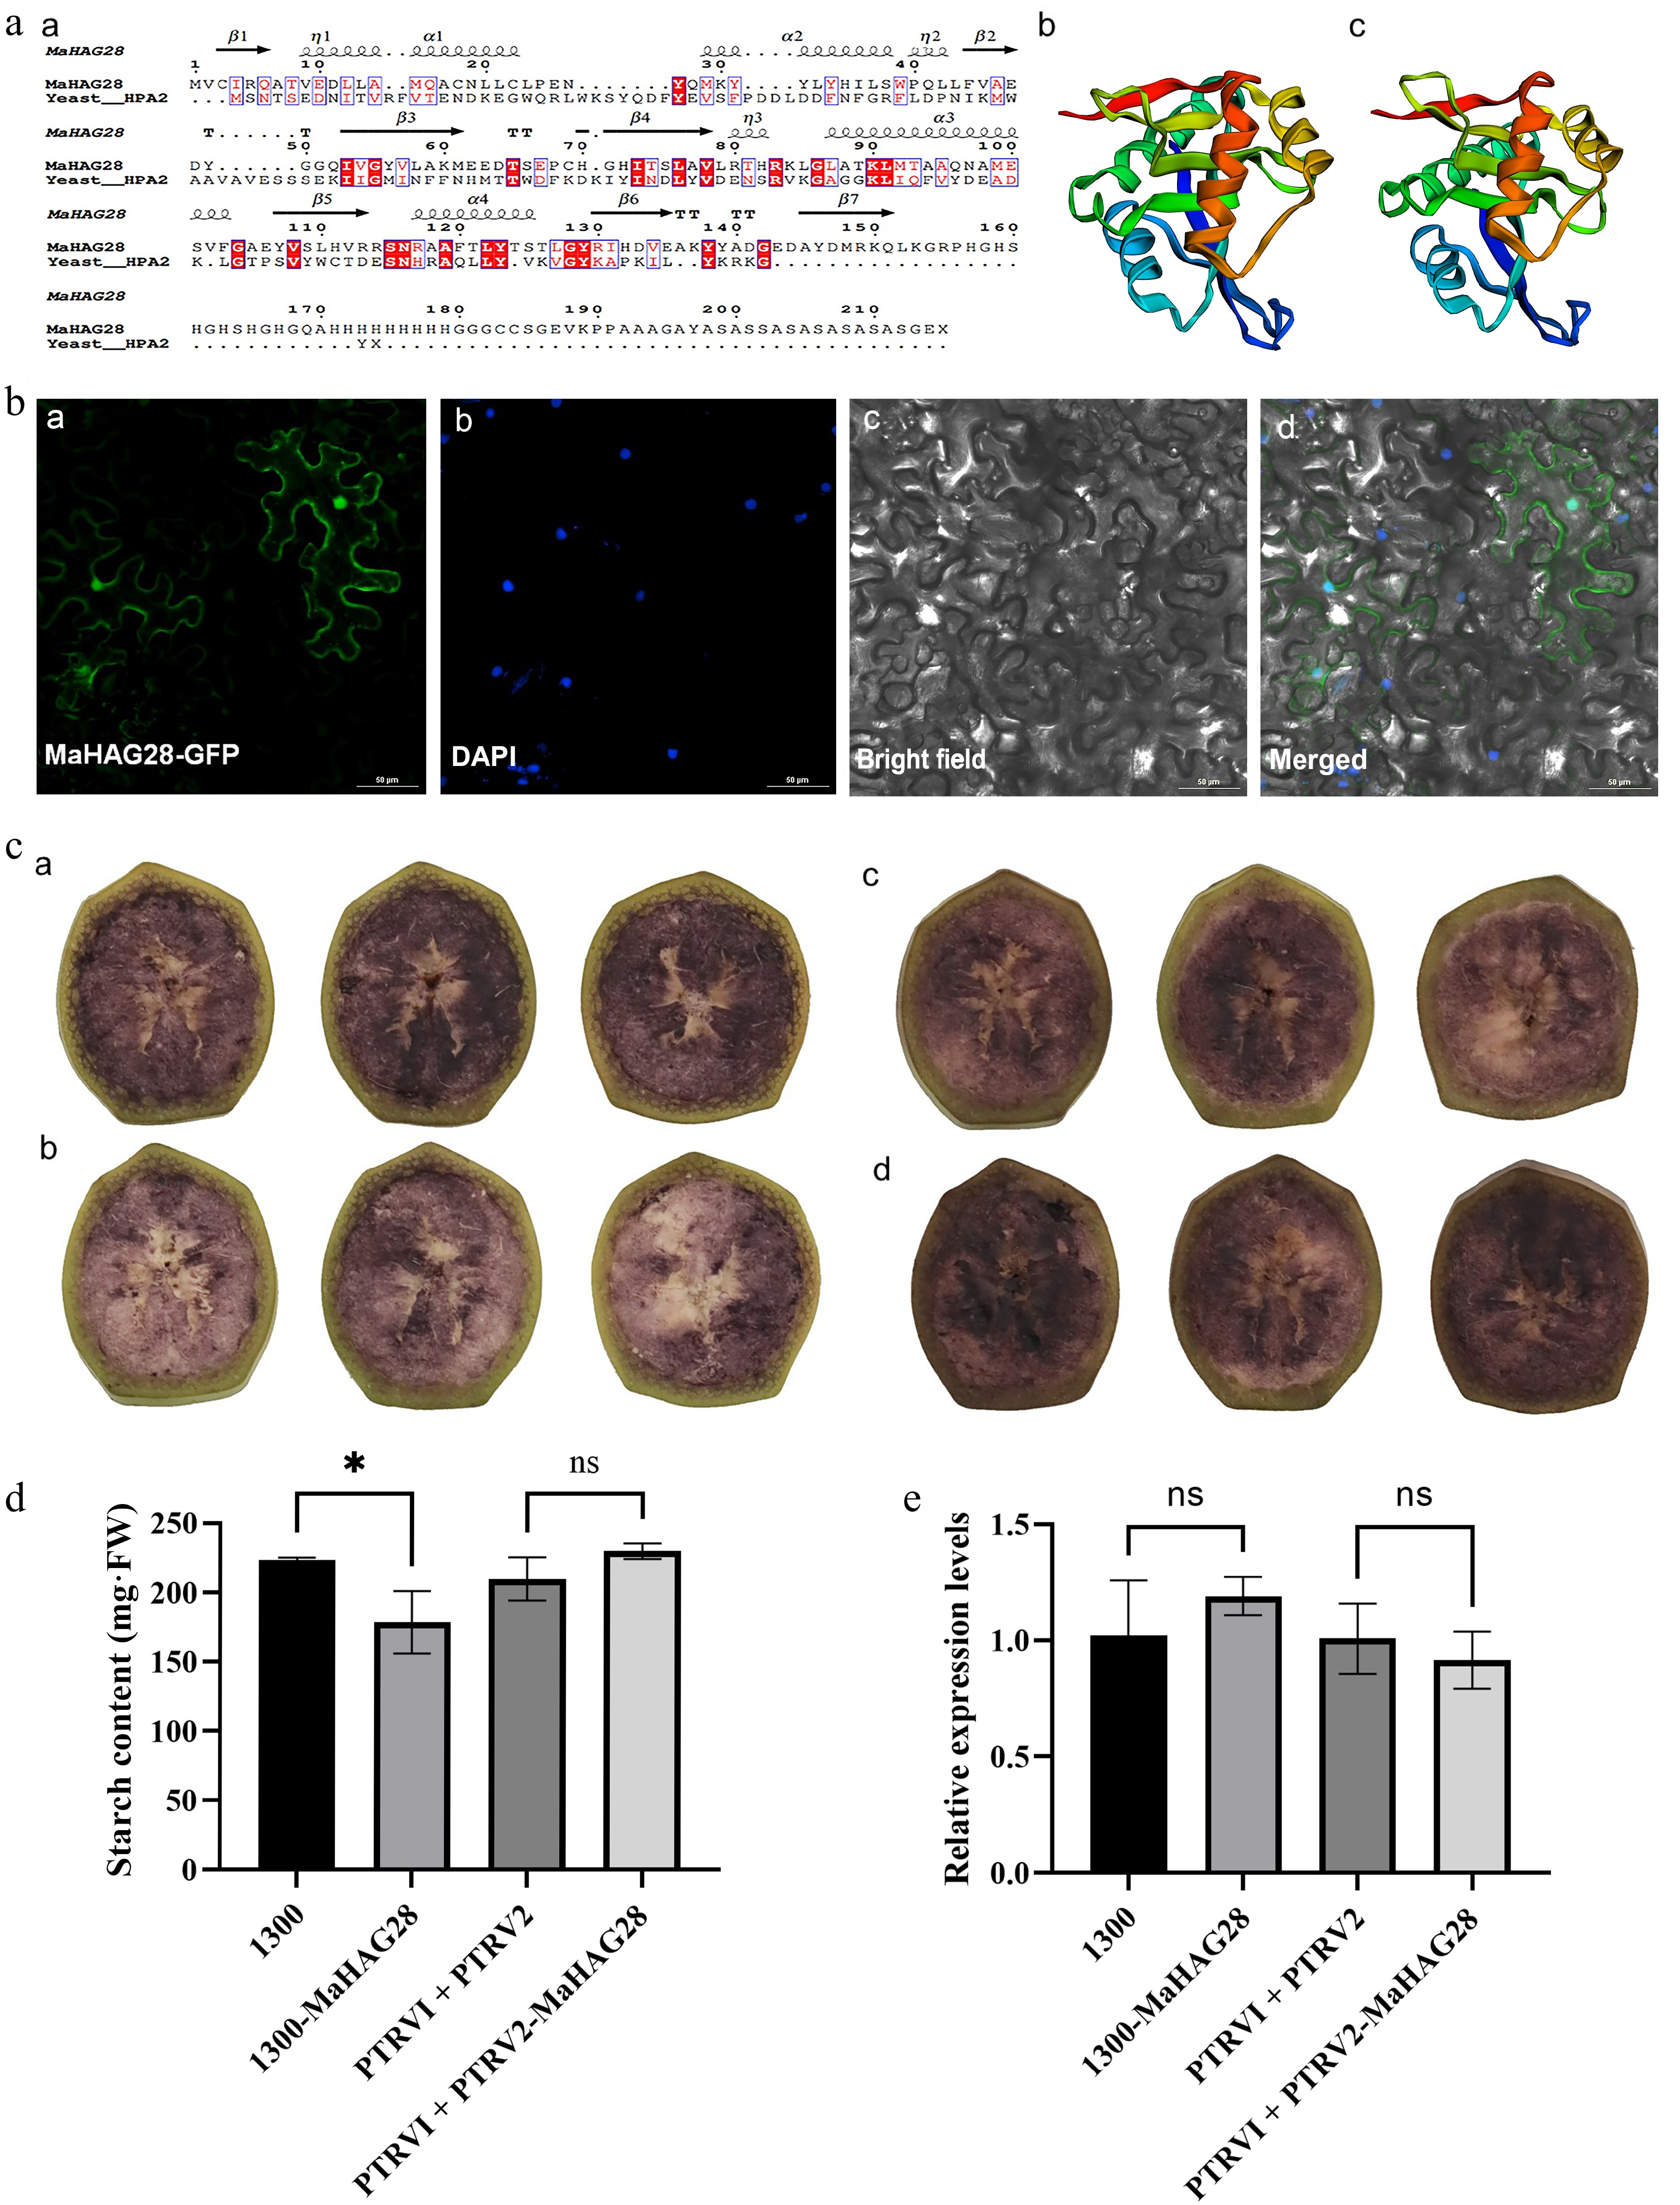
Figure 6.
(a) Comparison of MaHAG28 and yeast HPA2 secondary structures (a), and predicted three-dimensional structure of (b) MaHAG28, and (c) yeast HPA2. (b) Subcellular localization of MaHAG28 in tobacco leaf epidermal cells. GFP signal is detected in both the nucleus and cytoplasm (a). DAPI staining was used as a nuclear marker, (b). Scale bar = 50 µm. (c) Iodine-potassium iodide (0.5% I2-KI) staining of banana fruit slices following transient overexpression or VIGS-mediated silencing of MaHAG28 (30 s incubation). Control groups transformed with empty vectors (a) pCambia1300, and (c) PTRV1 + PTRV2, respectively. Experimental groups transformed with (b) pCambia1300-MaHAG28, and (c) PTRV1 + PTRV2-MaHAG28, respectively. (d) Starch content in fruit slices across experimental groups. (e) Relative expression levels of MaHAG28 in fruit slices across experimental groups.
Figures
(6)
Tables
(0)