-
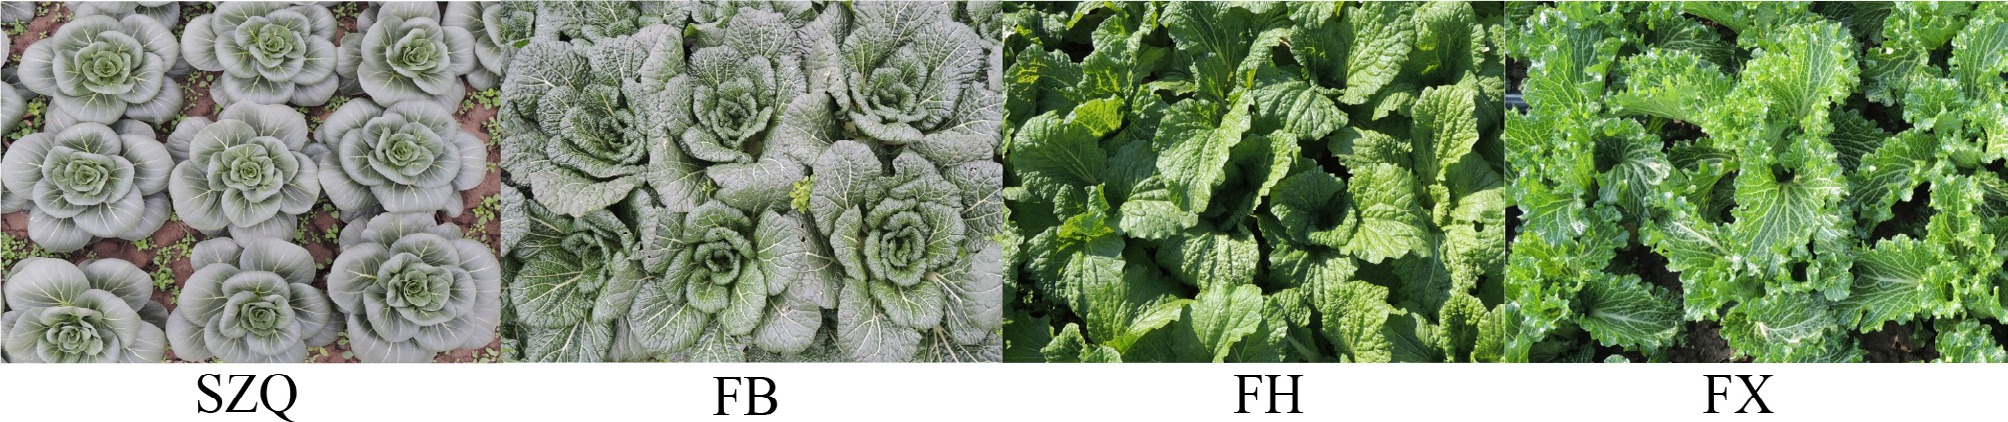
Figure 1.
Morphological diversity of NHCC cultivars.
-
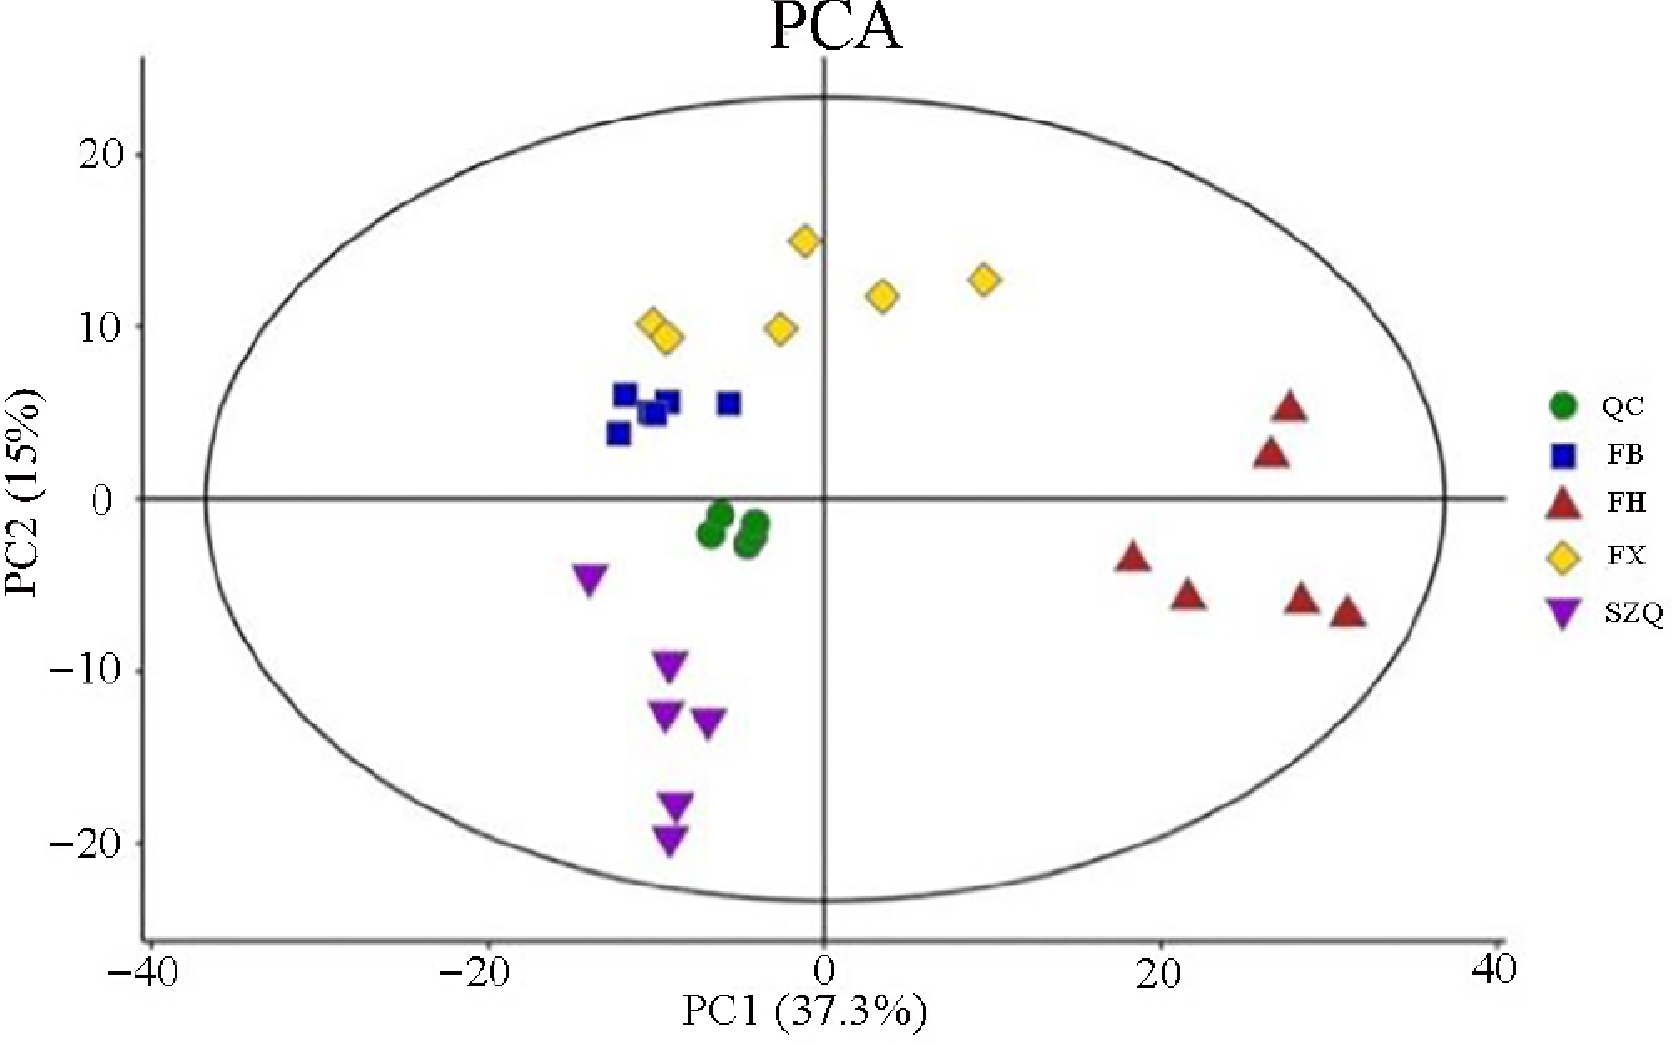
Figure 2.
PCA score plot of metabolic profiles in the four NHCC cultivars. Principal component analysis (PCA) score plot derived from the metabolomic data of four non-heading Chinese cabbage (NHCC) cultivars: FB (blue squares), FH (red triangles), FX (yellow diamonds), and SZQ (purple inverted triangles). Quality control (QC) samples (green circles) are included.
-
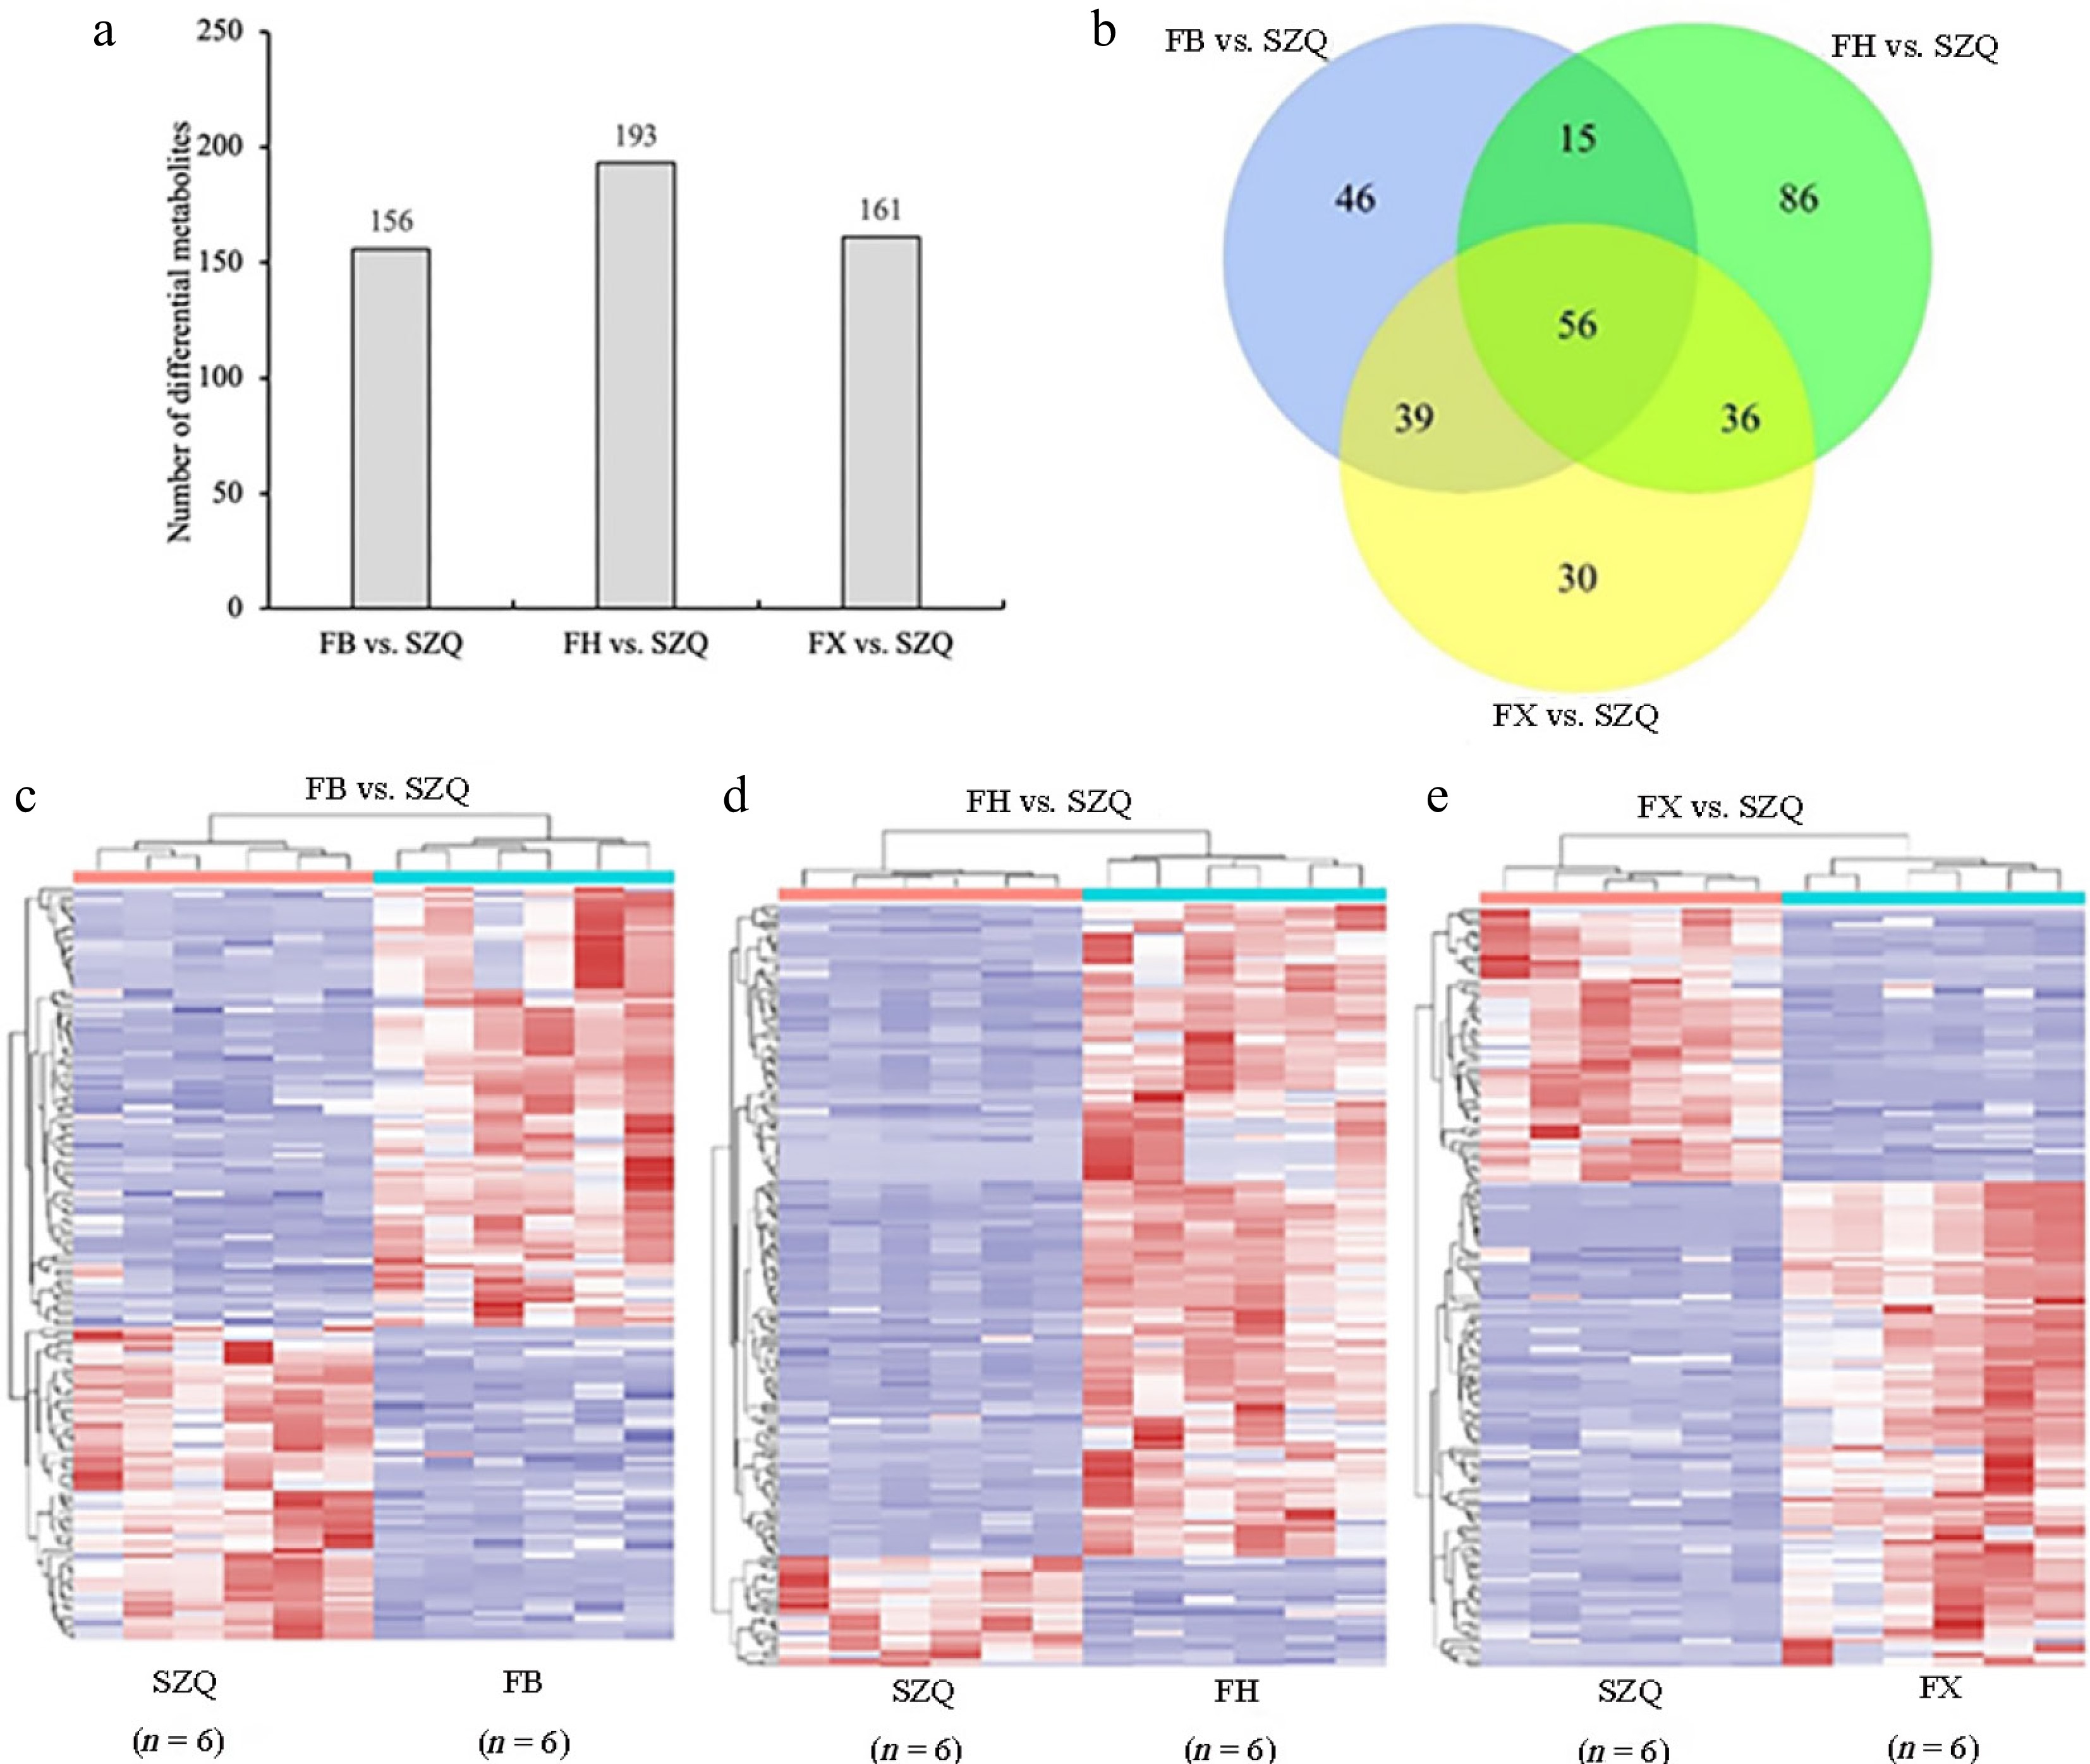
Figure 3.
Differential metabolites of FB vs. SZQ, FH vs. SZQ, and FX vs. SZQ. (a) The bar chart shows the number of differential metabolites among the cultivar comparison. (b) Venn diagram illustrating the overlap of differential volatile compounds among the comparison groups. (c) Heatmap of differential metabolites in FB vs. SZQ ( n = 6). (d) Heatmap of differential metabolites in FH vs. SZQ ( n = 6). (e) Heatmap of differential metabolites in FX vs. SZQ ( n = 6).
-
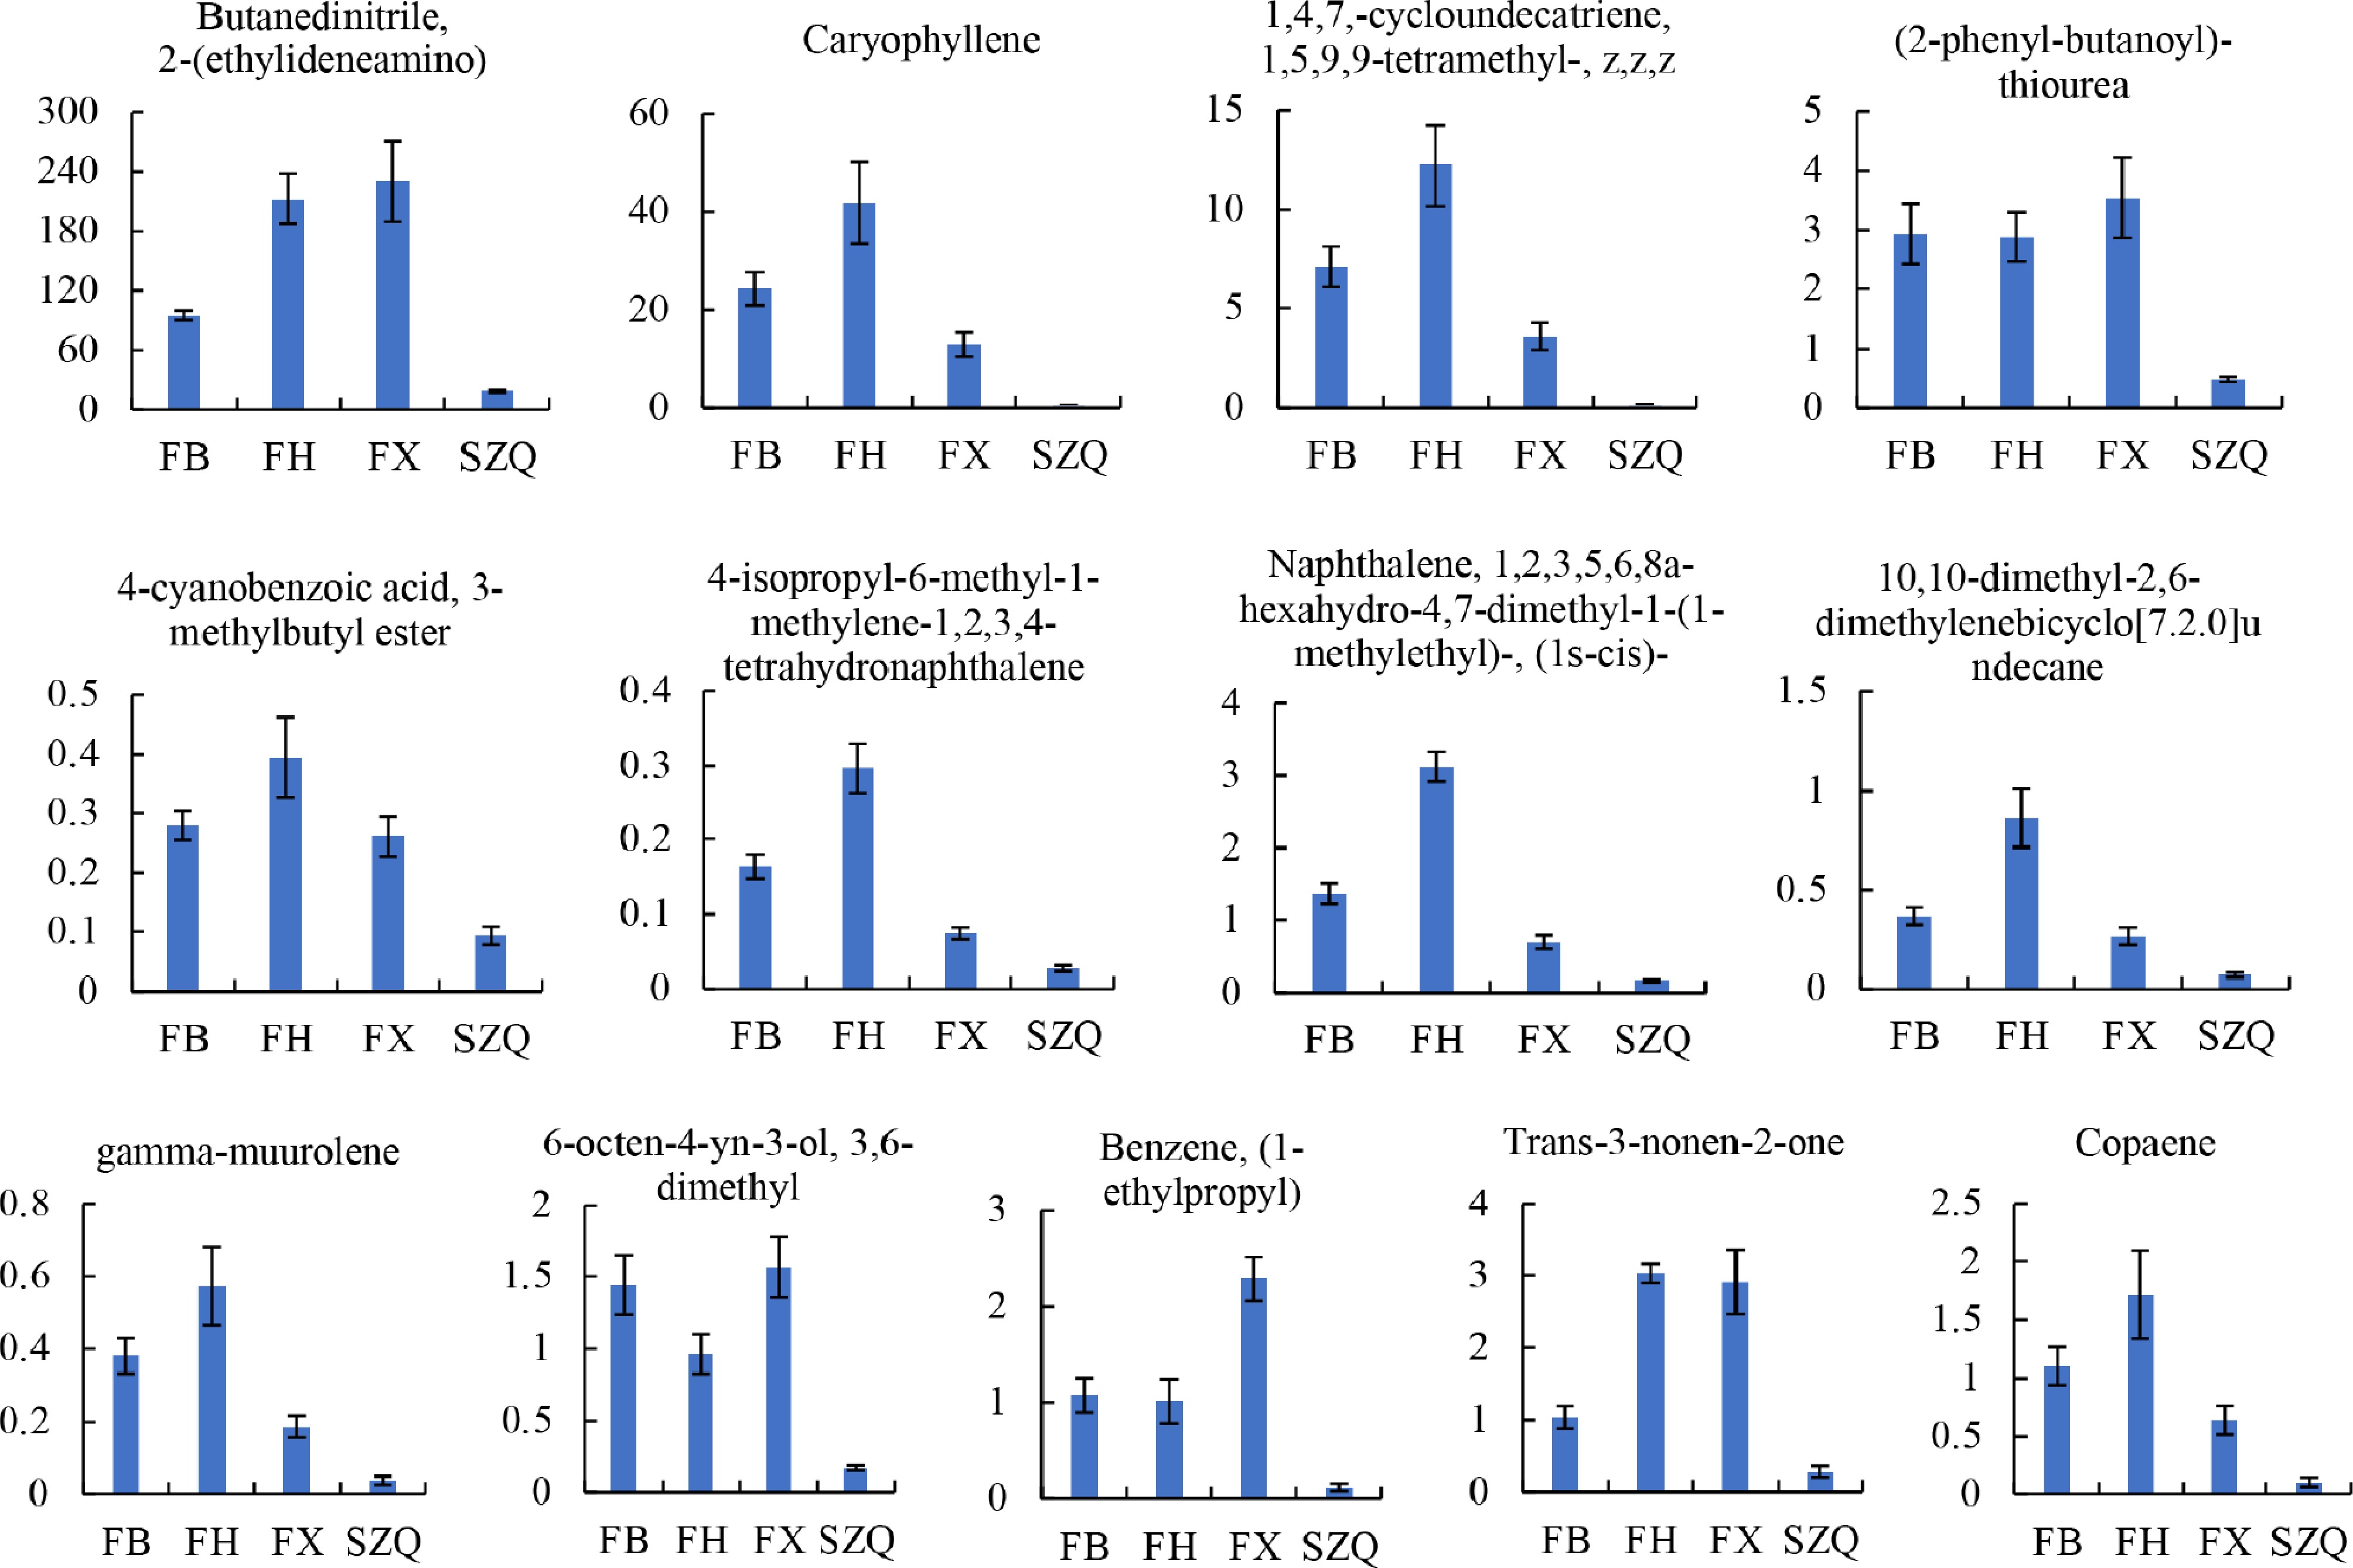
Figure 4.
The contents of 13 volatile compounds were identified as being significantly different in comparison with the SZQ cultivar. The Y-axis represents the expression level (abundance) of each differential metabolite. Values are presented as mean ± SE ( n = 6).
-
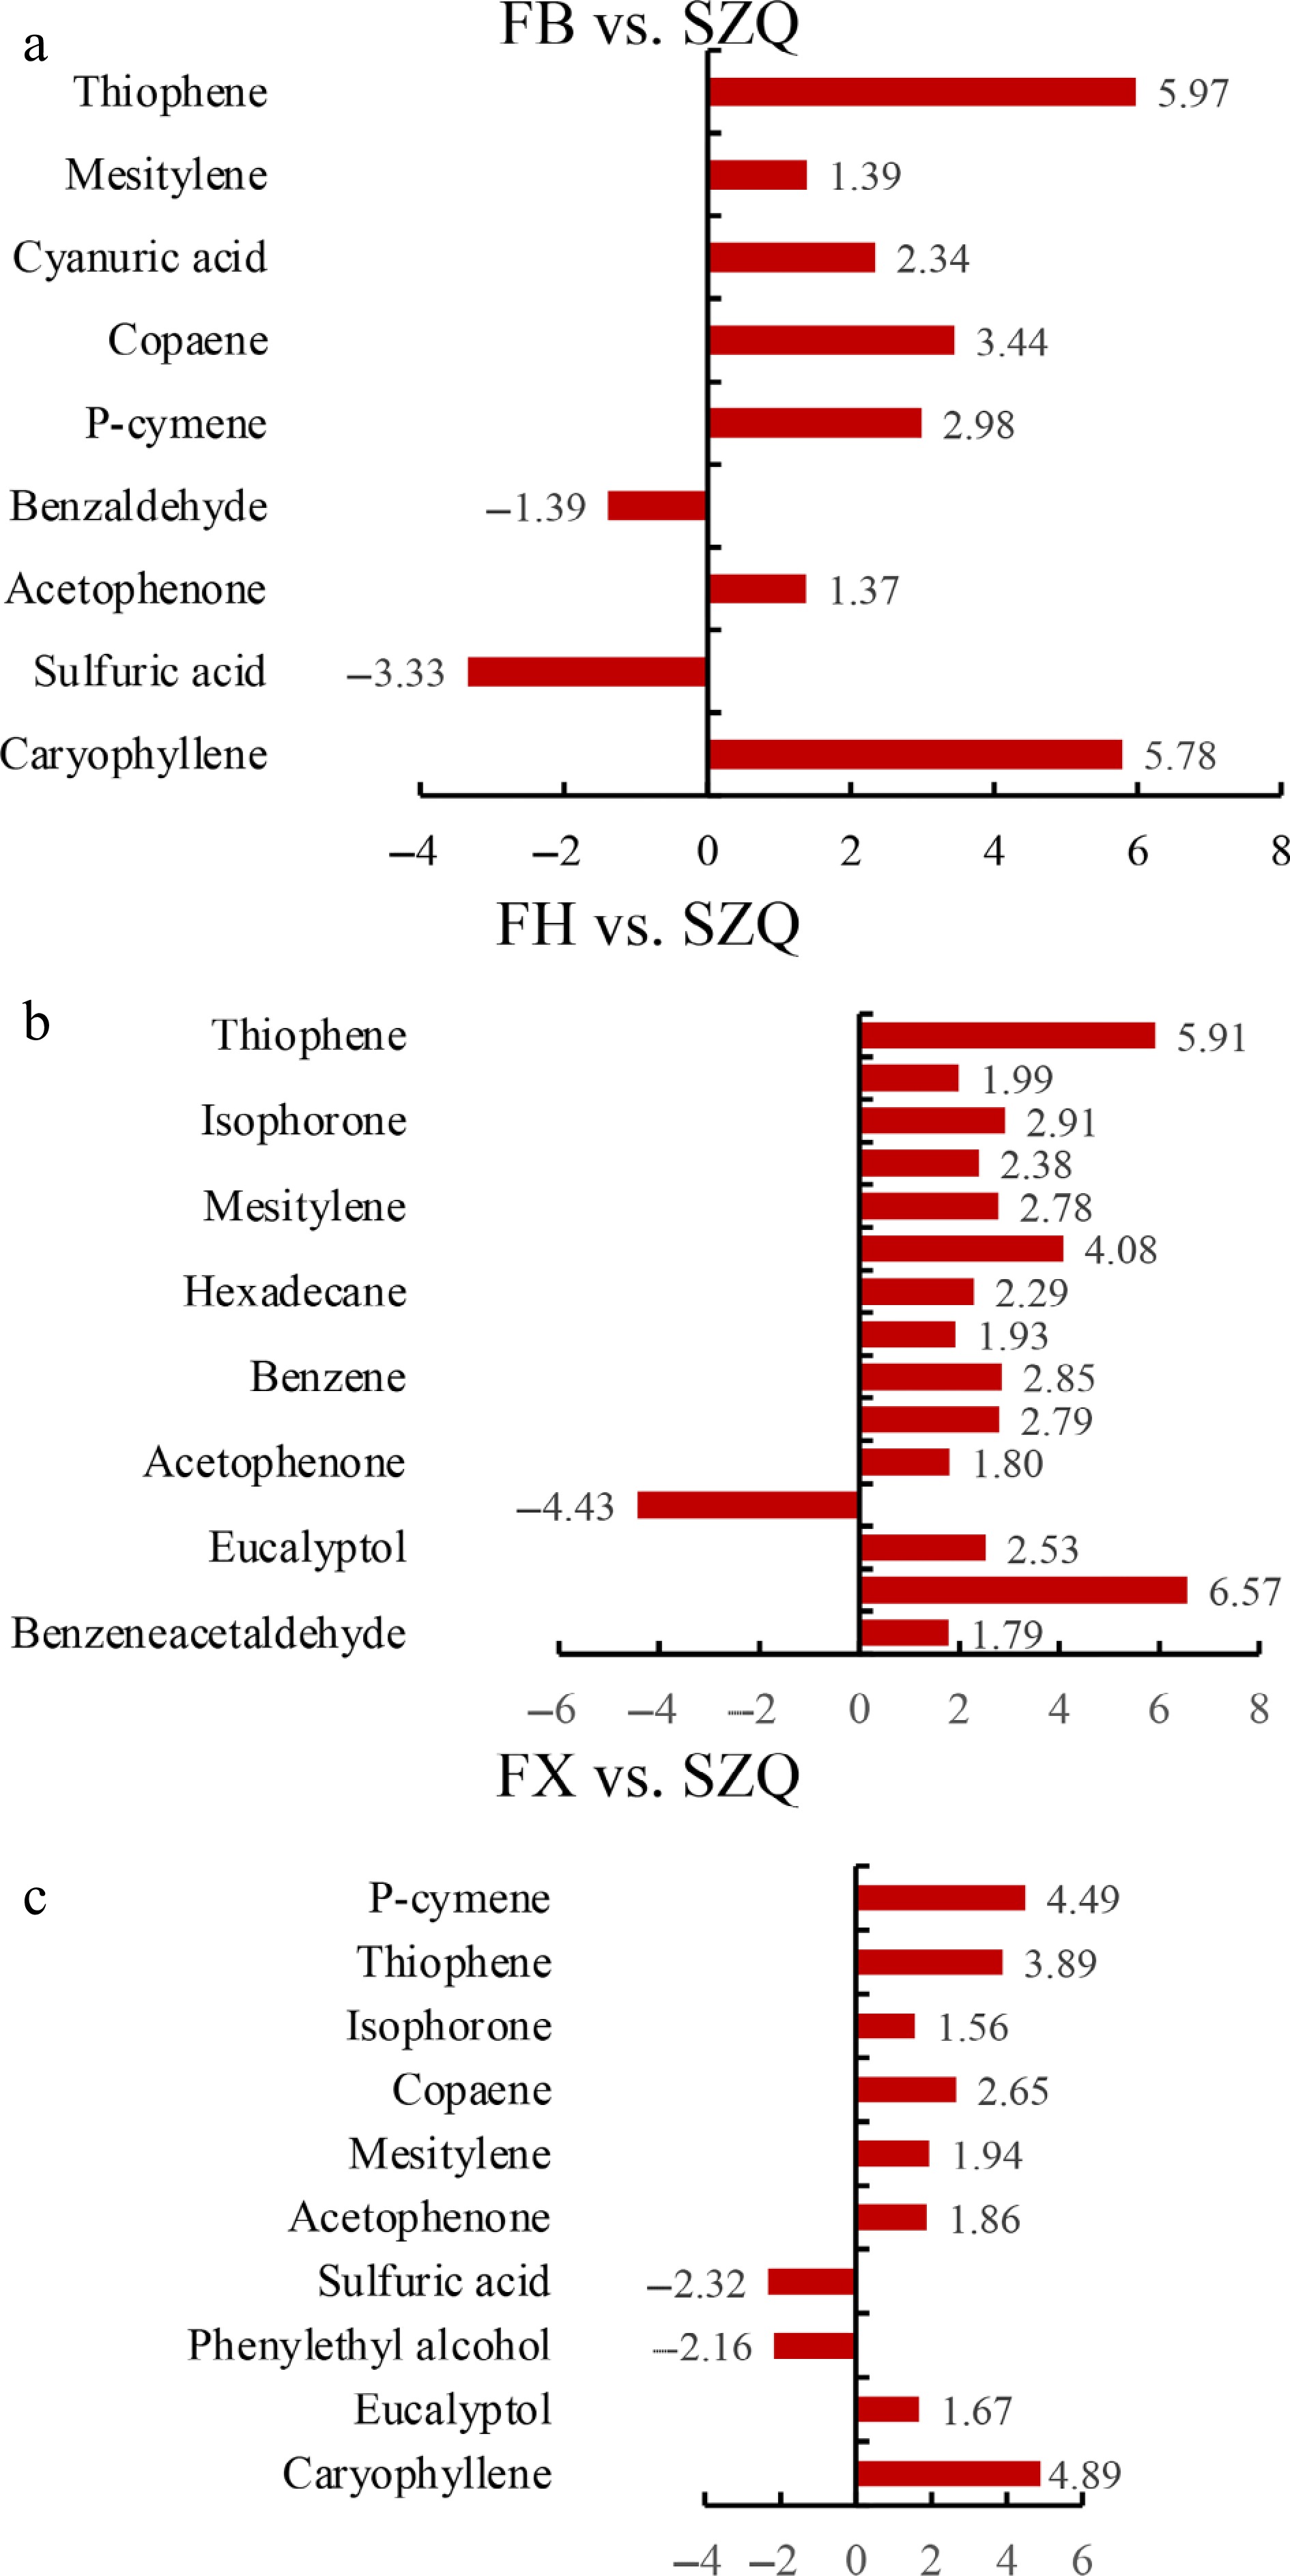
Figure 5.
Enrichment analysis of differential volatile metabolites. The horizontal bar charts display metabolites significantly enriched in (a) FB vs. SZQ, (b) FH vs. SZQ, and (c) FX vs. SZQ, with bar length representing the log 2 fold change (Log 2FC) value.
-
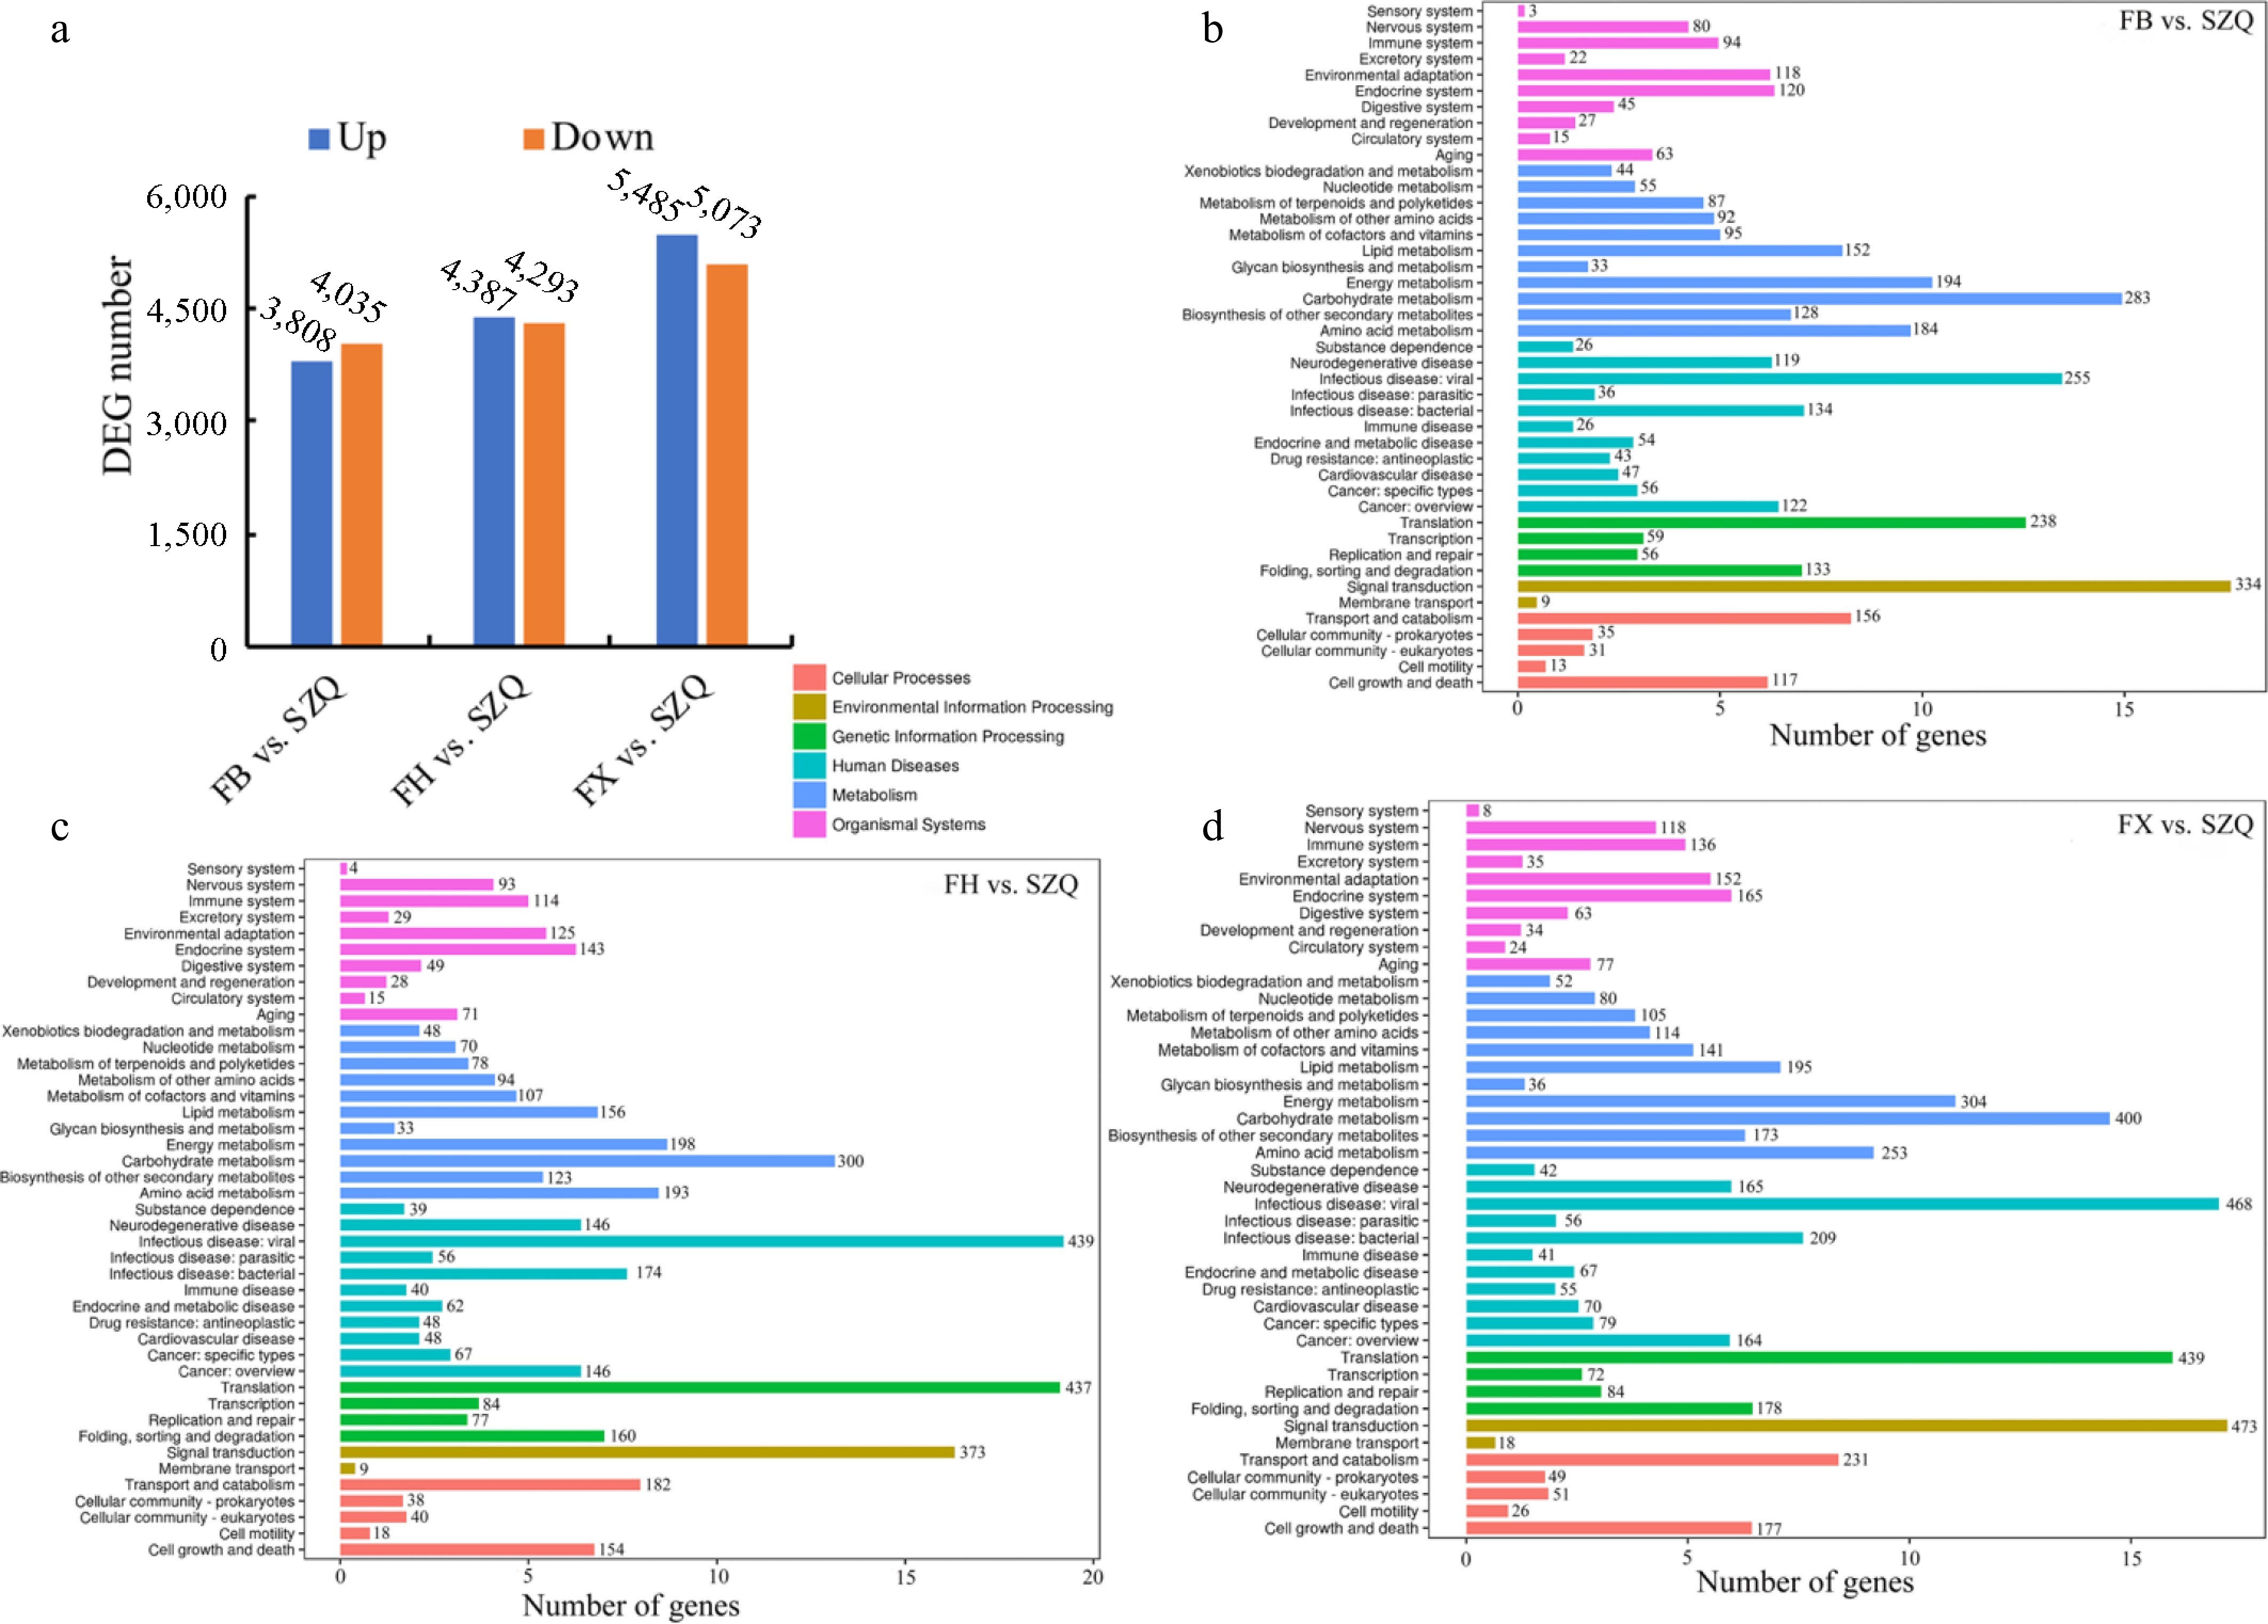
Figure 6.
(a) The number of up-regulated (blue), and down-regulated (orange) DEGs (adjusted p < 0.05 and |log 2FC| > 1) for the three indicated comparisons. (b) KEGG enrichment analysis of DEGs in FB vs. SZQ. (c) KEGG enrichment analysis of DEGs in FH vs. SZQ. (d) KEGG enrichment analysis of DEGs in FX vs. SZQ. The X-axis of B, C, and D represent the number of DEGs.
-
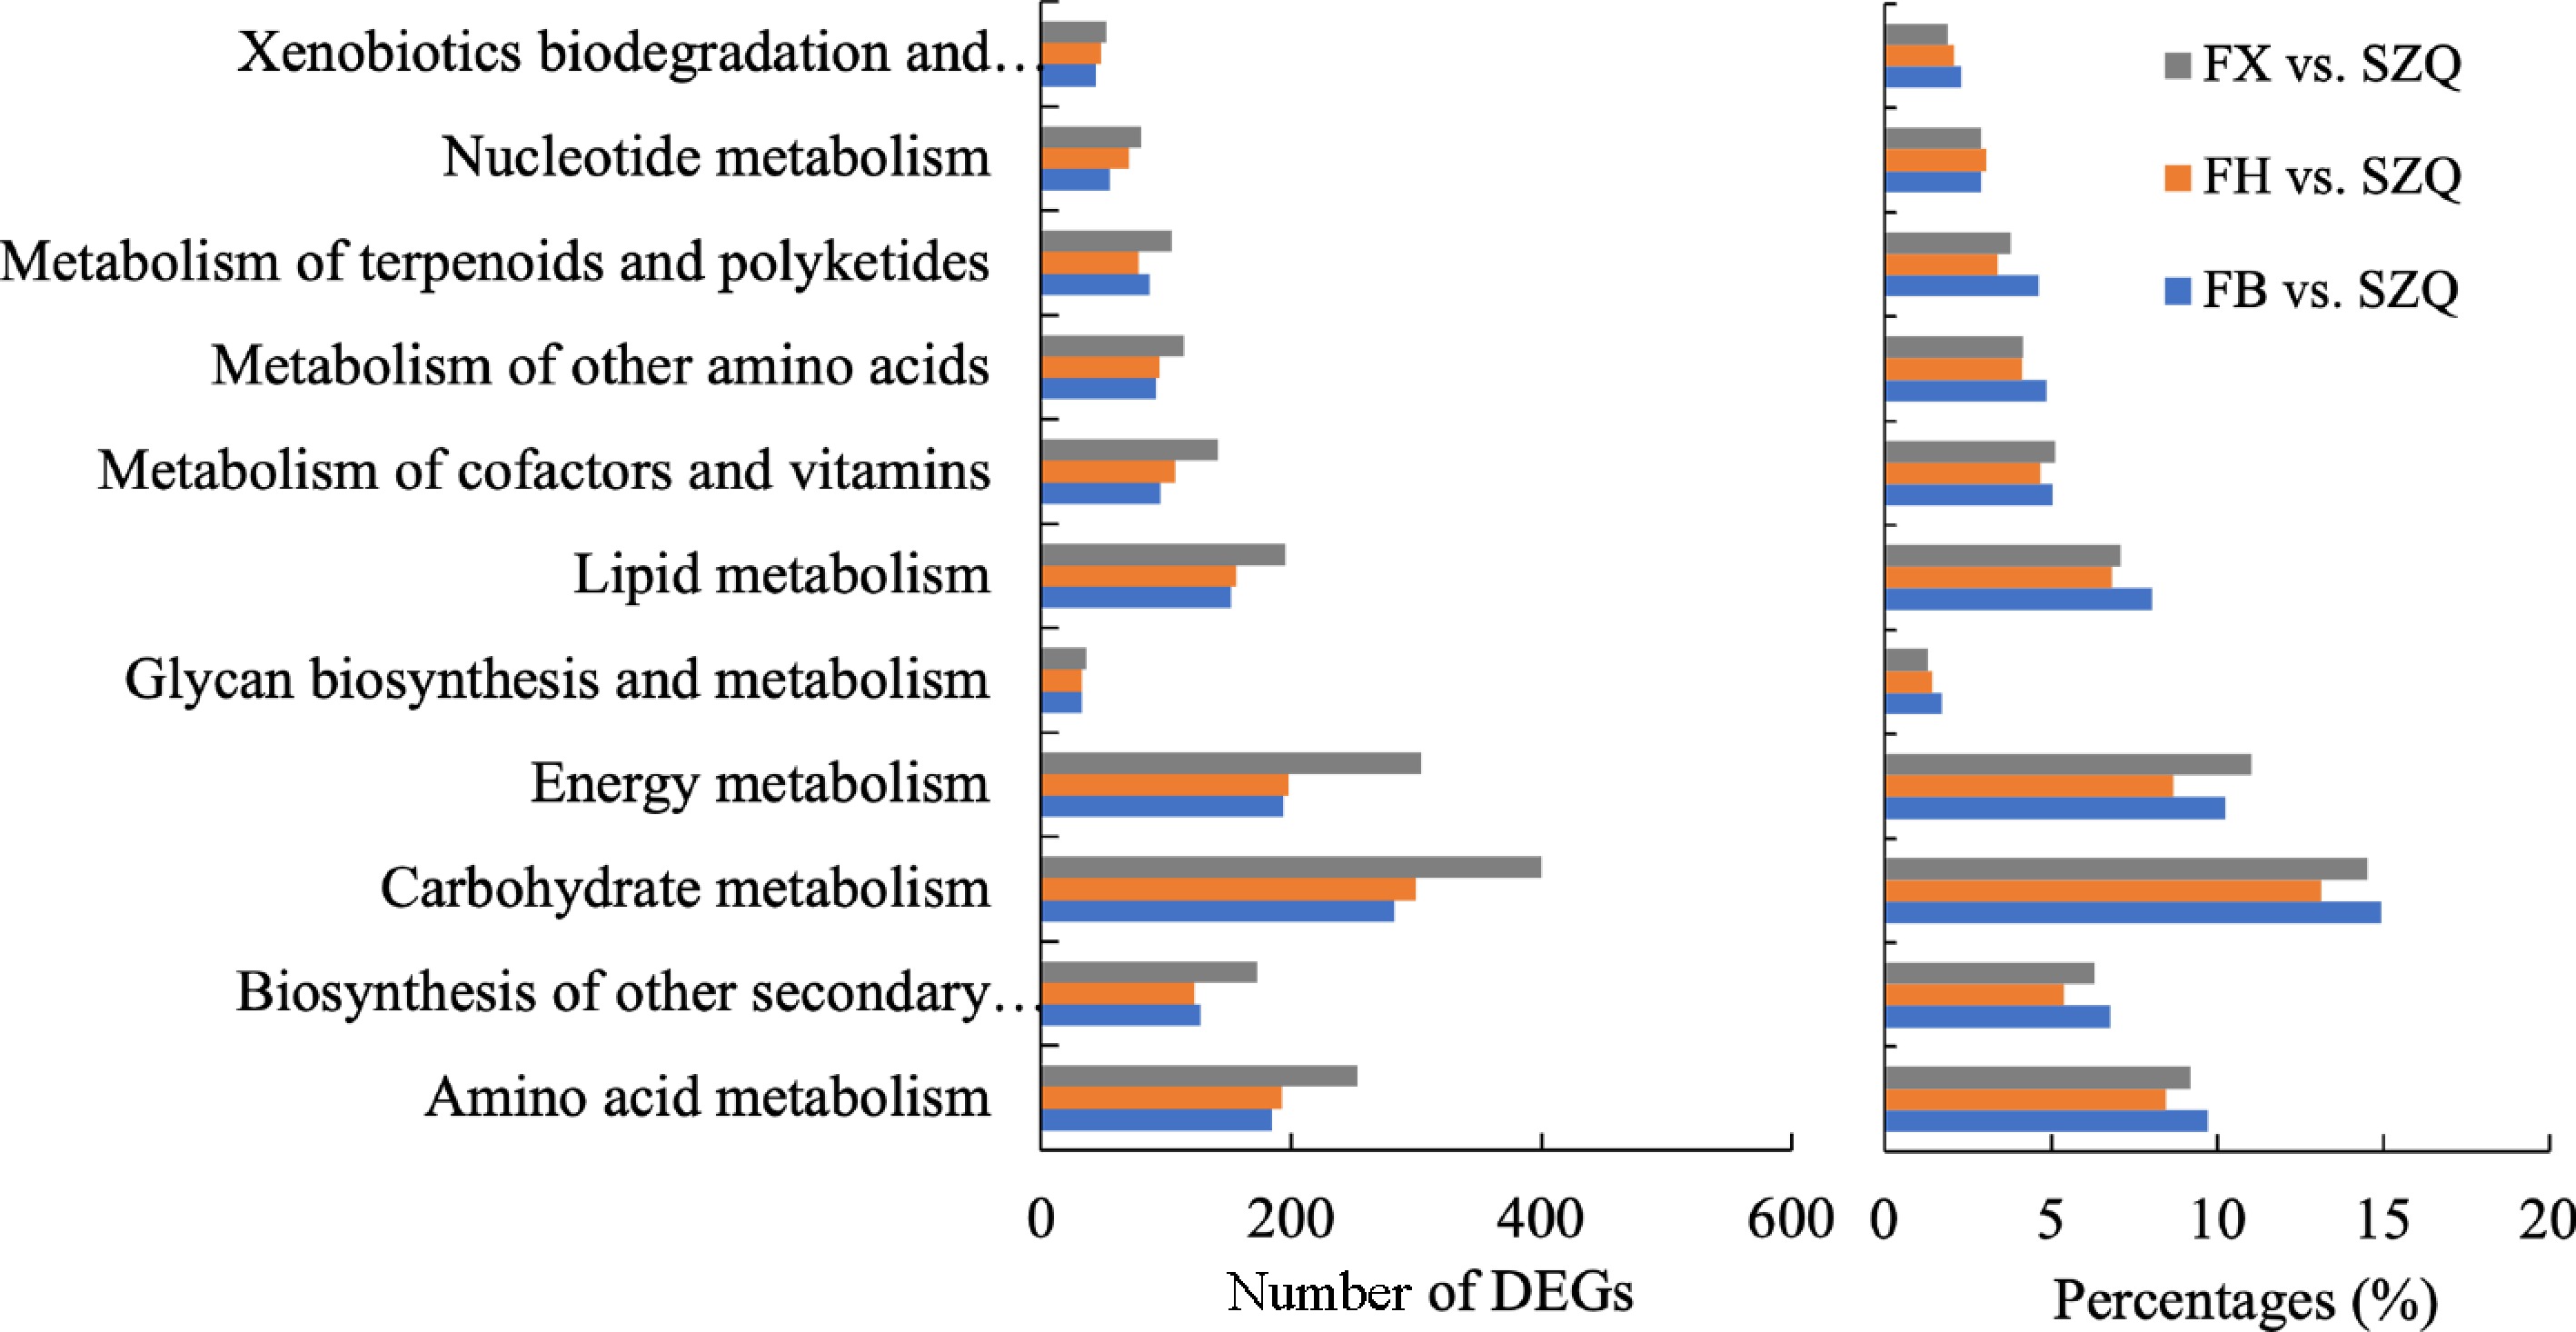
Figure 7.
The number of DEGs enriched in major KEGG metabolism pathways for the comparisons of FB vs. SZQ, FH vs. SZQ, and FX vs. SZQ
-
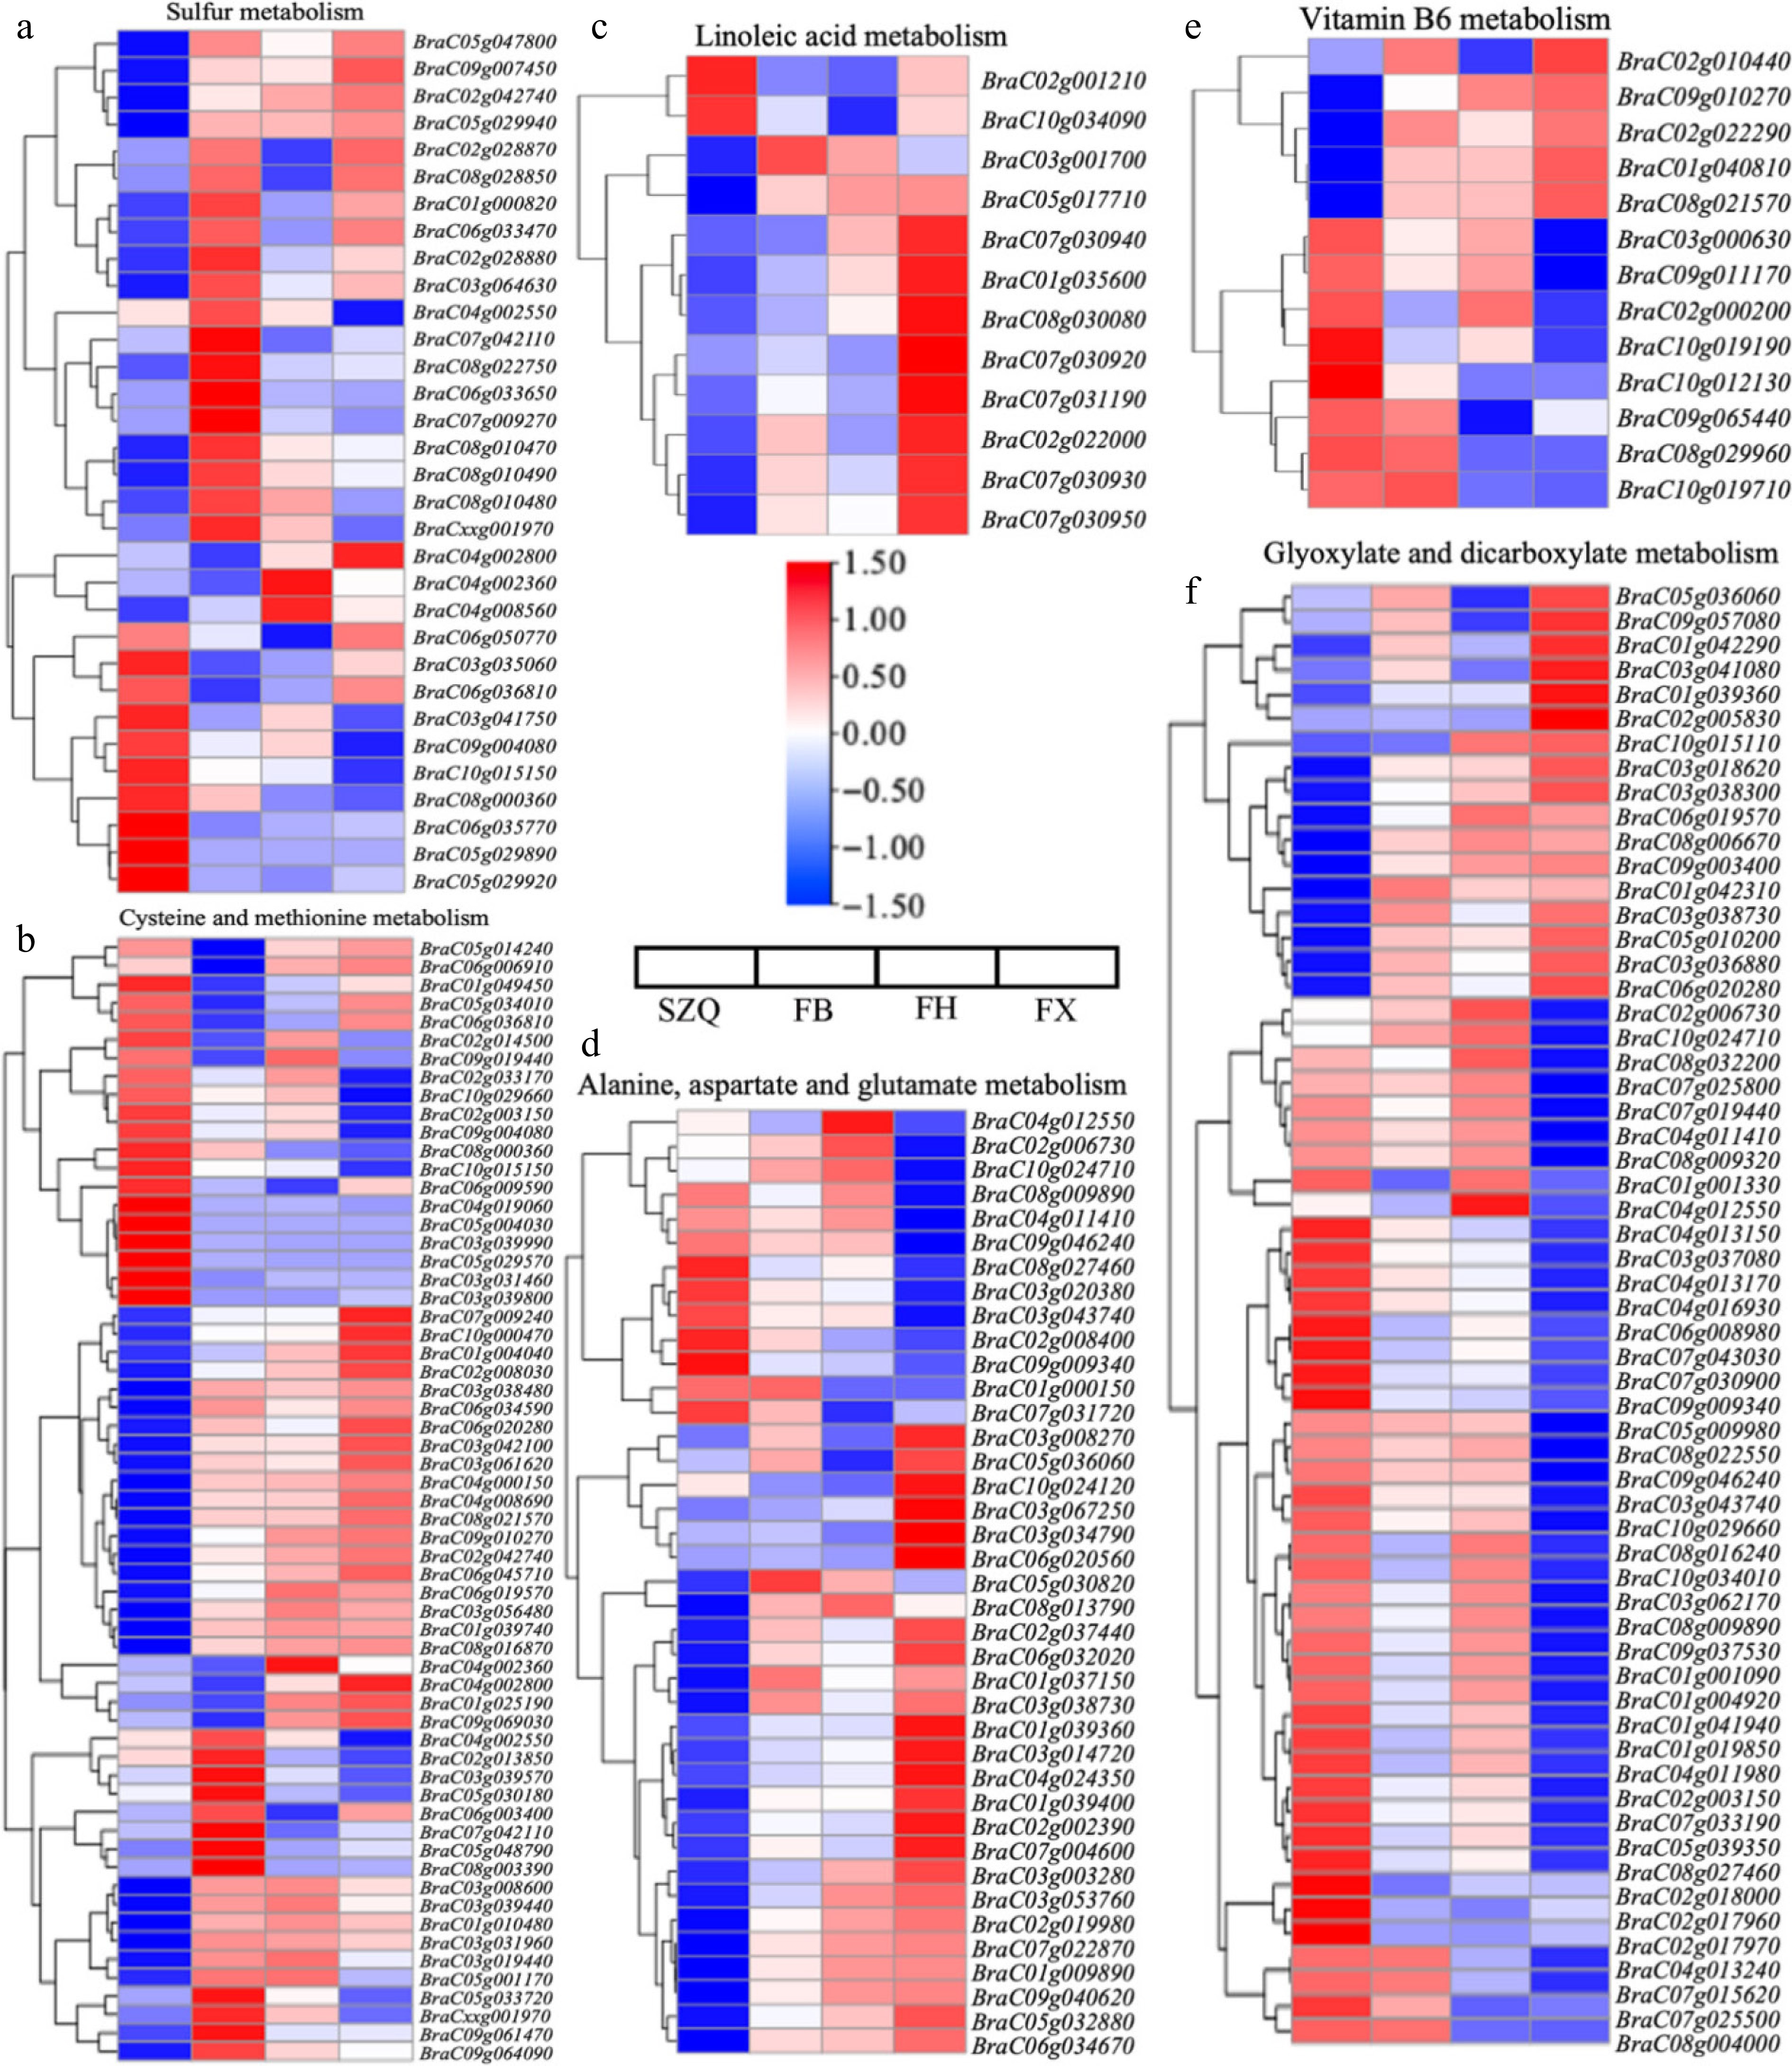
Figure 8.
Expression patterns of DEGs enriched in key KEGG metabolic pathways. (a) Sulfur metabolism (ko00920), (b) cysteine and methionine metabolism (ko00270), (c) linoleic acid metabolism (ko00591), (d) alanine, aspartate, and glutamate metabolism (ko00250), (e) vitamin B6 metabolism (ko00750), and (f) glyoxylate and dicarboxylate metabolism (ko00630). Heatmaps display the gene expression patterns (log 2 fold change) of significantly enriched DEGs in each pathway for the three comparisons (FB, FH, and FX vs. SZQ). Rows represent individual gene, columns represent sample groups. The color scale indicates up-regulated (red), and down-regulated (blue) genes relative to the control (SZQ).
-
No. Sample information Sample name Source of cultivar Sampling site 1 Brassica chinensis L. cv. Black leave XQC FB Suzhou Academy of Agricultural Sciences Suzhou Taihu Oasis 2 Brassica chinensis L. cv. Yellow leave XQC FH Suzhou Academy of Agricultural Sciences Suzhou Taihu Oasis 3 Brassica chinensis L. cv. Xiuhuajin (XHJ) FX Suzhou Academy of Agricultural Sciences Suzhou Taihu Oasis 4 Brassica chinensis L. cv. Suzhouqing SZQ Suzhou Academy of Agricultural Sciences Suzhou Taihu Oasis Table 1.
Information on the plant cultivars used in this study.
-
Group Type PRE ORT N R2X (cum) R2Y (cum) Q2 (cum) R2 Q2 FB vs. SZQ PCA 3 0 12 0.637 − − − − PLS 3 0 12 0.633 1 0.986 − − O-PLS 1 2 12 0.633 1 0.969 0.973 −0.127 FH vs. SZQ PCA 3 0 12 0.732 − − − − PLS 3 0 12 0.712 1 0.991 − − O-PLS 1 2 12 0.712 1 0.978 0.978 −0.186 FX vs. SZQ PCA 3 0 12 0.73 − − − − PLS 3 0 12 0.645 1 0.98 − − O-PLS 1 2 12 0.645 1 0.974 0.978 −0.217 Table 2.
Model parameters of multivariate statistical analysis for FB, FH, and FX vs. SZQ.
-
Comparisons KEGG ID Term q-value Enrichment FB vs. SZQ ko00920 Sulfur metabolism 1.09E-04 2.25 ko00270 Cysteine and methionine metabolism 5.02E-03 1.58 FX vs. SZQ ko00591 Linoleic acid metabolism 6.03E-03 2.32 ko00250 Alanine, aspartate and glutamate metabolism 3.47E-02 1.49 ko00750 Vitamin B6 metabolism 3.21E-02 1.99 ko00630 Glyoxylate and dicarboxylate metabolism 1.30E-03 1.55 Table 3.
Uniquely and significantly enriched KEGG pathways in each comparison.
-
Group ID annotation of metabolites Upregulated metabolites Downregulated metabolites ID of KEGG pathways DEGs FB vs. SZQ ath00230 Purine metabolism – Sulfate ko00230 BraC01g023360; BraC03g041750; BraC05g029890; BraC05g029920; BraC05g029940; BraC06g015080; BraC06g050770; BraC08g028850; ath00261 Monobactam biosynthesis – Sulfate ko00261 BraC01g023360; BraC03g041750; BraC05g029890; BraC05g029920; BraC05g029940; BraC06g015080; BraC06g050770; BraC08g028850 ath00270 Cysteine and methionine metabolism – Sulfate ko00270 – ath00909 Sesquiterpenoid and triterpenoid biosynthesis β-Caryophyllene – ko00909 BraC03g066260; BraC03g066350; BraC03g066530; BraC06g037780; BraC06g037940; BraCxxg006940 ath00920 Sulfur metabolism – Sulfate (sulfuric acid) ko00920 – ath02010 ABC transporters – – ko02010 – FH vs. SZQ ath00360 Phenylalanine metabolism Phenylacetaldehyde Phenylethyl alcohol ko00360 BraC01g022890; BraC02g029200; BraC03g022690; BraC03g067150; BraC03g067240; BraC04g032090; BraC07g010000; BraC08g010680; BraC08g010700 ath00902 Monoterpenoid biosynthesis 1,8-Cineole – ko00902 – ath00909 Sesquiterpenoid and triterpenoid biosynthesis β-Caryophyllene – ko00909 BraC03g066260; BraC03g066350; BraC03g066530; BraC06g037780; BraC06g037940; BraCxxg006940; FX vs. SZQ ath00230 Purine metabolism – Sulfate ko00230 BraC01g023360; BraC03g041750; BraC05g029890; BraC05g029920; BraC05g029940; BraC06g015080; BraC06g050770; BraC08g028850; ath00261 Monobactam biosynthesis – Sulfate ko00261 BraC01g023360; BraC03g041750; BraC05g029890; BraC05g029920; BraC05g029940; BraC06g015080; BraC06g050770; BraC08g028850 ath00270 Cysteine and methionine metabolism – Sulfate ko00270 – ath00360 Phenylalanine metabolism – Phenylethyl alcohol ko00360 BraC01g022890; BraC02g029200; BraC03g022690; BraC03g067150; BraC03g067240; BraC04g032090; BraC07g010000; BraC08g010680; BraC08g010700 ath00902 Monoterpenoid biosynthesis 1,8-Cineole – ko00902 – ath00909 Sesquiterpenoid and triterpenoid biosynthesis β-Caryophyllene – ko00909 BraC03g066260; BraC03g066350; BraC03g066530; BraC06g037780; BraC06g037940; BraCxxg006940; ath00920 Sulfur metabolism – Sulfate (extracellular) ko00920 BraC01g023360; BraC03g041750; BraC05g029890; BraC05g029920; BraC05g029940; BraC06g015080; BraC06g050770; BraC08g028850 ath02010 ABC transporters – Sulfate ko02010 – Table 4.
The DEGs involved in differential metabolites synthesis among the three comparisons.
Figures
(8)
Tables
(4)