-
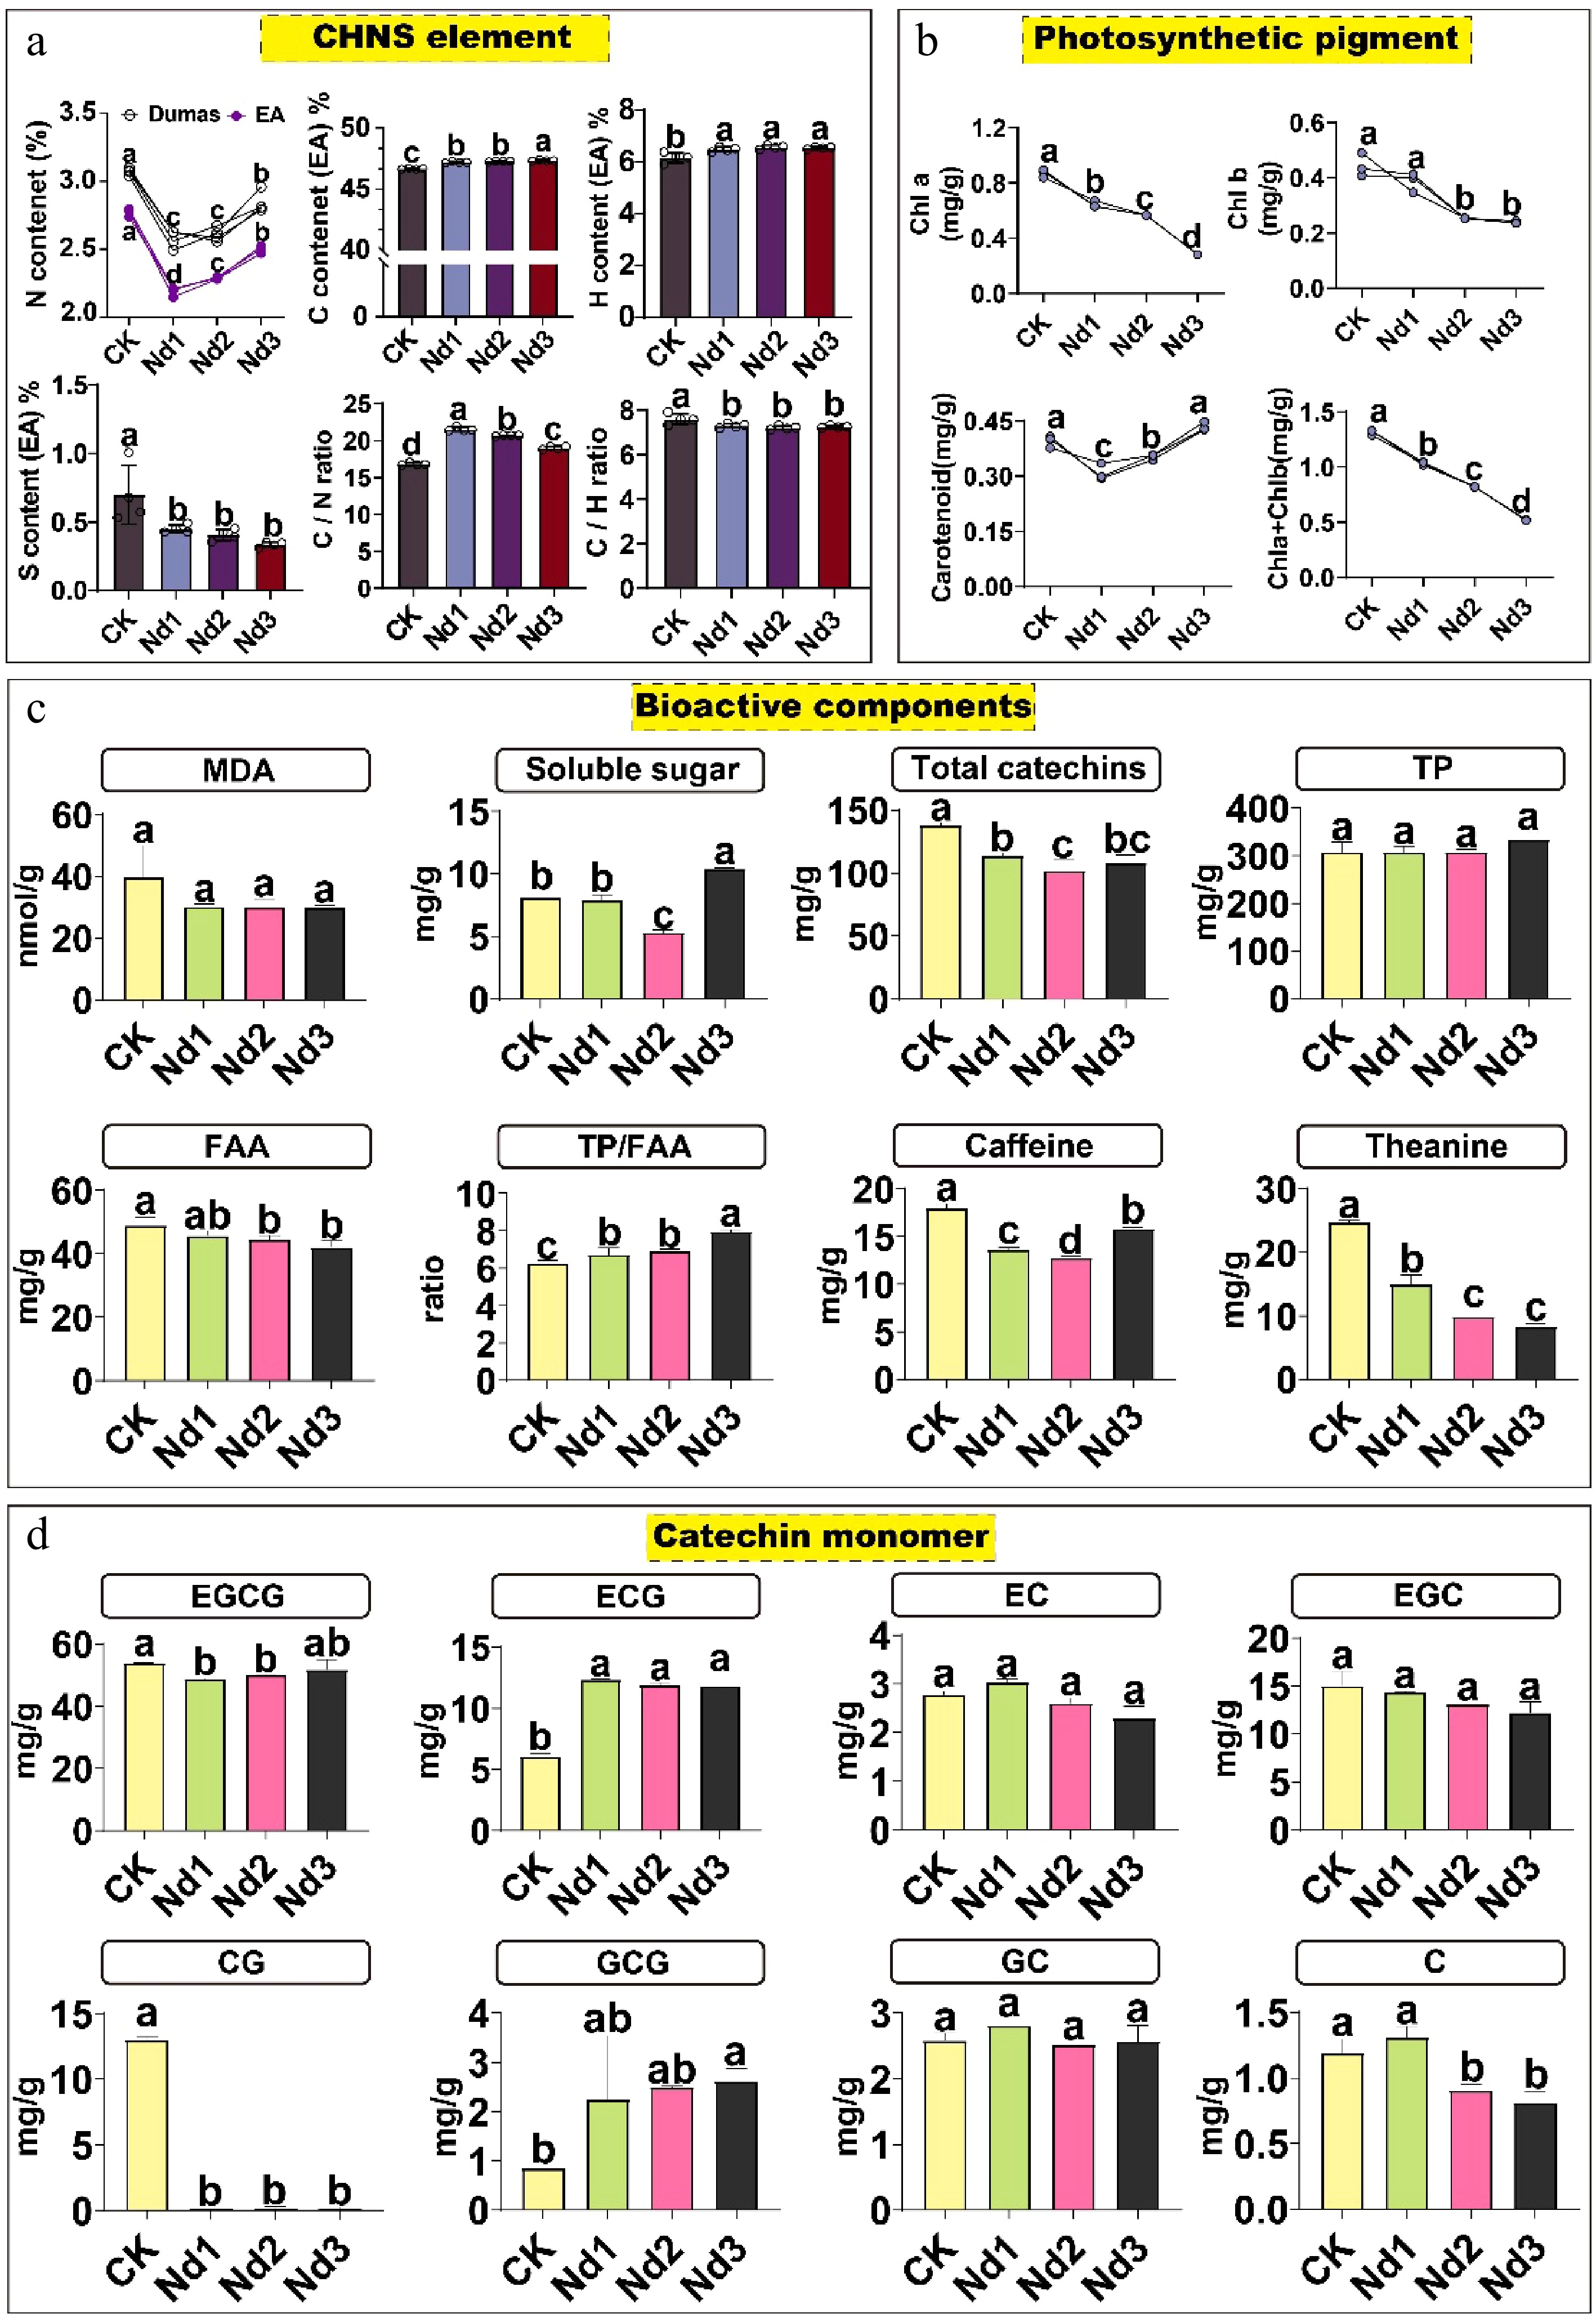
Figure 1.
Physiological and biochemical changes in tea new shoots during nitrogen deficiency. Plants were subjected to deficiency treatments for 0 (CK, control), 7 (Nd1), 15 (Nd2), and 30 (Nd3) days. (a) Analysis of carbon, hydrogen, nitrogen, and sulfur elements. (b) Analysis of photosynthetic pigments. (c) Analysis of bioactive components. (d) Analysis of catechin monomers. The data represent the mean ± SD (n = 4) for soluble sugar content (n = 3). Different letters indicate significant differences at p < 0.05 determined by Duncan′s multiple range test. Malondialdehyde, MDA; total free amino ccid content, FAA; total polyphenol content, TP; catechin, C; epicatechin, EC; gallocatechin, GC; epigallocatechin, EGC; epicatechin gallate, ECG; gallocatechin gallate, GCG; catechin gallate, CG; epigallocatechin gallate, EGCG.
-
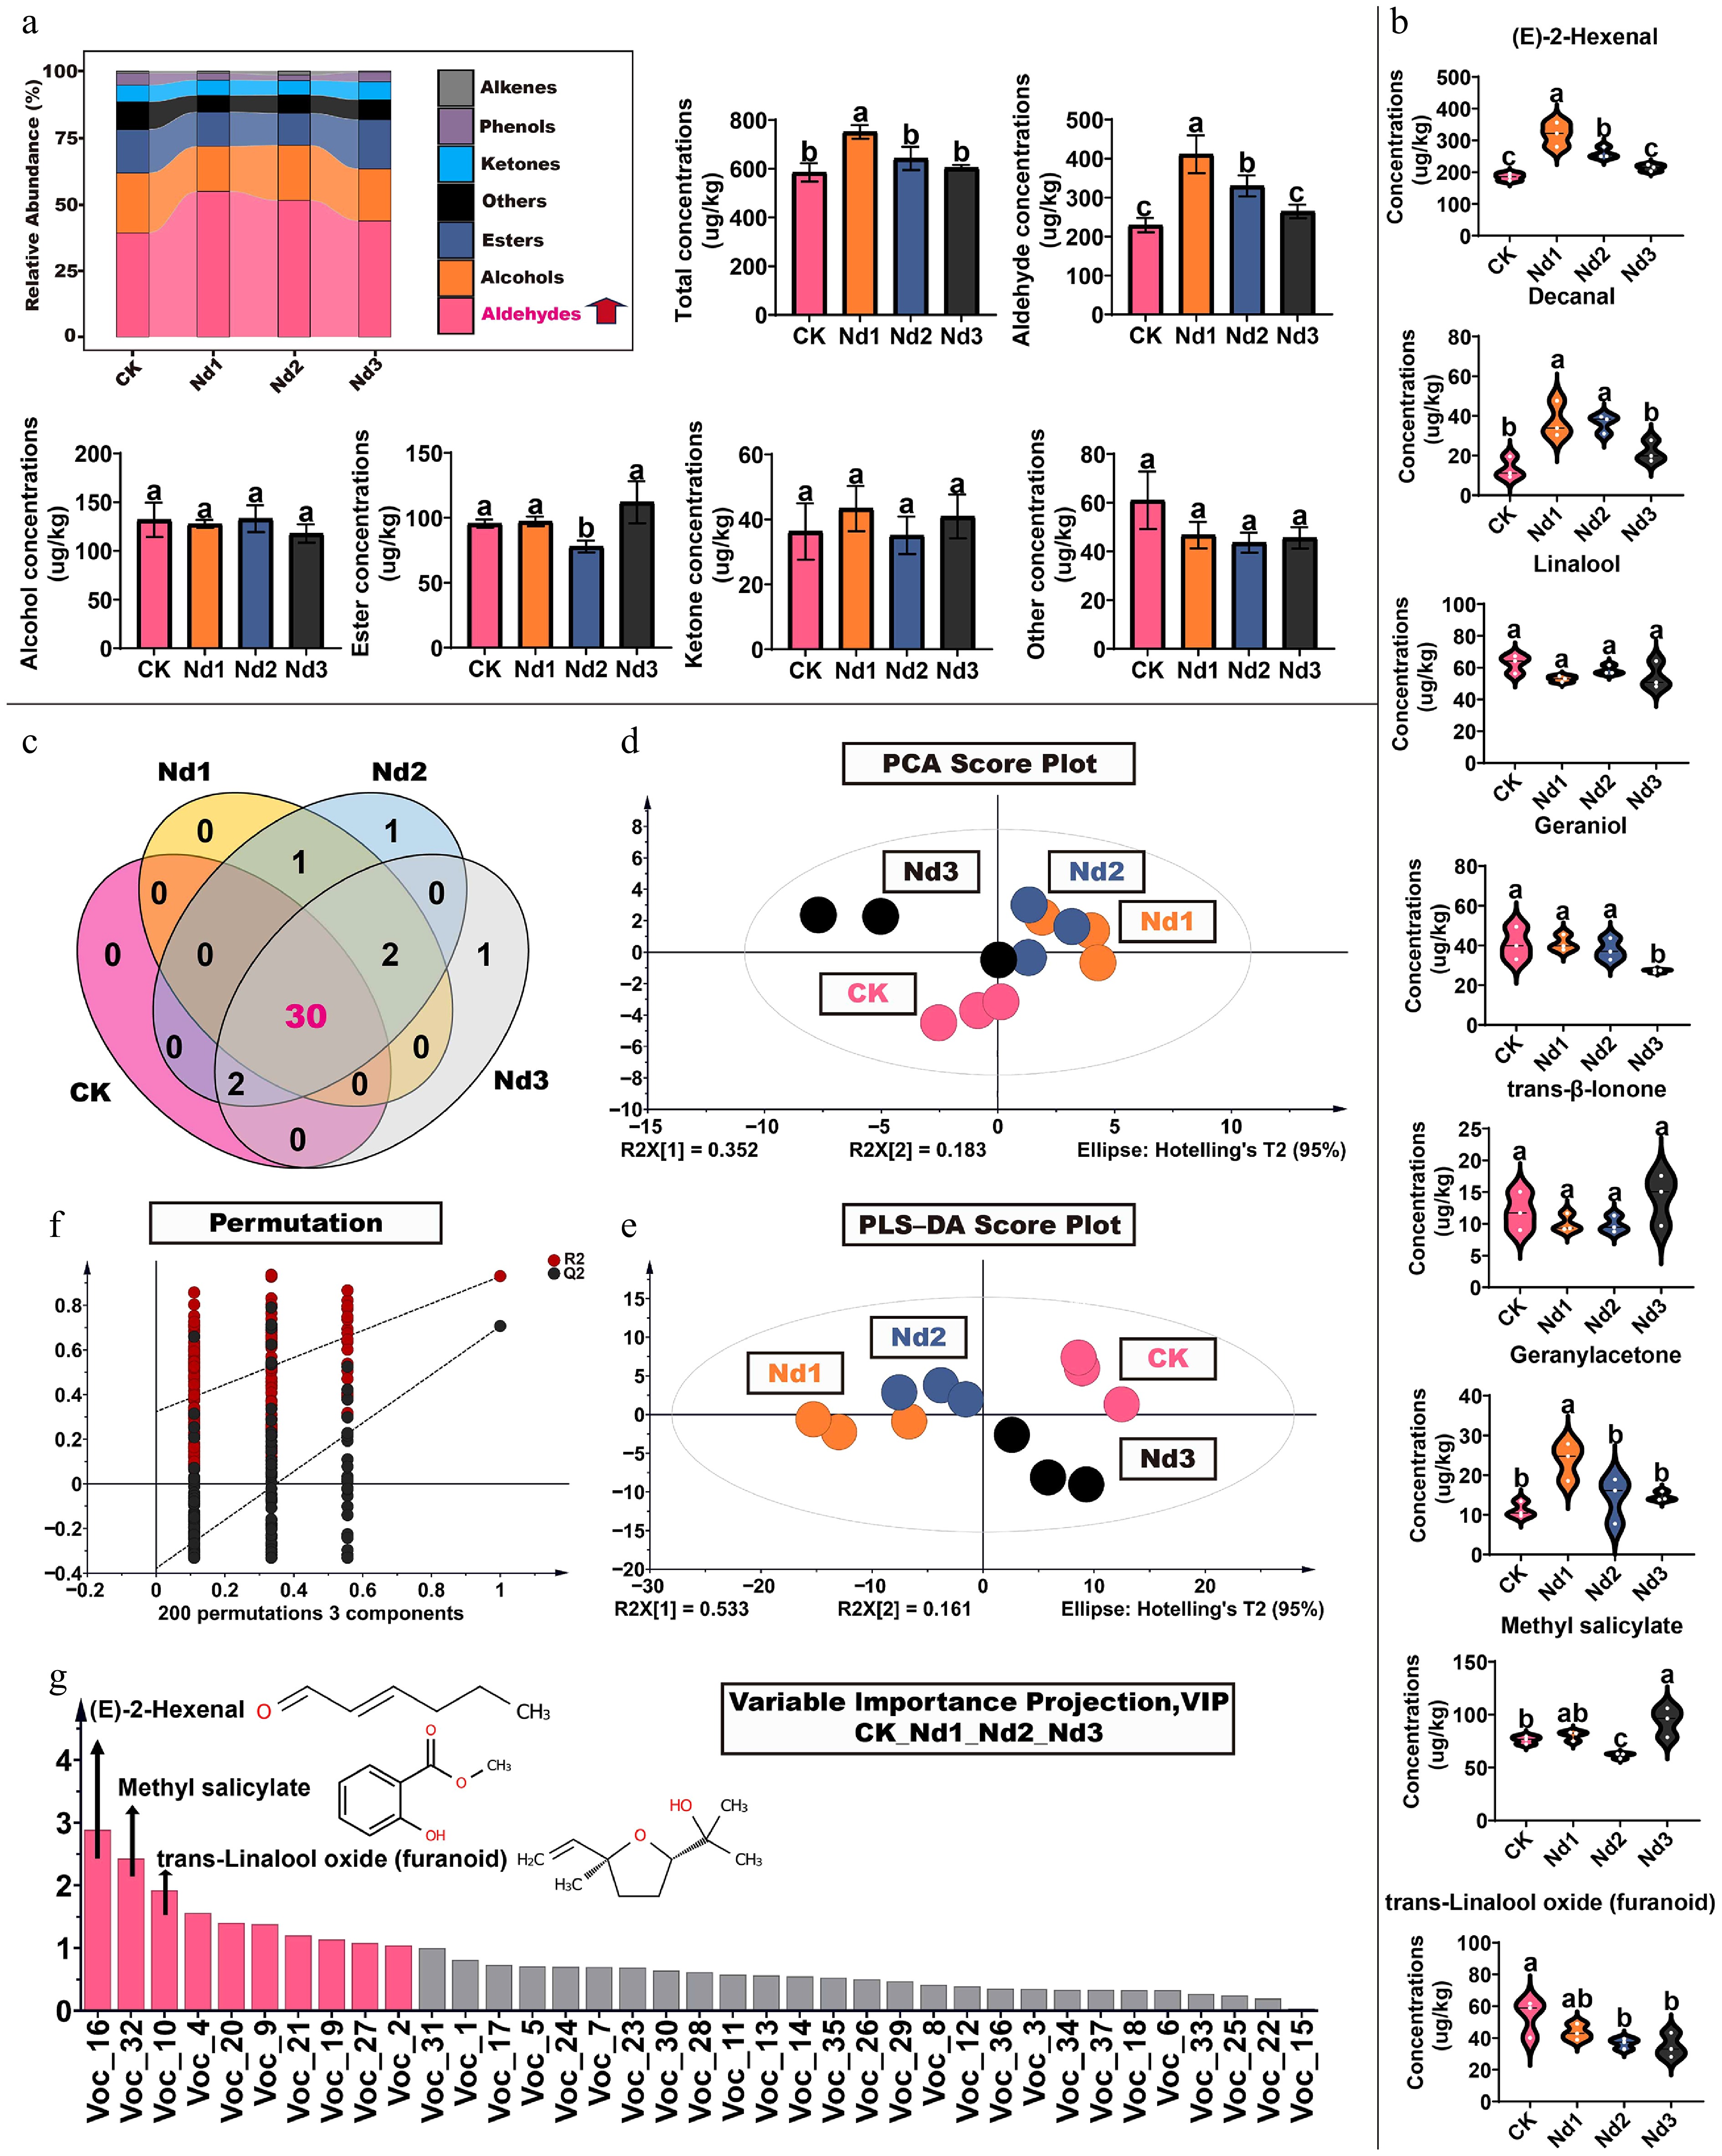
Figure 2.
Changes in volatile component levels in new shoots of tea under nitrogen deficiency treatment. (a) Proportion of volatile components: total concentration, aldehydes, alcohols, esters, ketones, and other volatile compounds concentrations. (b) High concentration volatiles. (c) Venn diagram of volatile component counts. (d) Principal component analysis; (e) 200 permutation tests. (f) Partial least squares analysis. (g) Projection of important variables. The data represent the mean ± SD (n = 3). Different letters indicate significant differences at p < 0.05 determined by Duncan's multiple range test.
-
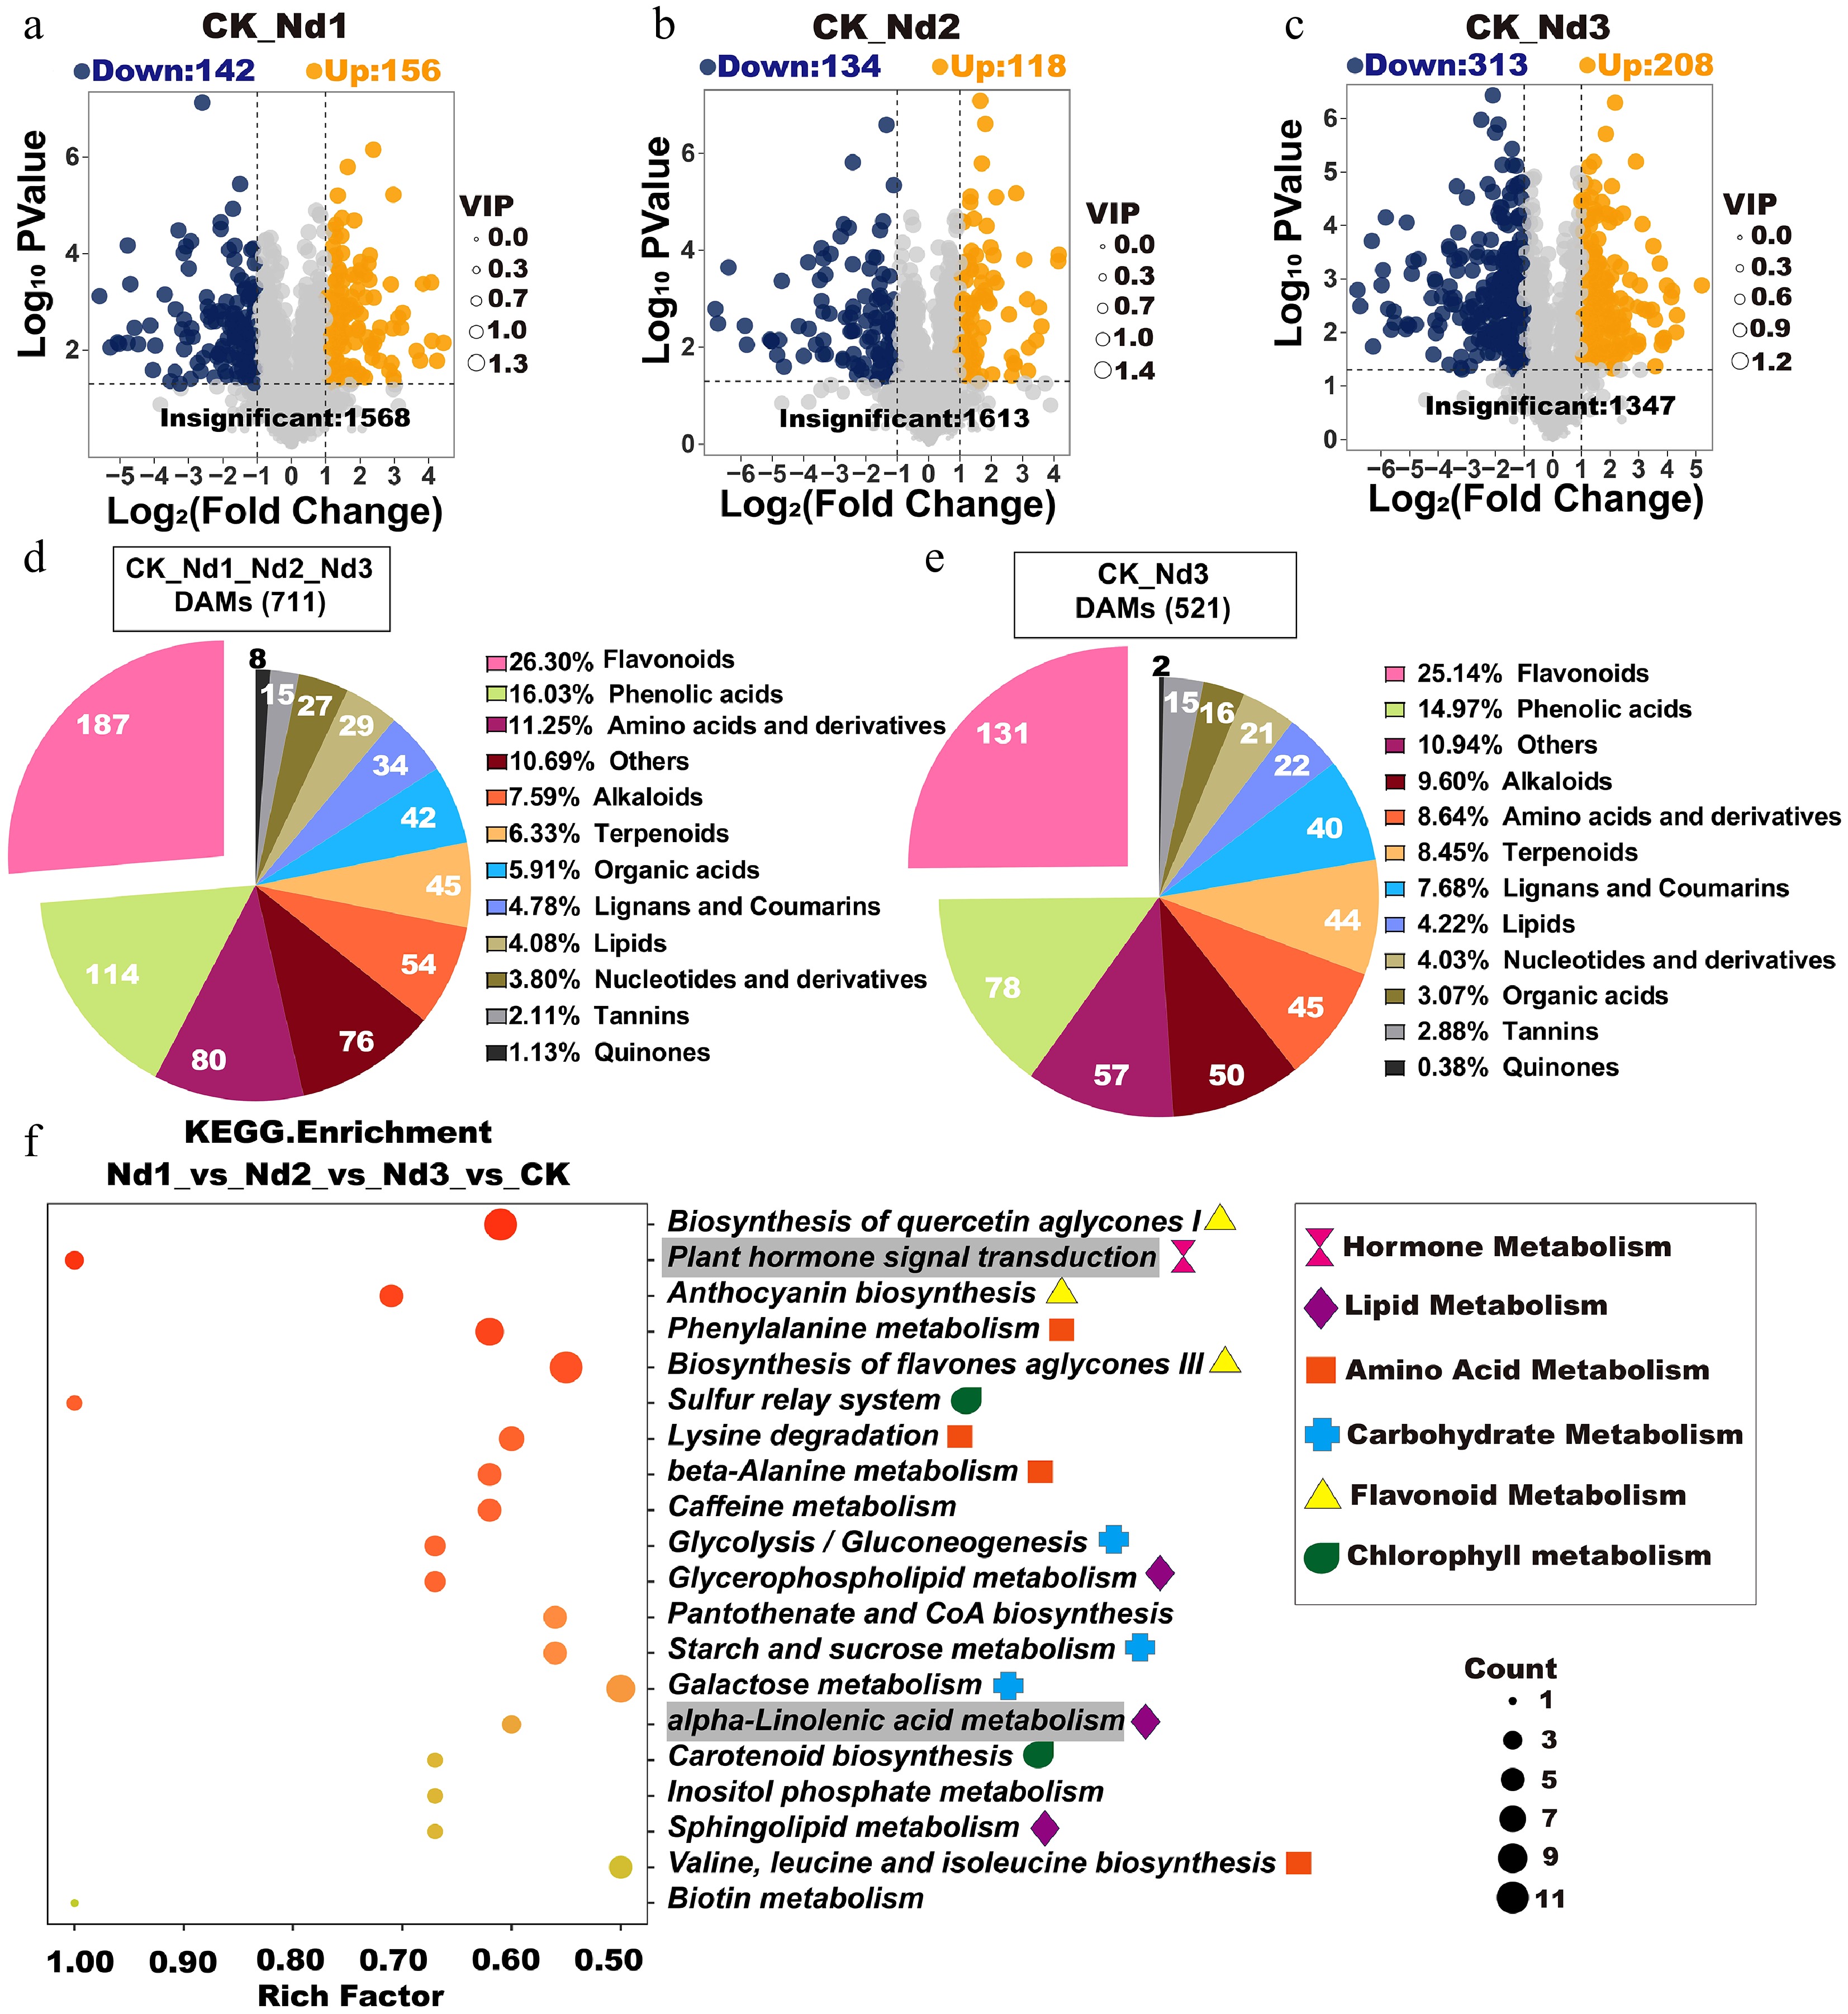
Figure 3.
Analysis of differential accumulation metabolites (DAMs) in new shoots under the nitrogen deficiency treatment. (a–c) Volcano plots of DAMs. Each point represents a metabolite: Blue = downregulated), orange = upregulated, and gray = nonsignificant. The x-axis indicates the log2FC in relative abundance, the y-axis shows log10 p-values, and the point size corresponds to VIP values. Higher y-axis values denote stronger statistical confidence. (d) The categorical distribution of shared DAMs across four treatment groups. Pie chart sectors represent distinct metabolite classes, with numeric labels indicating the absolute counts per category and percentages, reflecting their proportion relative to total DAMs. (e) Types, quantities, and proportions of DAMs shared between the CK and Nd3 groups. (f) KEGG enrichment analysis of the CK, Nd1, Nd2, and Nd3 comparison groups. Gray-shaded pathways indicate significant enrichment in all pairwise comparisons (validated in Supplementary Fig. S3).
-
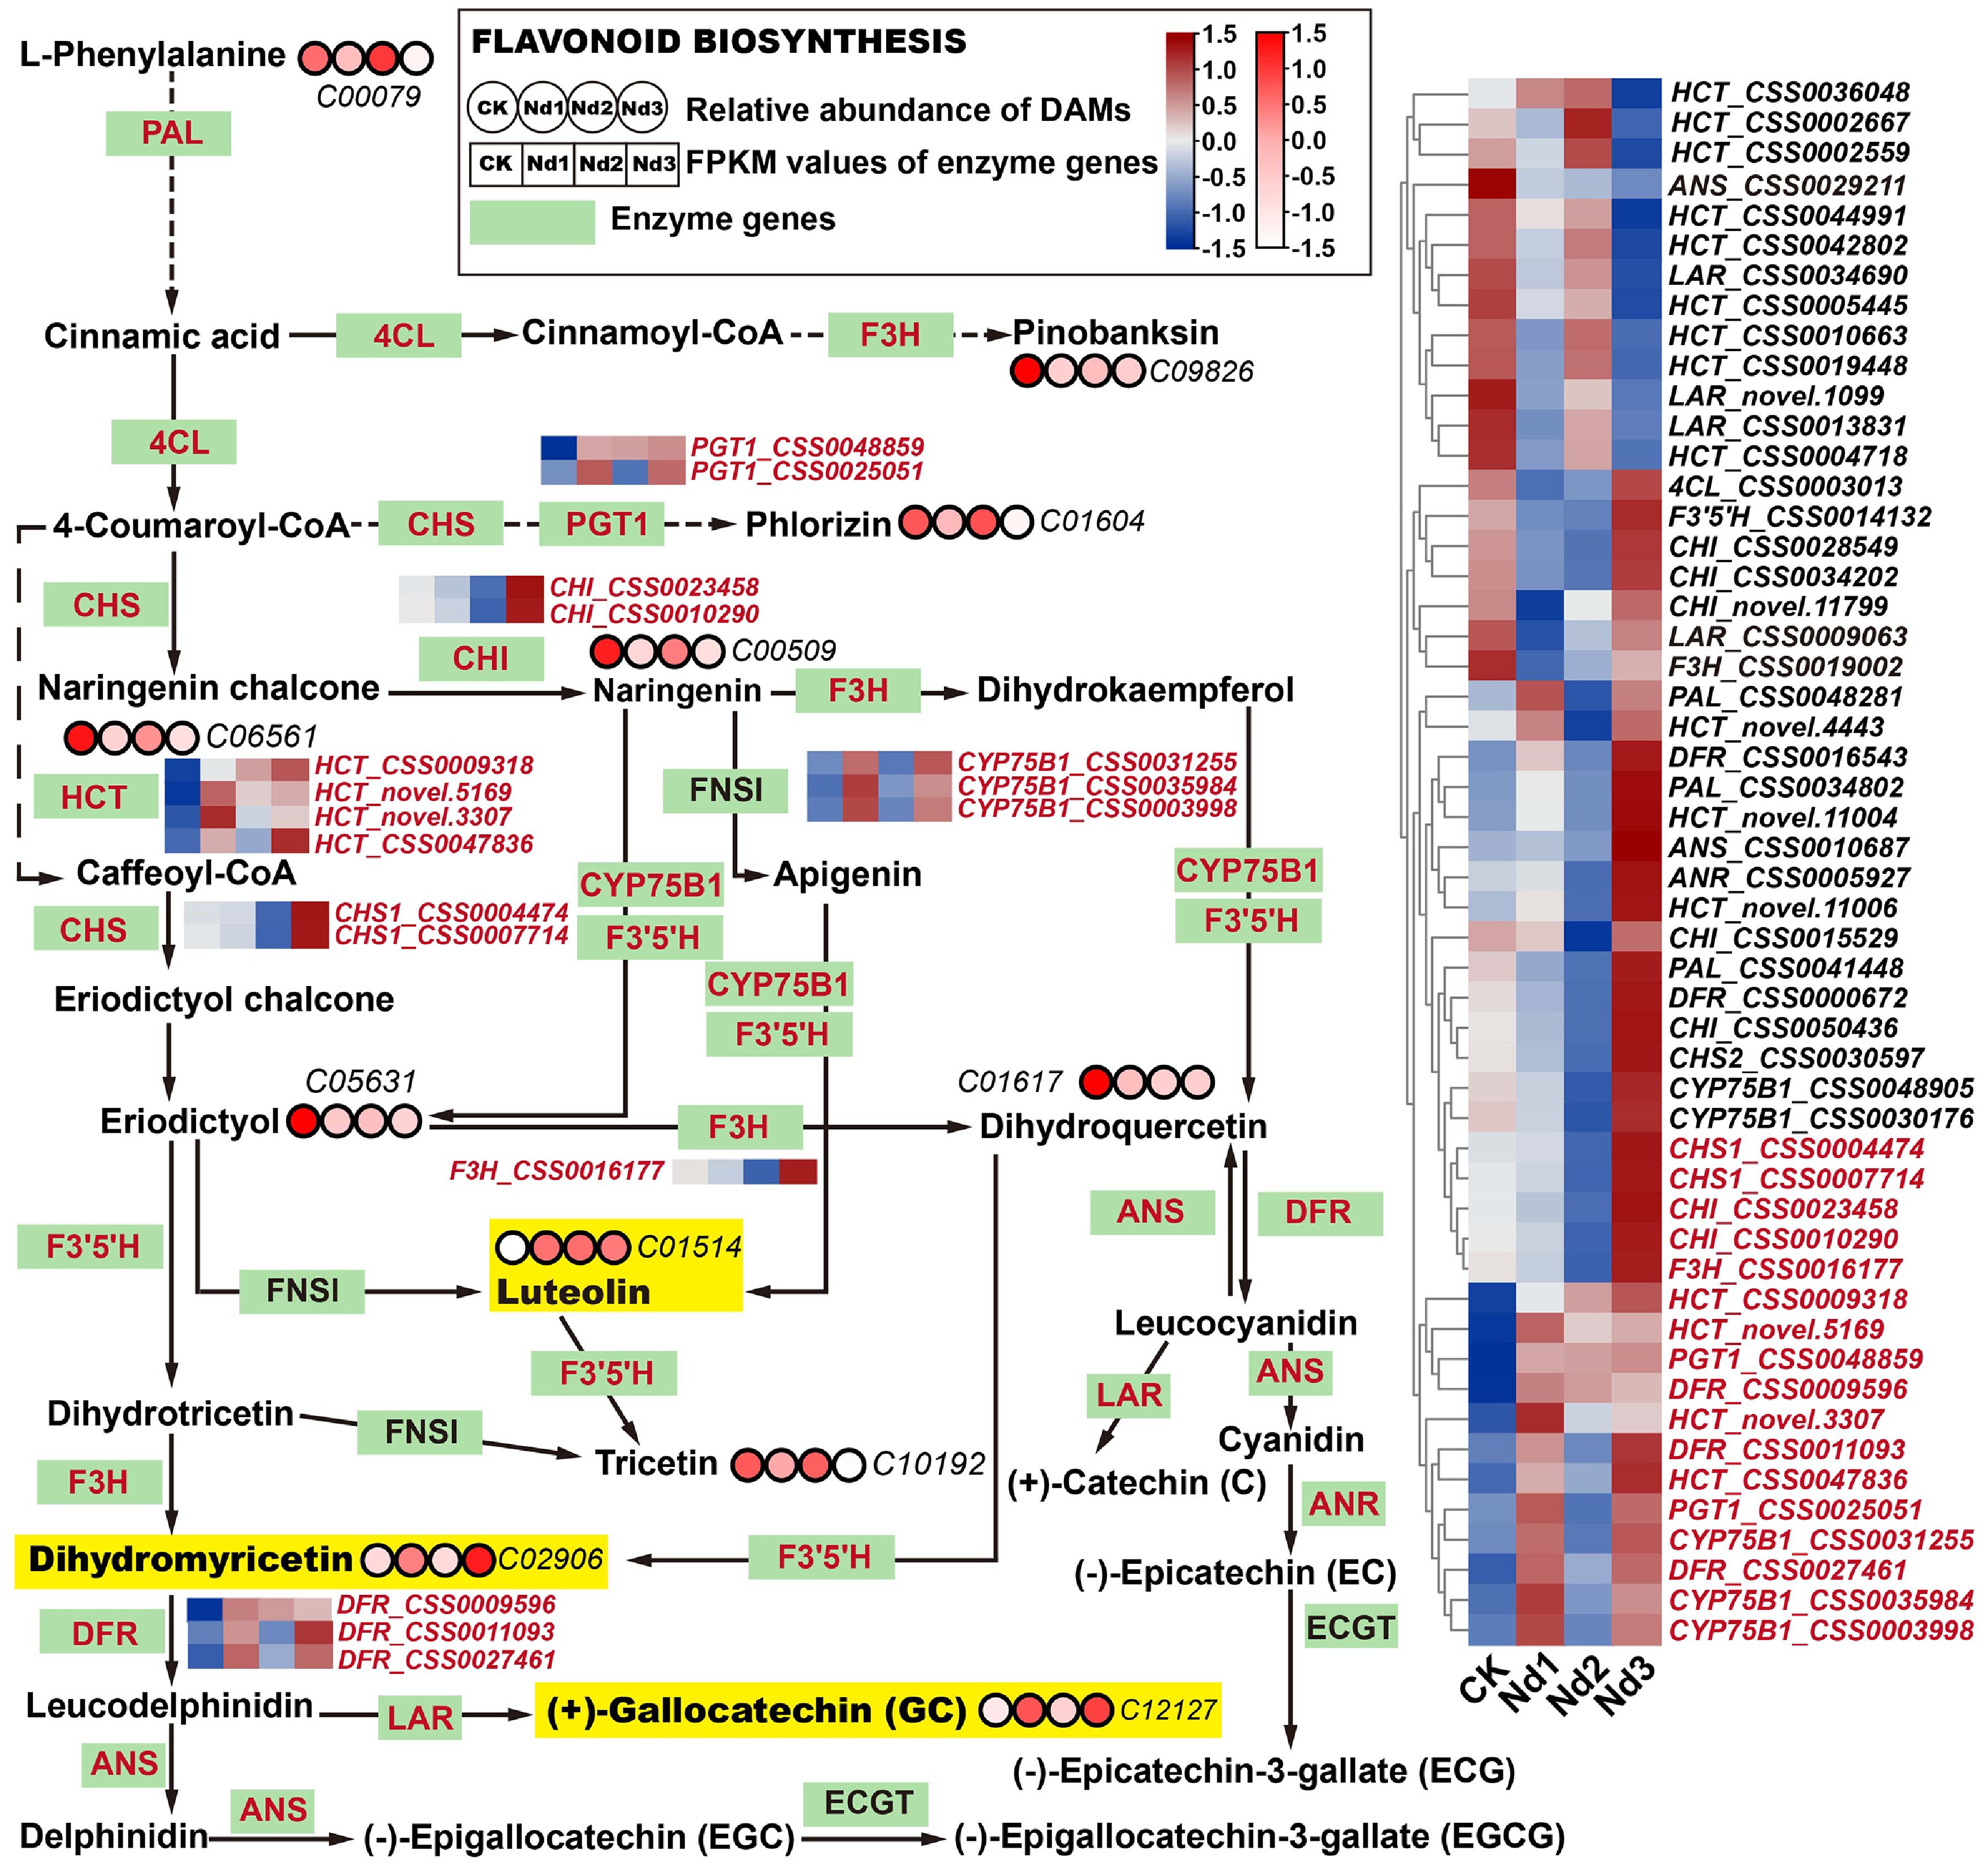
Figure 4.
Integrated analysis of flavonoid biosynthesis pathways' responses to nitrogen deficiency in new shoots. Green rectangular nodes represent enzyme genes annotated in KEGG pathways, with red labels indicating significantly DEGs (|log2FC| ≥ 1, FDR < 0.05). Red circular nodes indicate metabolites' relative abundance (KEGG IDs are specified, e.g., C00079), with darker red reflecting higher abundance. In the heatmap, genes in red show upregulated trends across nitrogen deprivation stages (CK→Nd3). Metabolites in yellow exhibit significant accumulation versus the controls (log2FC > 1.0). All data were normalized via Z-score transformation in TBtools.
-
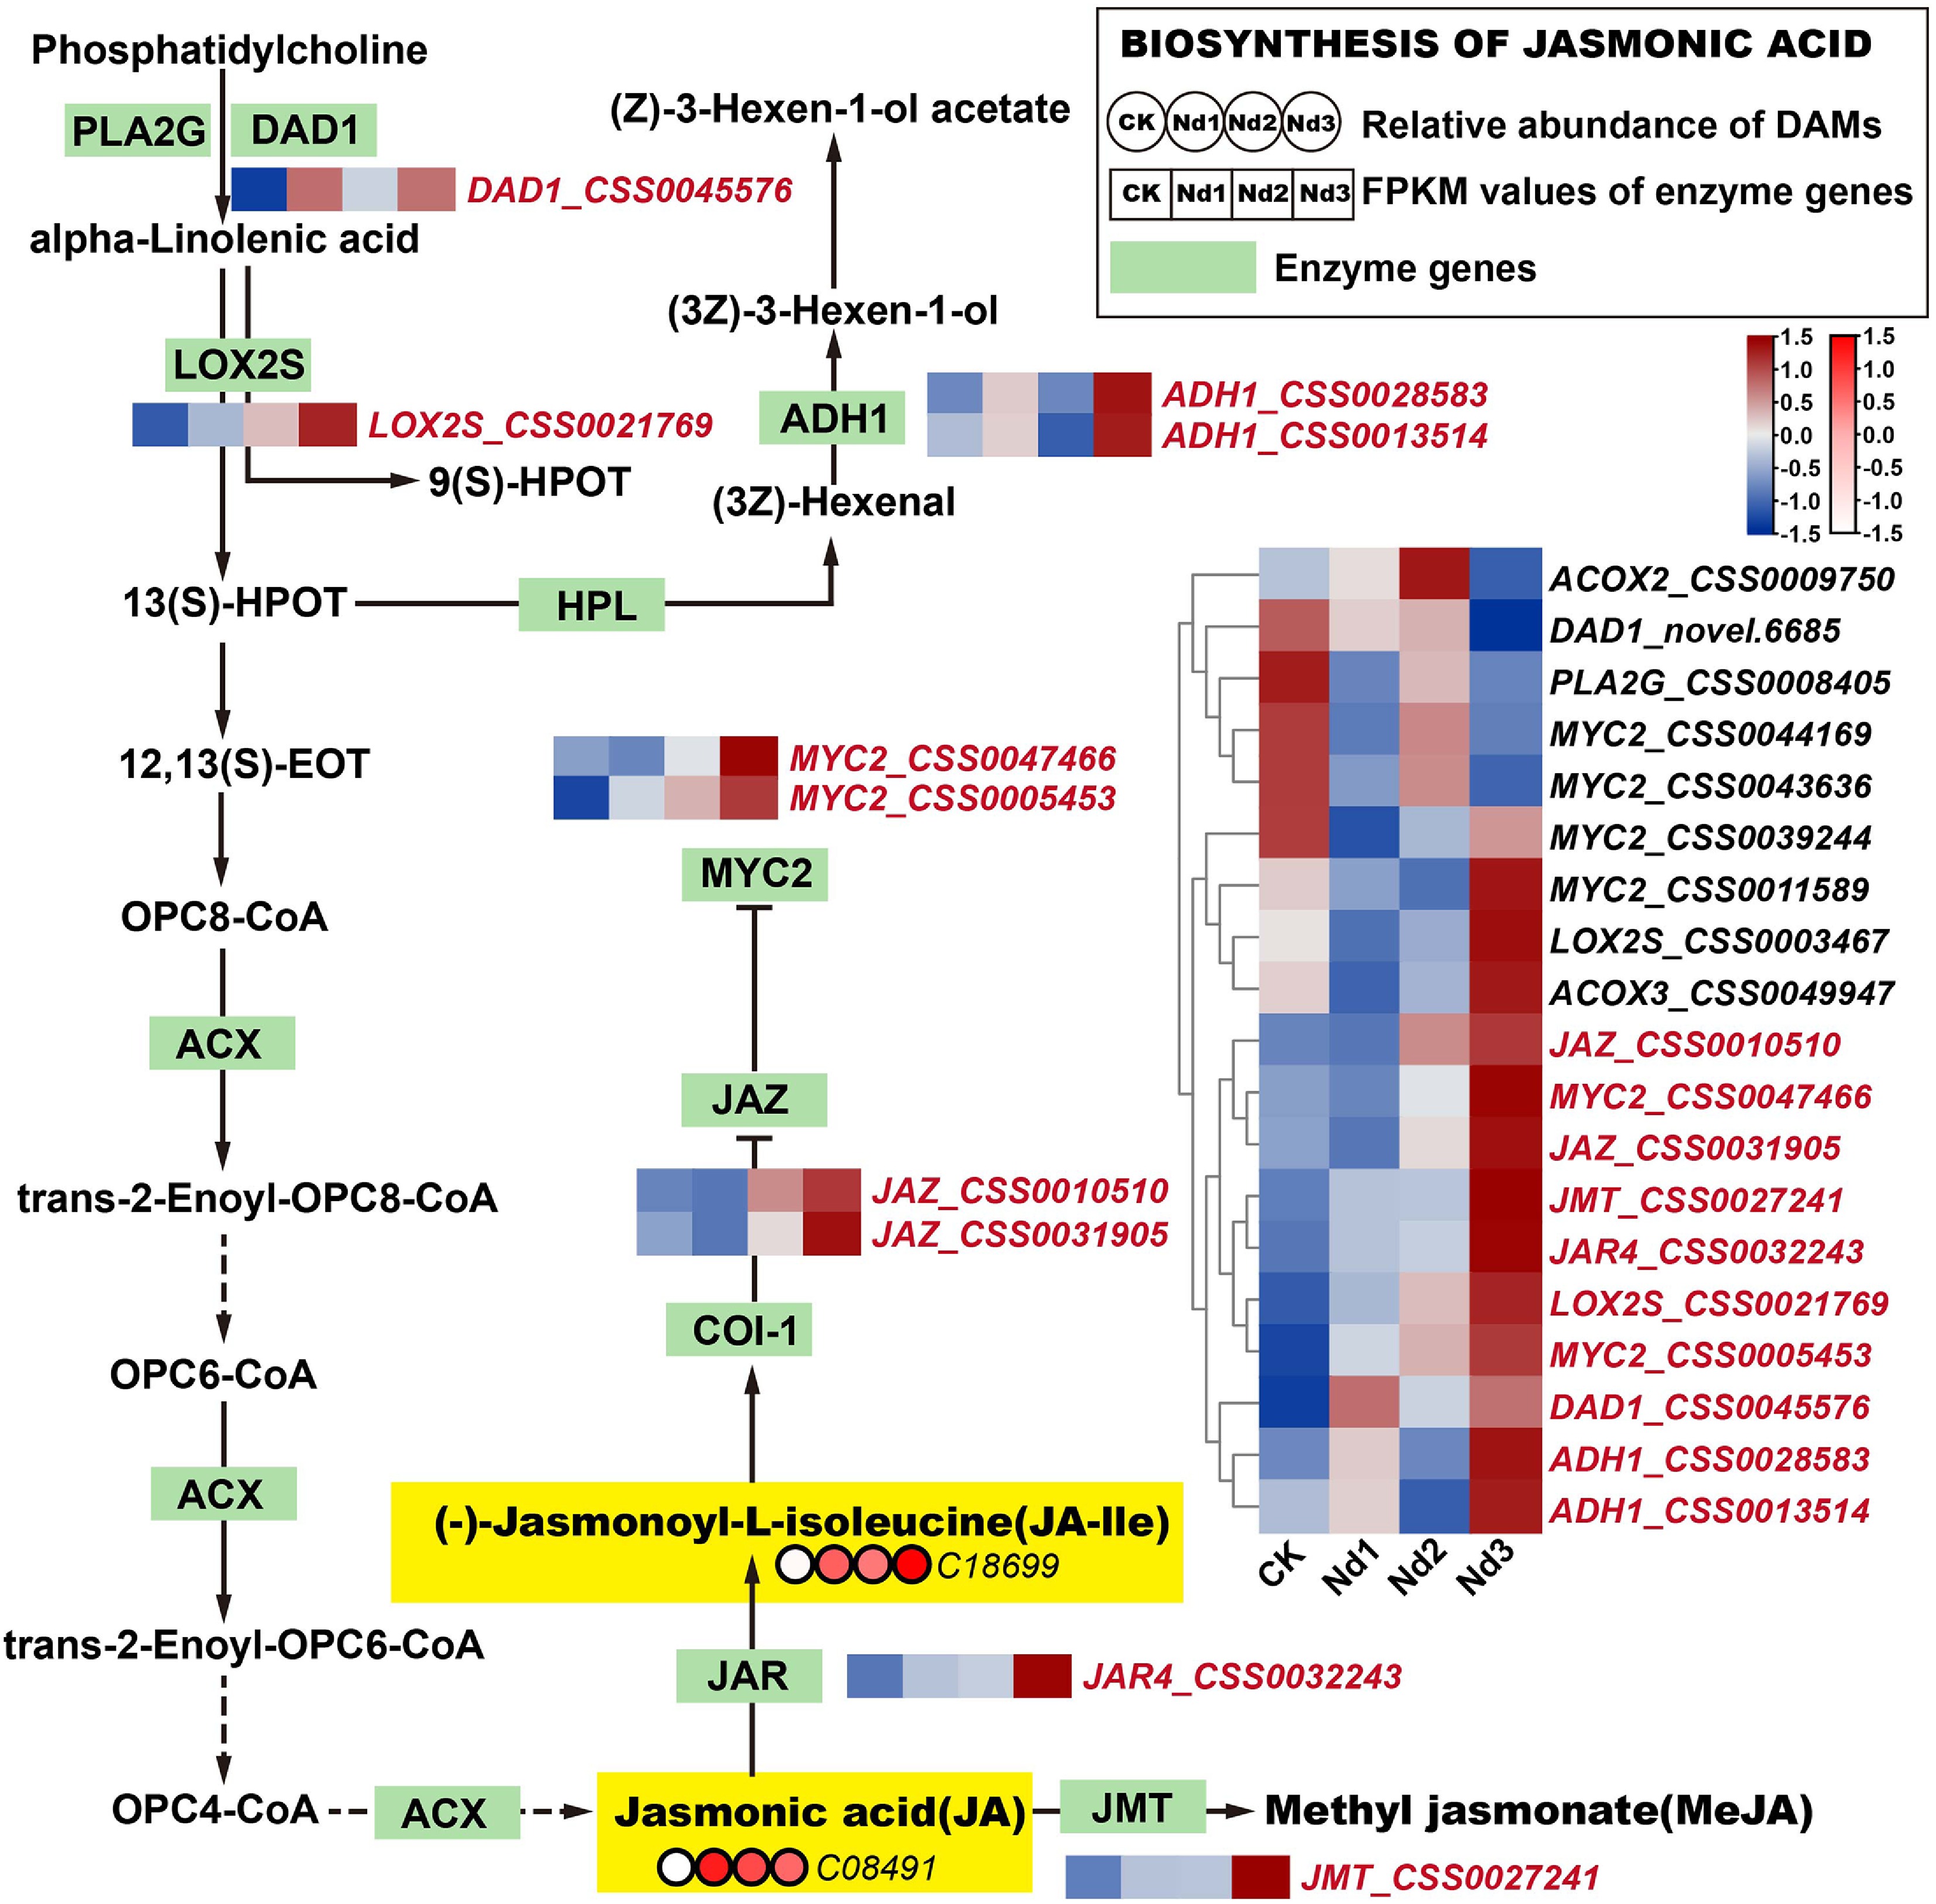
Figure 5.
Integrated analysis of the JA biosynthesis pathway's responses to nitrogen deficiency. Green rectangular nodes represent KEGG-annotated genes, with red labels marking significantly DEGs (|log2FC| ≥ 1, FDR < 0.05). Red circular nodes indicate metabolites' relative abundance (e.g., C08491 = JA), with darker red denoting higher abundance. In the heatmap, genes in red show upregulated expression trends across nitrogen deprivation stages (CK→Nd3). Metabolites in yellow exhibit significant accumulation versus the controls (log2FC > 1.0). (-)-Jasmonoyl-L-isoleucine, JA-Ile; jasmonic acid, JA; methyl jasmonate, MeJA; total polyphenol content, TP. All data were normalized via Z-score transformation in TBtools.
-
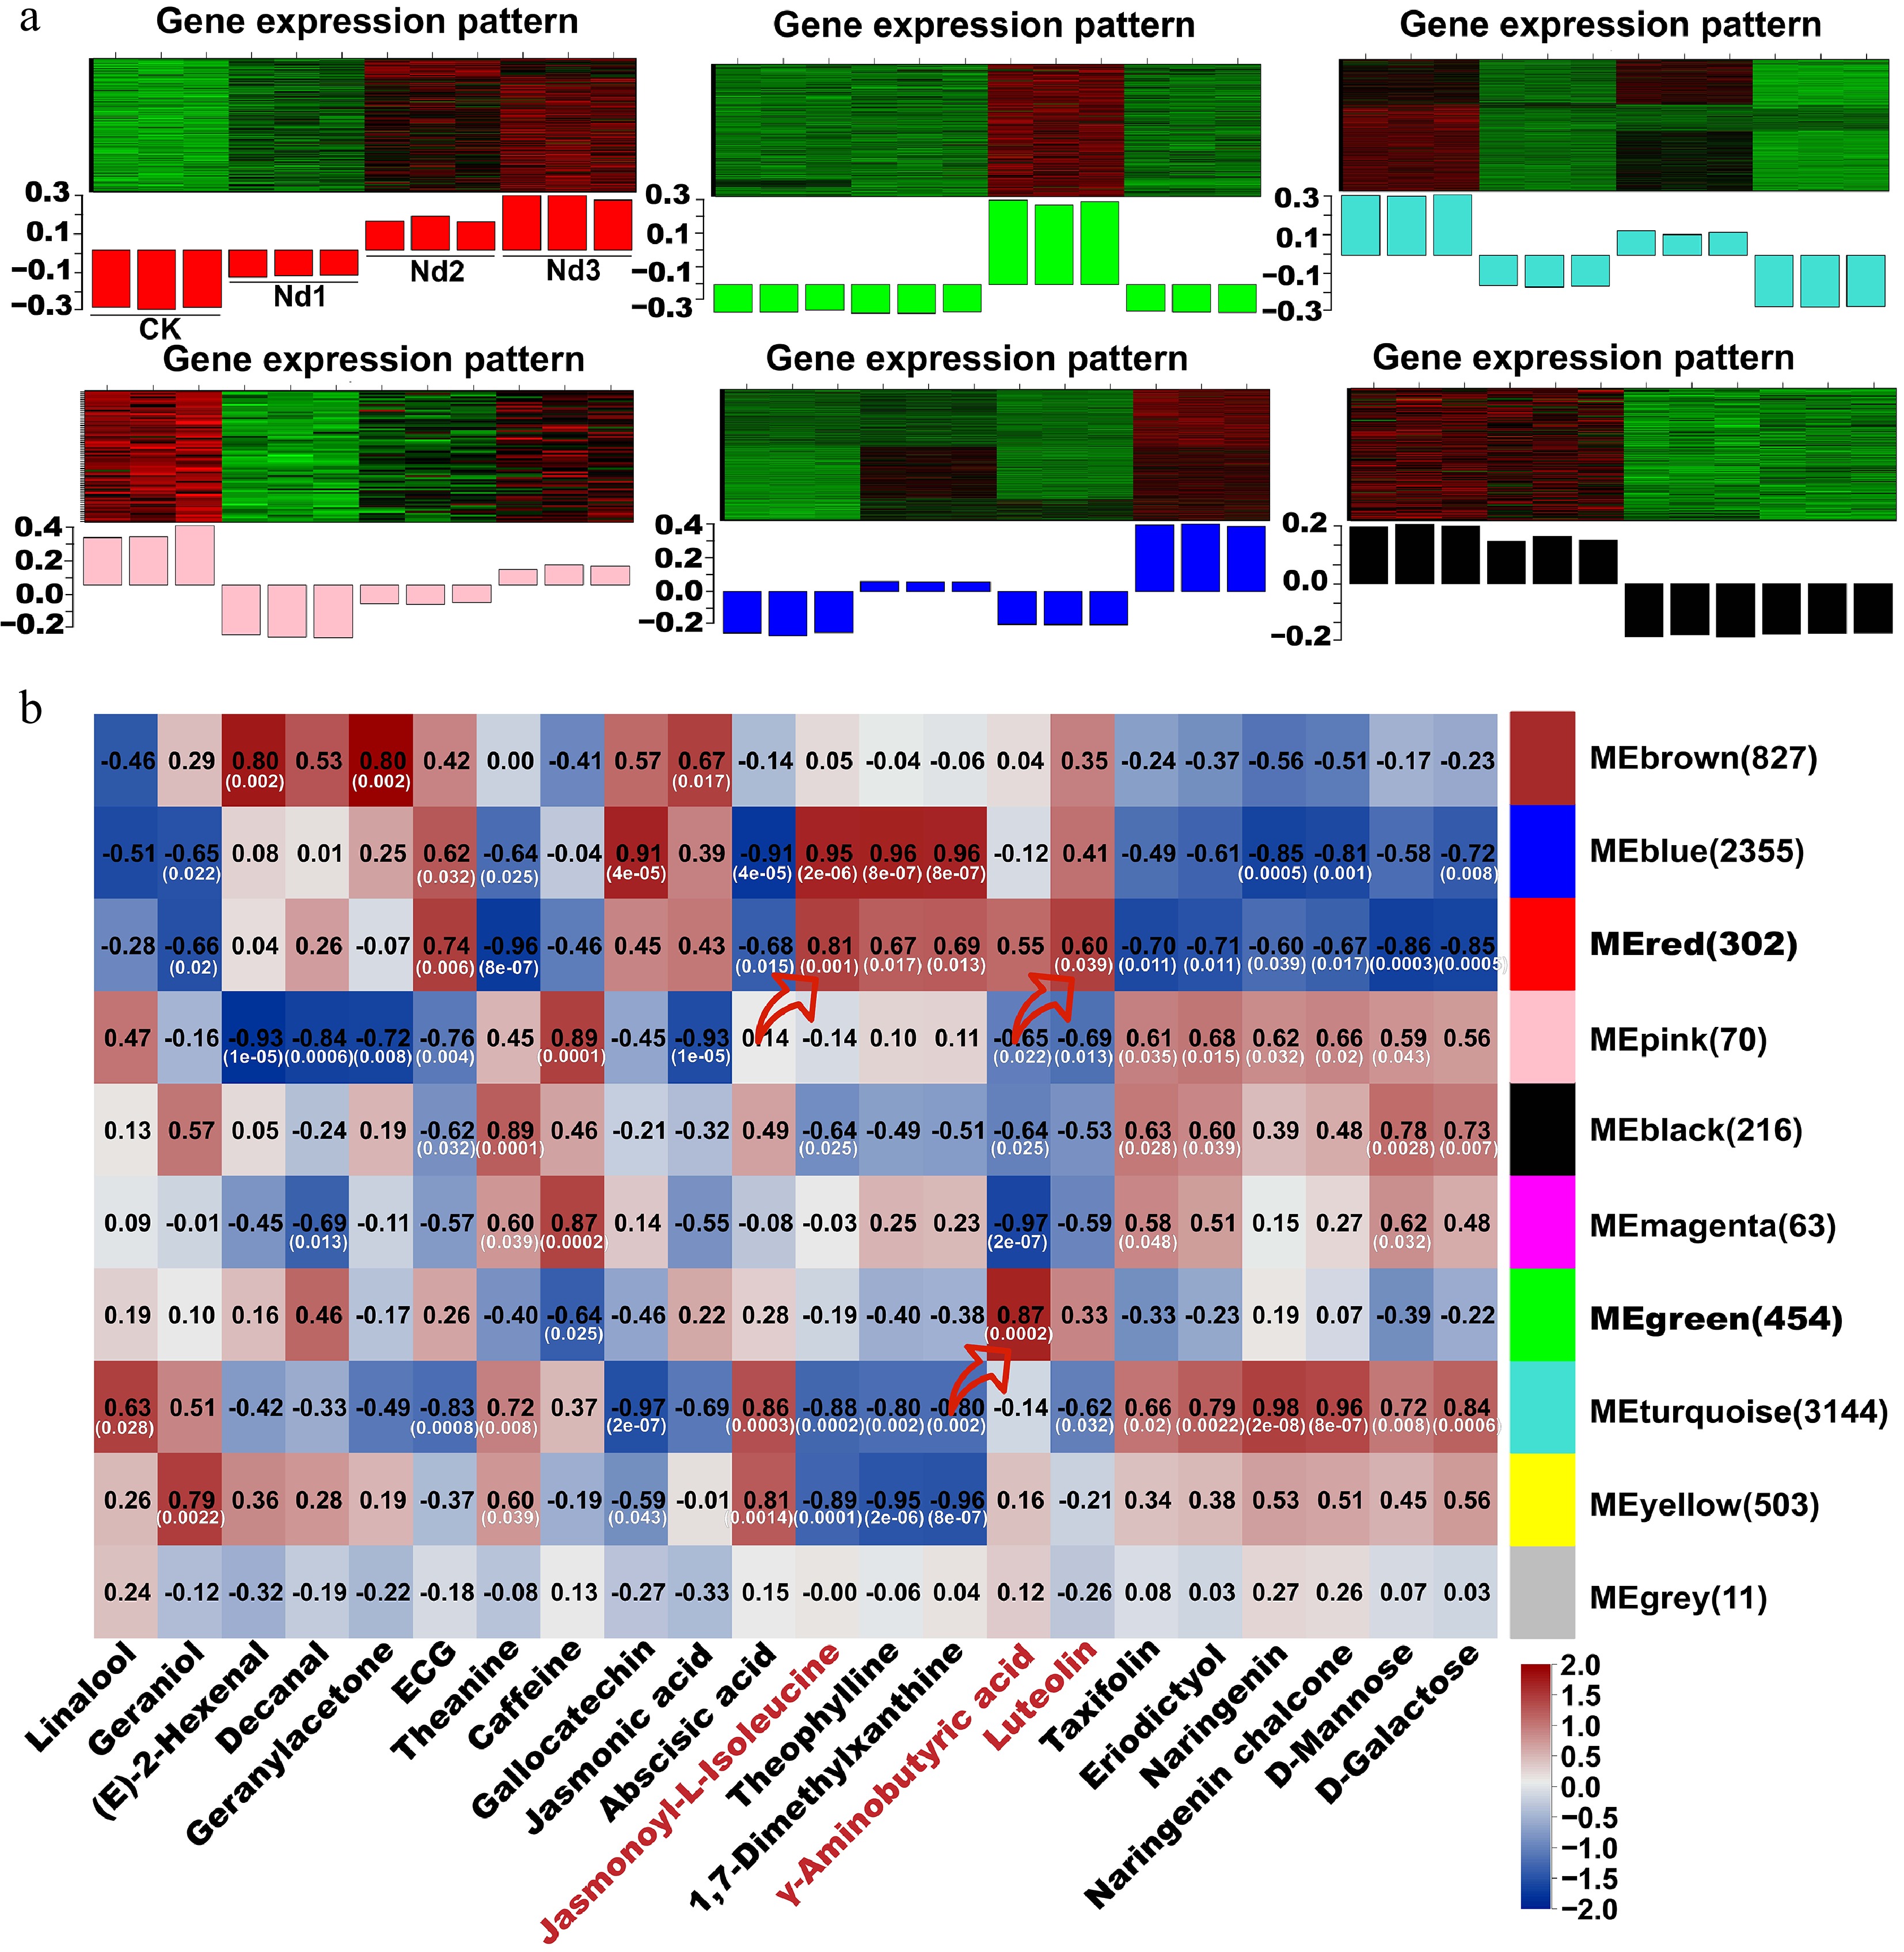
Figure 6.
WGCNA co-expression network of nitrogen deficiency responses in new shoots. (a) Heatmap of modules' eigengene expression trends across stages of nitrogen deficiency (CK-Nd3). (b) Module–trait correlation heatmap. Black numerals indicate Pearson's correlation coefficients (r) between the modules and target metabolites; white values in parentheses denote statistical significance (p-values). Red arrows highlight modules with strong positive correlations with the target metabolites (r > 0.60, p < 0.05).
-
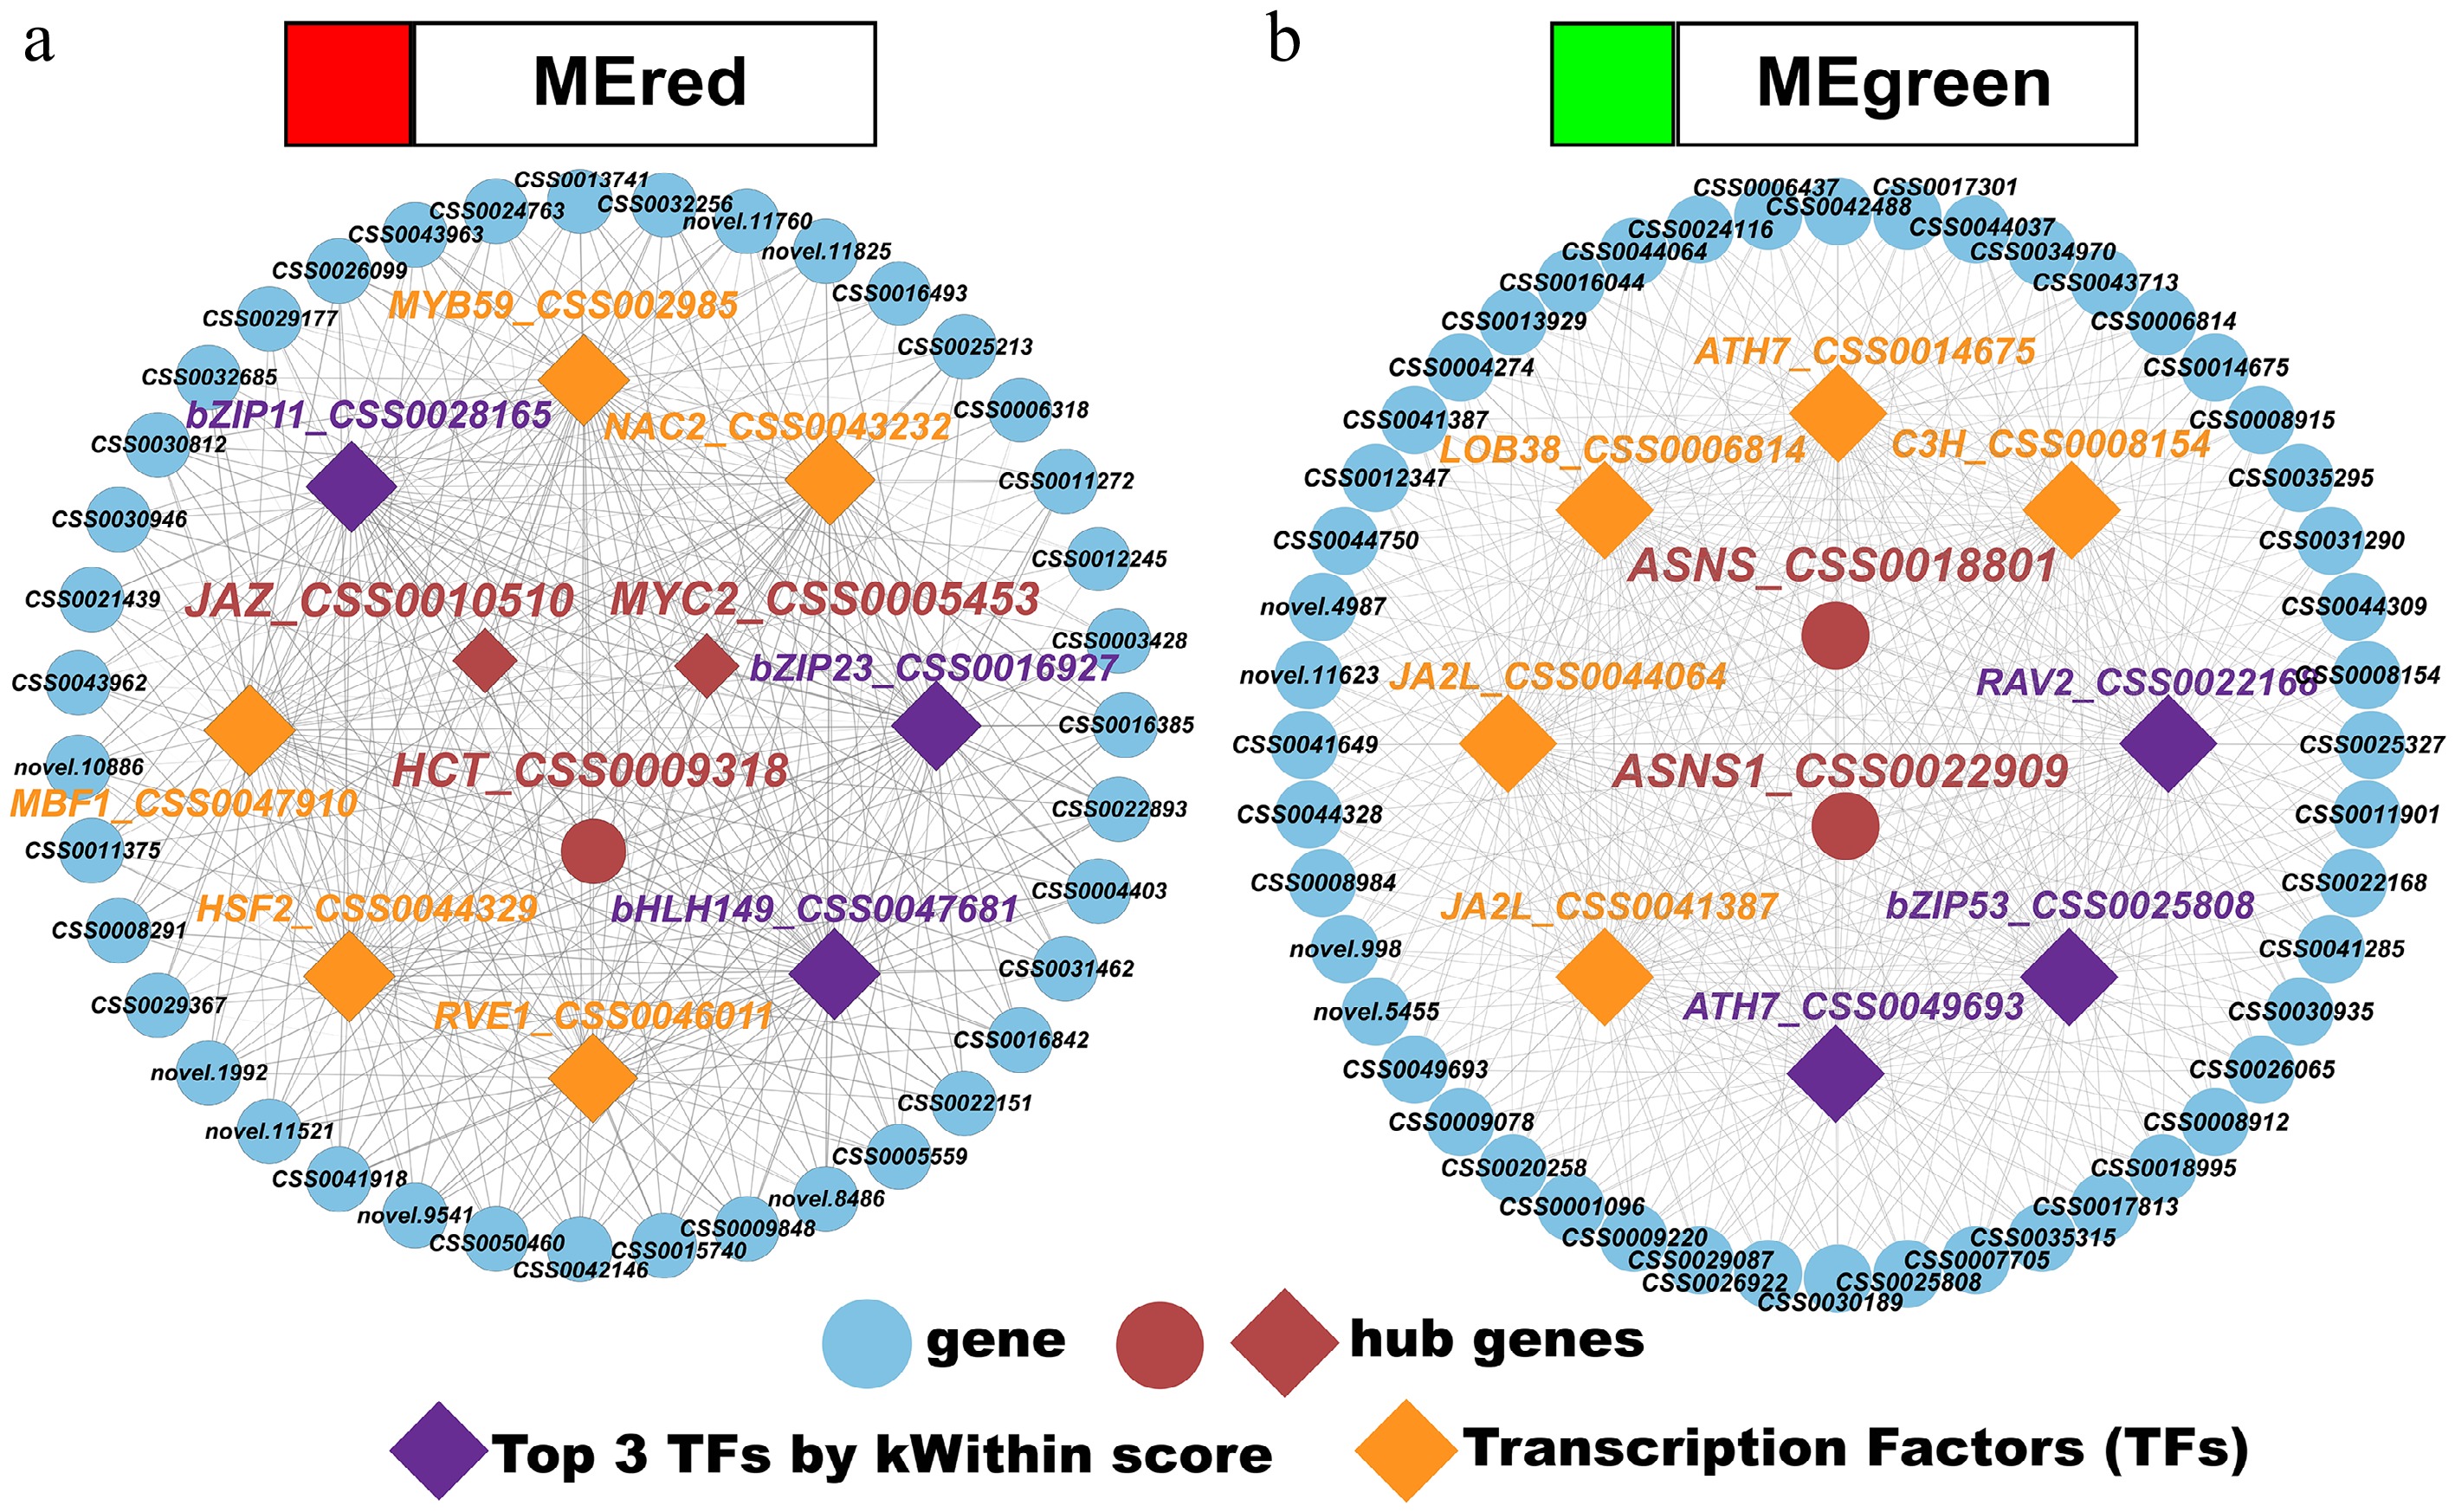
Figure 7.
(a), (b) Transcription factor–gene regulatory networks for the red and green modules.
-
No. Volatile compounds OT (µg/L) OAV VIP Odor description CK Nd1 Nd2 Nd3 Voc_2 Linalool 0.6 104.3 88.1 98.4 90.5 1.04 Floral Voc_4 Geraniol 3.2 12.7 12.8 11.8 8.5 1.56 Floral, fruity Voc_16 (E)-2-hexenal 18 10.3 17.7 14.4 11.9 2.89 Green Voc_19 (E,E)-2,4-heptadienal 0.032 308.1 597.1 314.8 194.2 1.14 Fatty, floral Voc_20 Decanal 0.1 133.3 372.7 362.5 216.7 1.41 Fruity Voc_27 Geranylacetone 0.06 186.6 395.4 237.4 243.1 1.08 Floral, fruity Voc_32 Methyl salicylate 40 1.9 2.0 1.5 2.3 2.43 Minty VOC, volatile organic compound; OT, odor threshold in water (see the references in Supplementary Table S14); OAV, odor activity value. Table 1.
Seven key aroma compounds (OAV ≥ 1, VIP ≥ 1) under the nitrogen deficiency treatment.
Figures
(7)
Tables
(1)