-
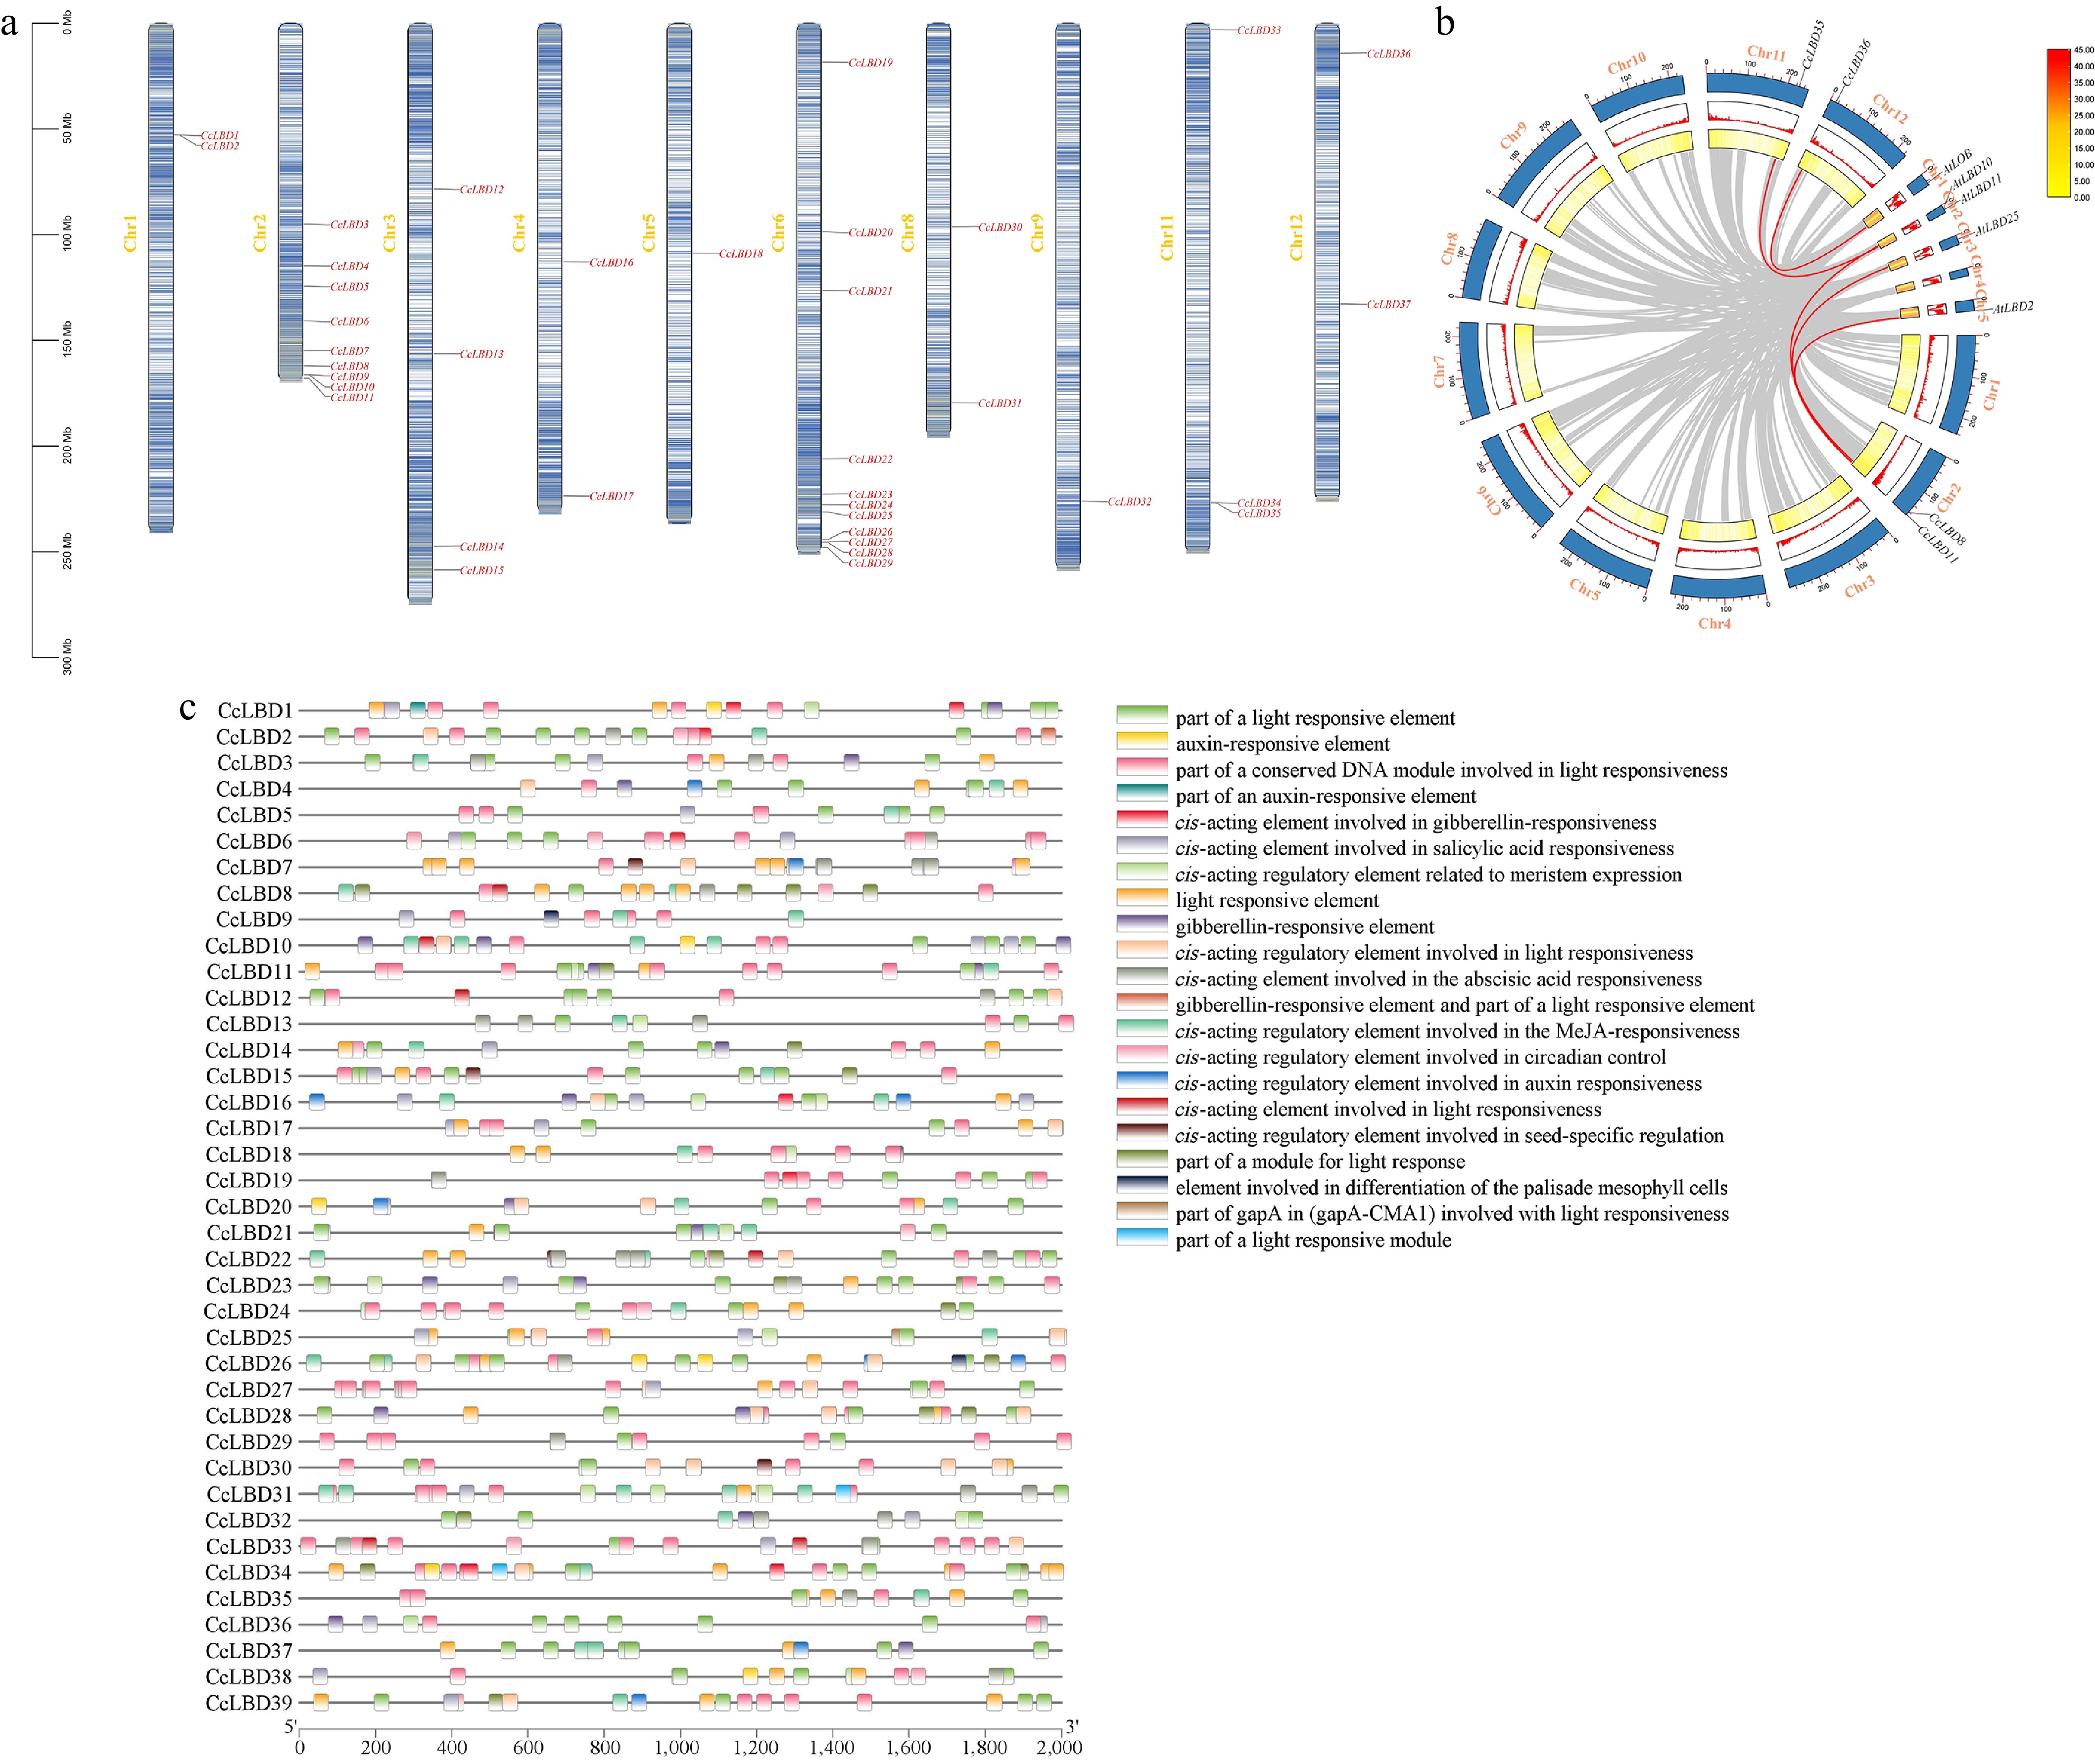
Figure 1.
Chromosomal localization of the LBD gene family and prediction of cis-acting elements in the promoter.
-
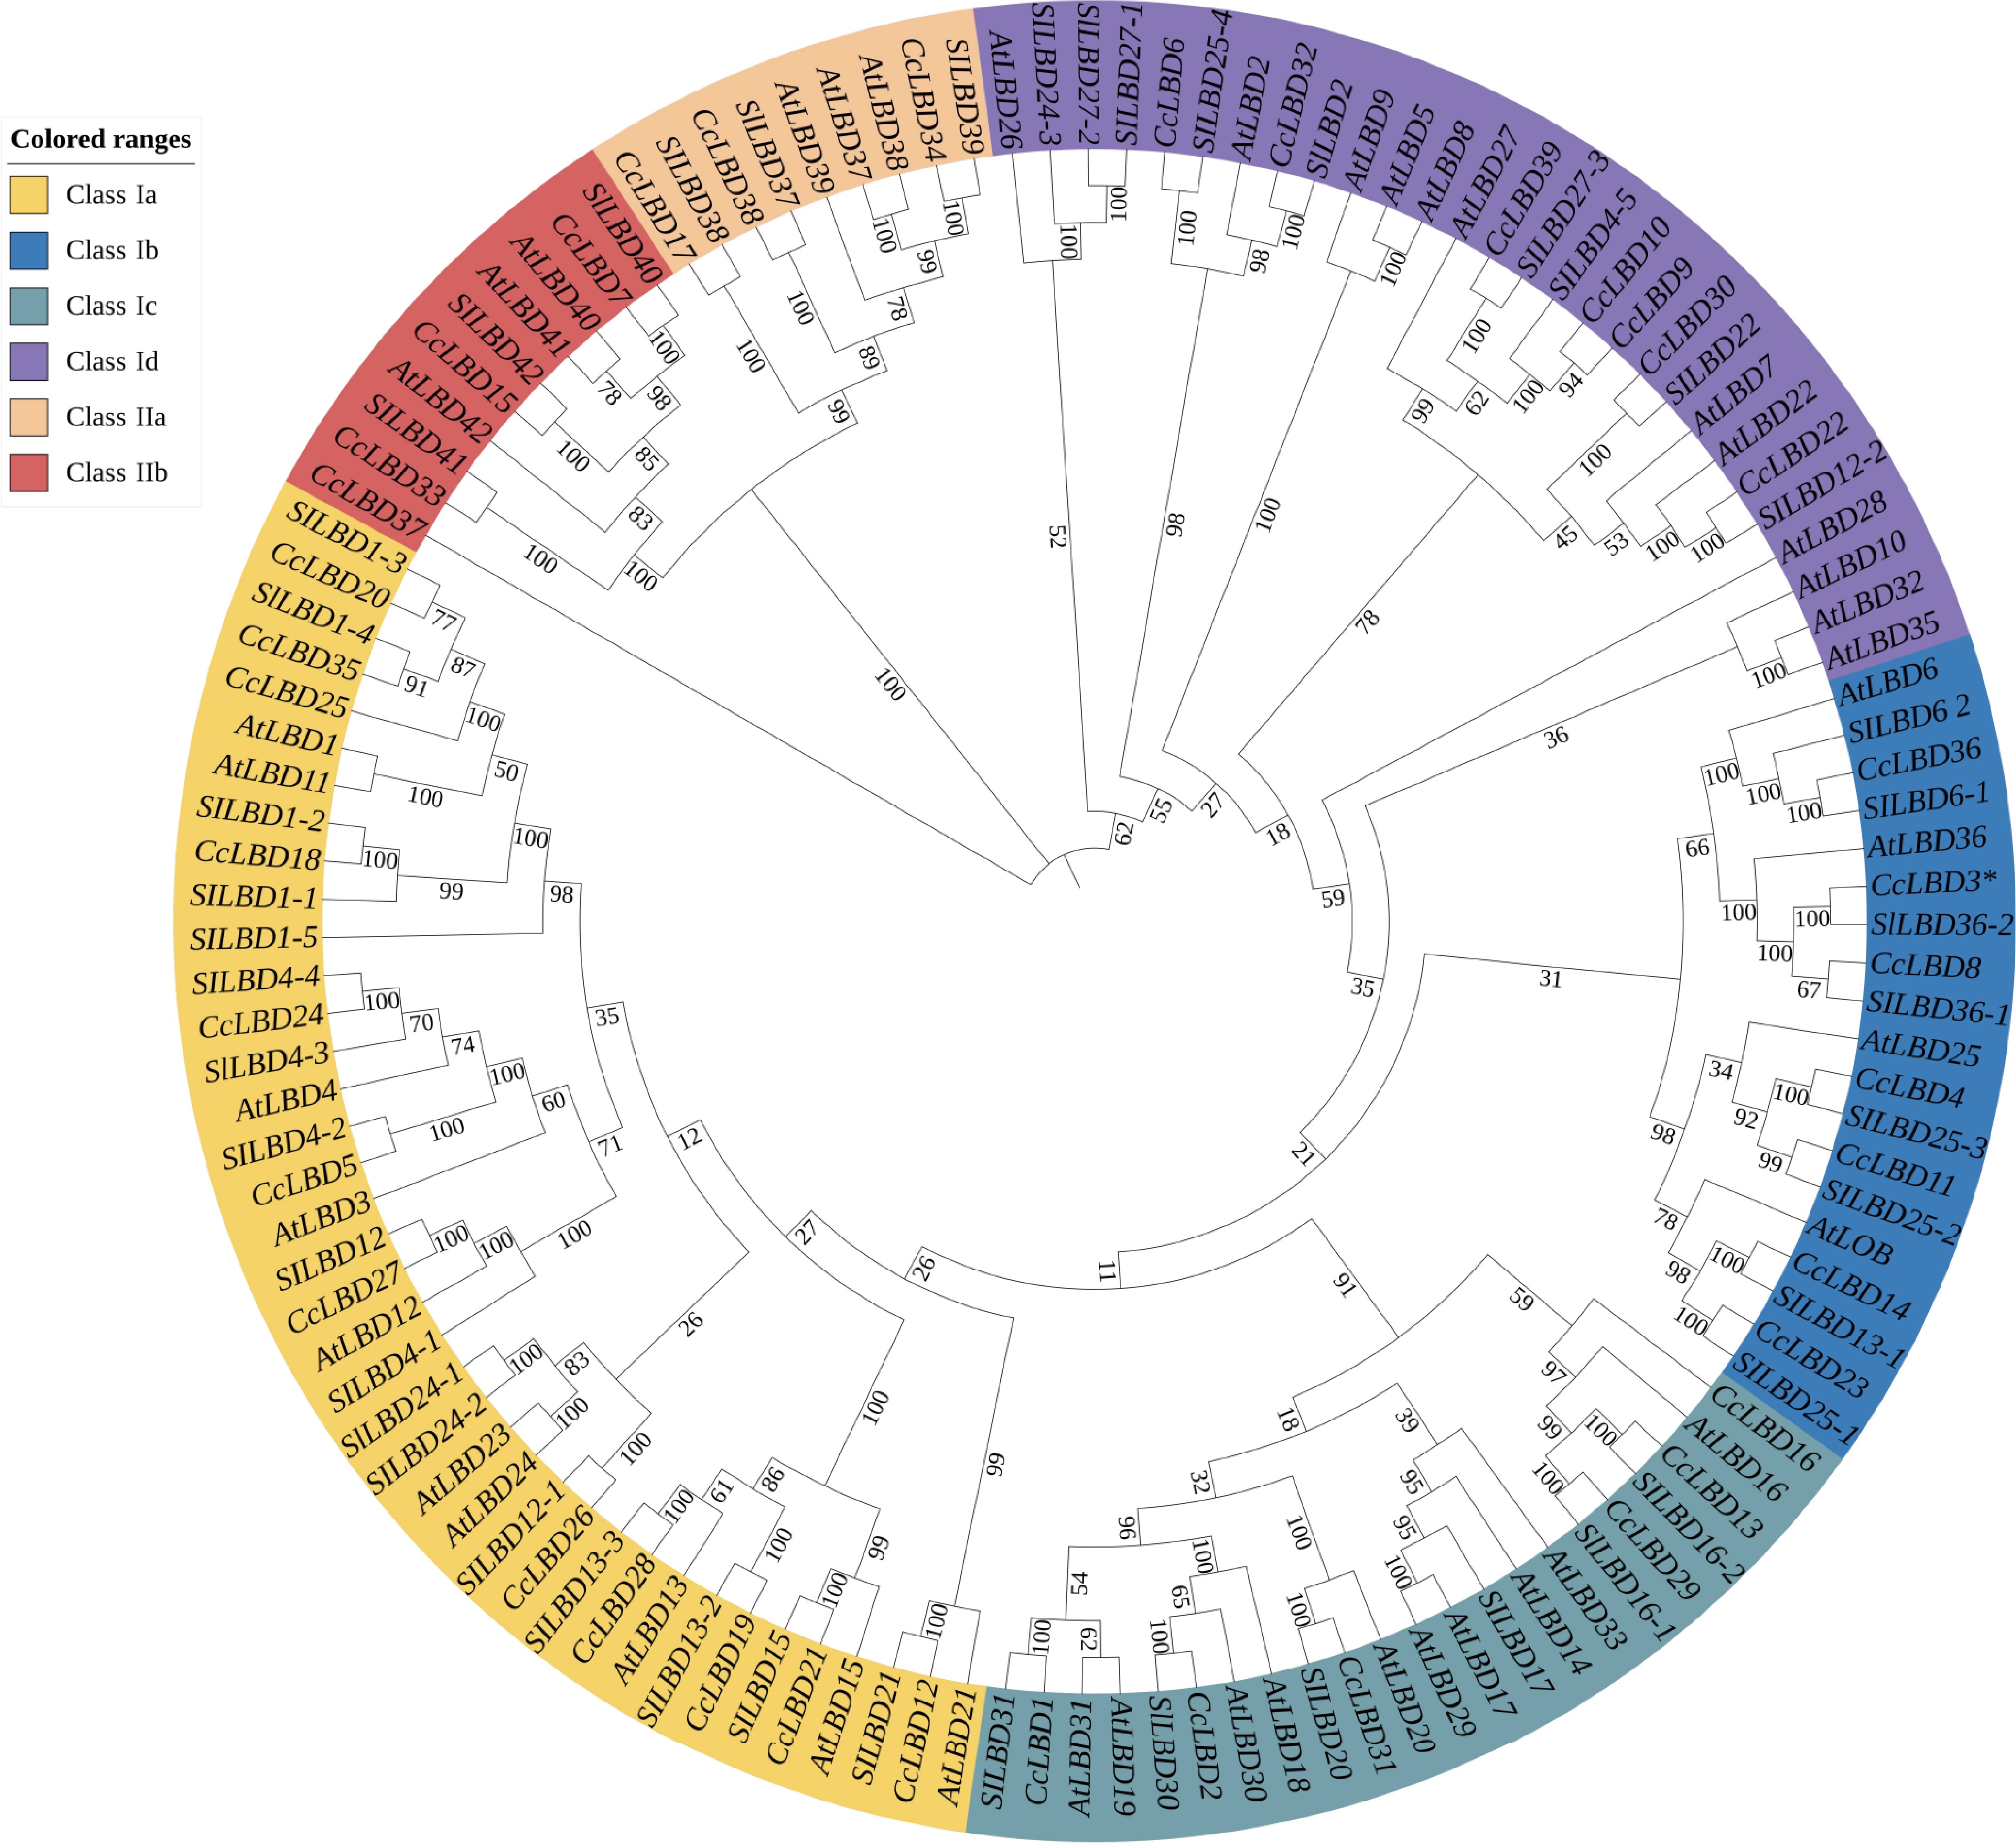
Figure 2.
Phylogenetic tree of the LBD gene family sequence source (Supplementary Table S3).
-
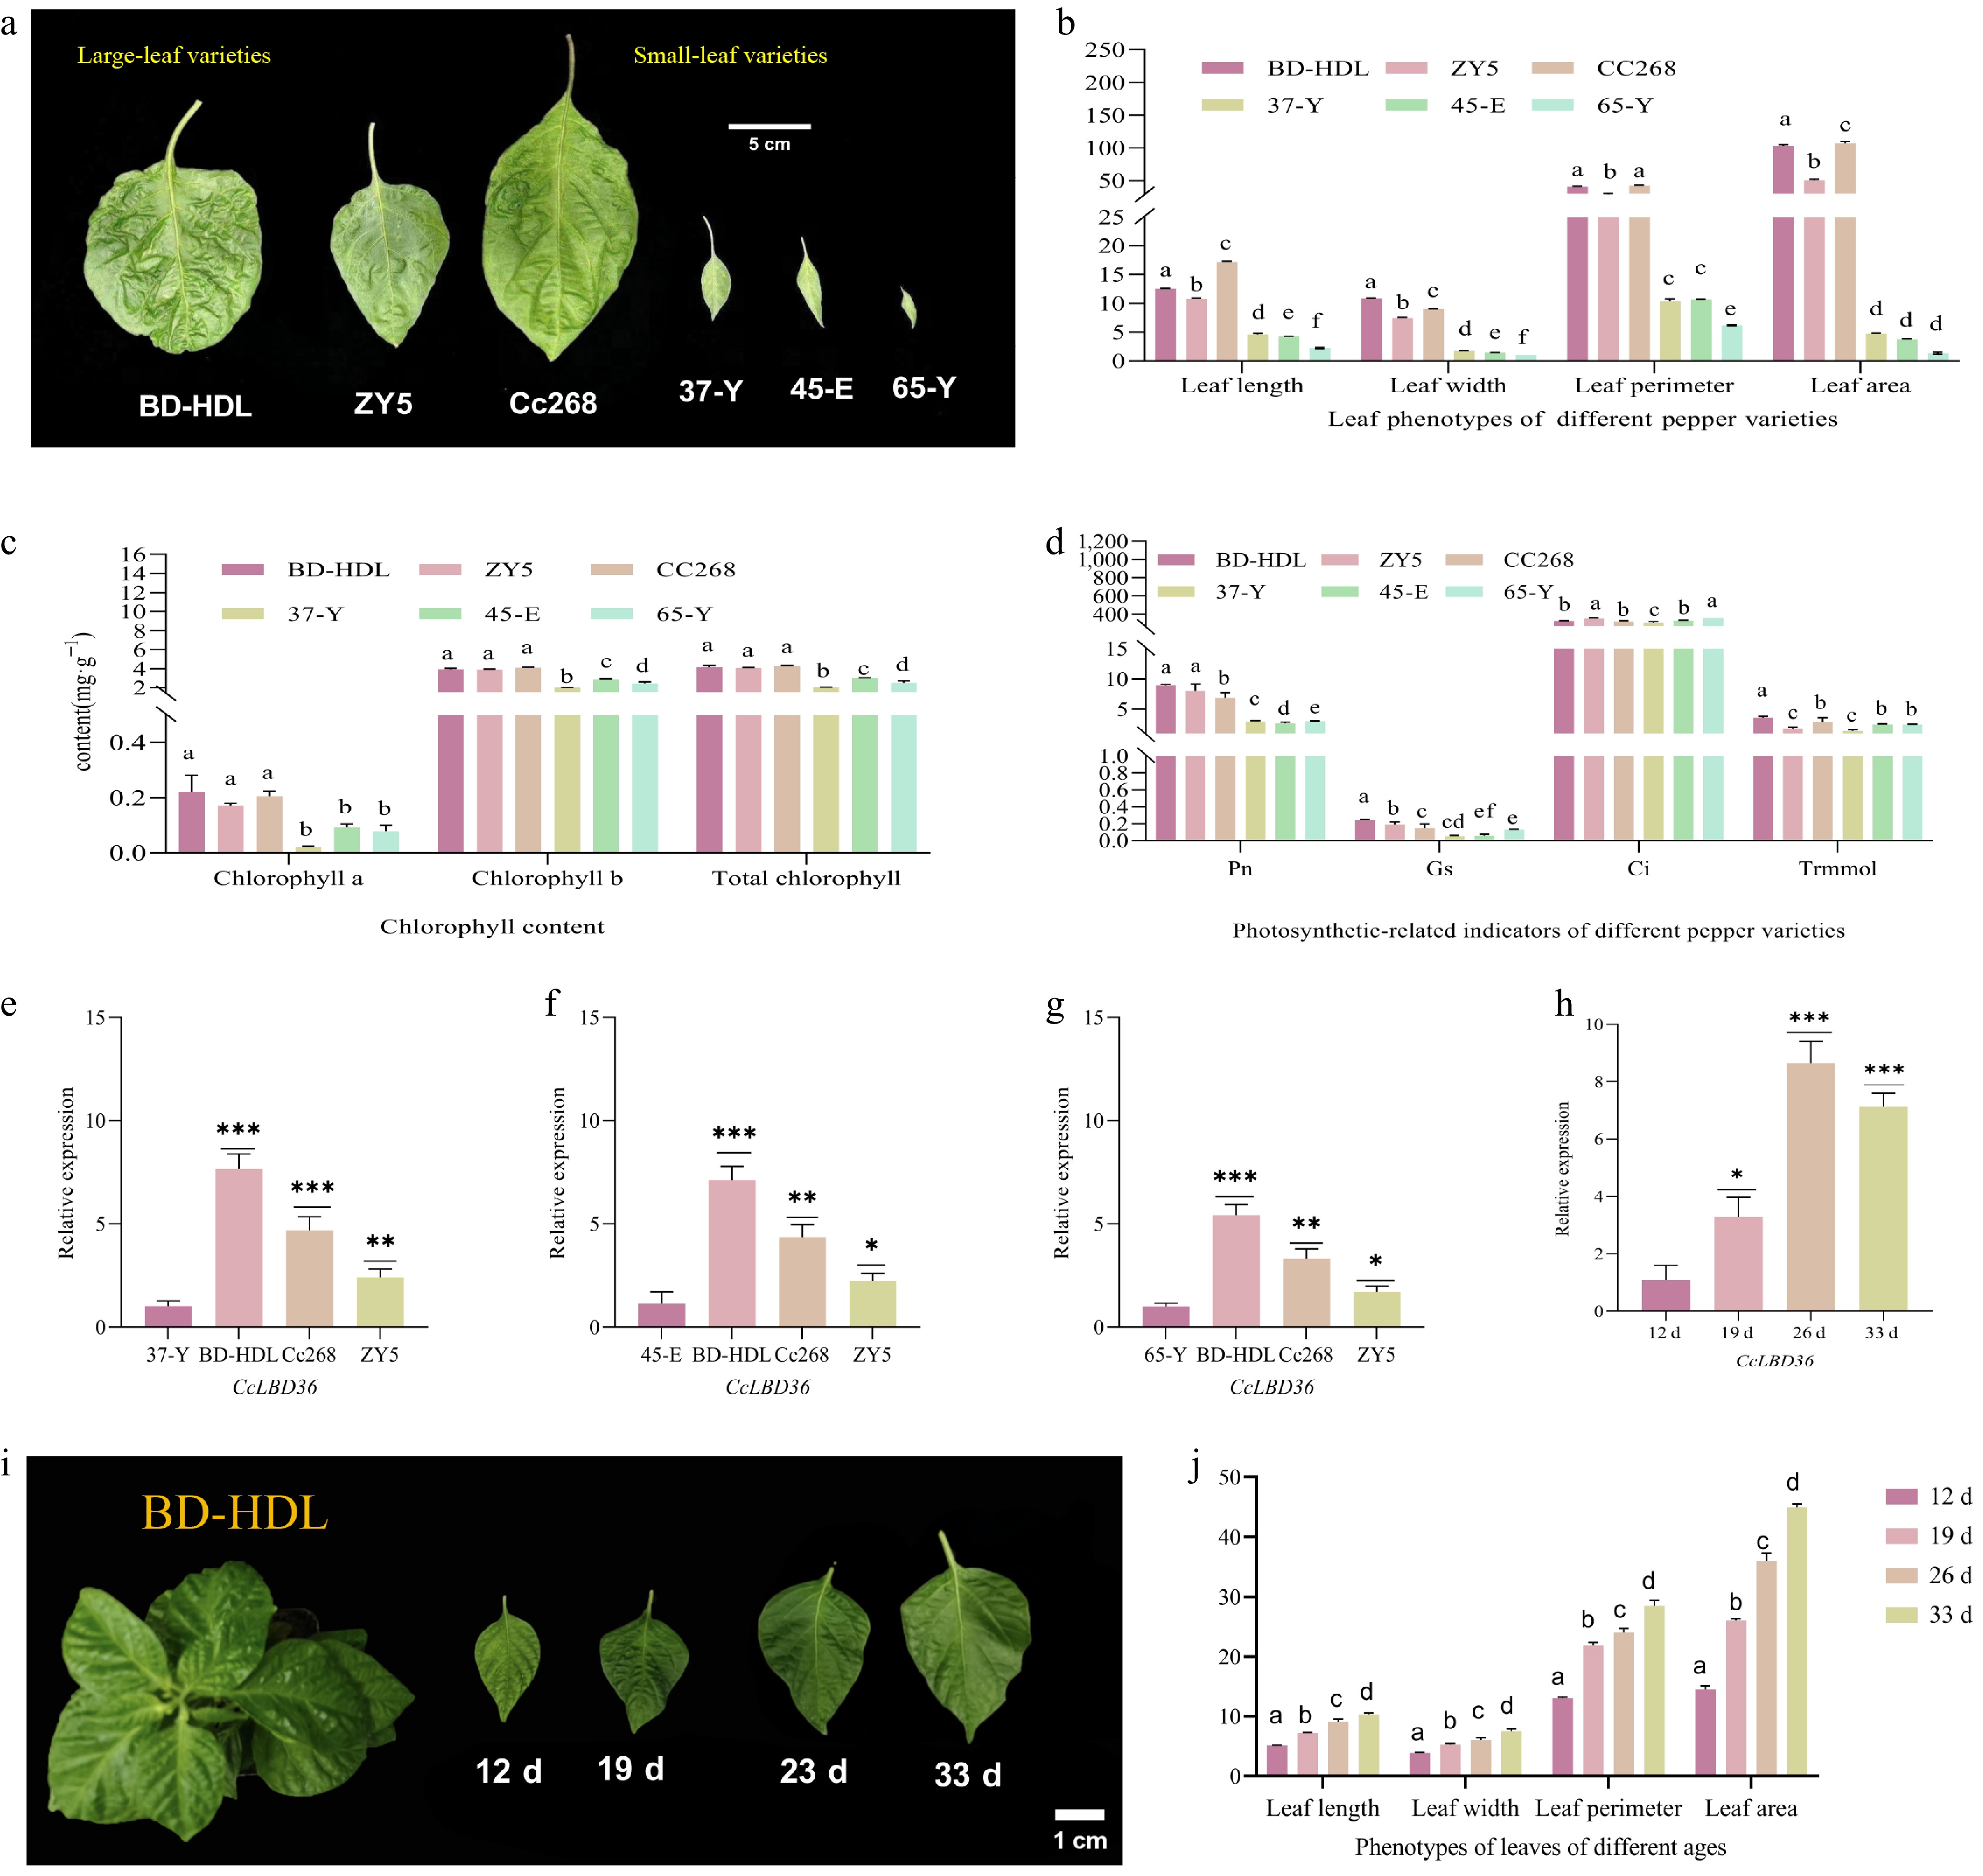
Figure 3.
The expression levels of CcLBD36 genes in different varieties of pepper. Note: All data is presented as the mean values of five biological replicates. Different lowercase letters denote significant differences at the 0.05 probability level. * Indicates p ≤ 0.05, ** indicates p ≤ 0.01, *** indicates p ≤ 0.001, and **** indicates p ≤ 0.0001. Abbreviations and units of the measured physiological and morphological parameters. Photo: Net photosynthetic rate (μmol CO2 m−2·s−1); Gs: Conductance to H2O (mol H2O m−2·s−1); Ci: Intercellular carbon dioxide concentration (μmol CO2 mol−1); Trmmol: Transpiration rate (mmol H2O m−2·s−1). Morphological indicators: leaf length, leaf width, leaf circumference (unit: cm), and leaf area (unit: cm2). Photosynthetic pigments: chlorophyll a, chlorophyll b, and total chlorophyll content (unit: mg·g−1).
-
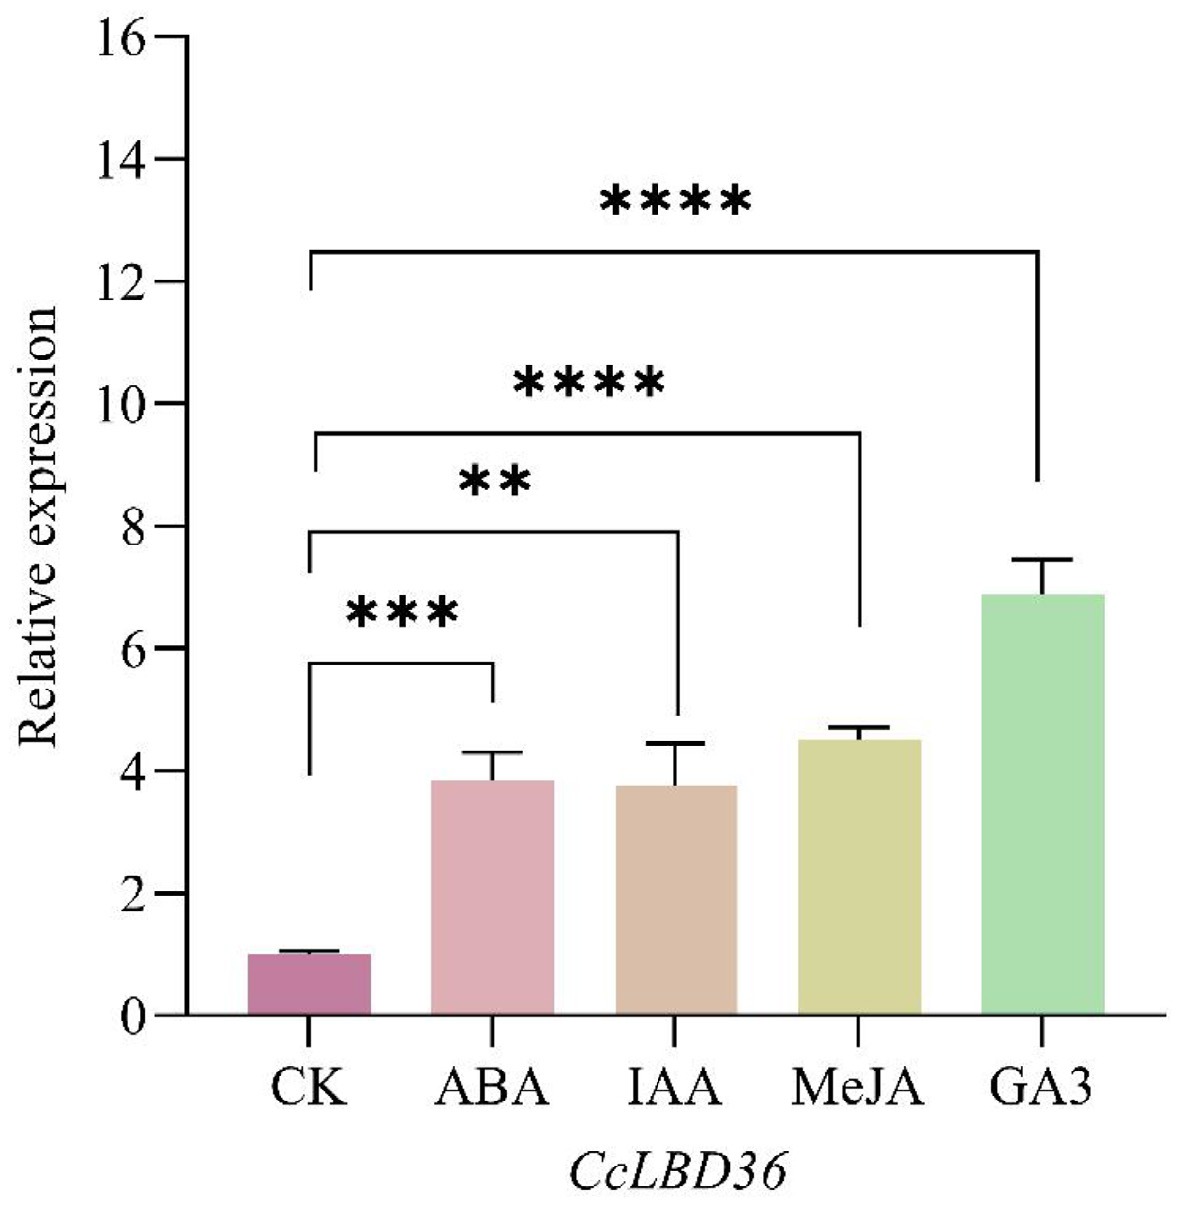
Figure 4.
The expression levels of CcLBD36 genes in capsicum under different hormone treatments. Note: ** indicates p ≤ 0.01, *** indicates p ≤ 0.001, and **** indicates p ≤ 0.0001.
-
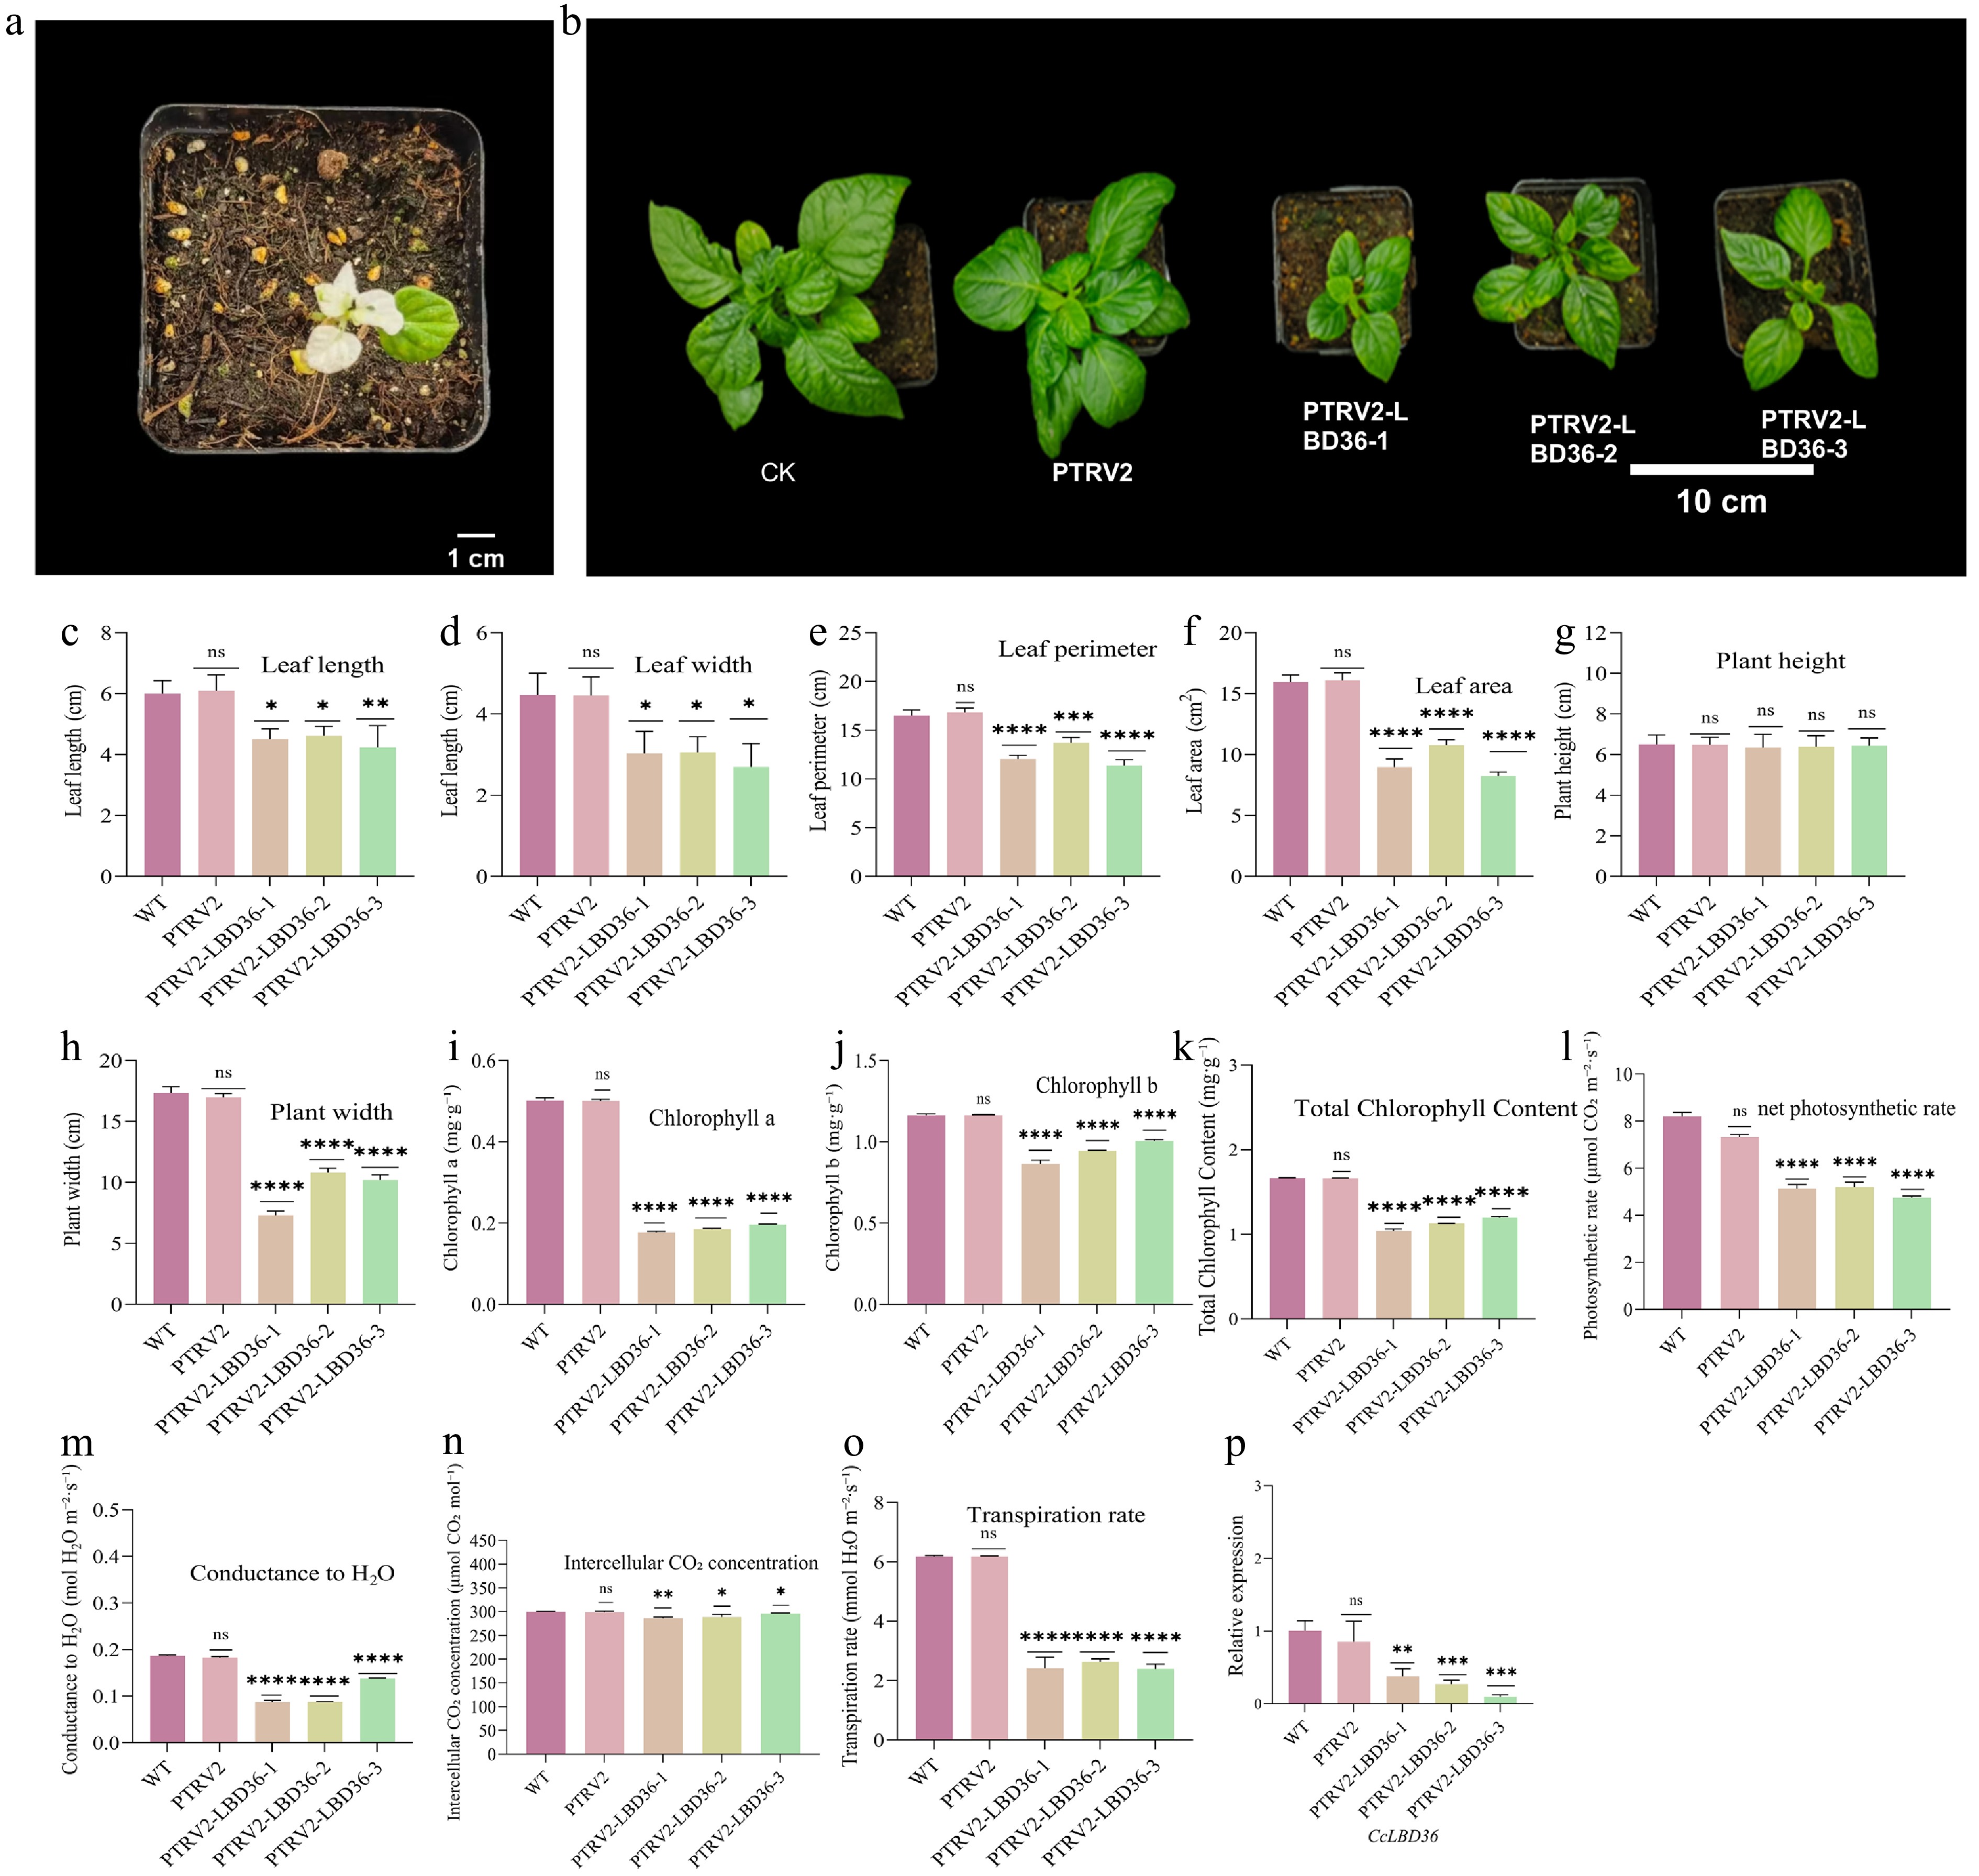
Figure 5.
The albinism map of the positive control (pTRV1-PDS) plants, and the phenotype, chlorophyll content, photosynthetic indicators, and expression level of the CcLBD36 gene of peppers under gene silencing treatment. Note: Different lowercase letters indicate significant differences in levels when p < 0.05. * Indicates p ≤ 0.05, ** indicates p ≤ 0.01, *** indicates p ≤ 0.001, and **** indicates p ≤ 0.0001. Abbreviations and units of the measured physiological and morphological parameters. Photo: Net photosynthetic rate (μmol CO2 m−2·s−1); Gs: Conductance to H2O (mol H2O m−2·s−1); Ci: Intercellular carbon dioxide concentration (μmol CO2 mol−1); Trmmol: Transpiration rate (mmol H2O m−2·s−1). Morphological indicators: leaf length, leaf width, leaf circumference (unit: cm), and leaf area (unit: cm2). Photosynthetic pigments: chlorophyll a, chlorophyll b, and total chlorophyll content (unit: mg·g−1).
-
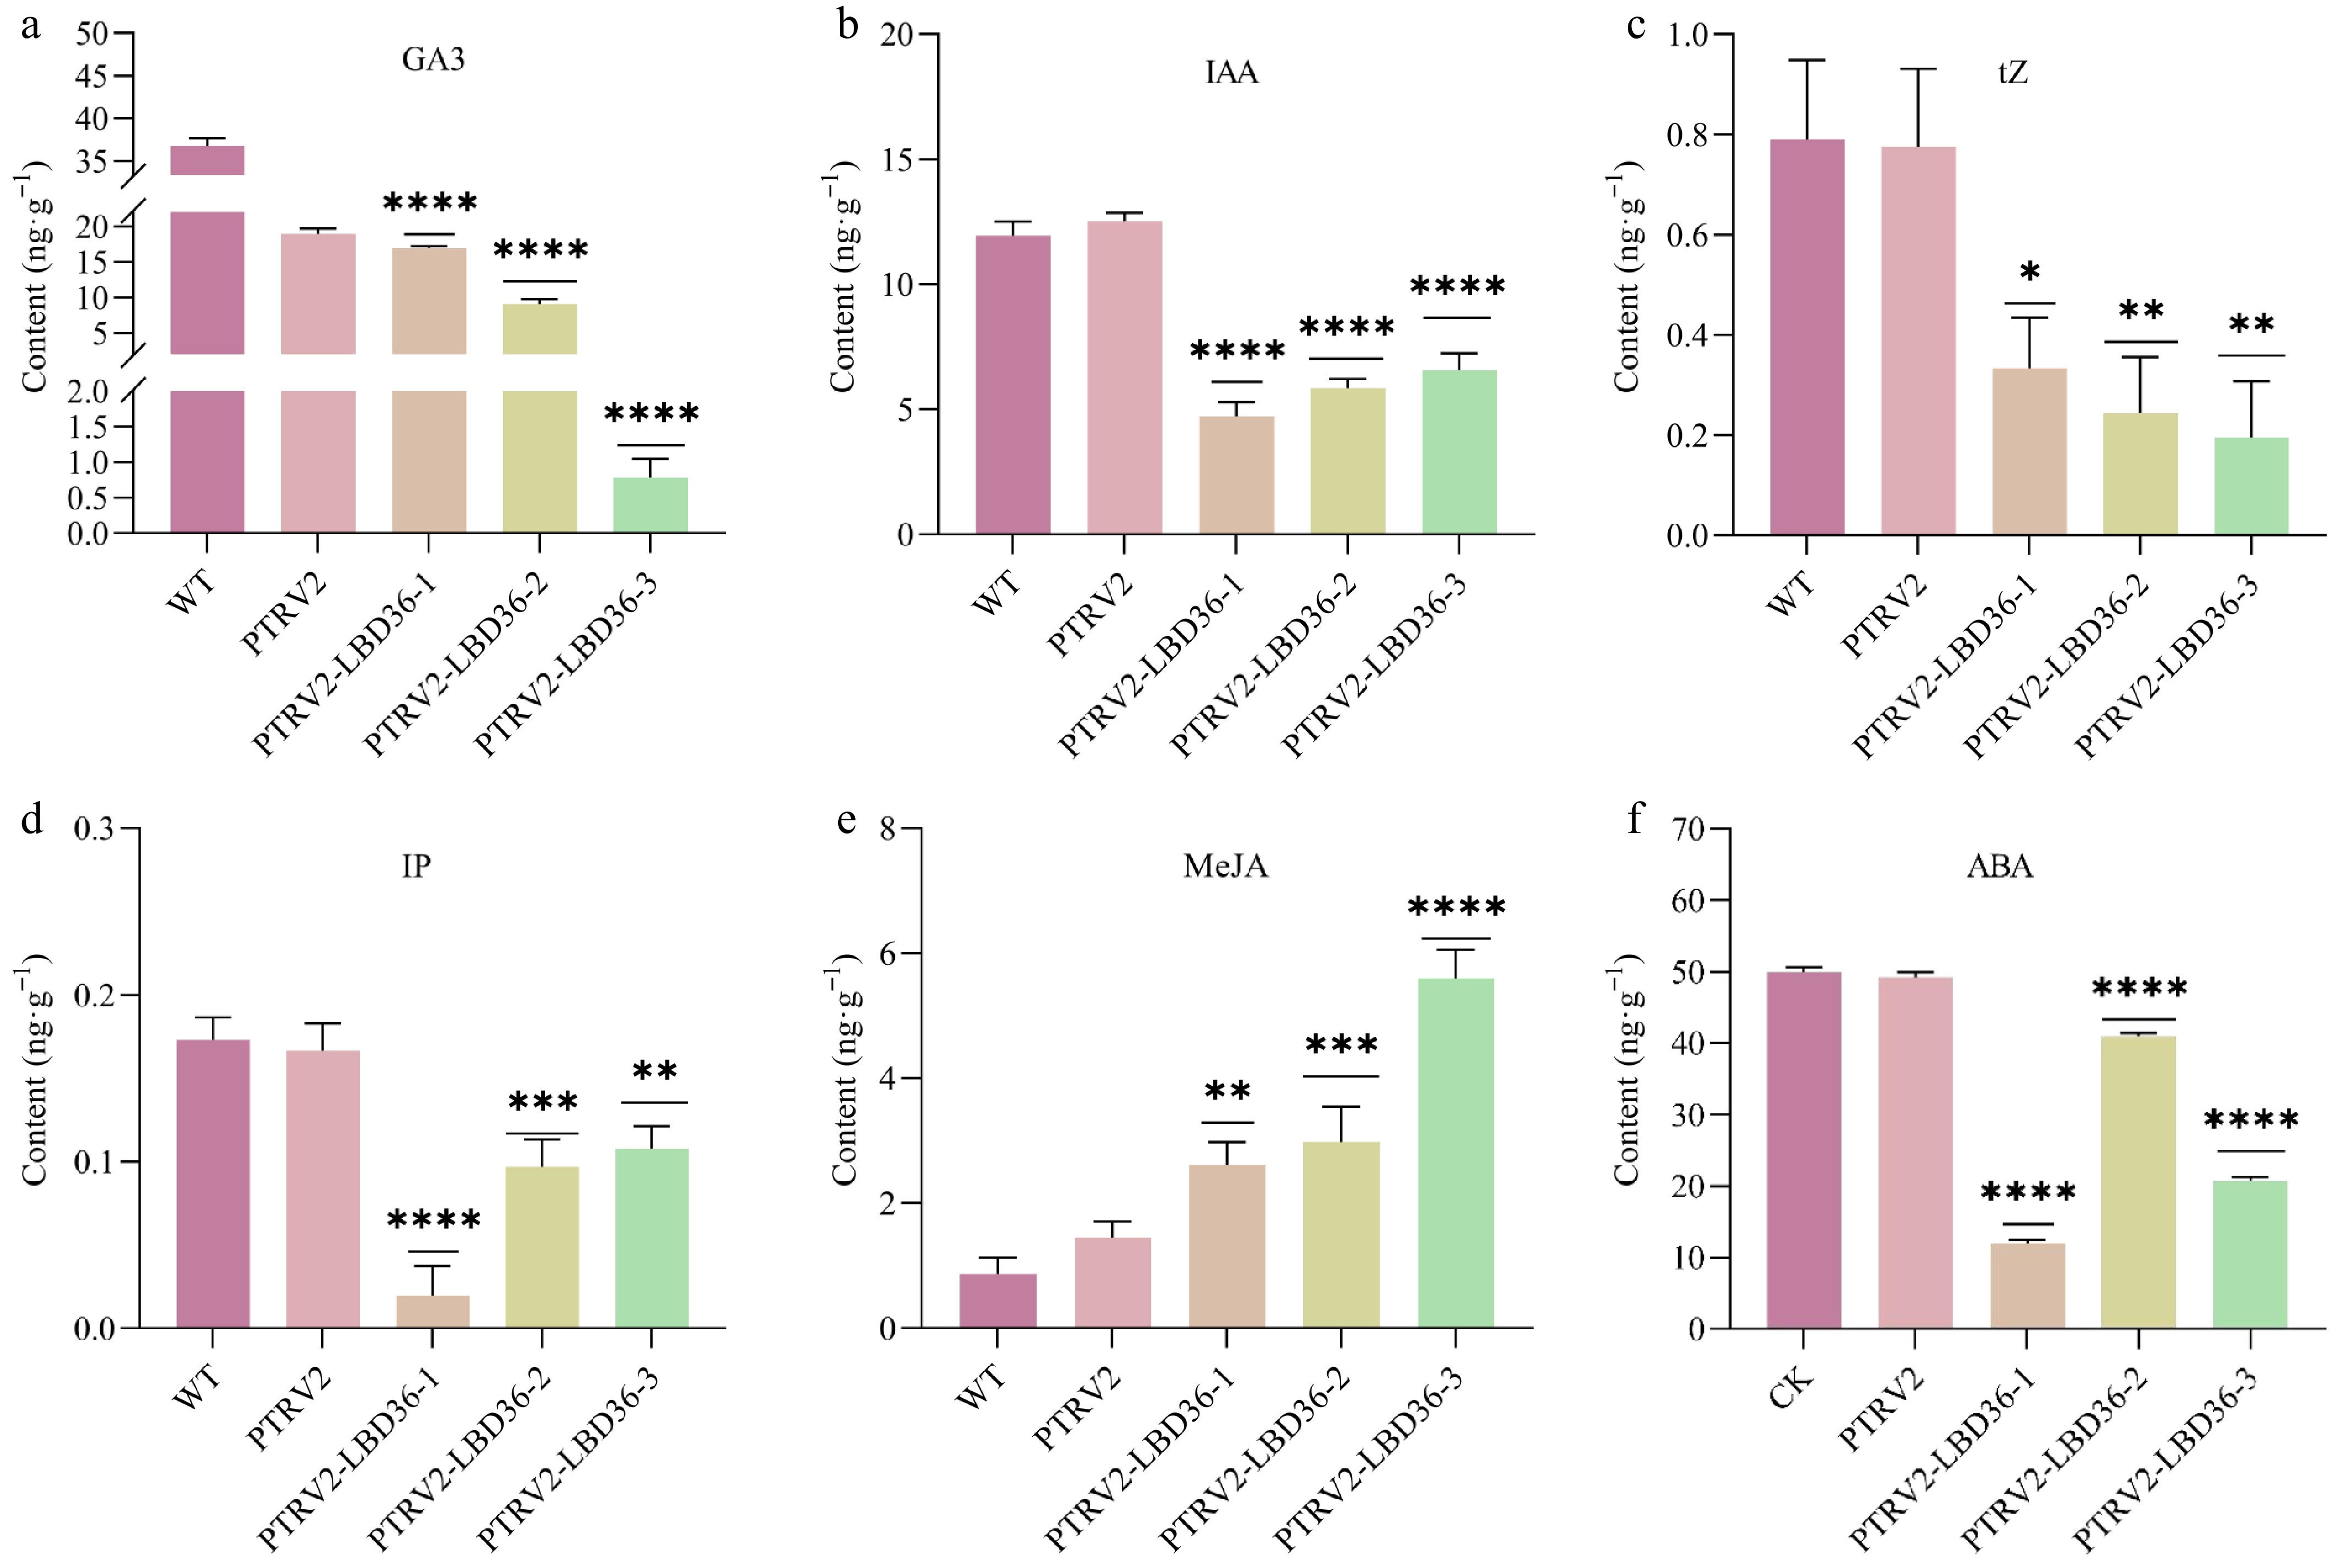
Figure 6.
Hormone content analysis of pepper leaf. Note: * indicates p ≤ 0.05, ** indicates p ≤ 0.01, *** indicates p ≤ 0.001, **** indicates p ≤ 0.0001.
-
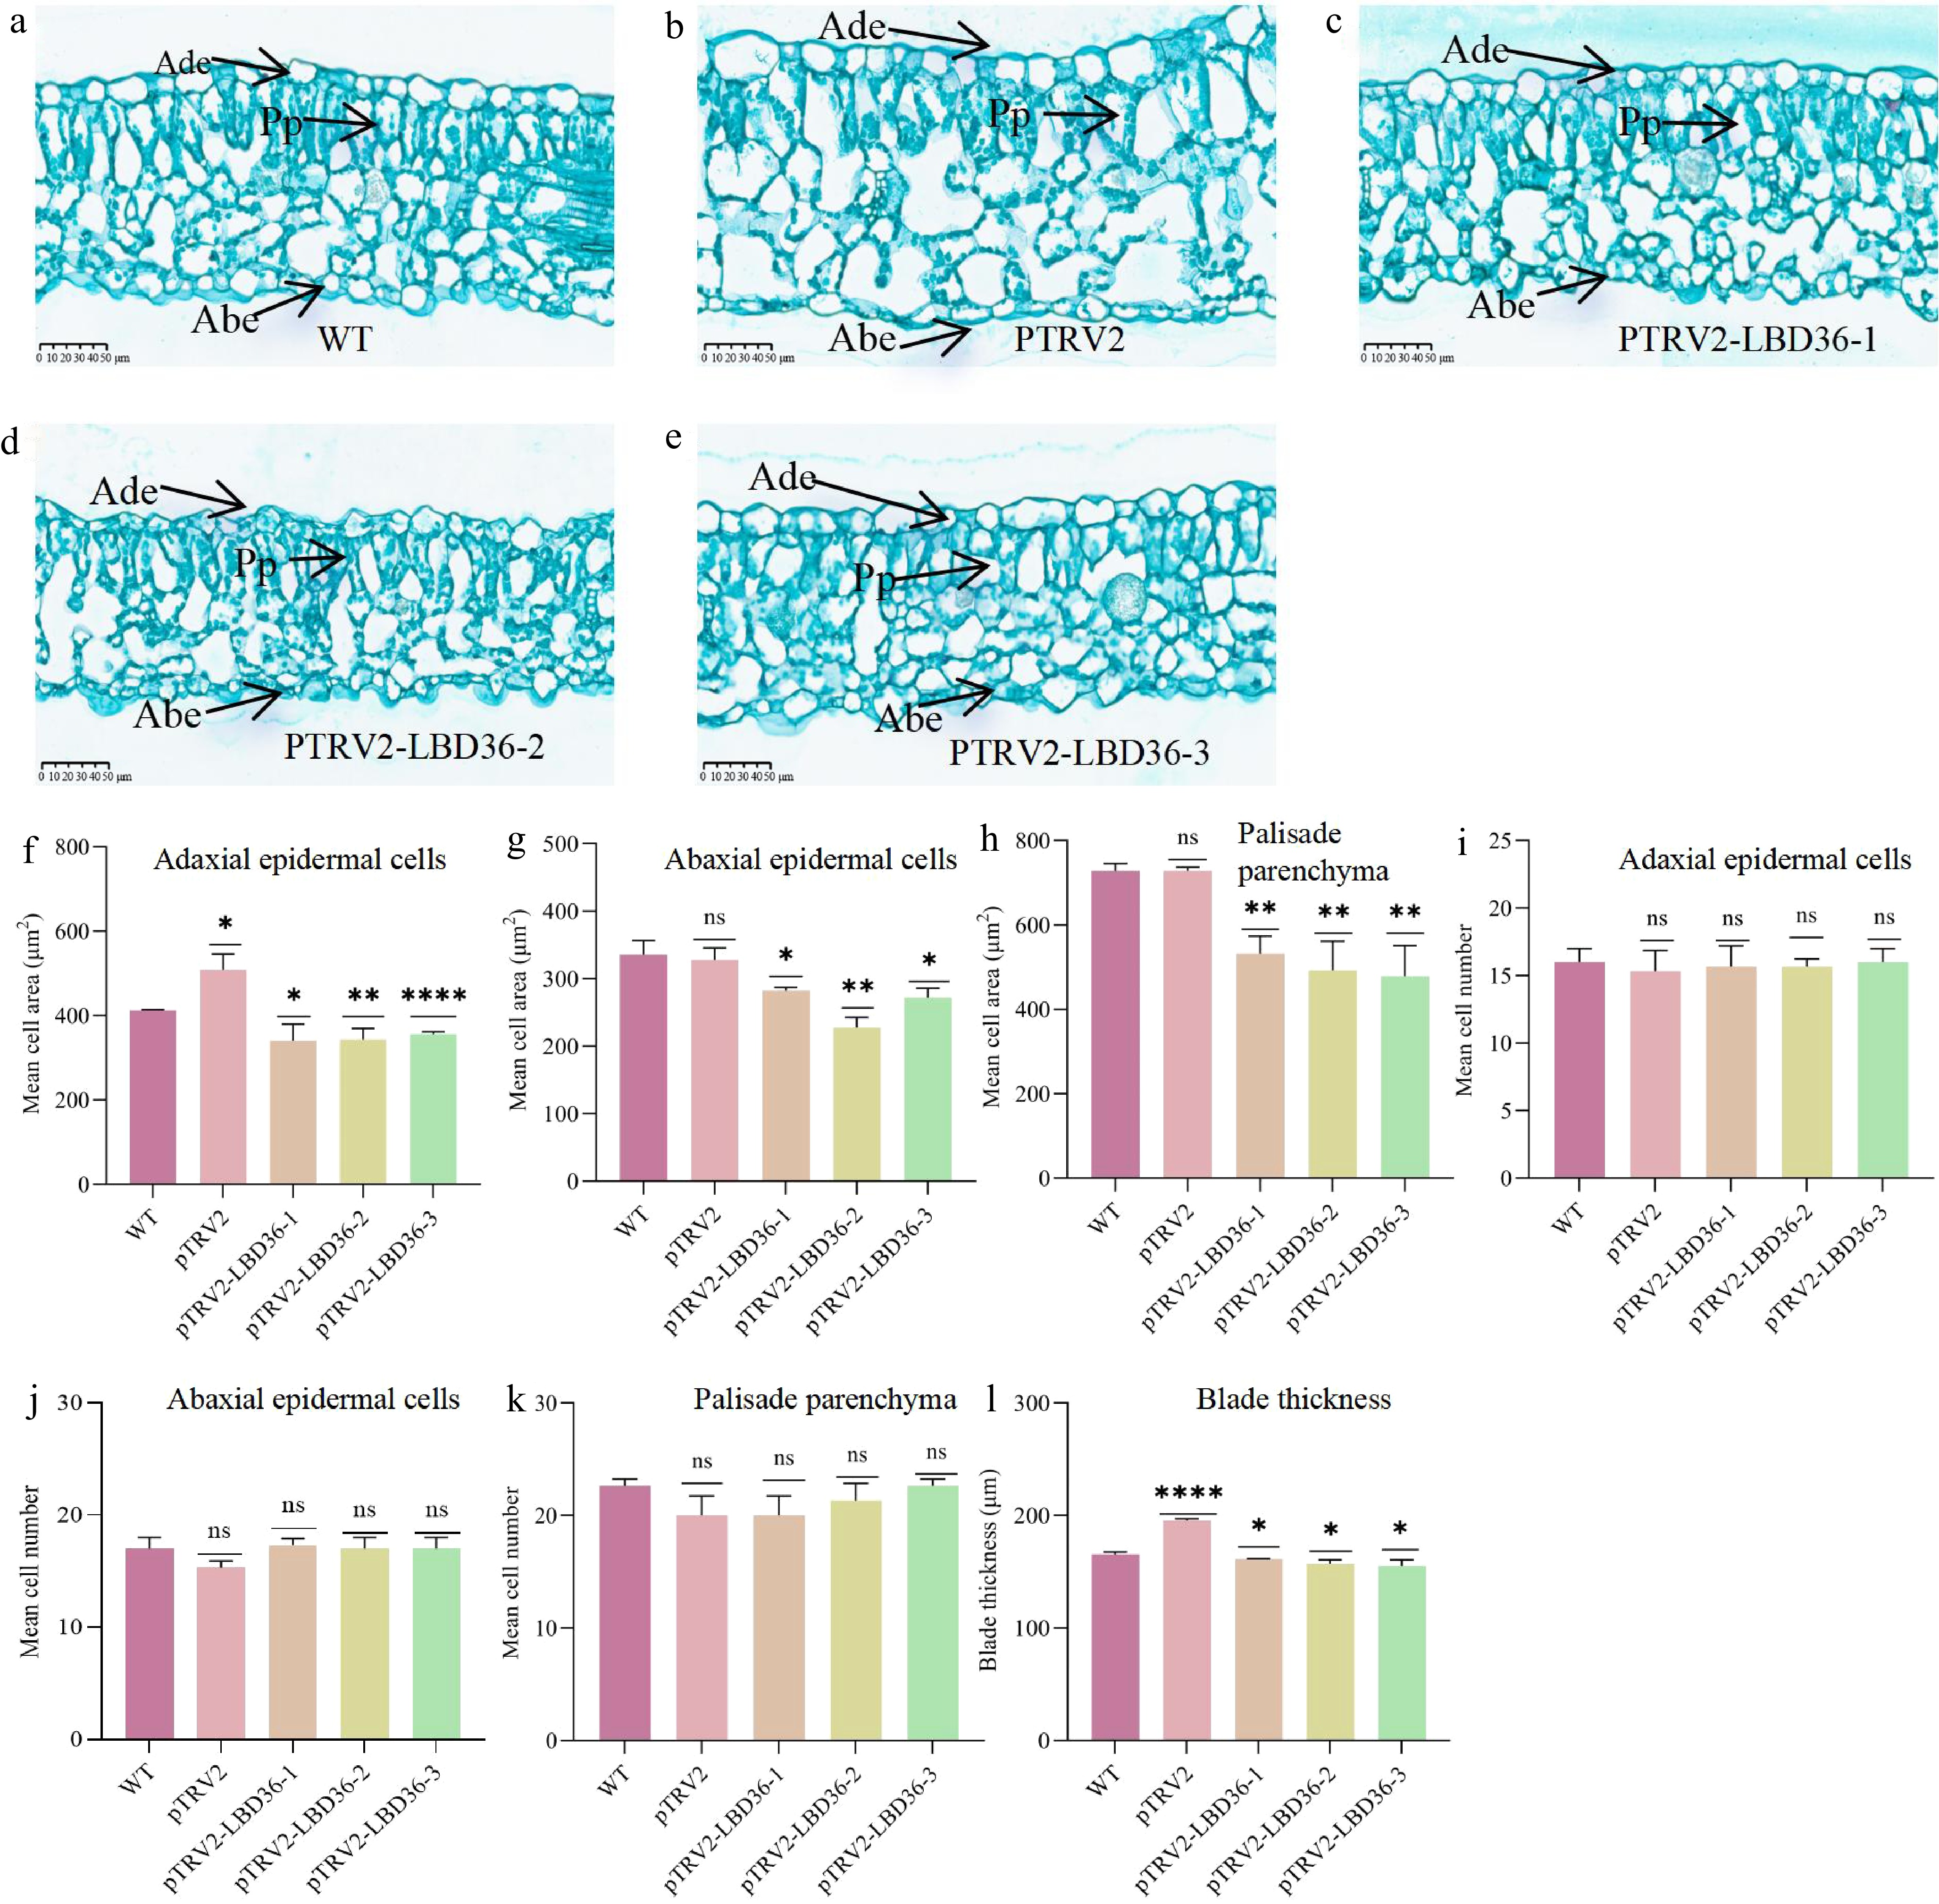
Figure 7.
Leaf anatomical structure and cellular phenotype analysis. Note: Ade indicates Adaxial epithelial cells; Abe indicates Abaxial epithelial cells; Pp indicates Palisade epithelial cells. * Indicates p ≤ 0.05, ** indicates p ≤ 0.01, *** indicates p ≤ 0.001, and **** indicates p ≤ 0.0001.
-
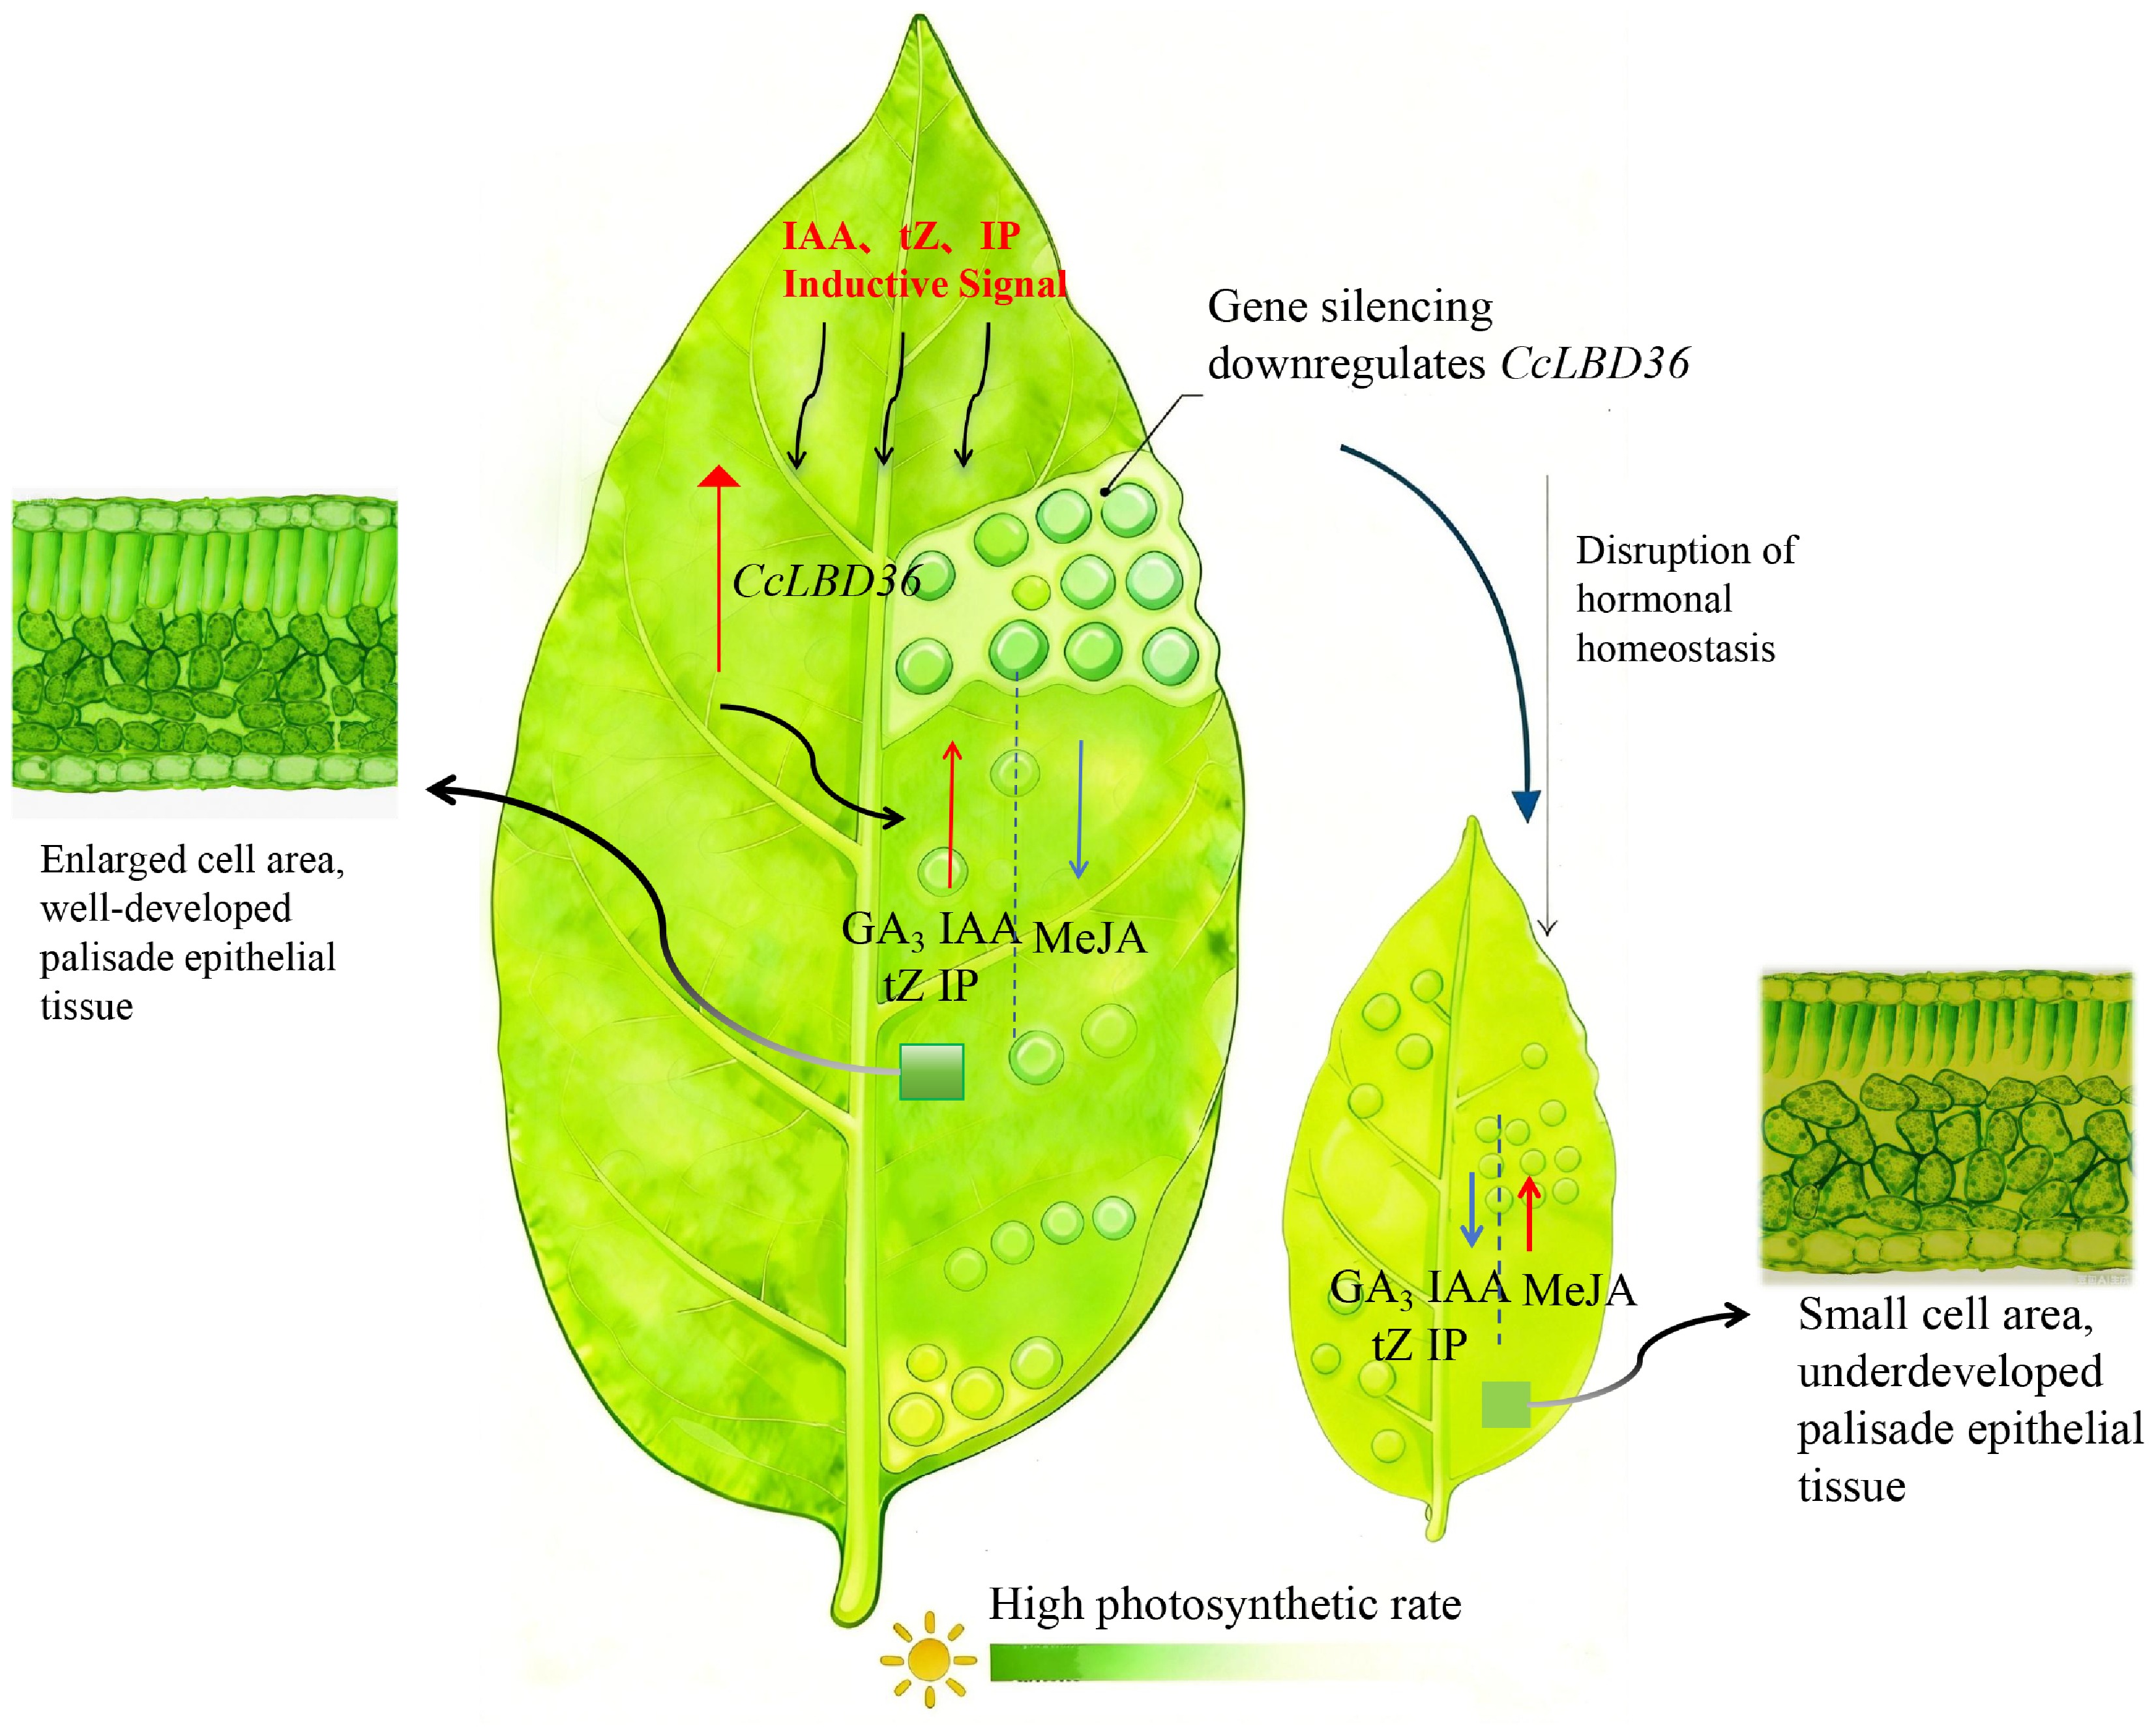
Figure 8.
Schematic model of GA3, IAA, tZ, IP and MeJA crosstalk regulating leaf photosynthetic efficiency upon CcLBD36 gene silencing. Note: Red upward arrows indicate up-regulated gene expression and increased hormone contents; blue downward arrows indicate decreased hormone contents; darker green indicates stronger leaf photosynthesis.
Figures
(8)
Tables
(0)