-
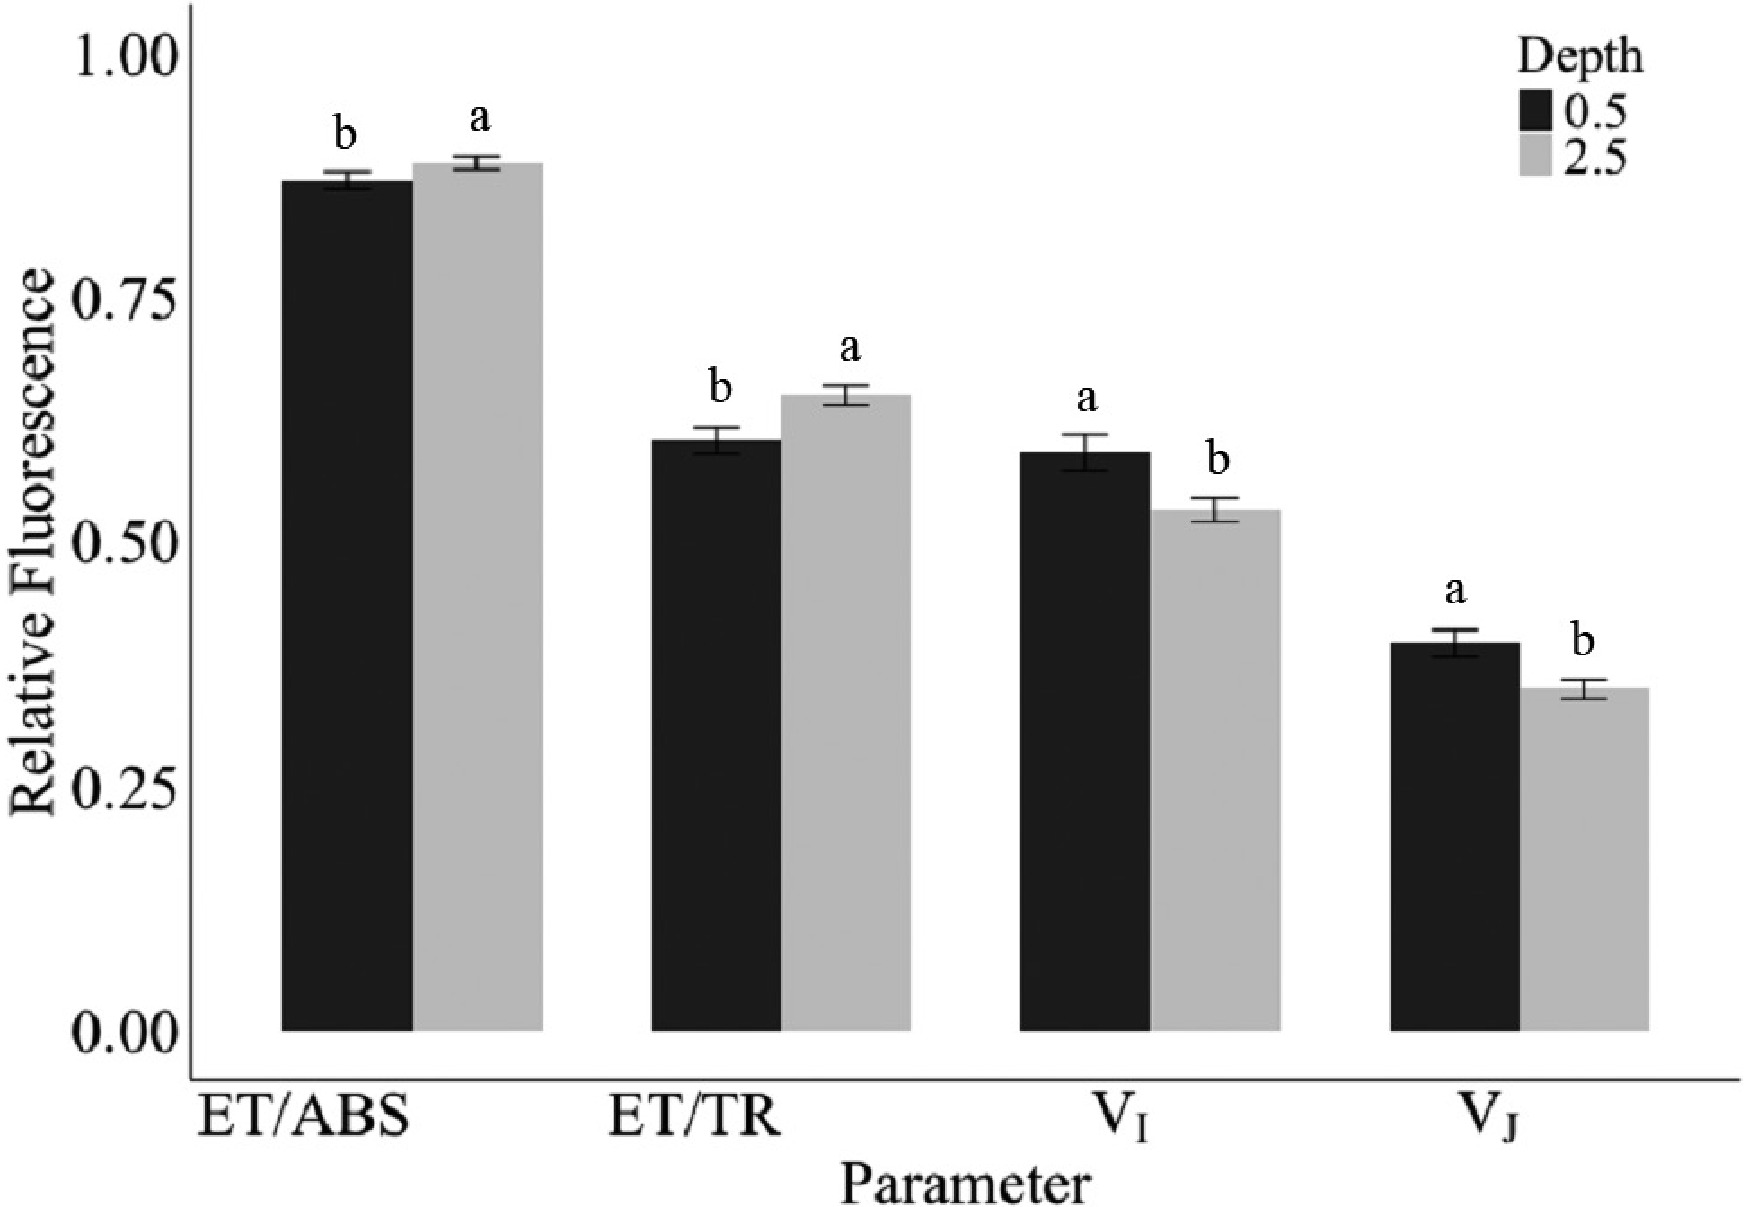
Figure 1.
Average relative fluorescence responses from parameters ET/ABS, ET/TR, VI, and VJ at seeding depth of 0.5-inch (black) and 2.5-inch (grey) across acclimation temperatures 25, 15, 10, 5, and 0 °C in growth chamber conditions. Error bars represent standard error. Letters are based on Fisher's least significant differences between depths on each parameter (p ≤ 0.05).
-
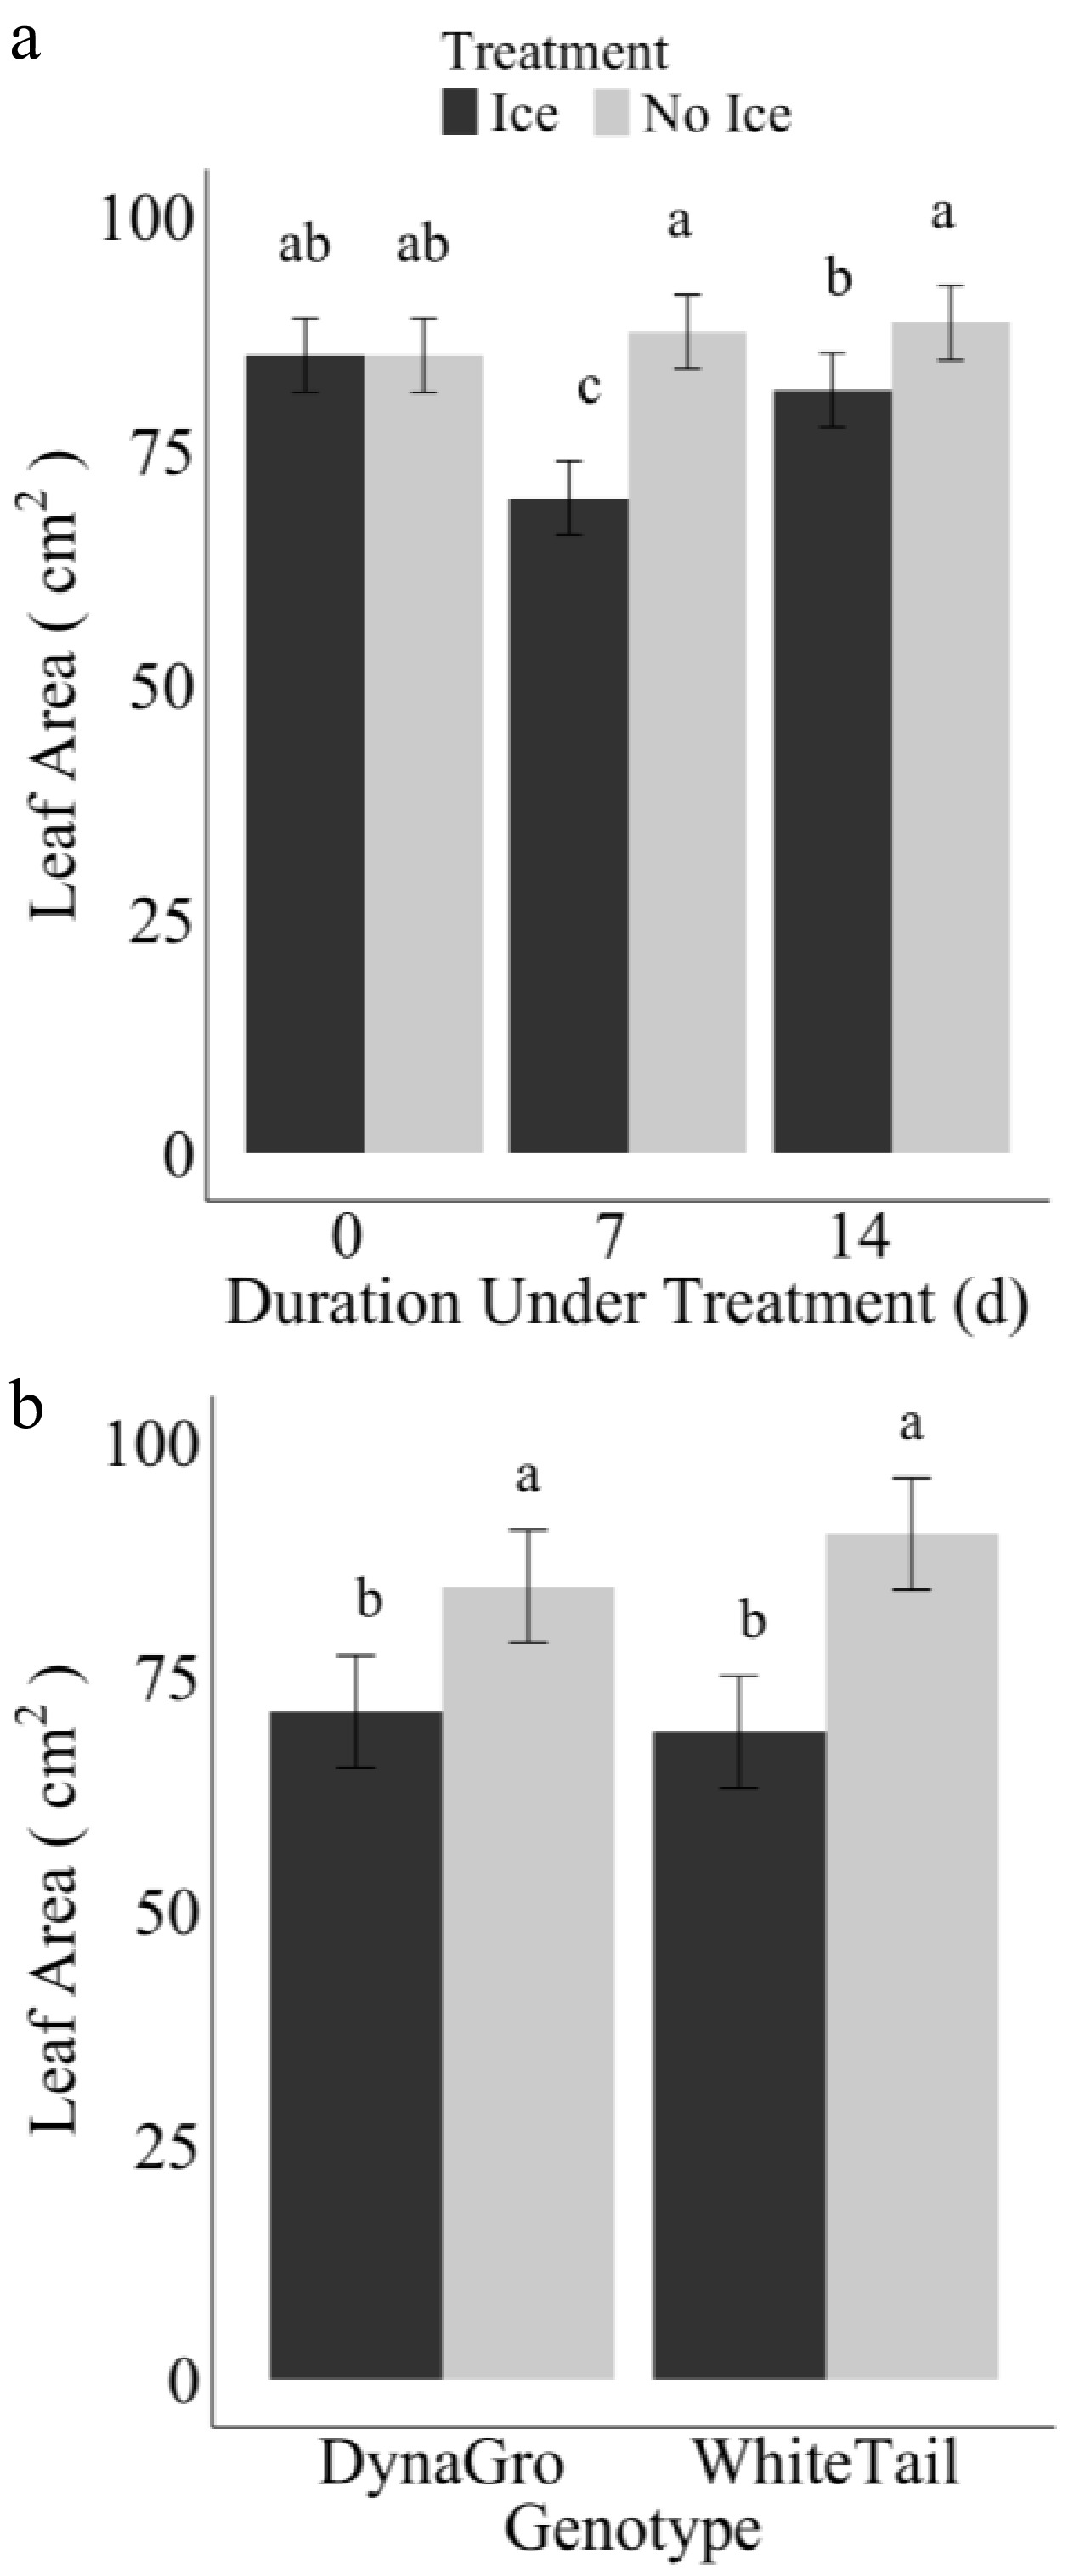
Figure 2.
Average leaf area (cm2) of winter wheat plants after ice or no ice treatment (−1 °C) for duration of (a) 7 or 14 d, and (b) the interaction of genotypes DynaGro and WhiteTail and treatment of ice (dark grey) and no ice (light grey) on day seven after treatment during de-acclimation (4, 10, and 15 °C) in growth chamber and greenhouse conditions (24 °C). Error bars represent standard error. Letters are based on Fisher's protected least significant difference for the comparison of means between treatment and genotype (p ≤ 0.05).
-
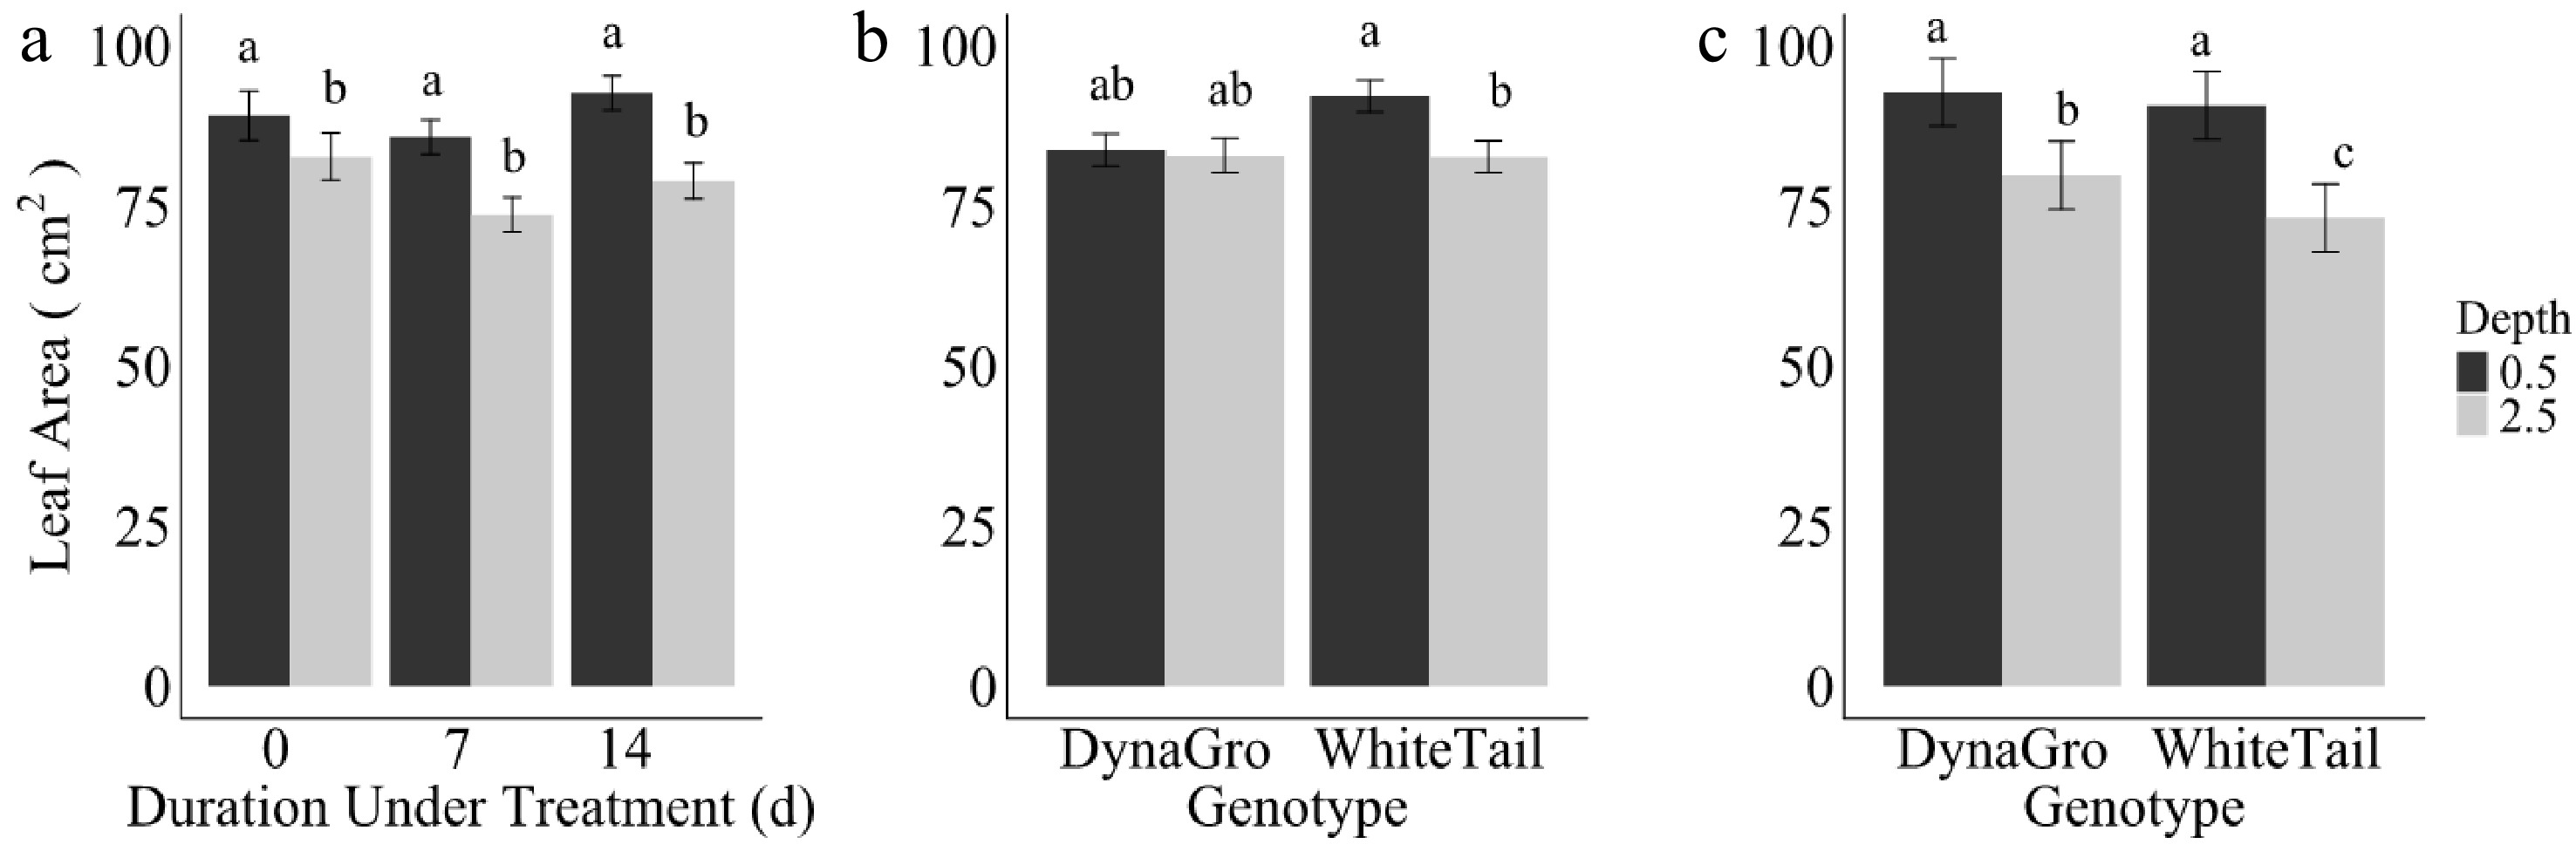
Figure 3.
Average leaf area (cm2) for (a) main effect of depth at 1.27 cm (dark grey) or 6.35 cm (light grey) for durations 0, 7, and 14 d, (b) interaction between genotypes DynaGro and WhiteTail recovery after treatments (−1 °C) during de-acclimation (4, 10, and 15 °C) in growth chamber and greenhouse conditions (24 °C) of winter wheat plants on day zero, and (c) day 14. Error bars represent standard error. Letters are based on Fisher's least significant difference (LSD) mean comparisons (p ≤ 0.05).
-
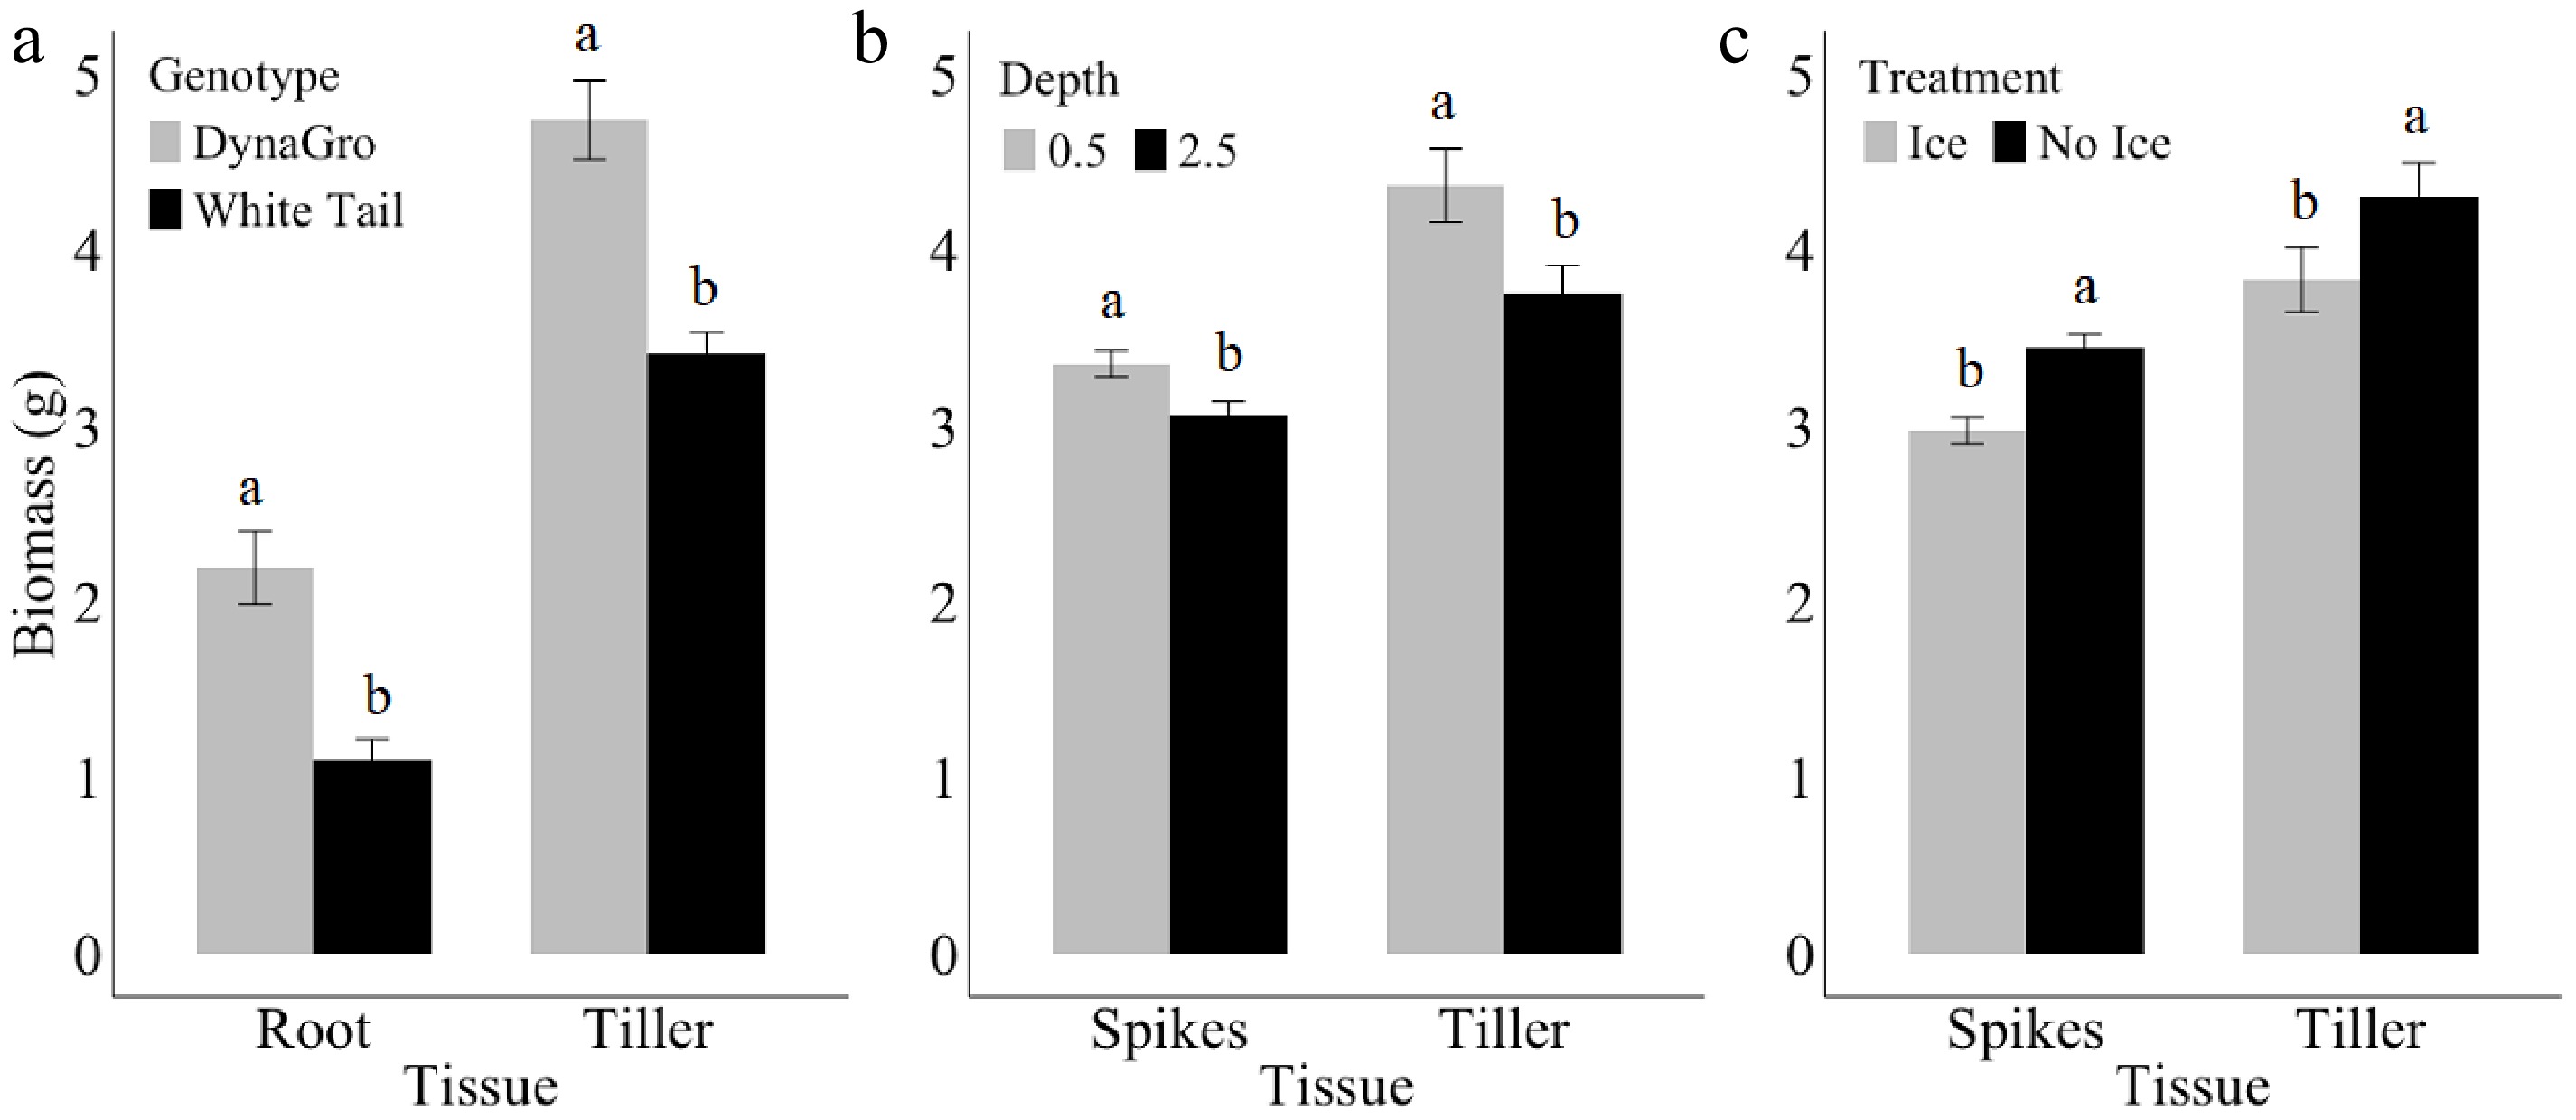
Figure 4.
Biomass (g) of (a) roots and tillers in DynaGro (grey) and WhiteTail (black), (b) spikes and tillers in 1.27 or 6.37 cm seeding depth, and (c) between ice (grey) and no ice (black) treatment in spikes and tillers. Error bars represent standard error. Letters are based on Fisher's least significant difference (LSD) mean comparisons (p ≤ 0.05).
-
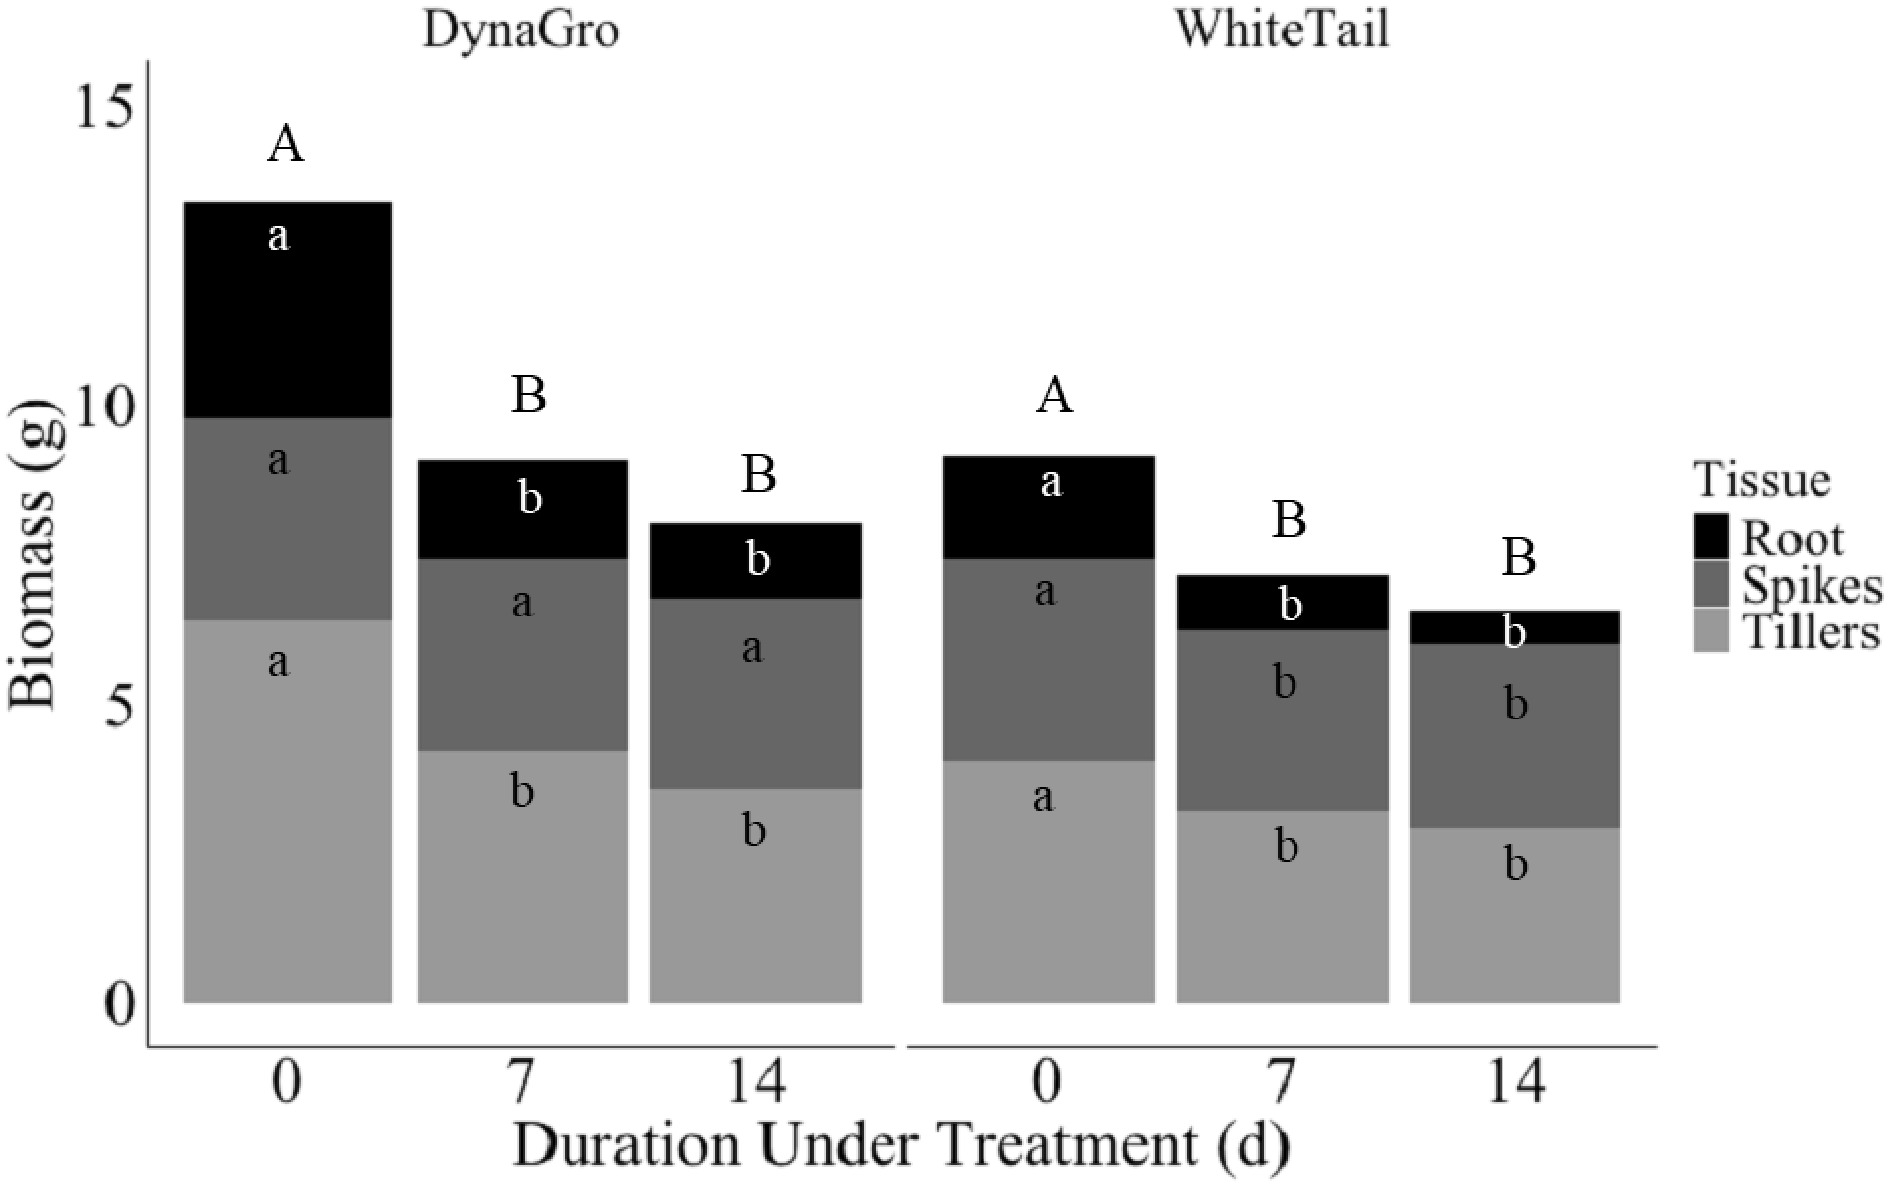
Figure 5.
Biomass (g) in DynaGro (left) and WhiteTail (right) across duration under treatment of 0, 7, or 14 d in root (black), spikes (dark grey), and tillers (light grey). Uppercase letters indicate Fisher's least significant difference between duration of treatment, white lowercase letters represent Fisher's least significant difference between root, and grey lowercase letters represent Fisher's least significant differences between spikes or tillers at p ≤ 0.05. Mean of two sowing depths.
-
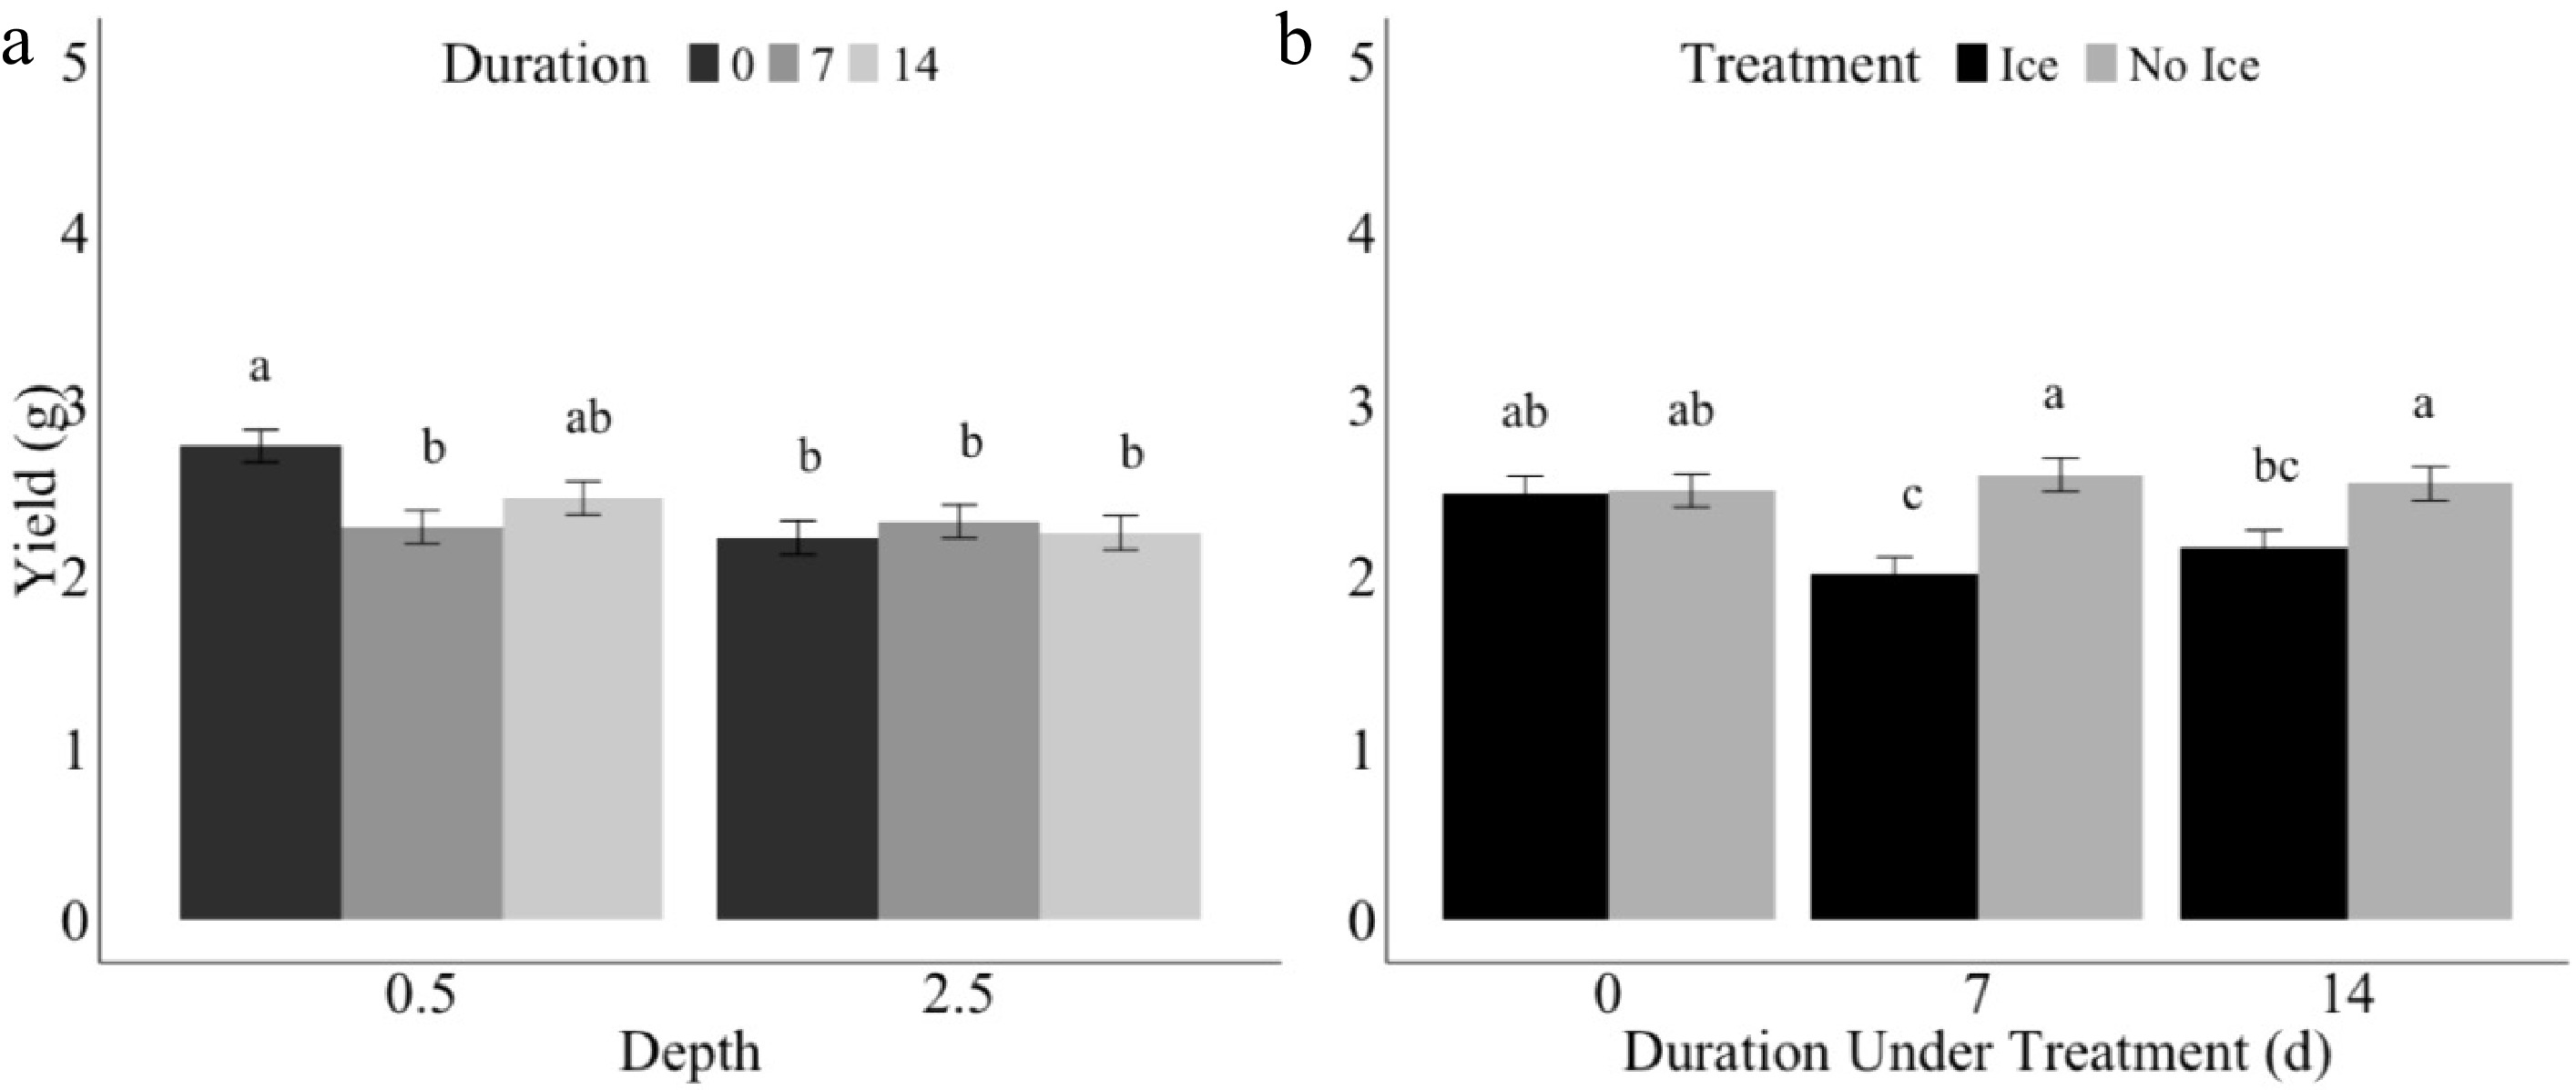
Figure 6.
Yield (g) of winter wheat plants sown at (a) 1.27 or 6.35 cm after 0 (black), 7 (dark grey), or 14 (light grey) d under ice treatment, and (b) yield (g) in ice (black) and or no ice (dark grey) treatments under 0, 7, or 14 d under treatment. Error bars represent standard error. Letters indicate Fisher's least significant difference (LSD) for comparison of means at p ≤ 0.05.
-
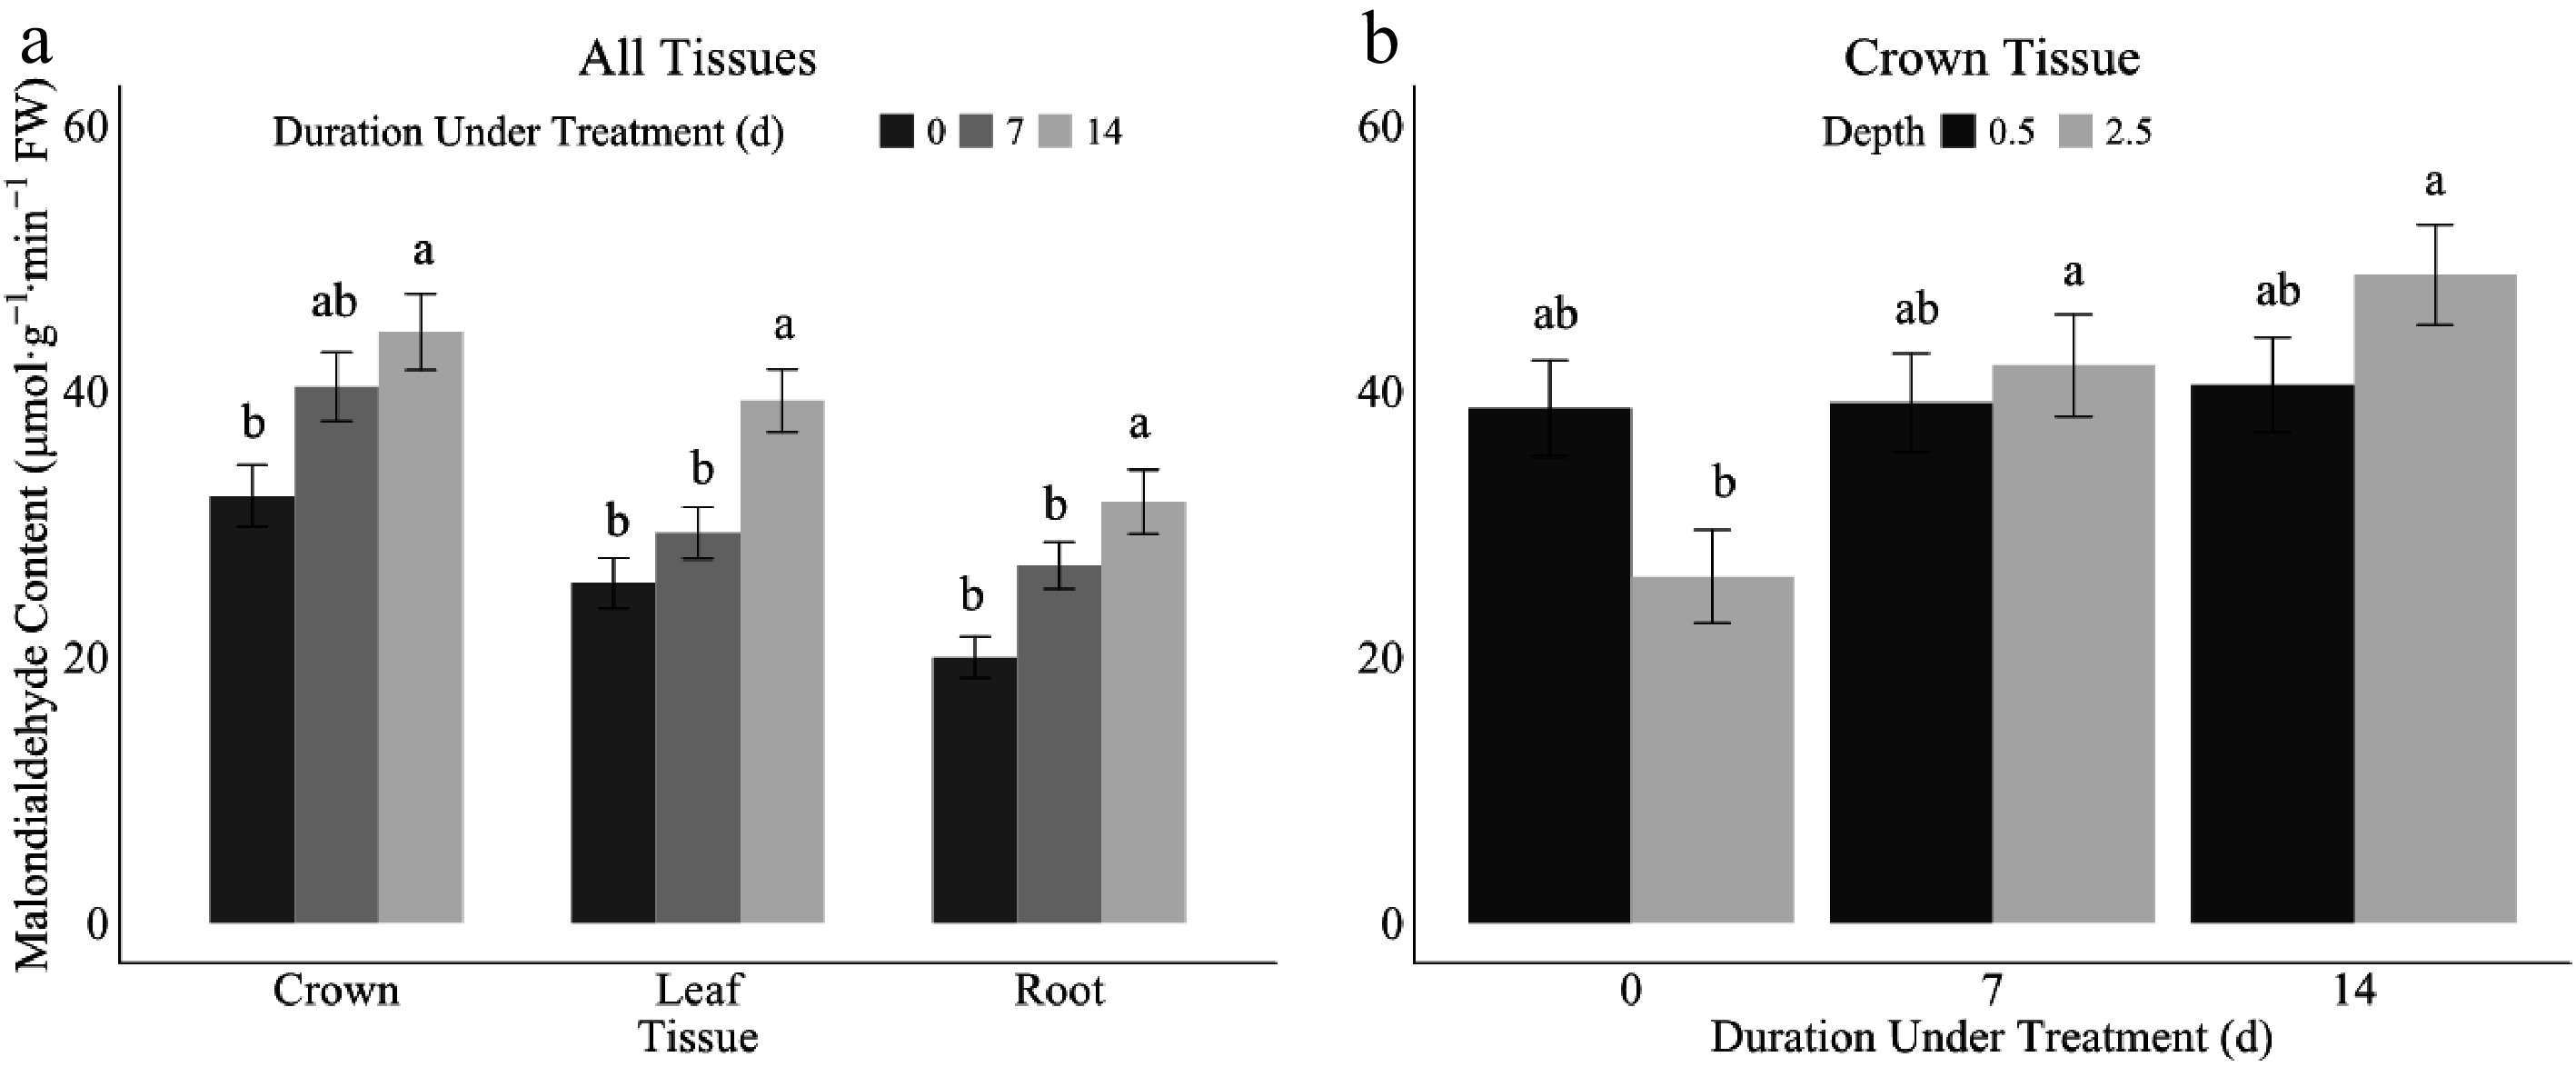
Figure 7.
Malondialdehyde content (MDA) in crown, leaf, and root tissues under 0 (dark grey), 7 (mid-grey), or 14 (dark grey) d under ice encasement (a) and crown tissue 1.27 (black) and 6.37 cm (light grey) depth under 0, 7, or 14 d under treatment. (b) Error bars represent standard error. Letters indicate Fisher's least significant difference (LSD) for comparison of means at p ≤ 0.05.
-
Parameter Calculation Description Fv/Fm (Fm − Fo)/Fm Ratio of variable fluorescence (Fv) to maximal fluorescence (Fm) indicating the maximum quantum yield of primary photosystem II (PSII) photochemistry. F0 is the minimal fluorescence. Fv/Fo (Fm − Fo)/Fo Proportional to the activity of the water-splitting complex on the donor side of the PSII. VJ (Fj − Fo)/(Fm − Fo) Relative variable fluorescence at 2 ms (Vj). For unconnected PSII units, this equals the fraction of closed RCs expressed as proportion of the total number of RCs (QA reduction). VI (Fi − Fo)/(Fm − Fo) Represents probability or efficiency of electron transport from specific electron carrier to a subsequent carrier leading to the reduction at the end of electron acceptor (QA turnovers). ET/TR (φ0) 1 − VJ Electron transport (ET) to trapping flux (TR) ratio indicating the probability that an electron residing on QA will enter the electron transport chain. ET/ABS (φE0) [(1 − Fo/Fm)](1 − VJ) Quantum yield for electron transport – how effectively absorbed light is utilized for electron transport. ABS is the absorption flux. RE/ET(δR0) (1 − VI)/(1 − VJ) Measures the efficiency with which an electron is transferred from the reduced intersystem electron acceptors to the final Photosystem I (PSI) end acceptors Do (φDo) 1 − Fv/Fm The fraction of light energy absorbed by chlorophyll molecule that is not used for photochemistry. Table 1.
OJIP parameters with calculations and descriptions.
-
Effect Fv/Fm Fv/Fo Vi Vj RE/ET ET/TR ET/ABS Do Genotype (G) NS NS NS NS NS NS NS NS Depth (D) NS NS ** *** NS *** * NS Temperature (T) ** ** *** *** *** *** *** ** G × D NS NS NS NS NS NS NS NS G × T NS NS NS NS NS NS NS NS D × T NS NS NS * NS * NS NS G × D × T NS NS NS NS NS NS NS NS NS = non-significant (p ≤ 0.05); *, **, *** significant at p ≤ 0.05, p ≤ 0.01, p ≤ 0.001, respectively. Table 2.
Analysis of variance for OJIP parameters including Fv/Fm, Fv/Fo, VI, VJ, RE/ET, ET/TR, ET/ABS, ET/TR, and Do in response to genotype, depth, and acclimation temperatures (25, 15, 10, 5, and 0 °C) in growth chamber conditions.
-
Temperature
(°C)Fv/Fm Fv/Fo VI VJ RE/ET ET/TR ET/ABS Do 25 0.75 a 3.17 a 0.51 b 0.30 b 0.70 ab 0.70 a 0.92 a 0.25 c 15 0.69 b 2.68 b 0.49 b 0.34 b 0.77 a 0.66 a 0.90 b 0.30 b 10 0.69 b 2.64 b 0.50 b 0.33 b 0.75 a 0.67 a 0.89 b 0.31 b 5 0.68 bc 2.40 bc 0.65 a 0.43 a 0.60 c 0.57 b 0.86 c 0.32 b 0 0.64 c 2.14 c 0.63 a 0.43 a 0.64 bc 0.57 b 0.84 c 0.35 a Table 3.
Relative fluorescence responses from parameters Fv/Fm, Fv/Fo, VI, VJ, RE/ET, ET/TR, ET/ABS, ET/TR, and Do across acclimation temperatures 25, 15, 10, 5, and 0 °C in growth chamber conditions. Letters are based on Fisher's least significant difference values (p ≤ 0.05).
-
Effect Leaf area MDA Biomass Yield Day zero Day seven Day 14 Leaf Crown Root Tillers Spikes Root Genotype (G) NS NS * NS NS NS *** NS *** * Depth (D) * *** *** NS NS NS ** ** NS ** Ice Treatment (T) NS *** *** NS NS NS * *** NS *** Duration Under Treatment (R) *** *** *** *** ** *** *** * *** NS G × D NS NS NS NS NS NS NS NS NS NS G × T NS NS NS NS NS NS NS NS NS NS D × T NS NS NS NS NS NS NS NS NS NS G × R NS NS NS NS NS NS ** NS * NS D × R NS NS NS NS ** NS NS NS * * T × R NS NS ** NS NS NS NS ** NS * G × D × T NS NS NS NS NS NS NS NS NS NS G × D × R NS NS ** NS NS NS NS * * * G × T × R NS NS NS NS NS NS NS NS NS NS D × T × R NS NS NS NS NS NS NS NS NS NS G × D × T × R NS NS NS NS NS NS NS NS NS NS NS = non-significant (p > 0.05); *, **, *** significant at p ≤ 0.05, p ≤ 0.01, p ≤ 0.001, respectively. Table 4.
Analysis of variance for leaf area, malondialdehyde (MDA) content, biomass, and yield for main treatment factors of Genotype (G), Depth (D), Recovery period (R) and Ice Treatment (T) on day zero, seven, or 14 during growth recovery for winter wheat plants during de-acclimation (4, 10, and 15 °C) in growth chamber and greenhouse conditions (24 °C). Recovery rate analysis of variance for Genotype (G), Duration Under Treatment (R), Ice Treatment (T), and Depth (D) under same conditions. Using mixed model procedure.
Figures
(7)
Tables
(4)