-
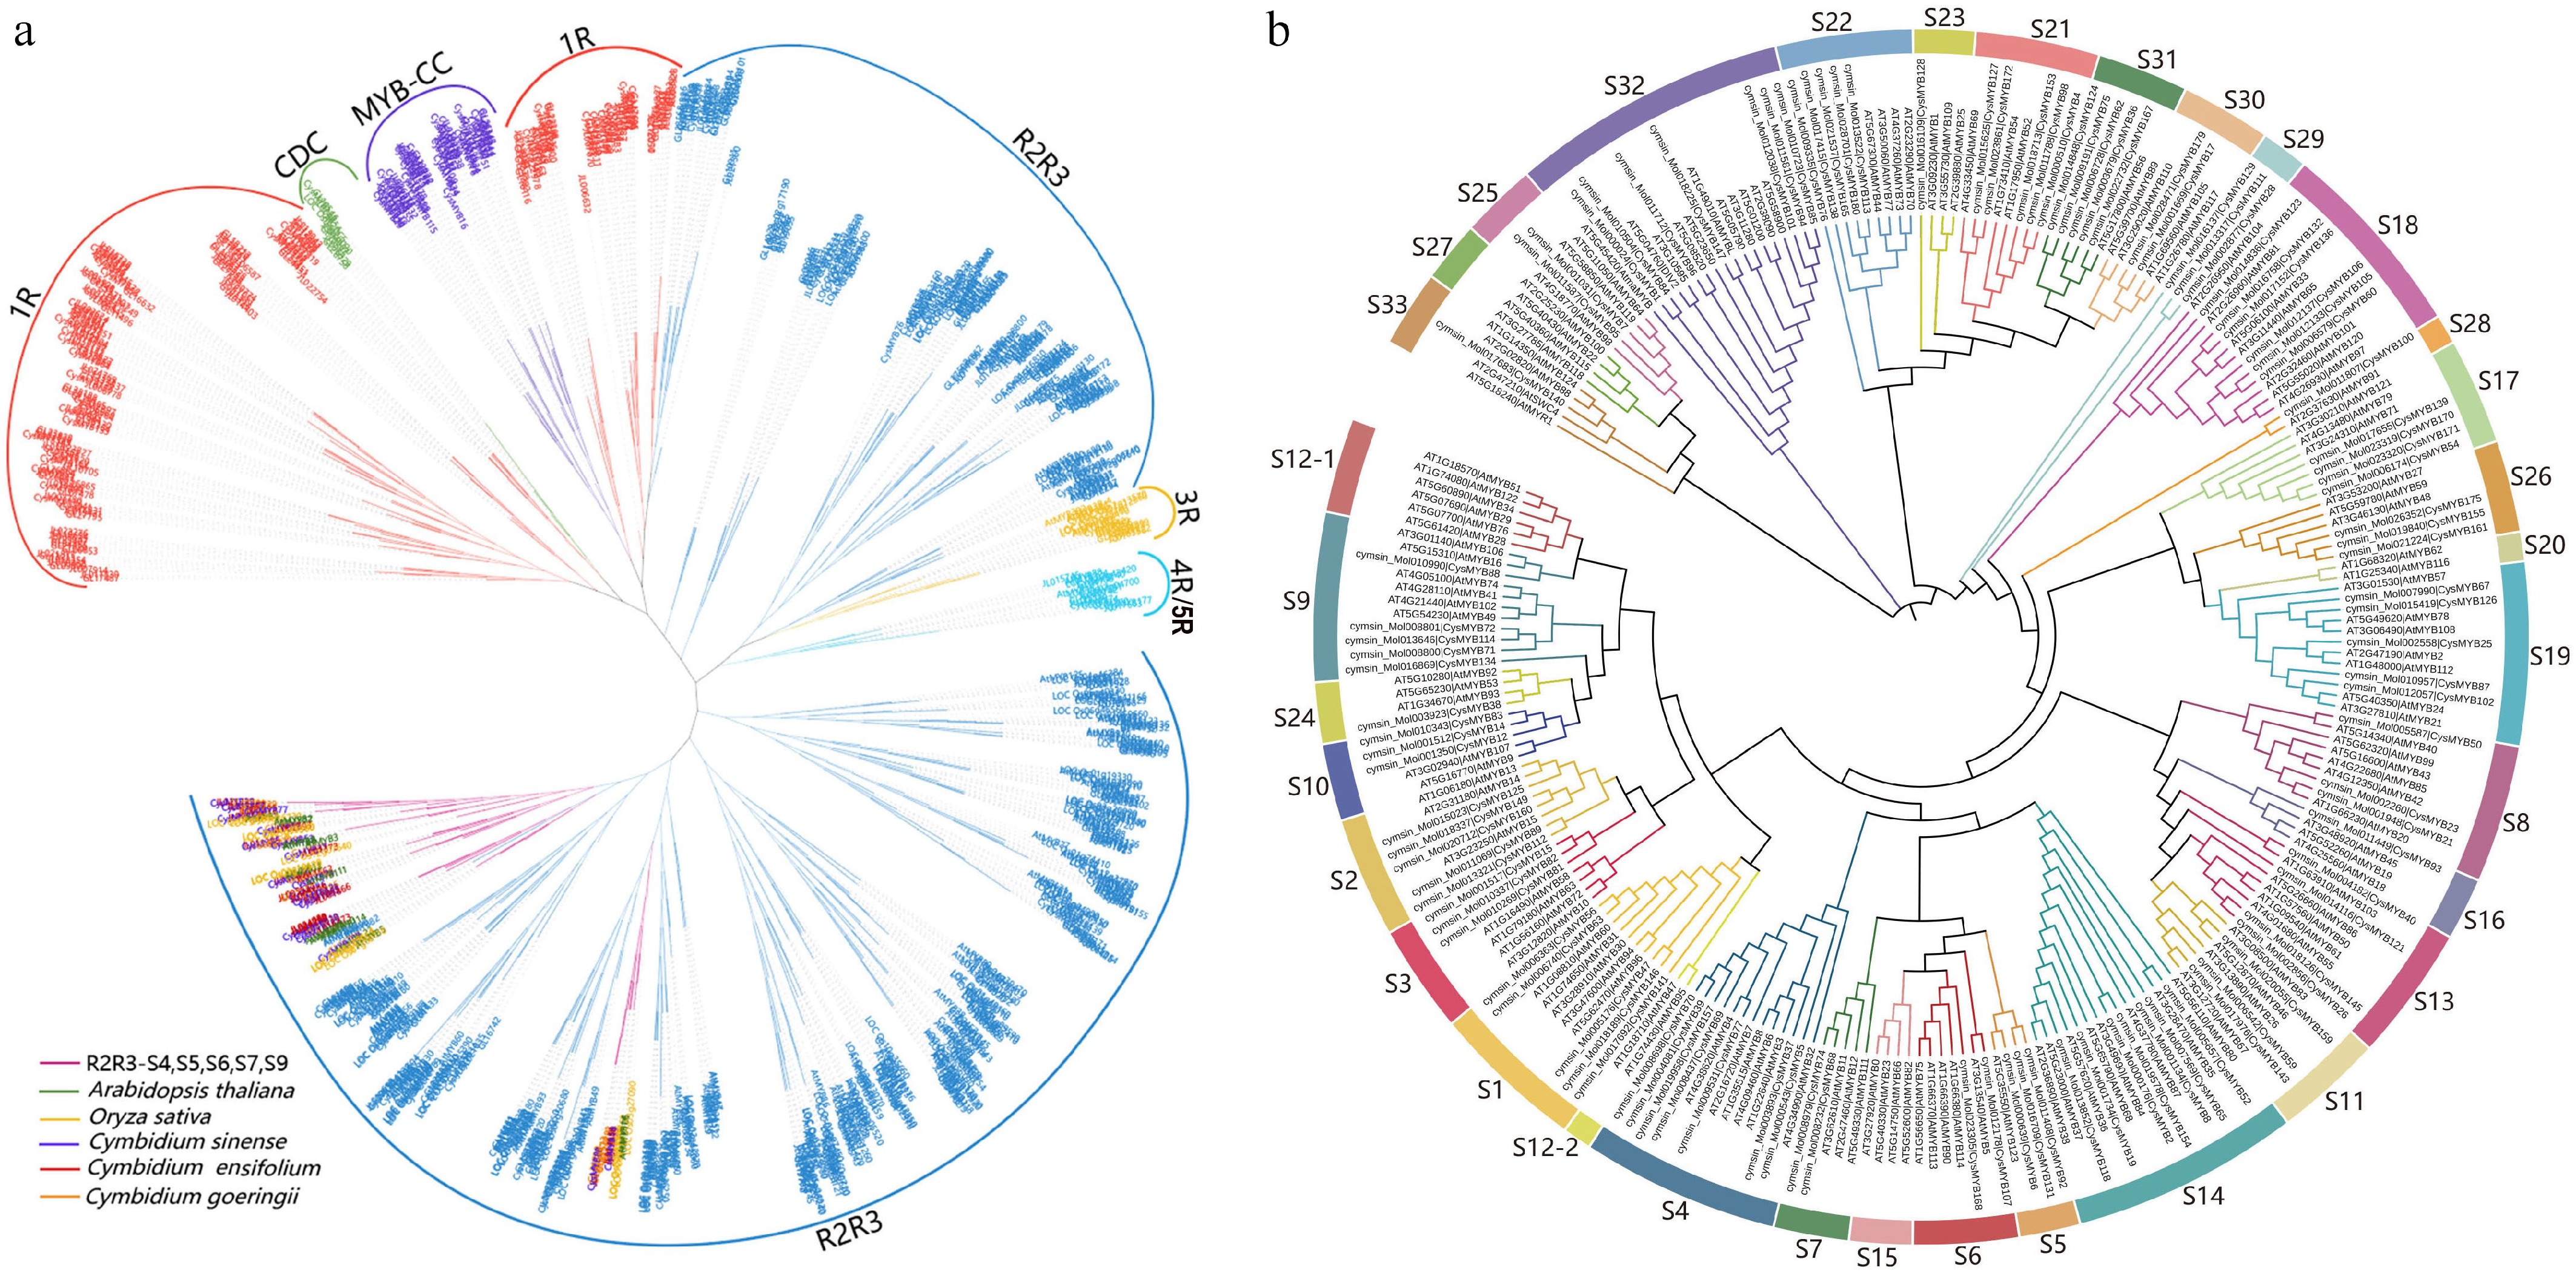
Figure 1.
Phylogenetic analysis of MYB proteins. The phylogenetic trees were constructed using MEGA X with the Maximum-likelihood (ML) method and 1,000 bootstrap replicates. (a) Phylogenetic tree of MYB gene families from five plant species, including A. thaliana, O. sativa, C. sinense, C. goeringii, and C. ensifolium. The tree was divided into six major groups, highlighted in different colors. Members from R2R3-S4, S5, S6, S7, and S9 subfamilies of the five species are marked with different colors. (b) Phylogenetic tree of R2R3-MYBs proteins of C. sinense and A. thaliana. The tree was classified into 33 phylogenetic subgroups (S1–S33), each indicated by a different color.
-
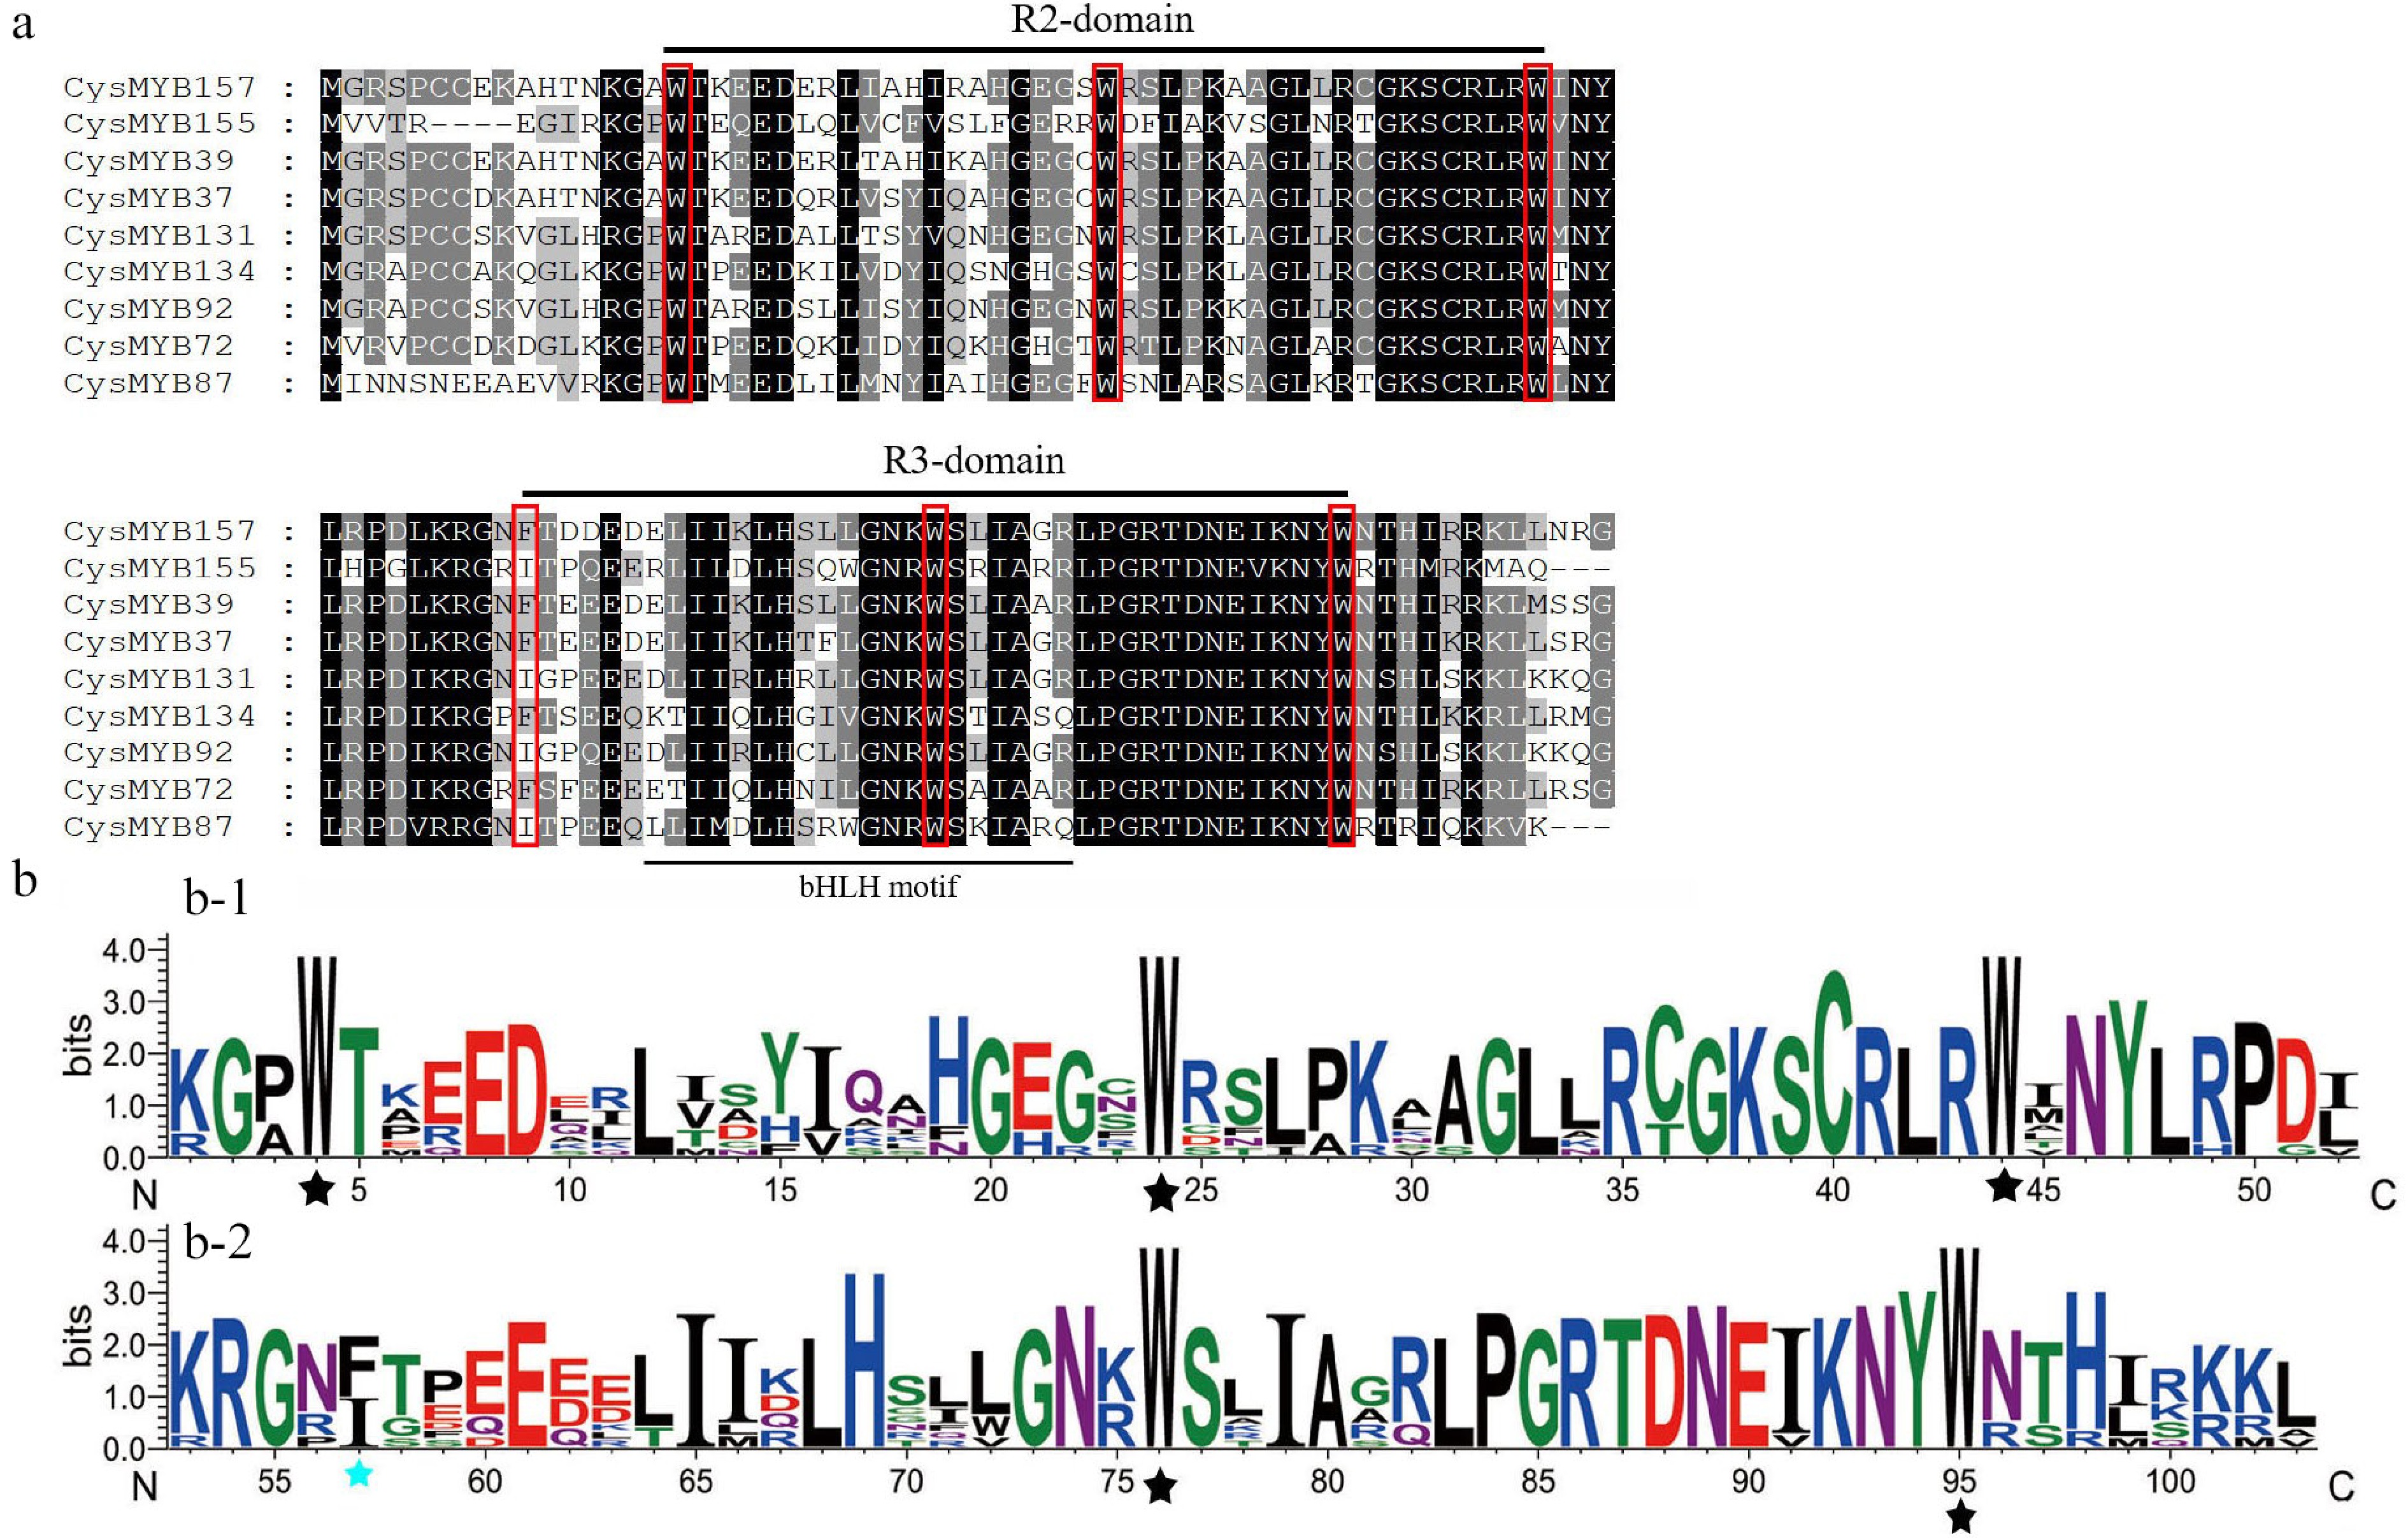
Figure 2.
Consensus sequences, and the level of conservation of R2R3-type and R3-MYB domains from C. sinense. (a) R2 and R3 domains, based on nine R2R3-MYB alignments. The conserved tryptophan residues (Trp, W) in the MYB domain and the replaced amino acid residues in the R3 repeat were indicated with red boxes. (b) Sequence logos of the R2 and R3 MYB repeats were obtained based on full-length alignments of 104 R2R3-CysMYB. Black asterisks indicate the W residues in R2 and R3 domains, while the blue asterisk indicates the replaced amino acid residues in the R3 repeat.
-
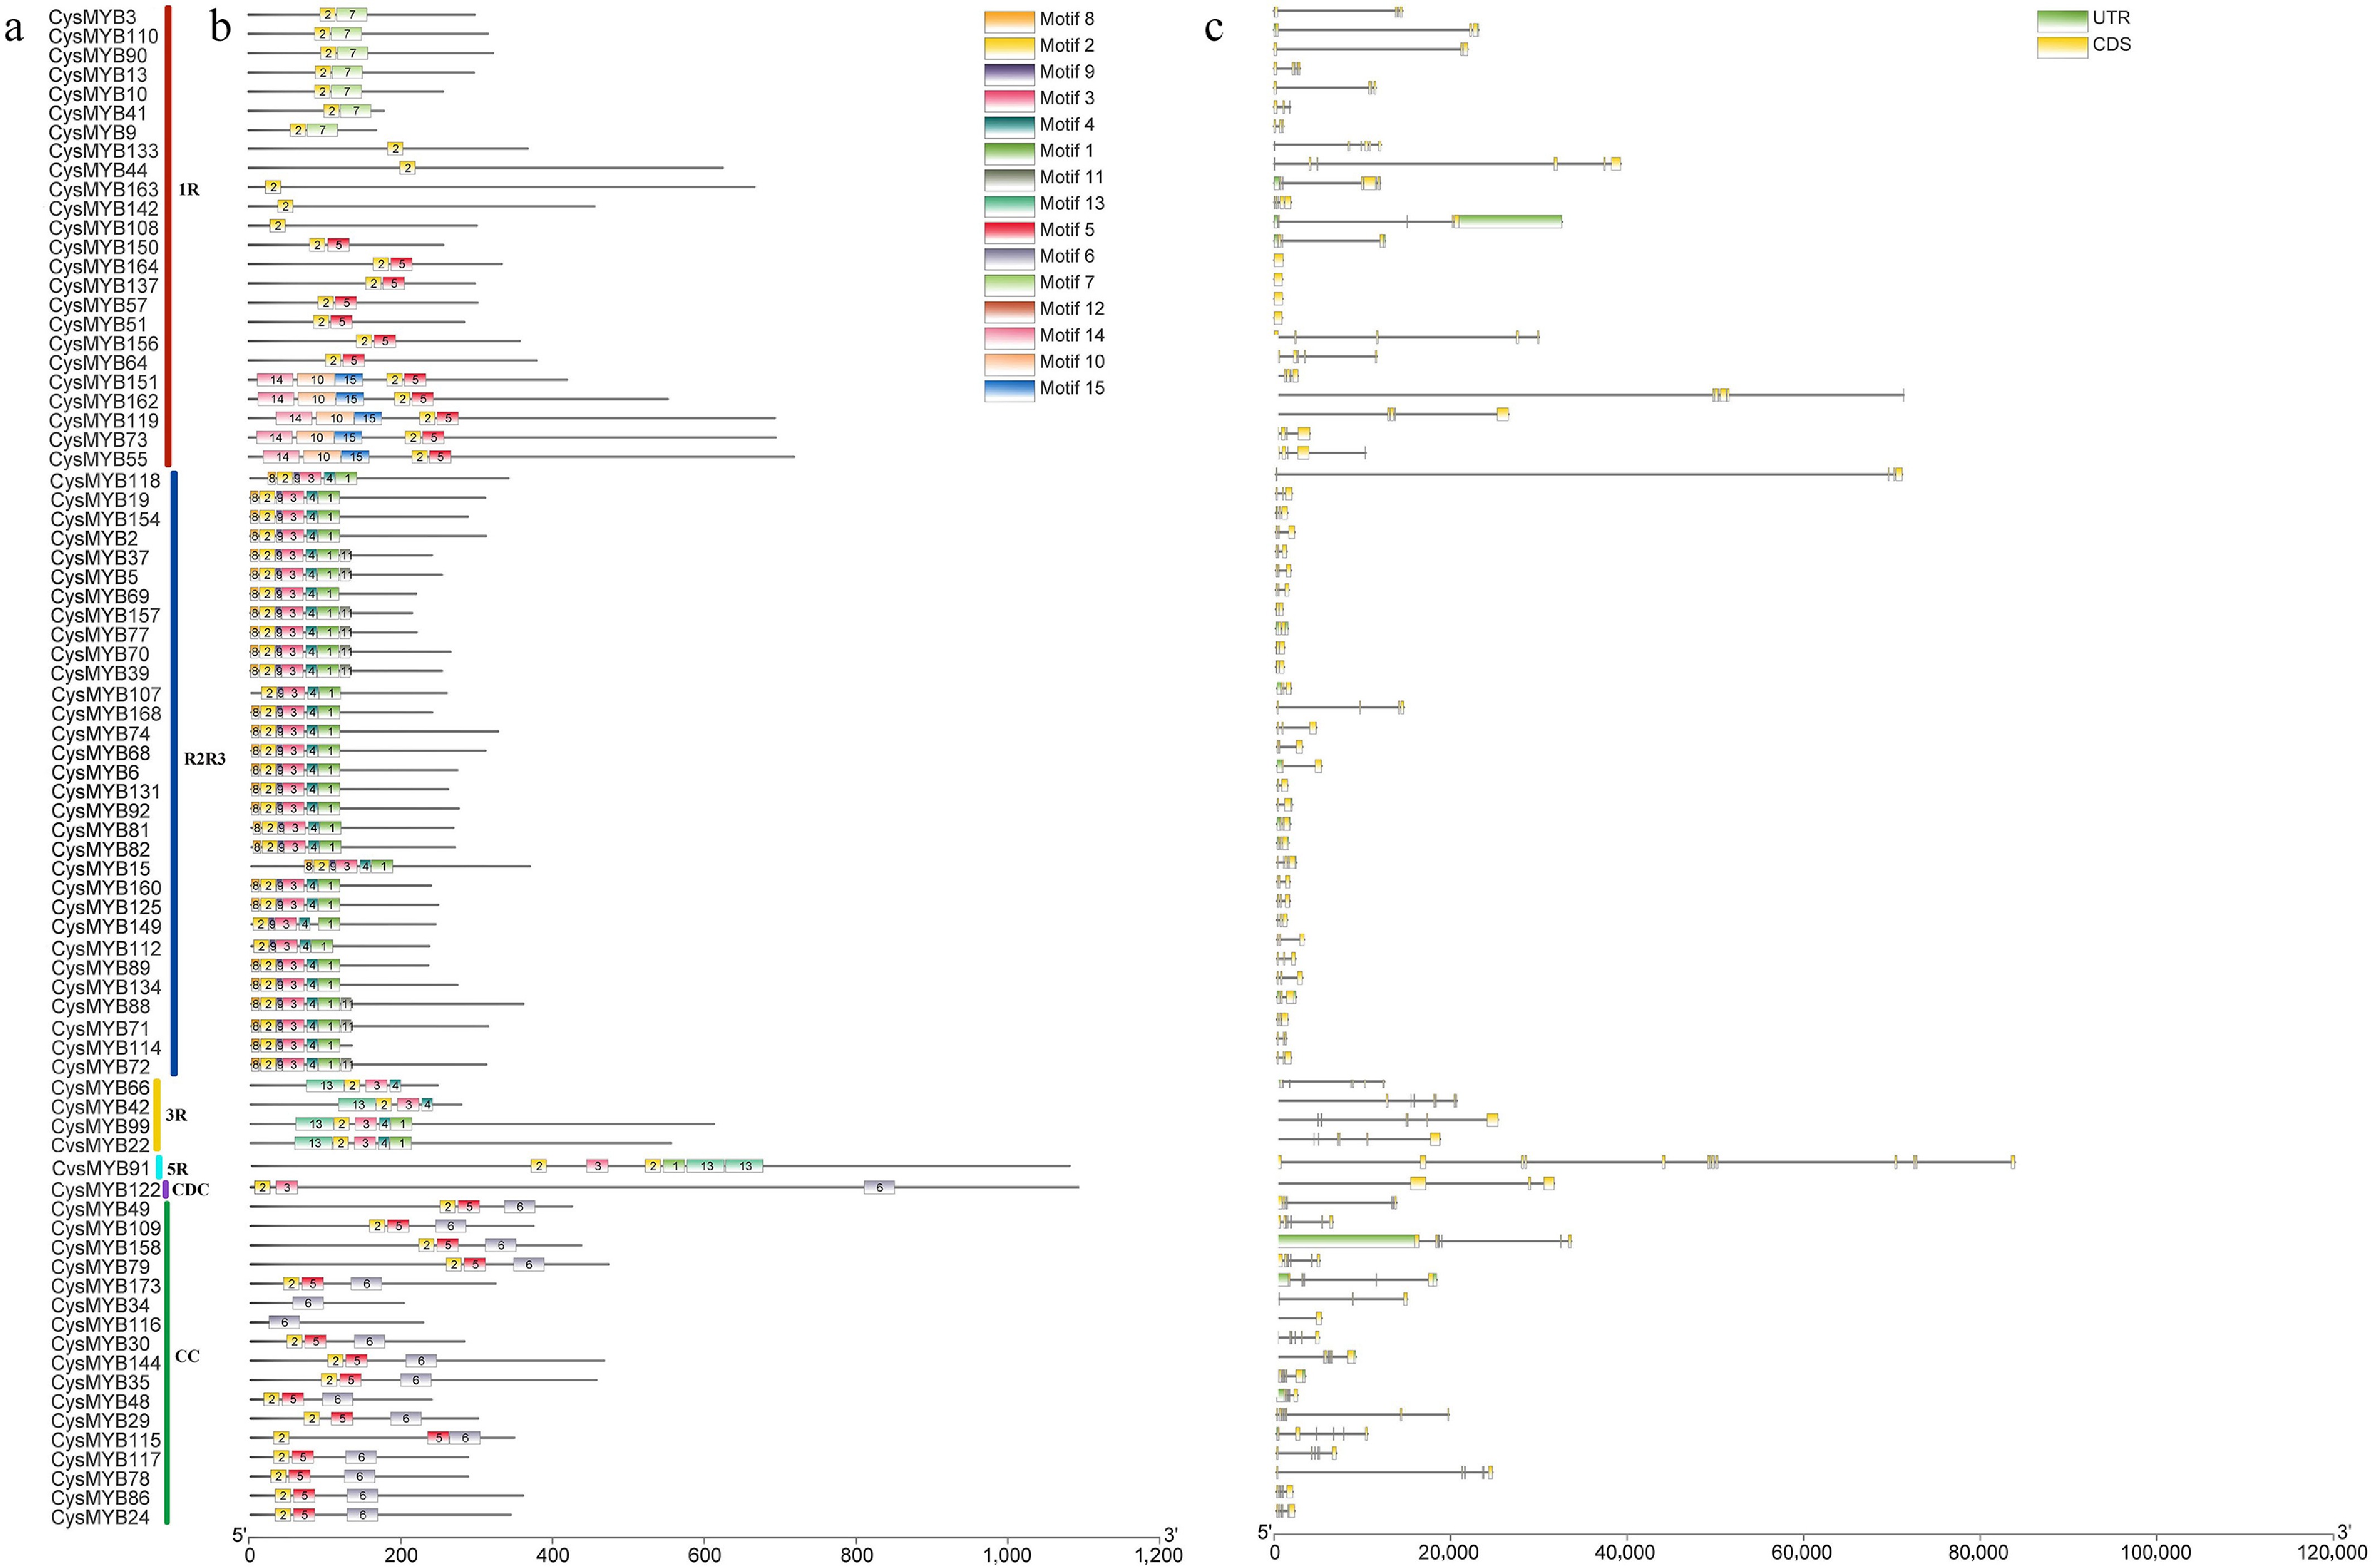
Figure 3.
Conserved motif and gene structure analysis of 78 selected CysMYBs, including 24 1R-MYBs (red bar), 31 R2R3-MYBs (blue bar), four 3R-MYBs (yellow bar), one 5R-MYB (cyan bar), one MYBCDC (purple bar), and 17 MYB-CC (green bar). (a) Protein names and subgroups. (b) Schematic representation of conserved motifs in CysMYB proteins. Different motifs are indicated with of different color boxes, and non-conserved sequences are represented by black lines. (c) Exon/intron structures of the CysMYB genes. Yellow boxes indicate exons, green boxes indicate UTR, and the lines between boxes indicate introns. The scale bars below (b) and (c) illustrate the length of the genes and motifs, respectively.
-
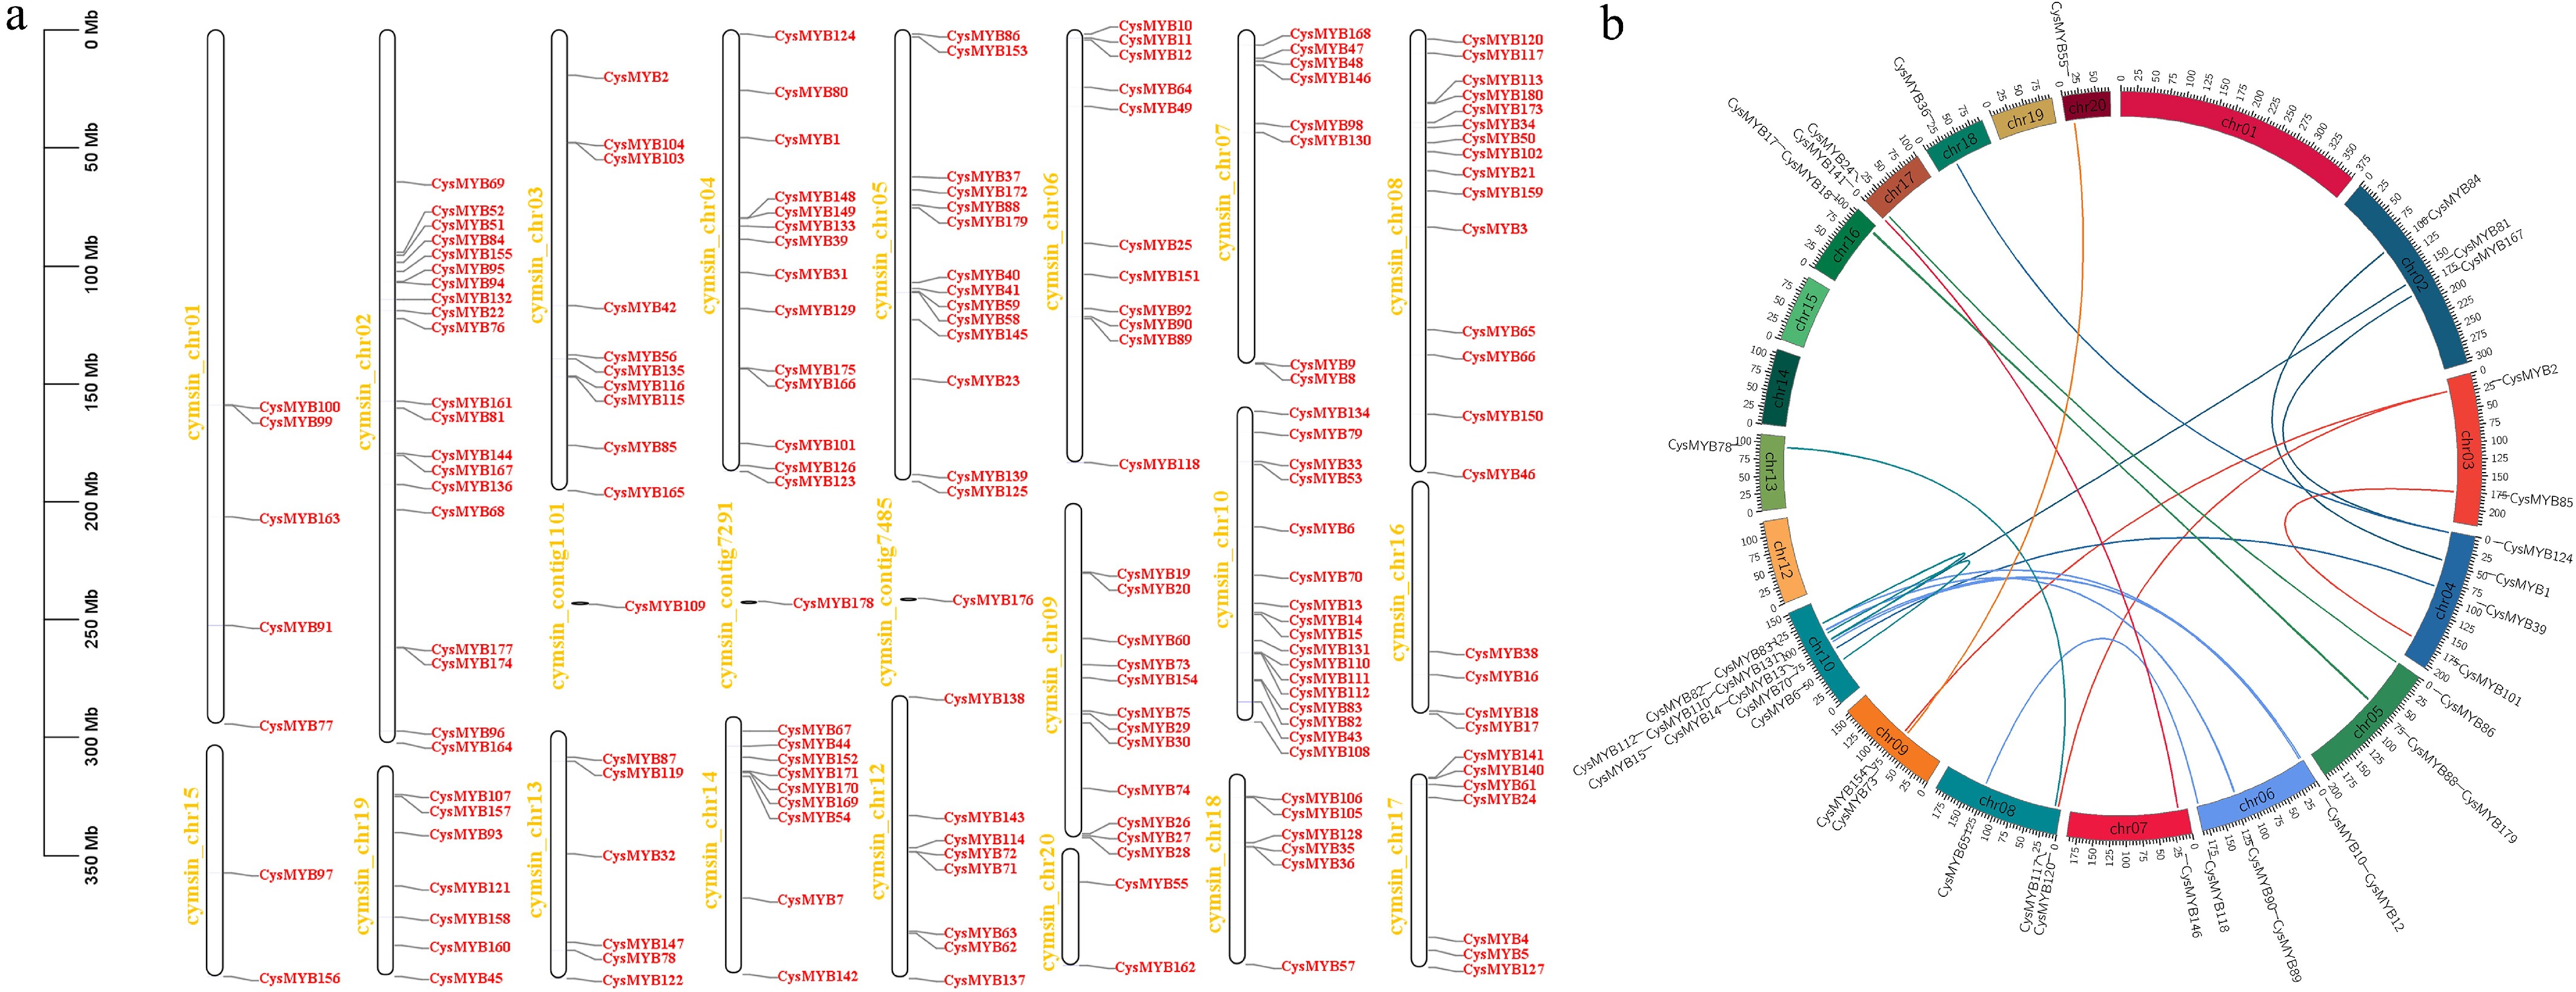
Figure 4.
Chromosomal distribution and gene duplications of the C. sinense MYBs genes. (a) Chromosomal locations of the CysMYBs in C. sinense that are mapped based on the of the genome annotation of C. sinense. The chromosome/contig ID is indicated on the left side of the chromosomes/contigs. The scale is indicated in megabase (Mb). (b) Collinearity analysis of the C. sinense MYBs genes. The syntenic CysMYB gene pairs are indicated by different color lines and marked on the out layer of the chromosomes.
-
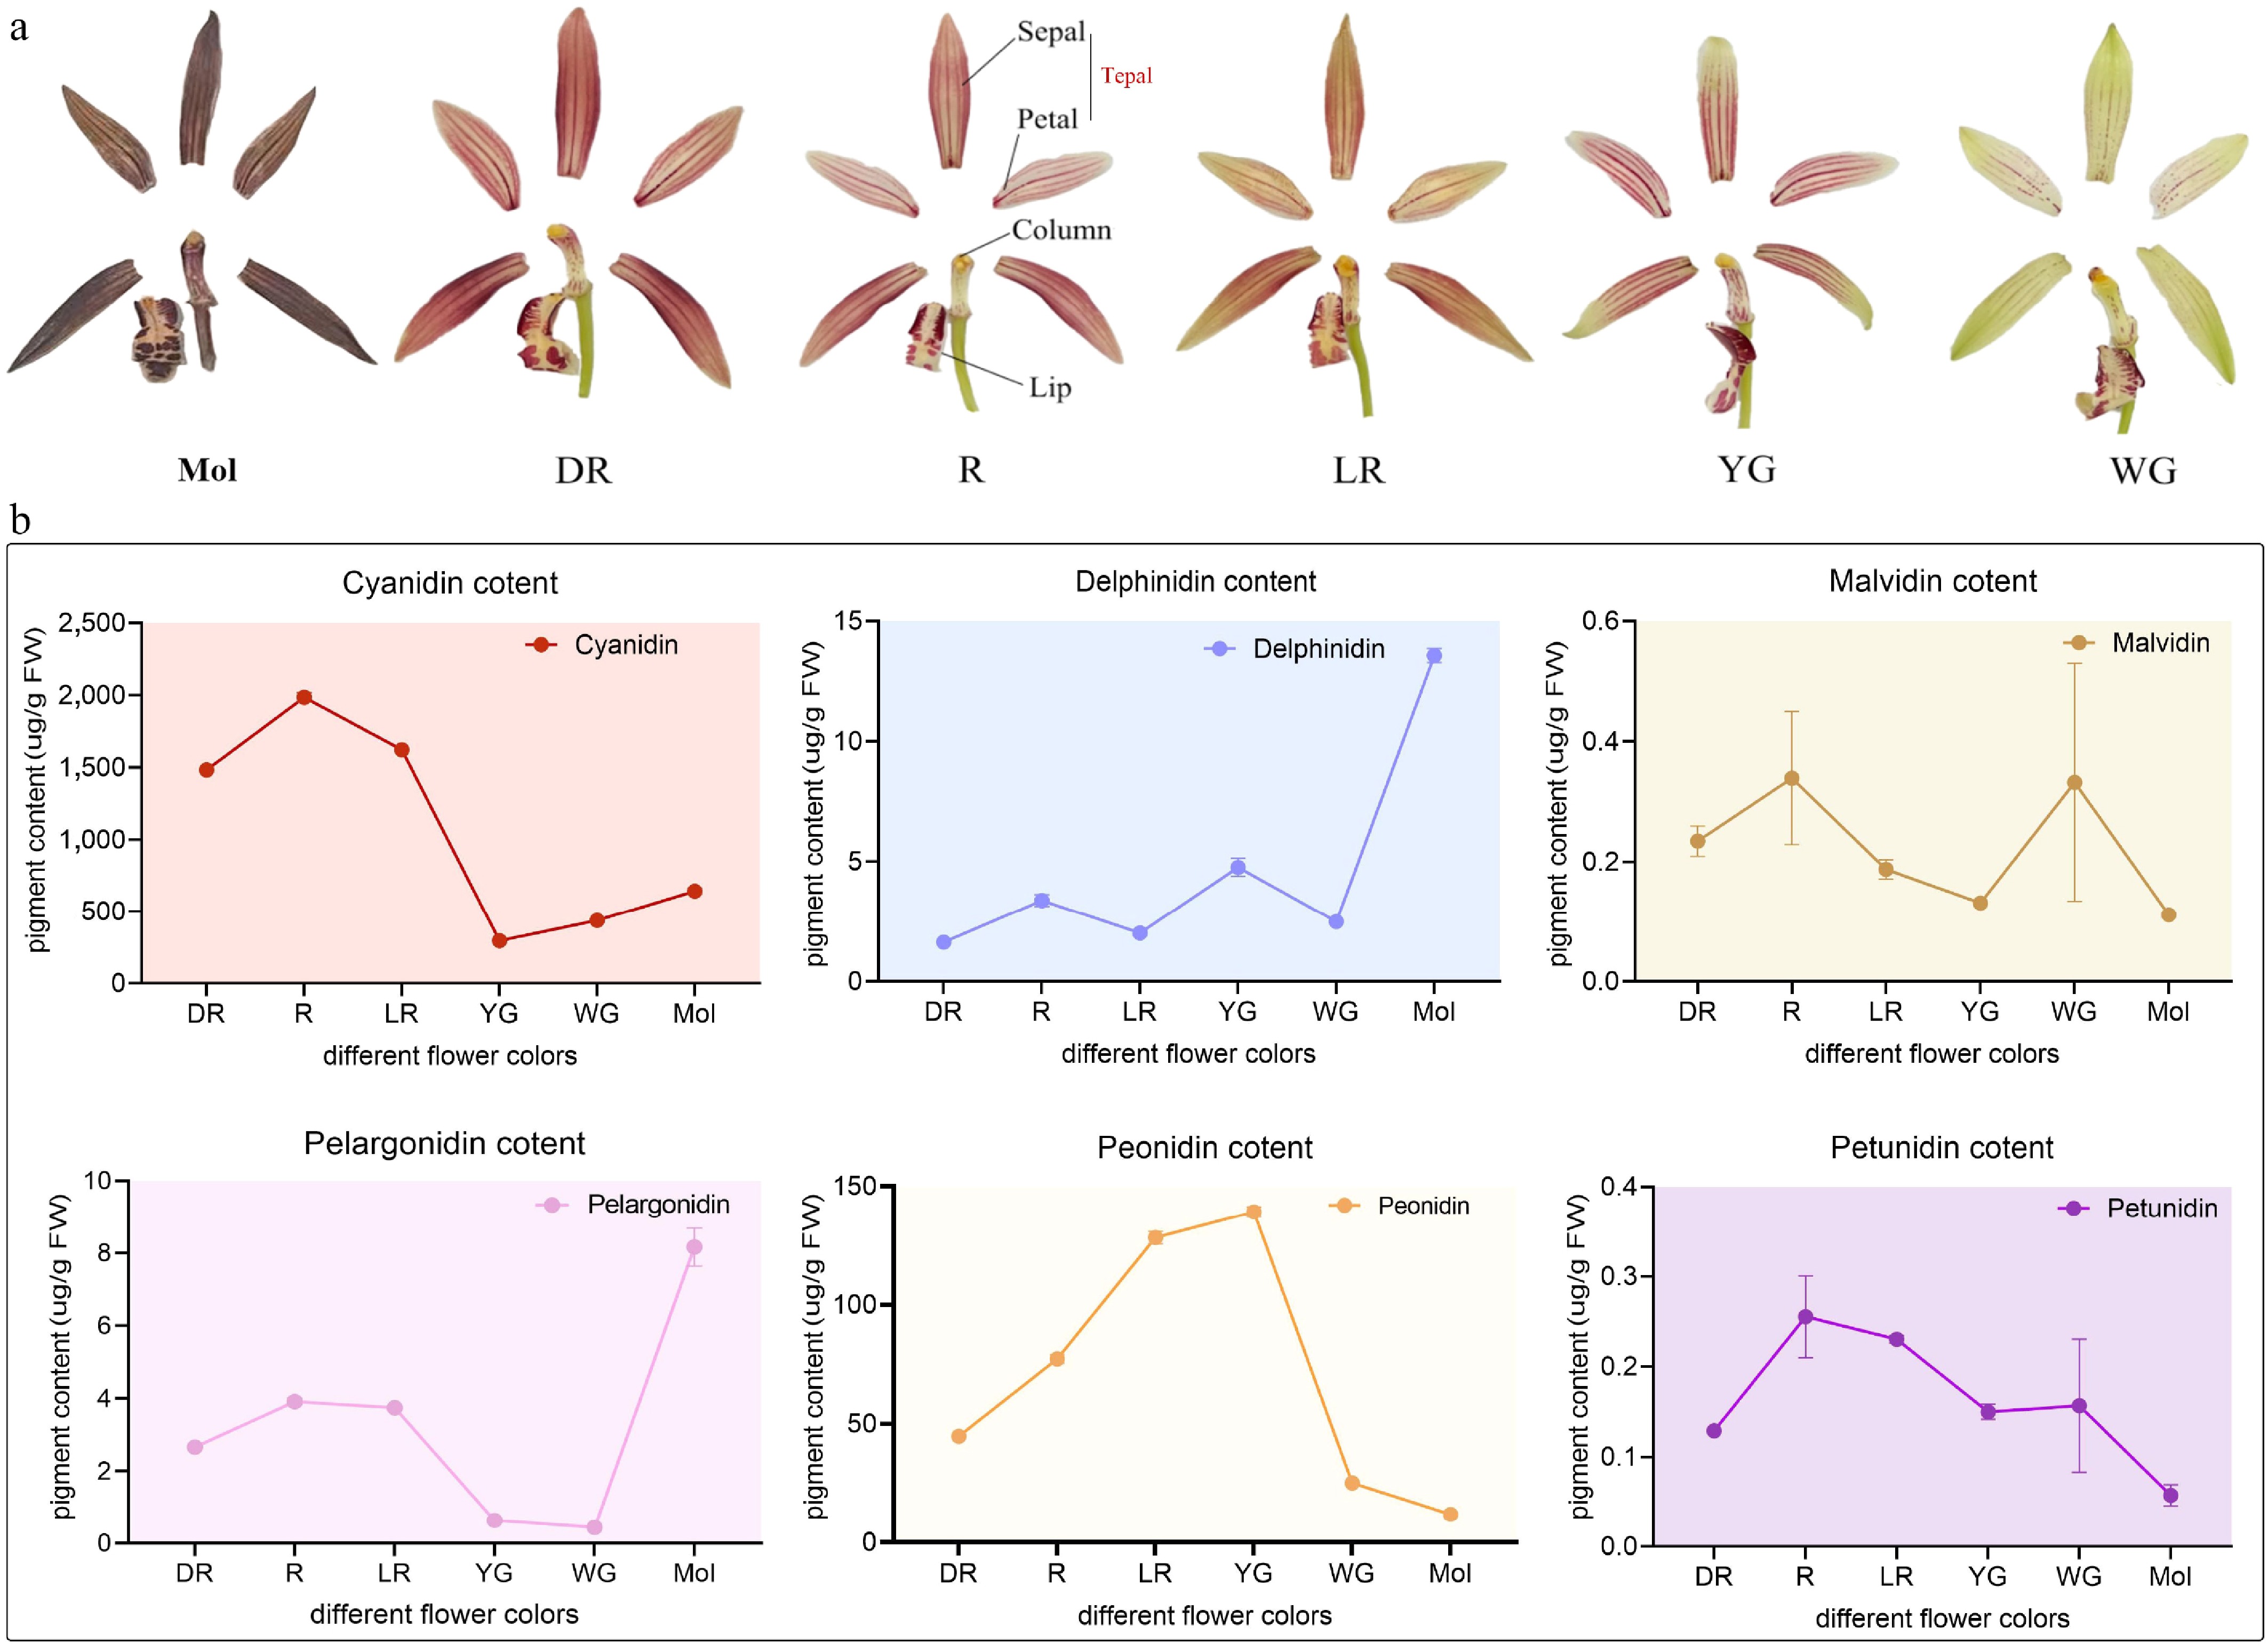
Figure 5.
The major anthocyanin composition and floral organ structure of C. sinense (Mol) and C. haematodes-DR, R, LR, YG, and WG. (a) Foral organ structure of the Cymbidium species for anthocyanin content detection. DR: dark-red tepals; R: red tepals; LR: light-red tepals; YG: yellow-green tepals; WG: white-green tepals. (b) Anthocyanin composition and content among different samples. The x-axis represents samples with different flower colors, C. sinense (Mol) and C. haematodes accessions with different flower colors (DR, R, LR, YG, and WG). The y-axis represents the content of pigments (ug/g FW). The pigments are indicated in different colors of dots, lines, and shades. Cyanidin: red; Delphinidin: blue; Malvidin: brown; Pelargonidin: pink; Peonidin: yellow; Petunidin: purple.
-
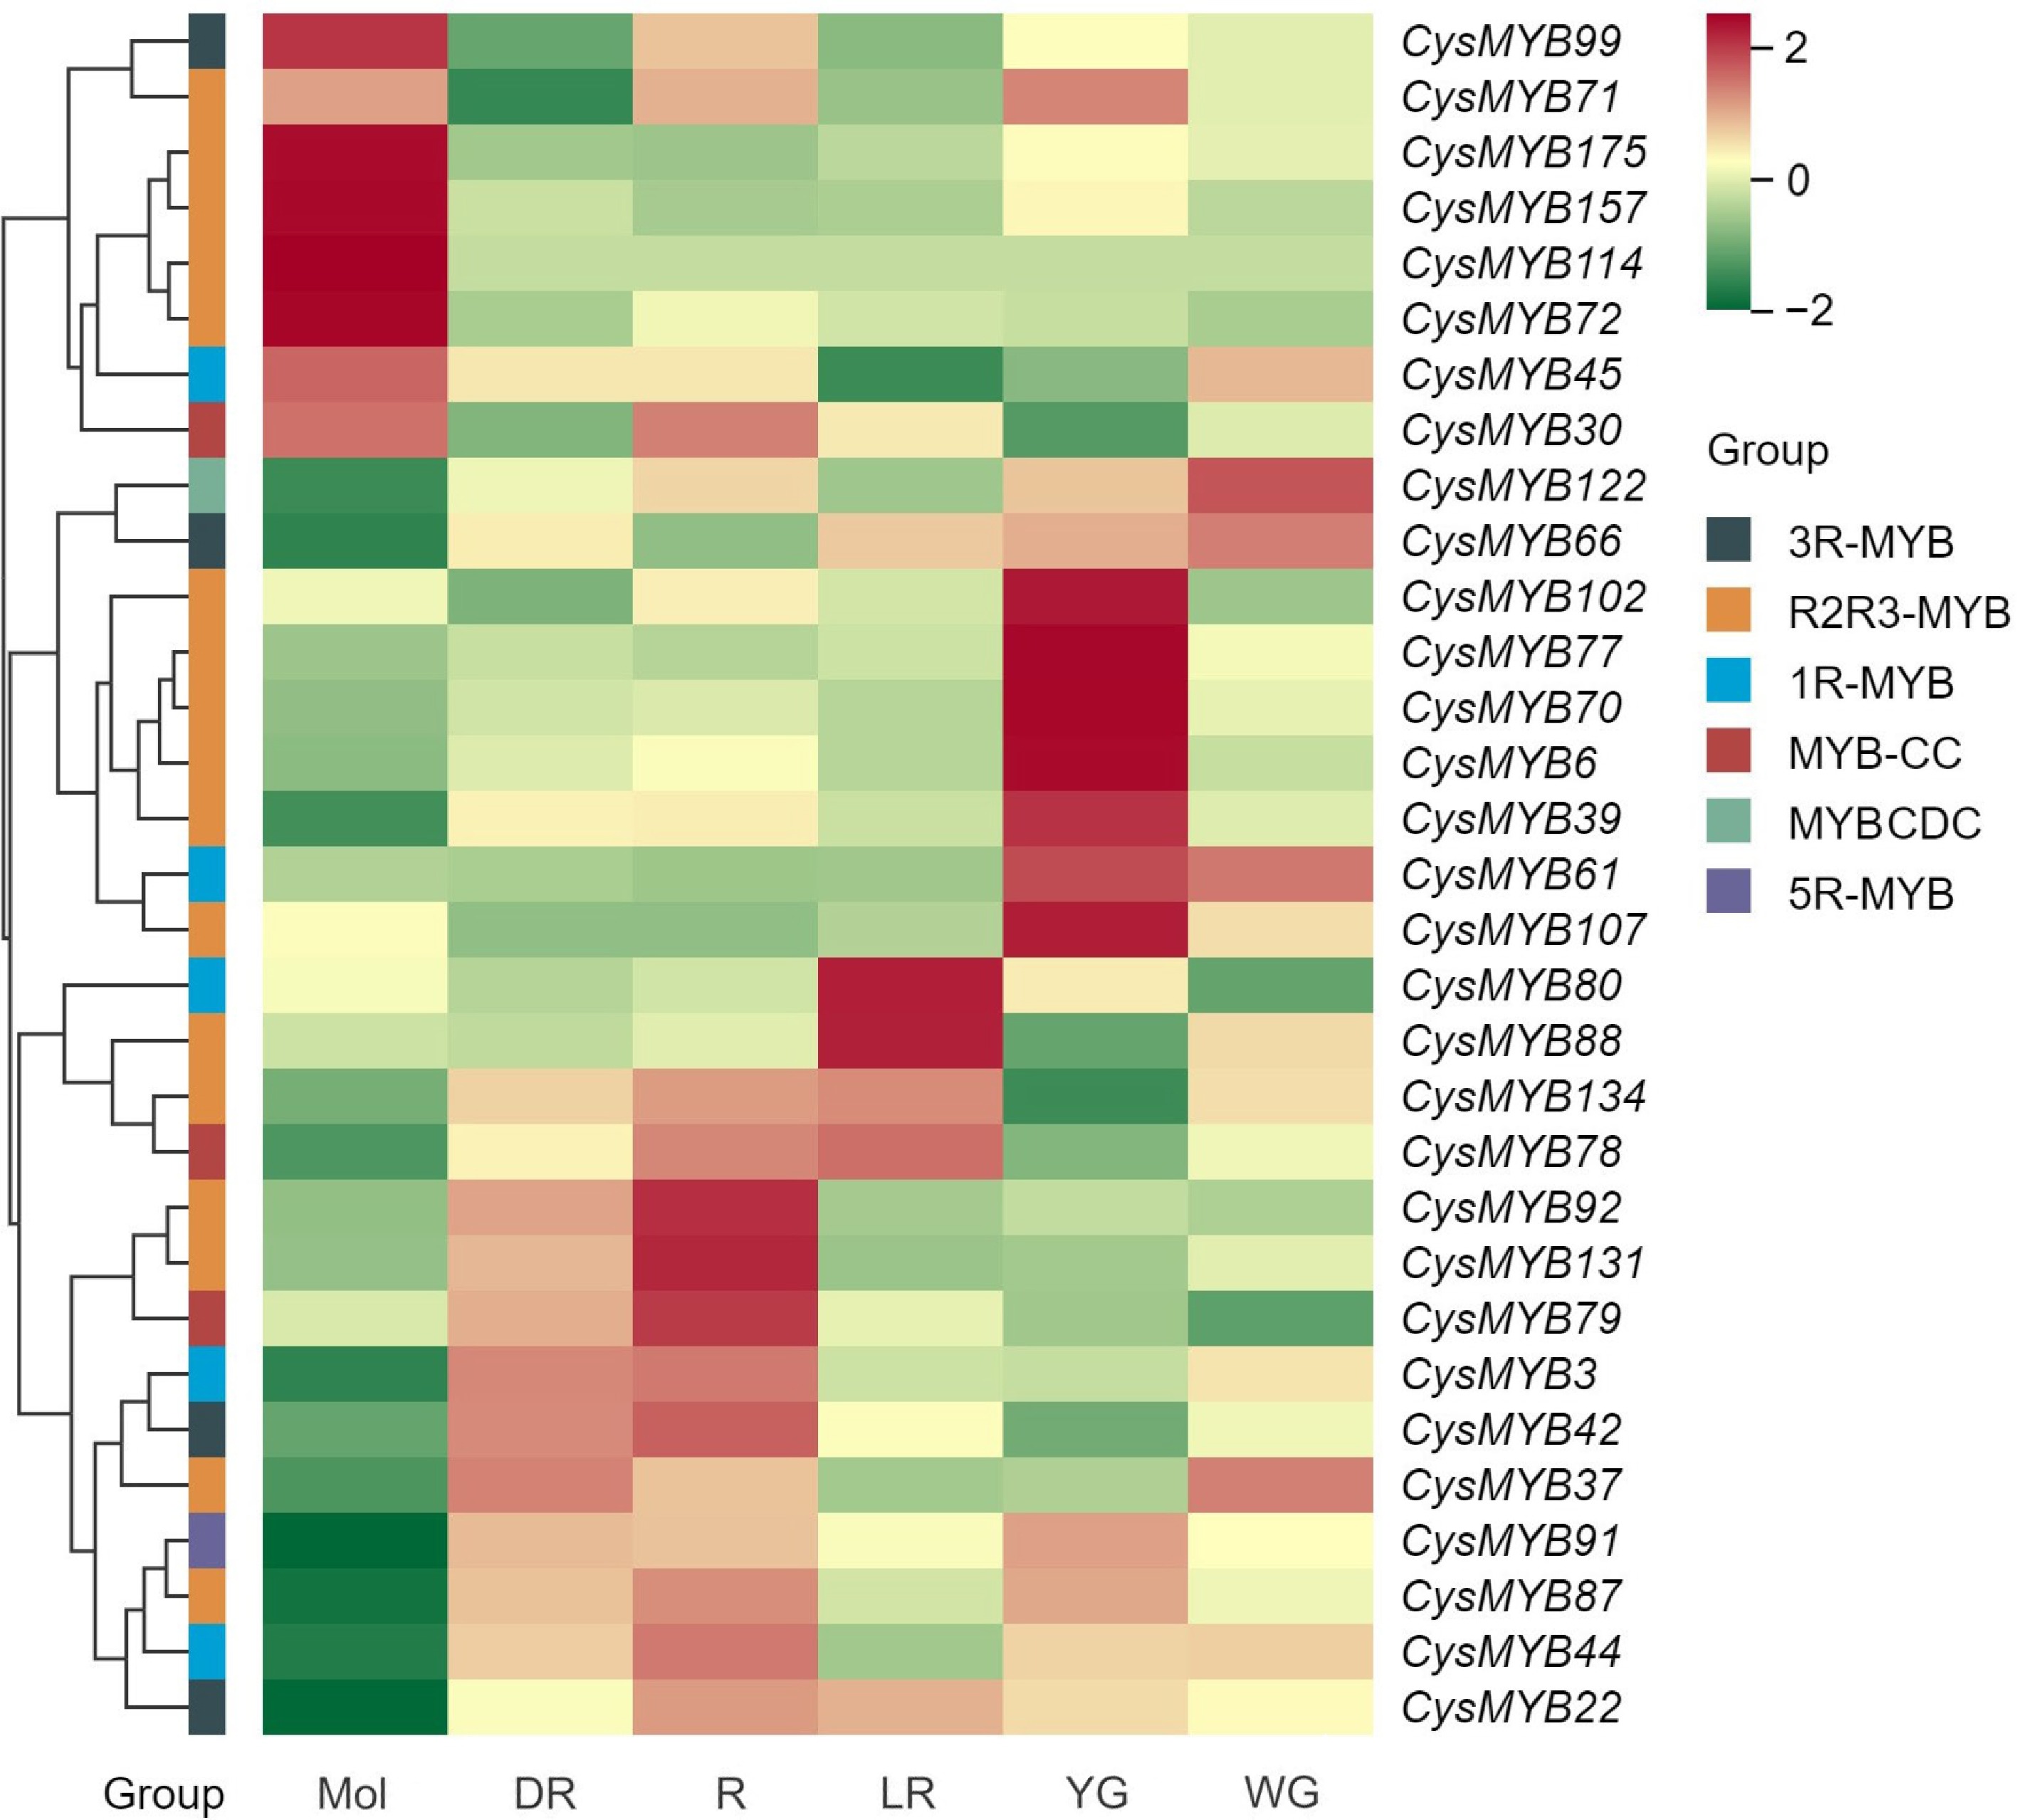
Figure 6.
Expression patterns of 31 CysMYBs in tepals of C. sinense (Mol) and C. haematodes accessions with different flower colors (DR, R, LR, YG, and WG), according to the FPKM values. The CysMYB groups are indicated with different color blocks: 1R-MYB (black), R2R3-MYB (yellow), 3R-MYB (red), 5R-MYB (green), MYB-CC (blue), MYBCDC (purple). DR: dark-red tepals; R: red tepals; LR: light-red tepals; YG: yellow-green tepals; WG: white-green tepals.
-
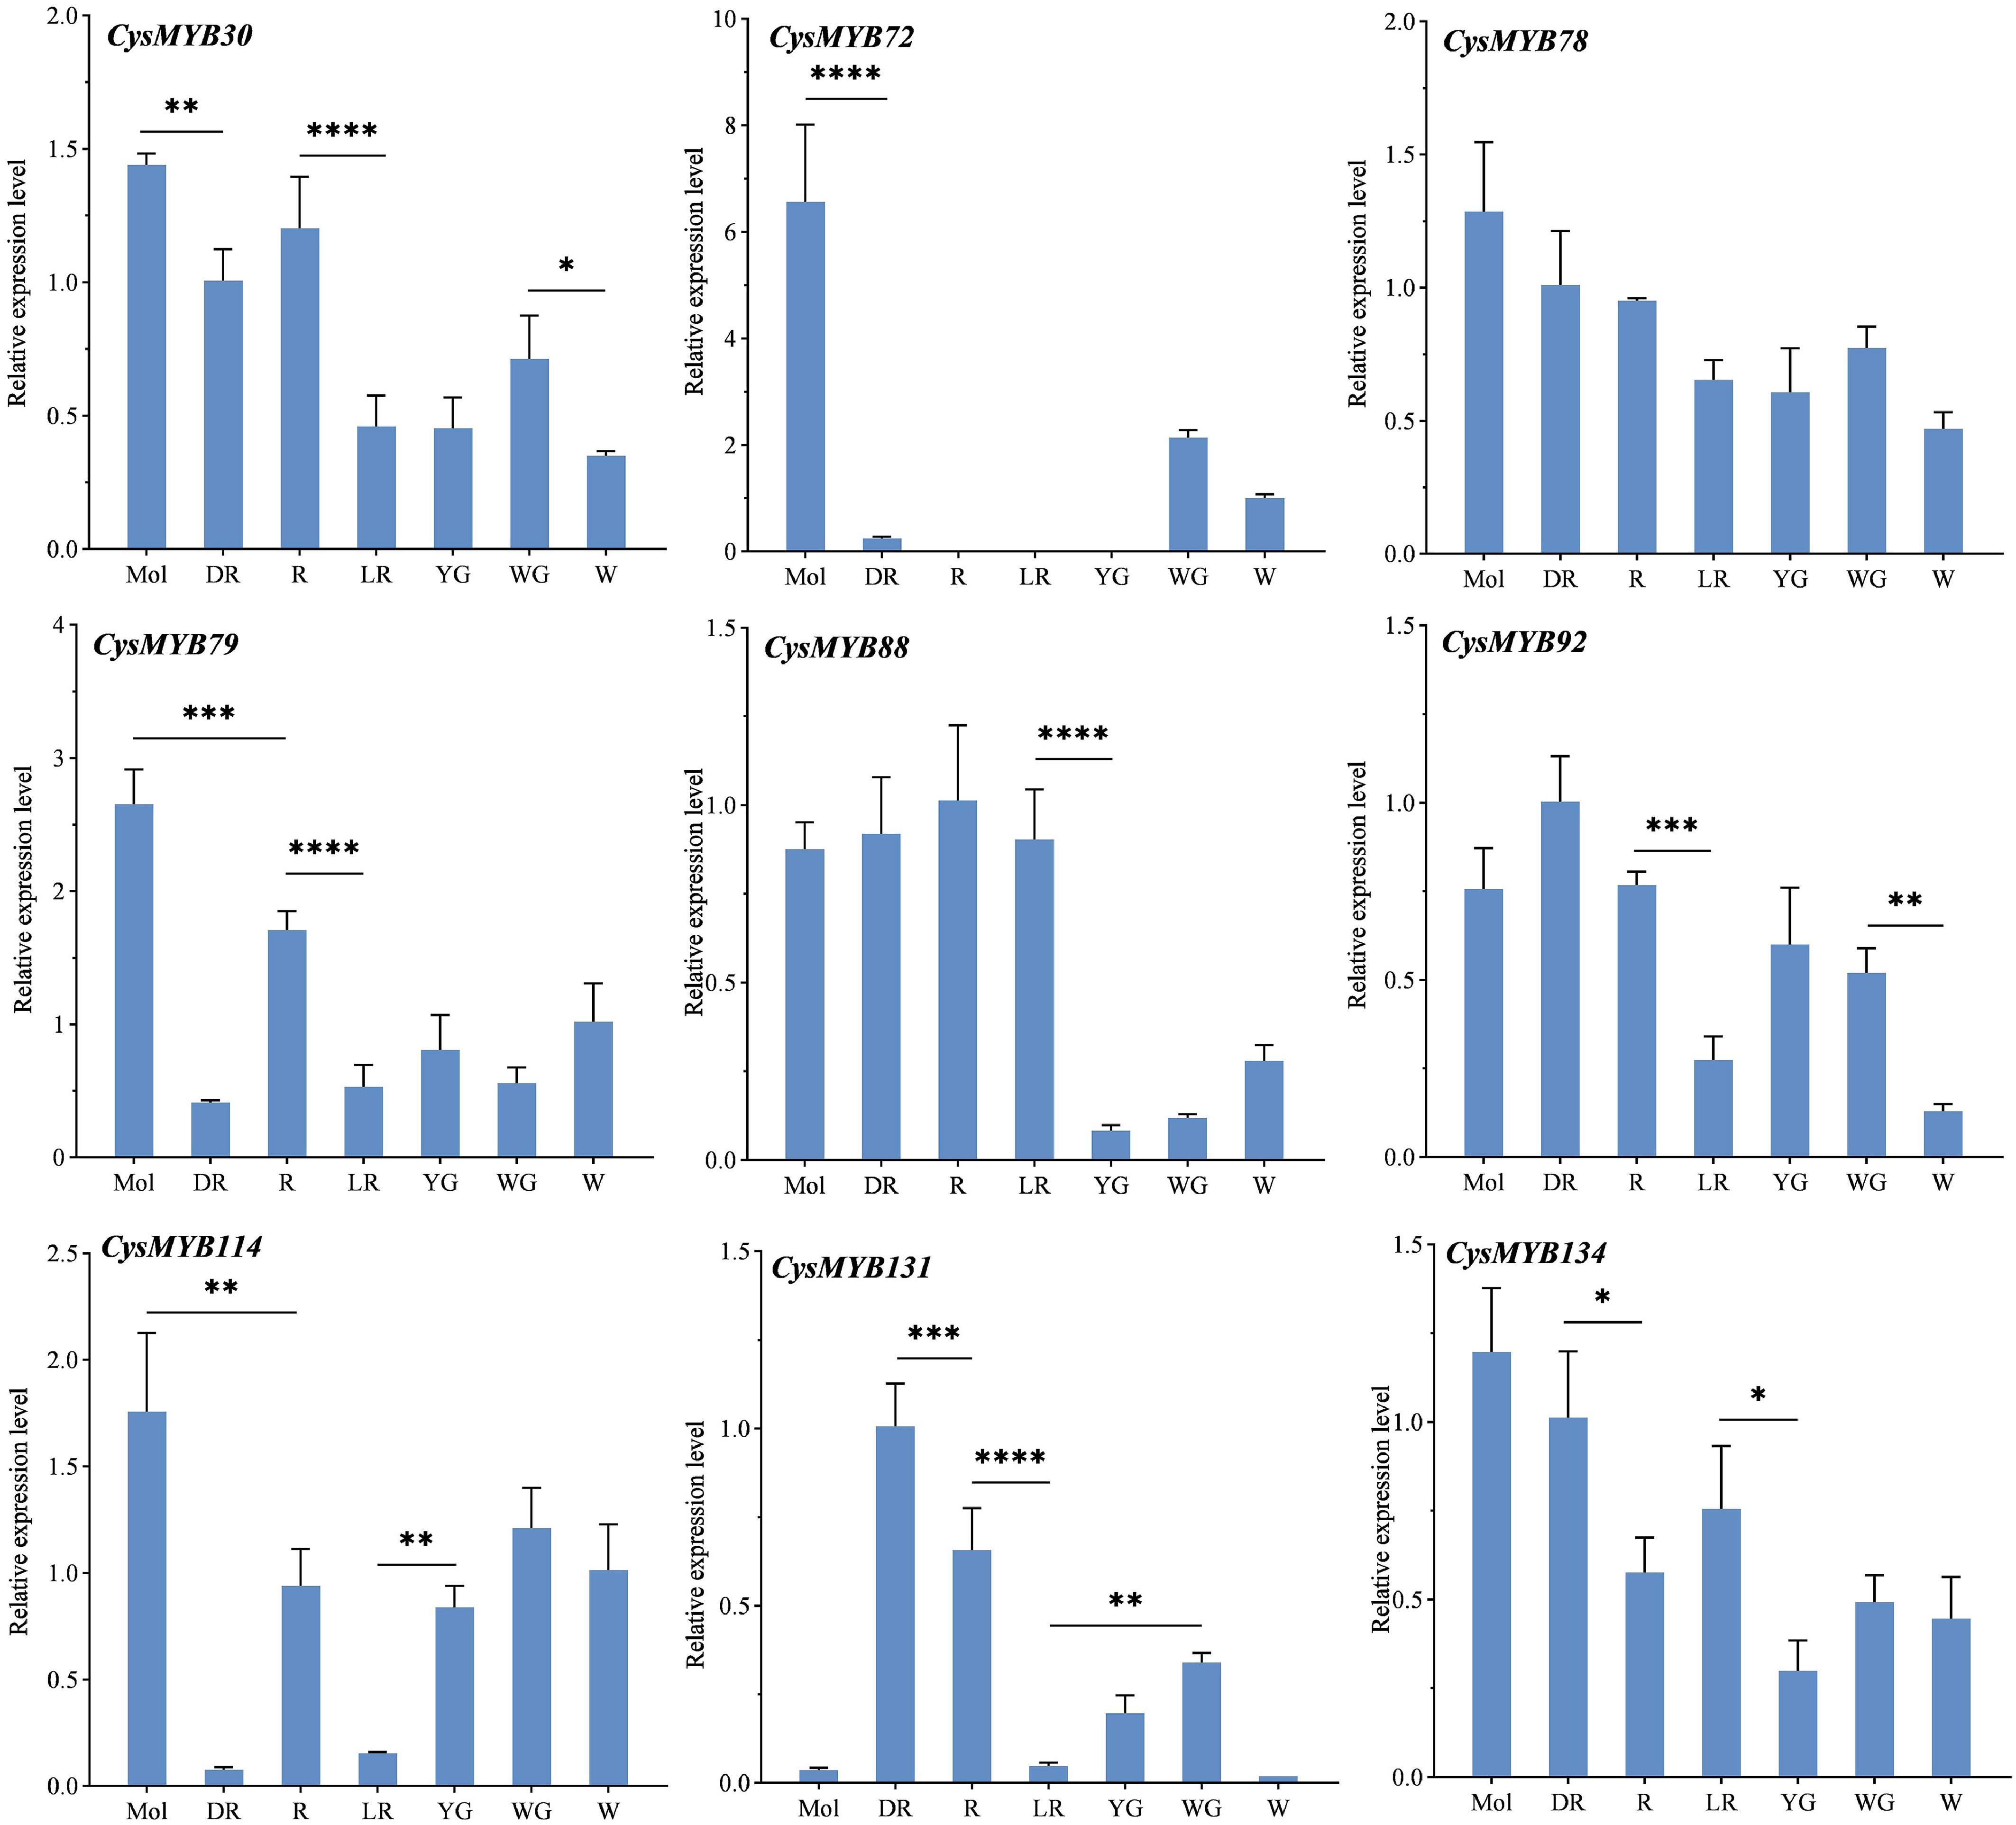
Figure 7.
The expression of nine CysMYBs genes among different flower colors of C. sinense and C. haematodes using qRCR. Values are mean ± standard deviation (SD) of three biological replicates. Statistics were analyzed using one-way ANOVA (p < 0.05), and * indicates significant differences in values. * p < 0.05, ** p < 0.01, *** p < 0.001, and **** p < 0.0001. Mol, C. sinense 'Qihei'; DR, R, LR, YG, WG, and W indicate C. haematodes accessions with different colors. DR: dark-red tepals; R: red tepals; LR: light-red tepals; YG: yellow-green tepals; WG: white-green tepals; W: white tepals.
-
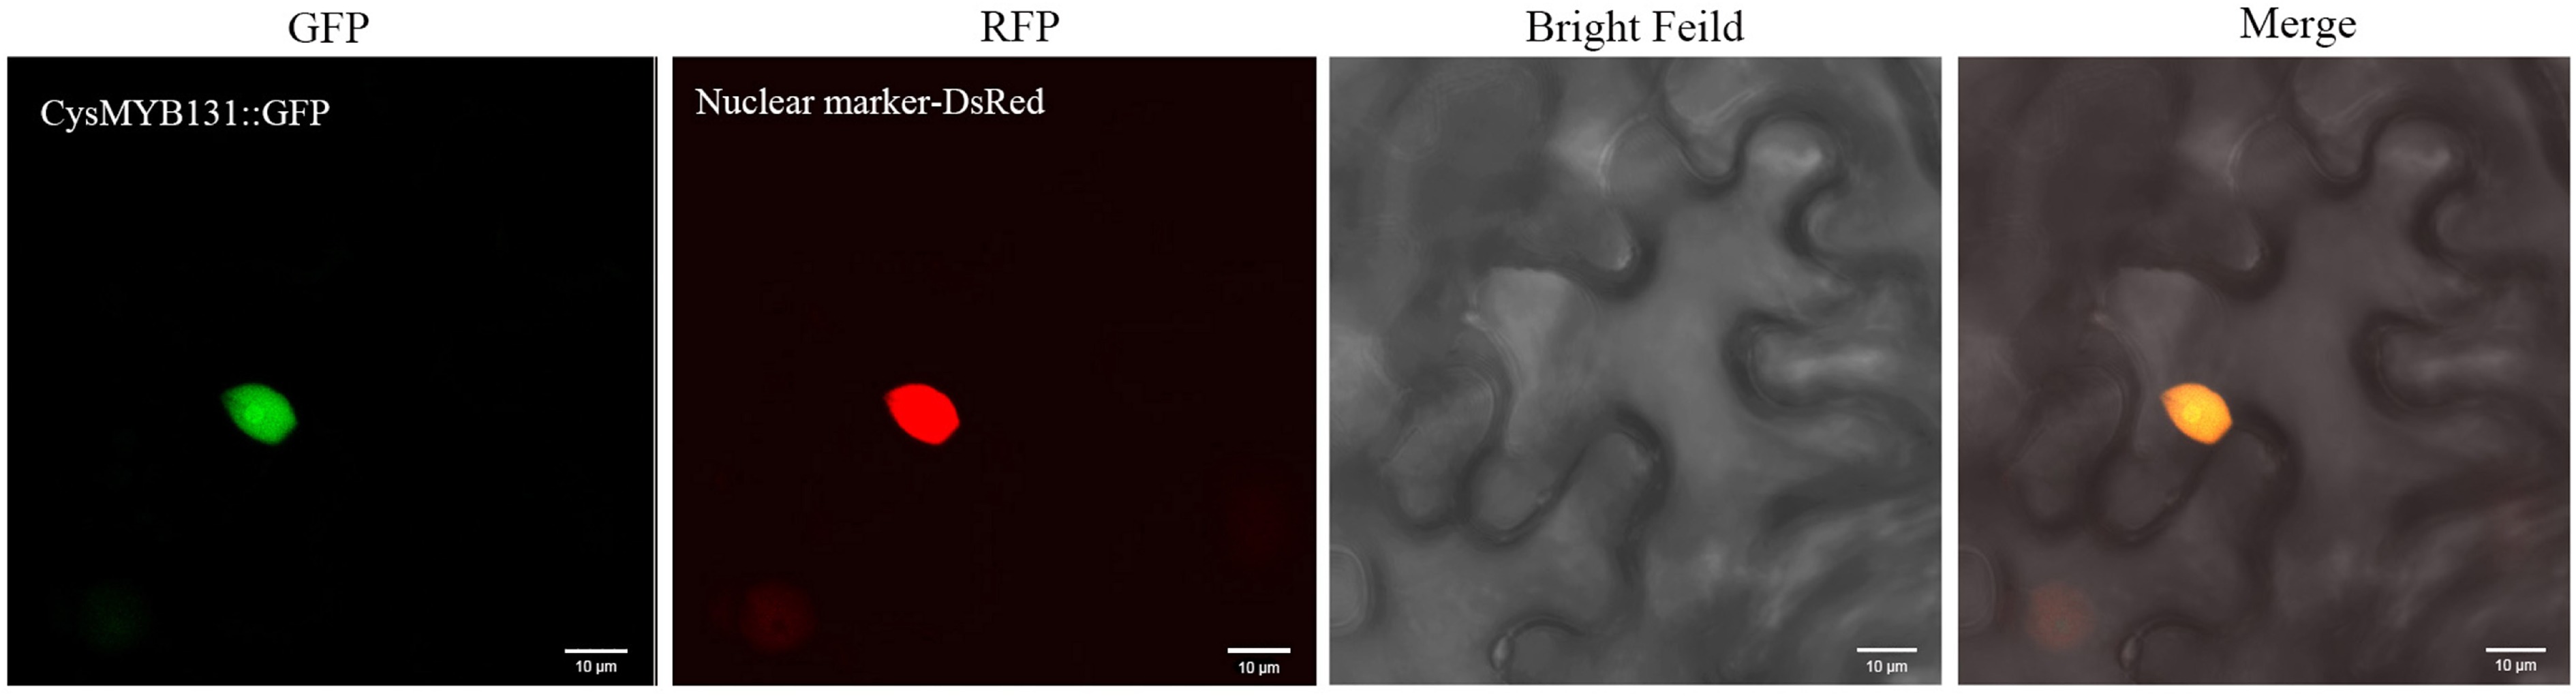
Figure 8.
Subcellular localization of the CysMYB131 protein. Gene-GFP fusion construct was transiently expressed in Nicotiana benthamiana. From left to right: fluorescence of the gene-GFP fusion construct (green), fluorescence of the nuclear marker DsRed (red), bright-field, and merged images.
Figures
(8)
Tables
(0)