-
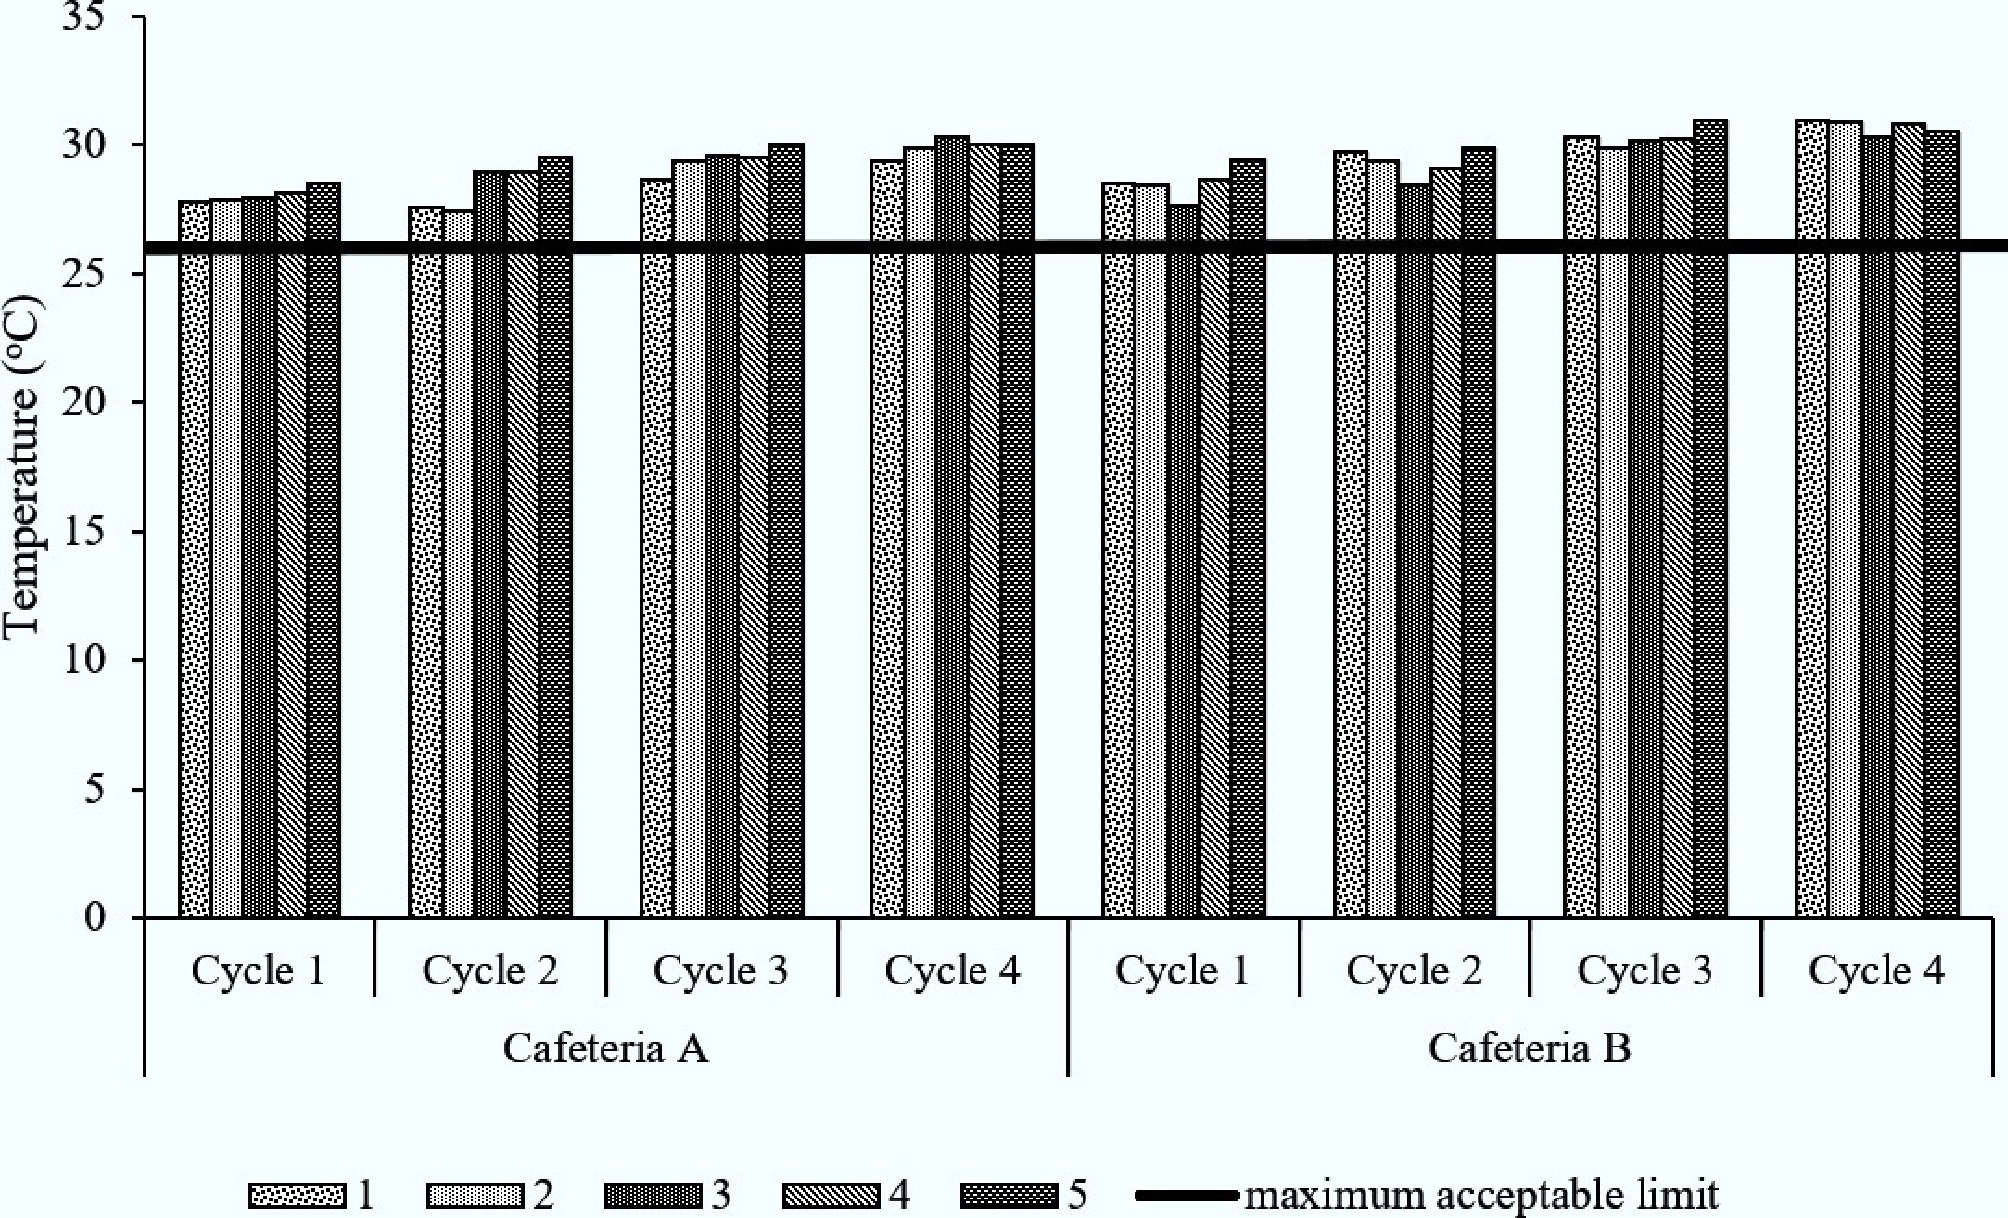
Figure 1.
Temperature in cafeterias A and B for five sampling points across four cycles.
-
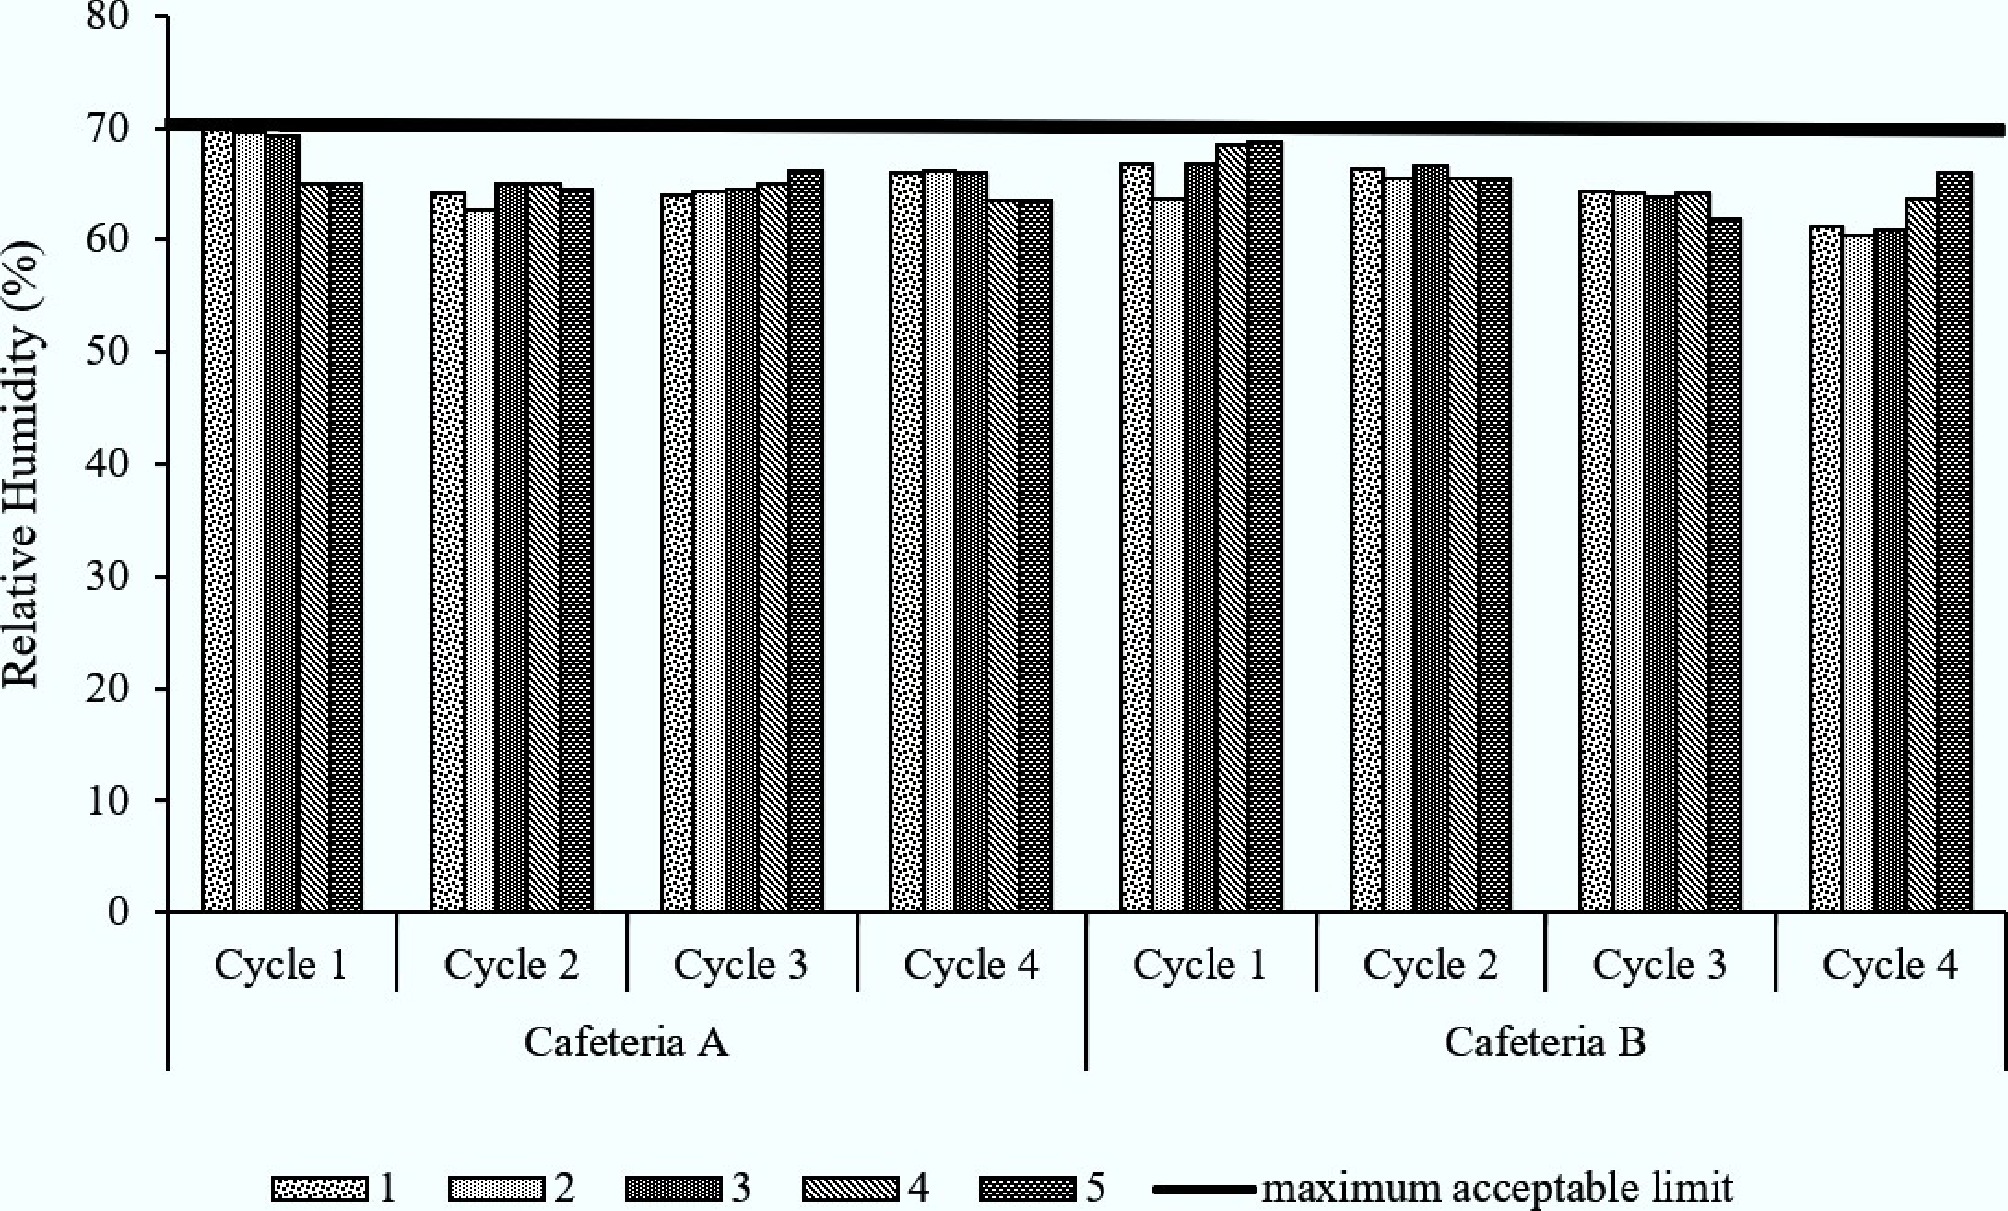
Figure 2.
Relative humidity in cafeterias A and B at five sampling points across four cycles.
-
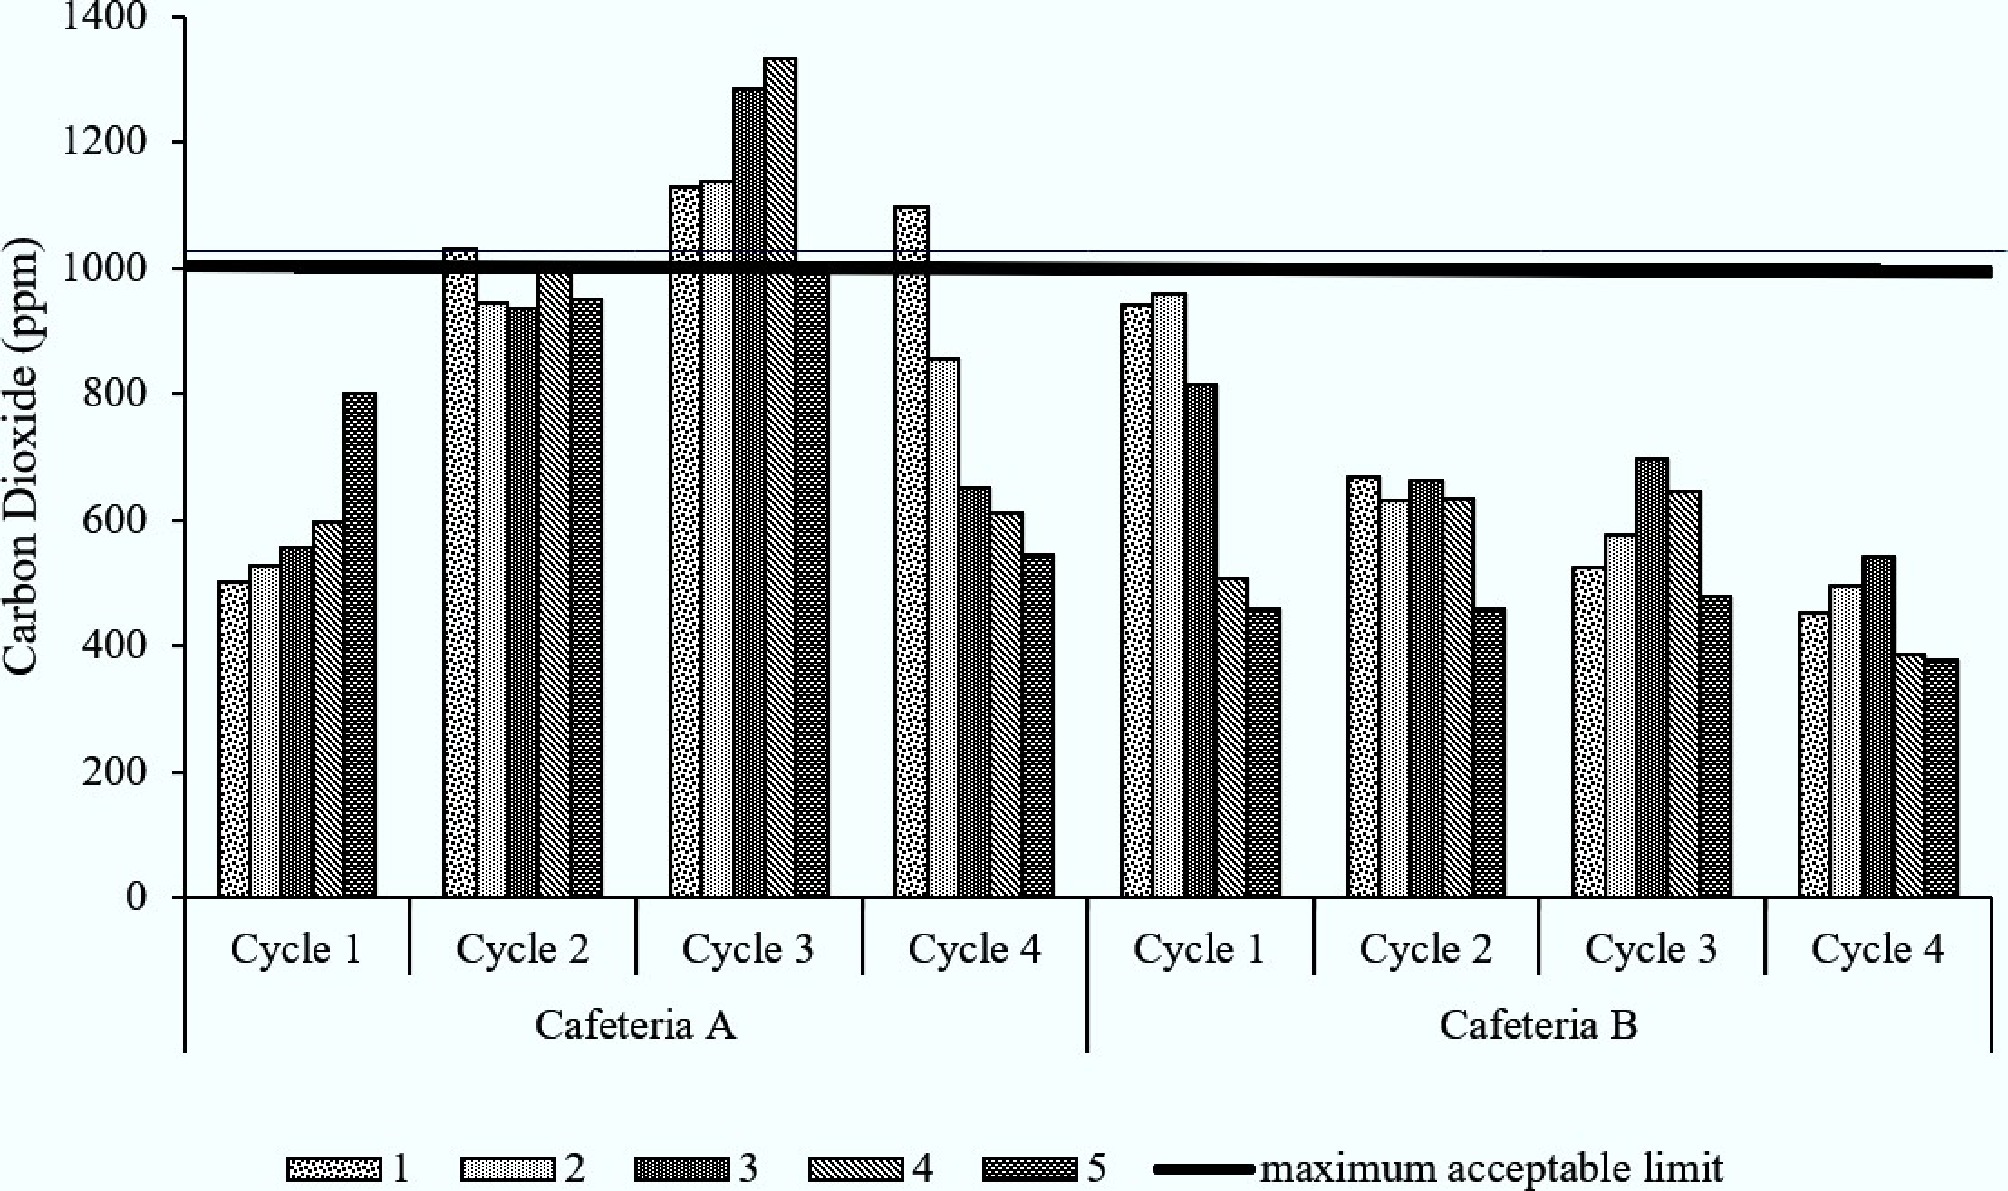
Figure 3.
Carbon dioxide in cafeterias A and B at five sampling points across four cycles.
-
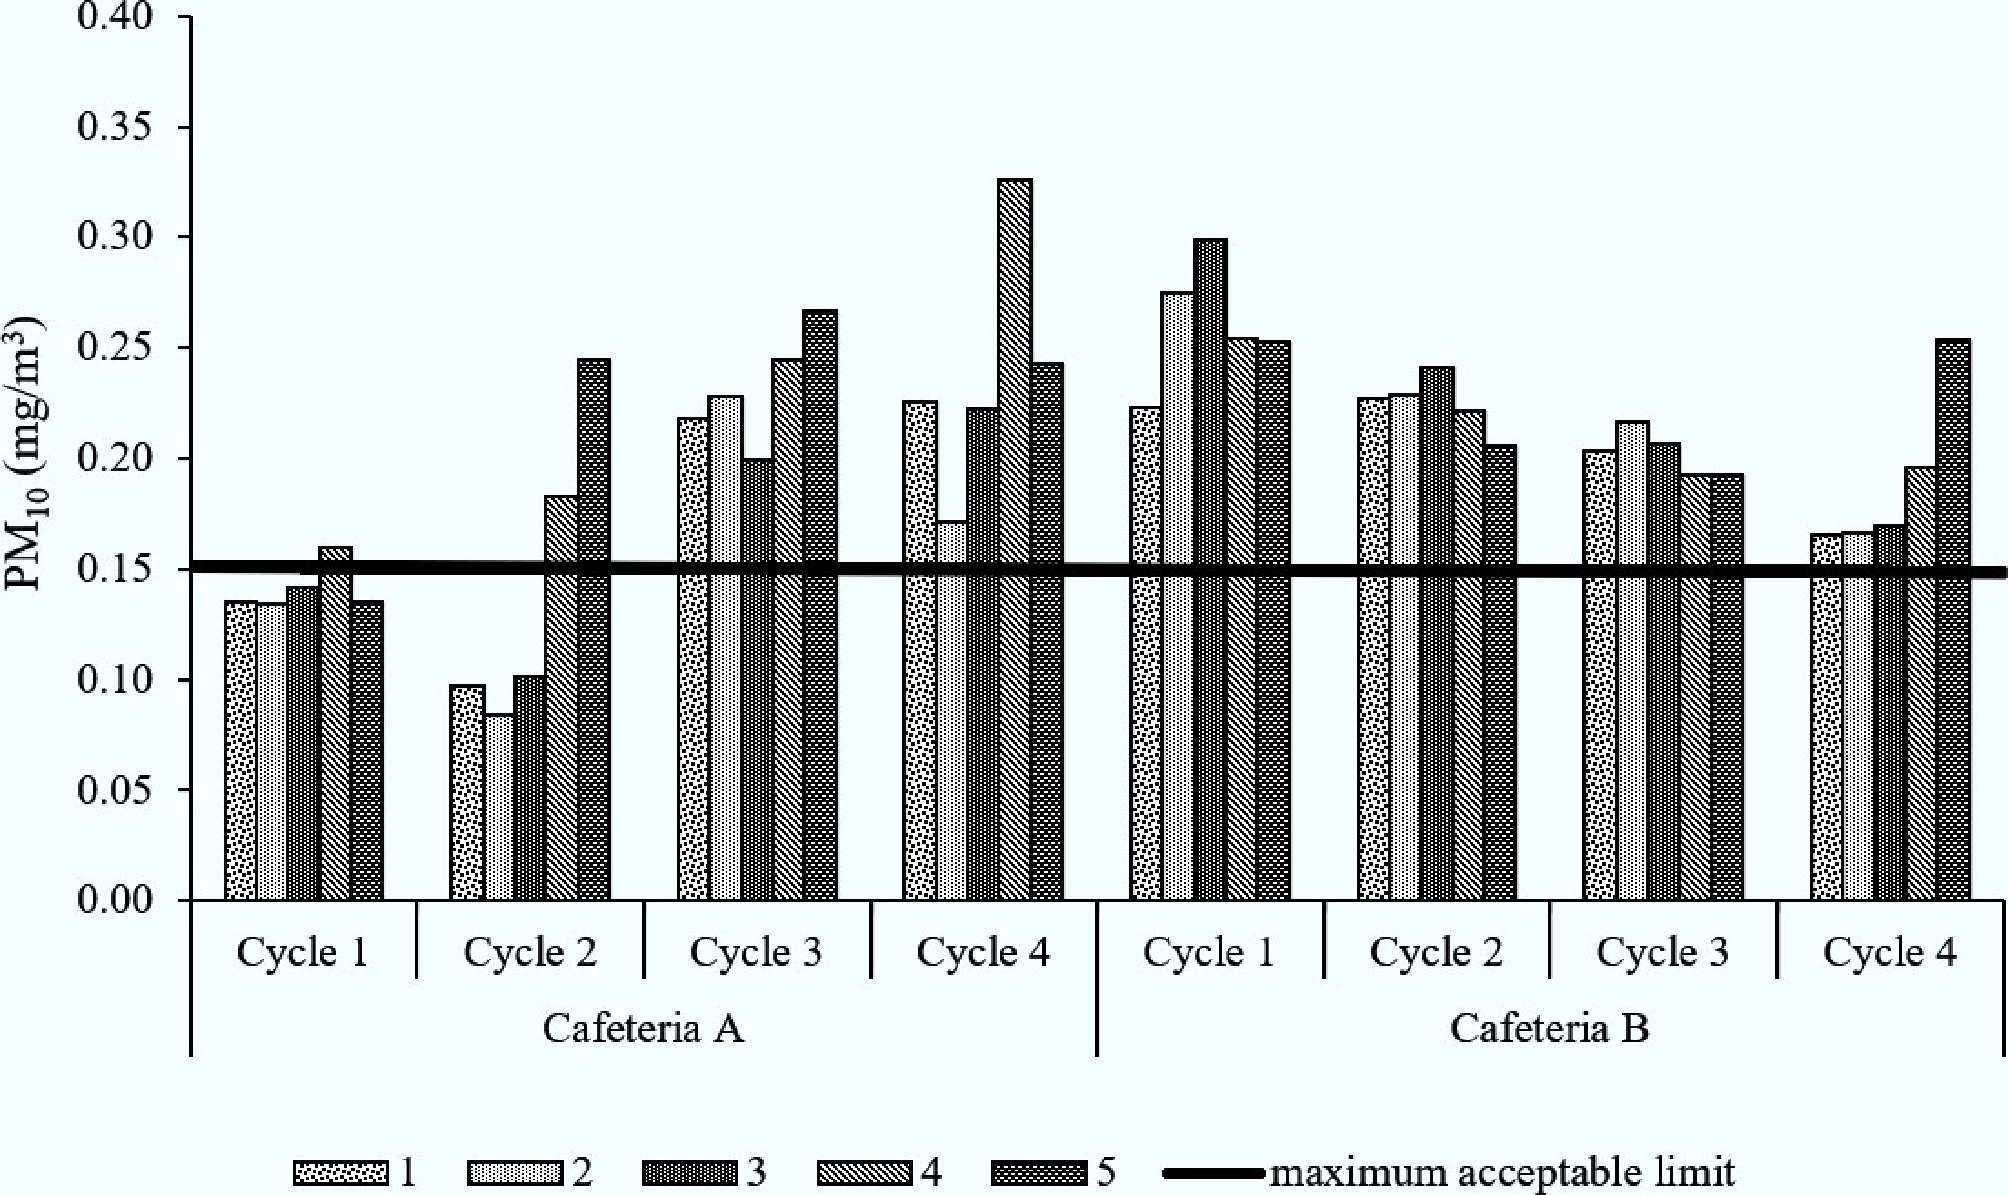
Figure 4.
PM10 in cafeterias A and B at five sampling points across four cycles.
-
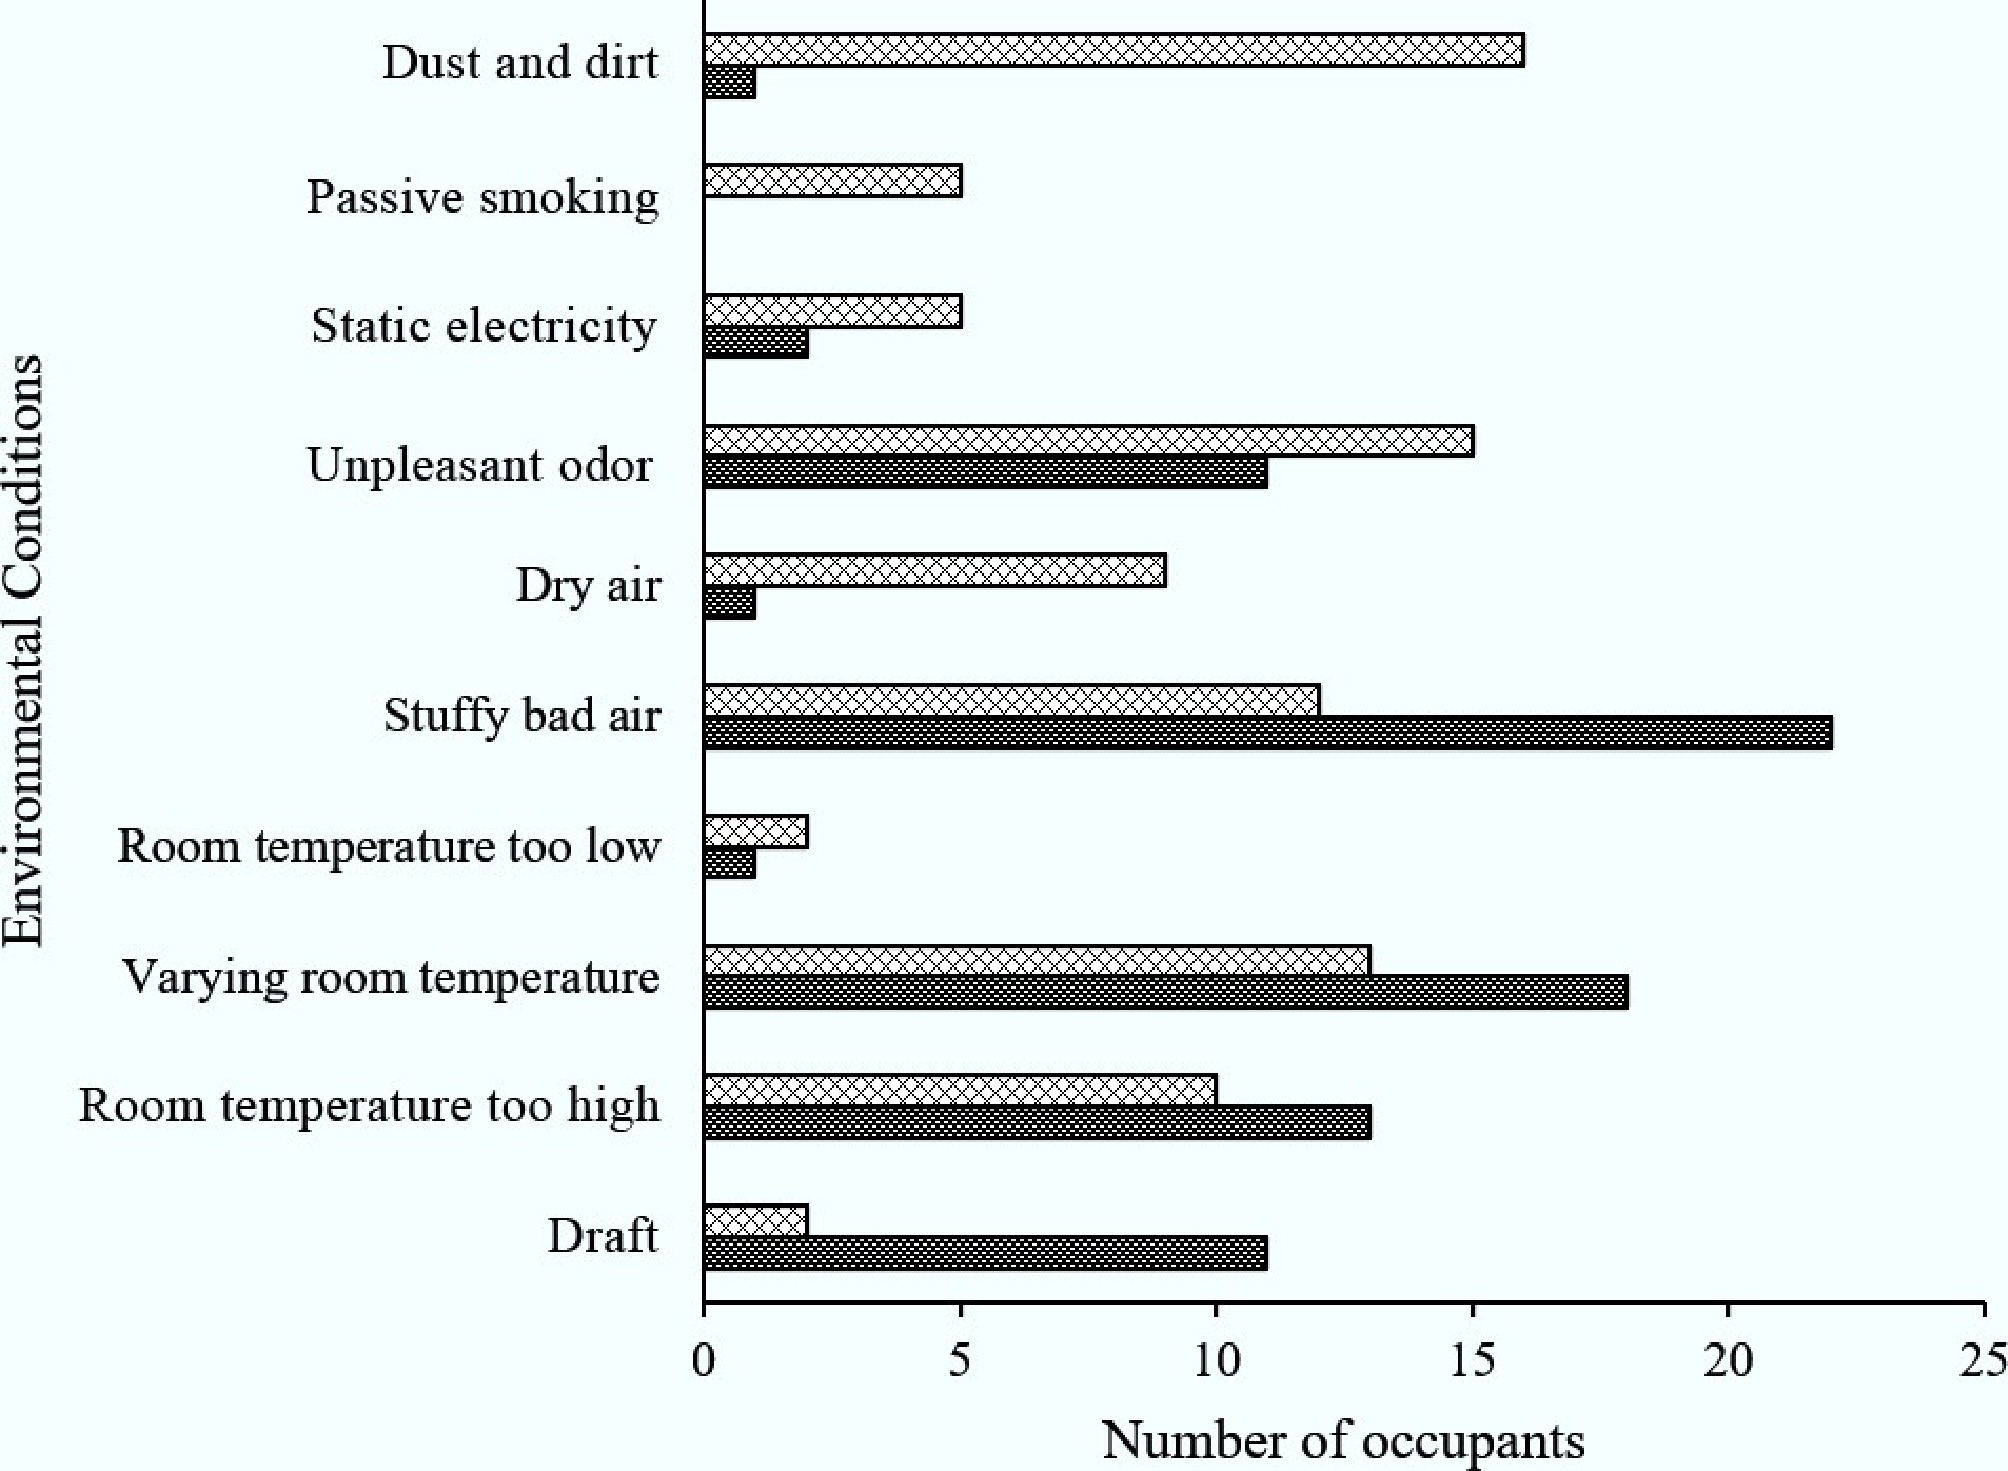
Figure 5.
Environmental conditions in cafeterias A and B that often affect the occupants.
-
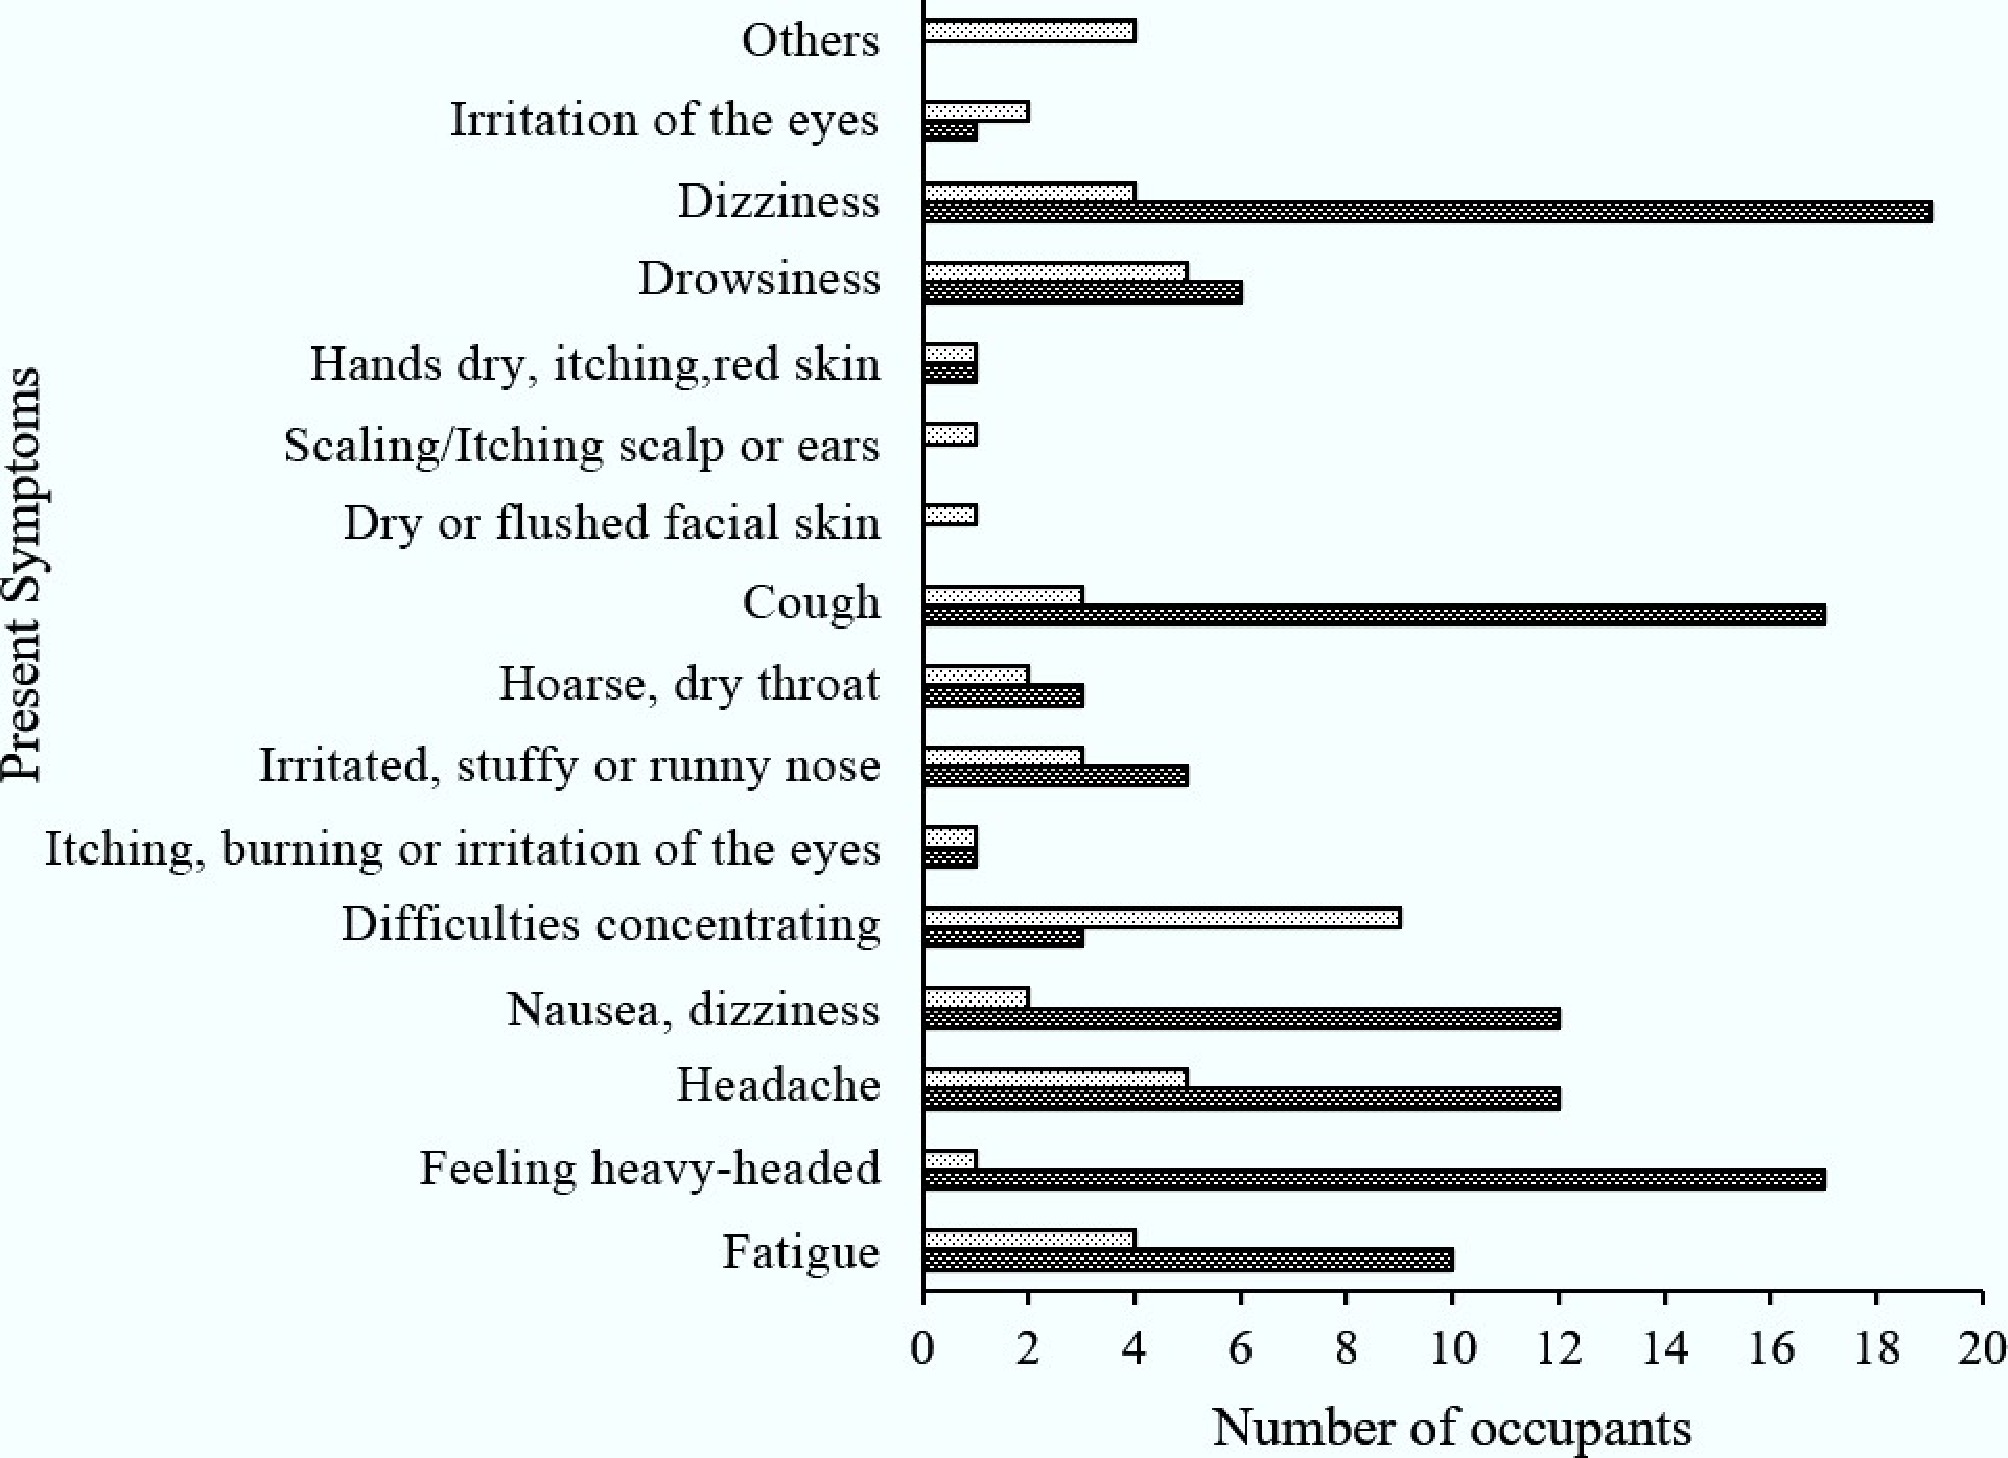
Figure 6.
Present symptoms of occupants in cafeterias A and B that often affect the occupants.
-
Likelihood Level Criteria to consider Almost certain 5 8–10 parameters exceeding the acceptable limit Likely 4 5–7 parameters exceeding the acceptable limit Possible 3 3–4 parameters exceeding the acceptable limit Unlikely 2 1–2 parameters exceeding the acceptable limit Rare 1 No parameters exceeding the acceptable limit Table 1.
Likelihood for calculation of risk assessment
-
Severity Level Criteria to consider Catastrophic 5 90%–100% of the occupants based on three main symptoms Fatal 4 61%–90% of the occupants based on three main symptoms Serious 3 31%–60% of the occupants based on three main symptoms Minor 2 1%–30% of the occupants based on three main symptoms Negligible 1 No symptoms appeared Table 2.
Severity for calculation of risk assessment
-
No. Sample
nameTotal bacteria counts (cfu/m3) Total fungi counts (cfu/m3) Cafeteria A Cafeteria B Cafeteria A Cafeteria B 1 Blank 1 - incubator 0 0 0 0 2 Blank 2 - icebox 0 0 0 0 3 Blank 3 - biostage 0 0 0 0 4 1 71 336 643 18 5 2 18 371 509 194 6 3 161 459 446 230 7 4 72 300 554 0 8 5 107 1,466 821 177 The acceptable limit for total bacteria counts based on ICOP 2010, Malaysia = 500 cfu/m3. The acceptable limit for total fungi counts based on ICOP 2010, Malaysia = 1000 cfu/m3. Table 3.
Total fungi counts and total bacteria counts in cafeterias A and B
-
Factor Cafeteria A Cafeteria B Body weight (BW) 62 kg 62 kg Inhalation rate (InhR) 20 m3/d 20 m3/d Exposure frequency (EF) 260 d/year 260 d/year Exposure duration (ED) 50 years 50 years Averaging time (ATnoncare)a 18,250 d
(ED × 365 d)18,250 d
(ED × 365 d)Reference concentration (RfC)b 150 µg/m3 150 µg/m3 Reference concentration (RfC)c 45 µg/m3 45 µg/m3 Average concentration of PM10 in indoor air (c) 203 µg/m3 220 µg/m3 a Average years of exposure. b Value taken from ICOP IAQ 2010. c Value taken from WHO 2021. Table 4.
Exposure factors for calculating the exposure dose in health risk assessment
Figures
(6)
Tables
(4)