-
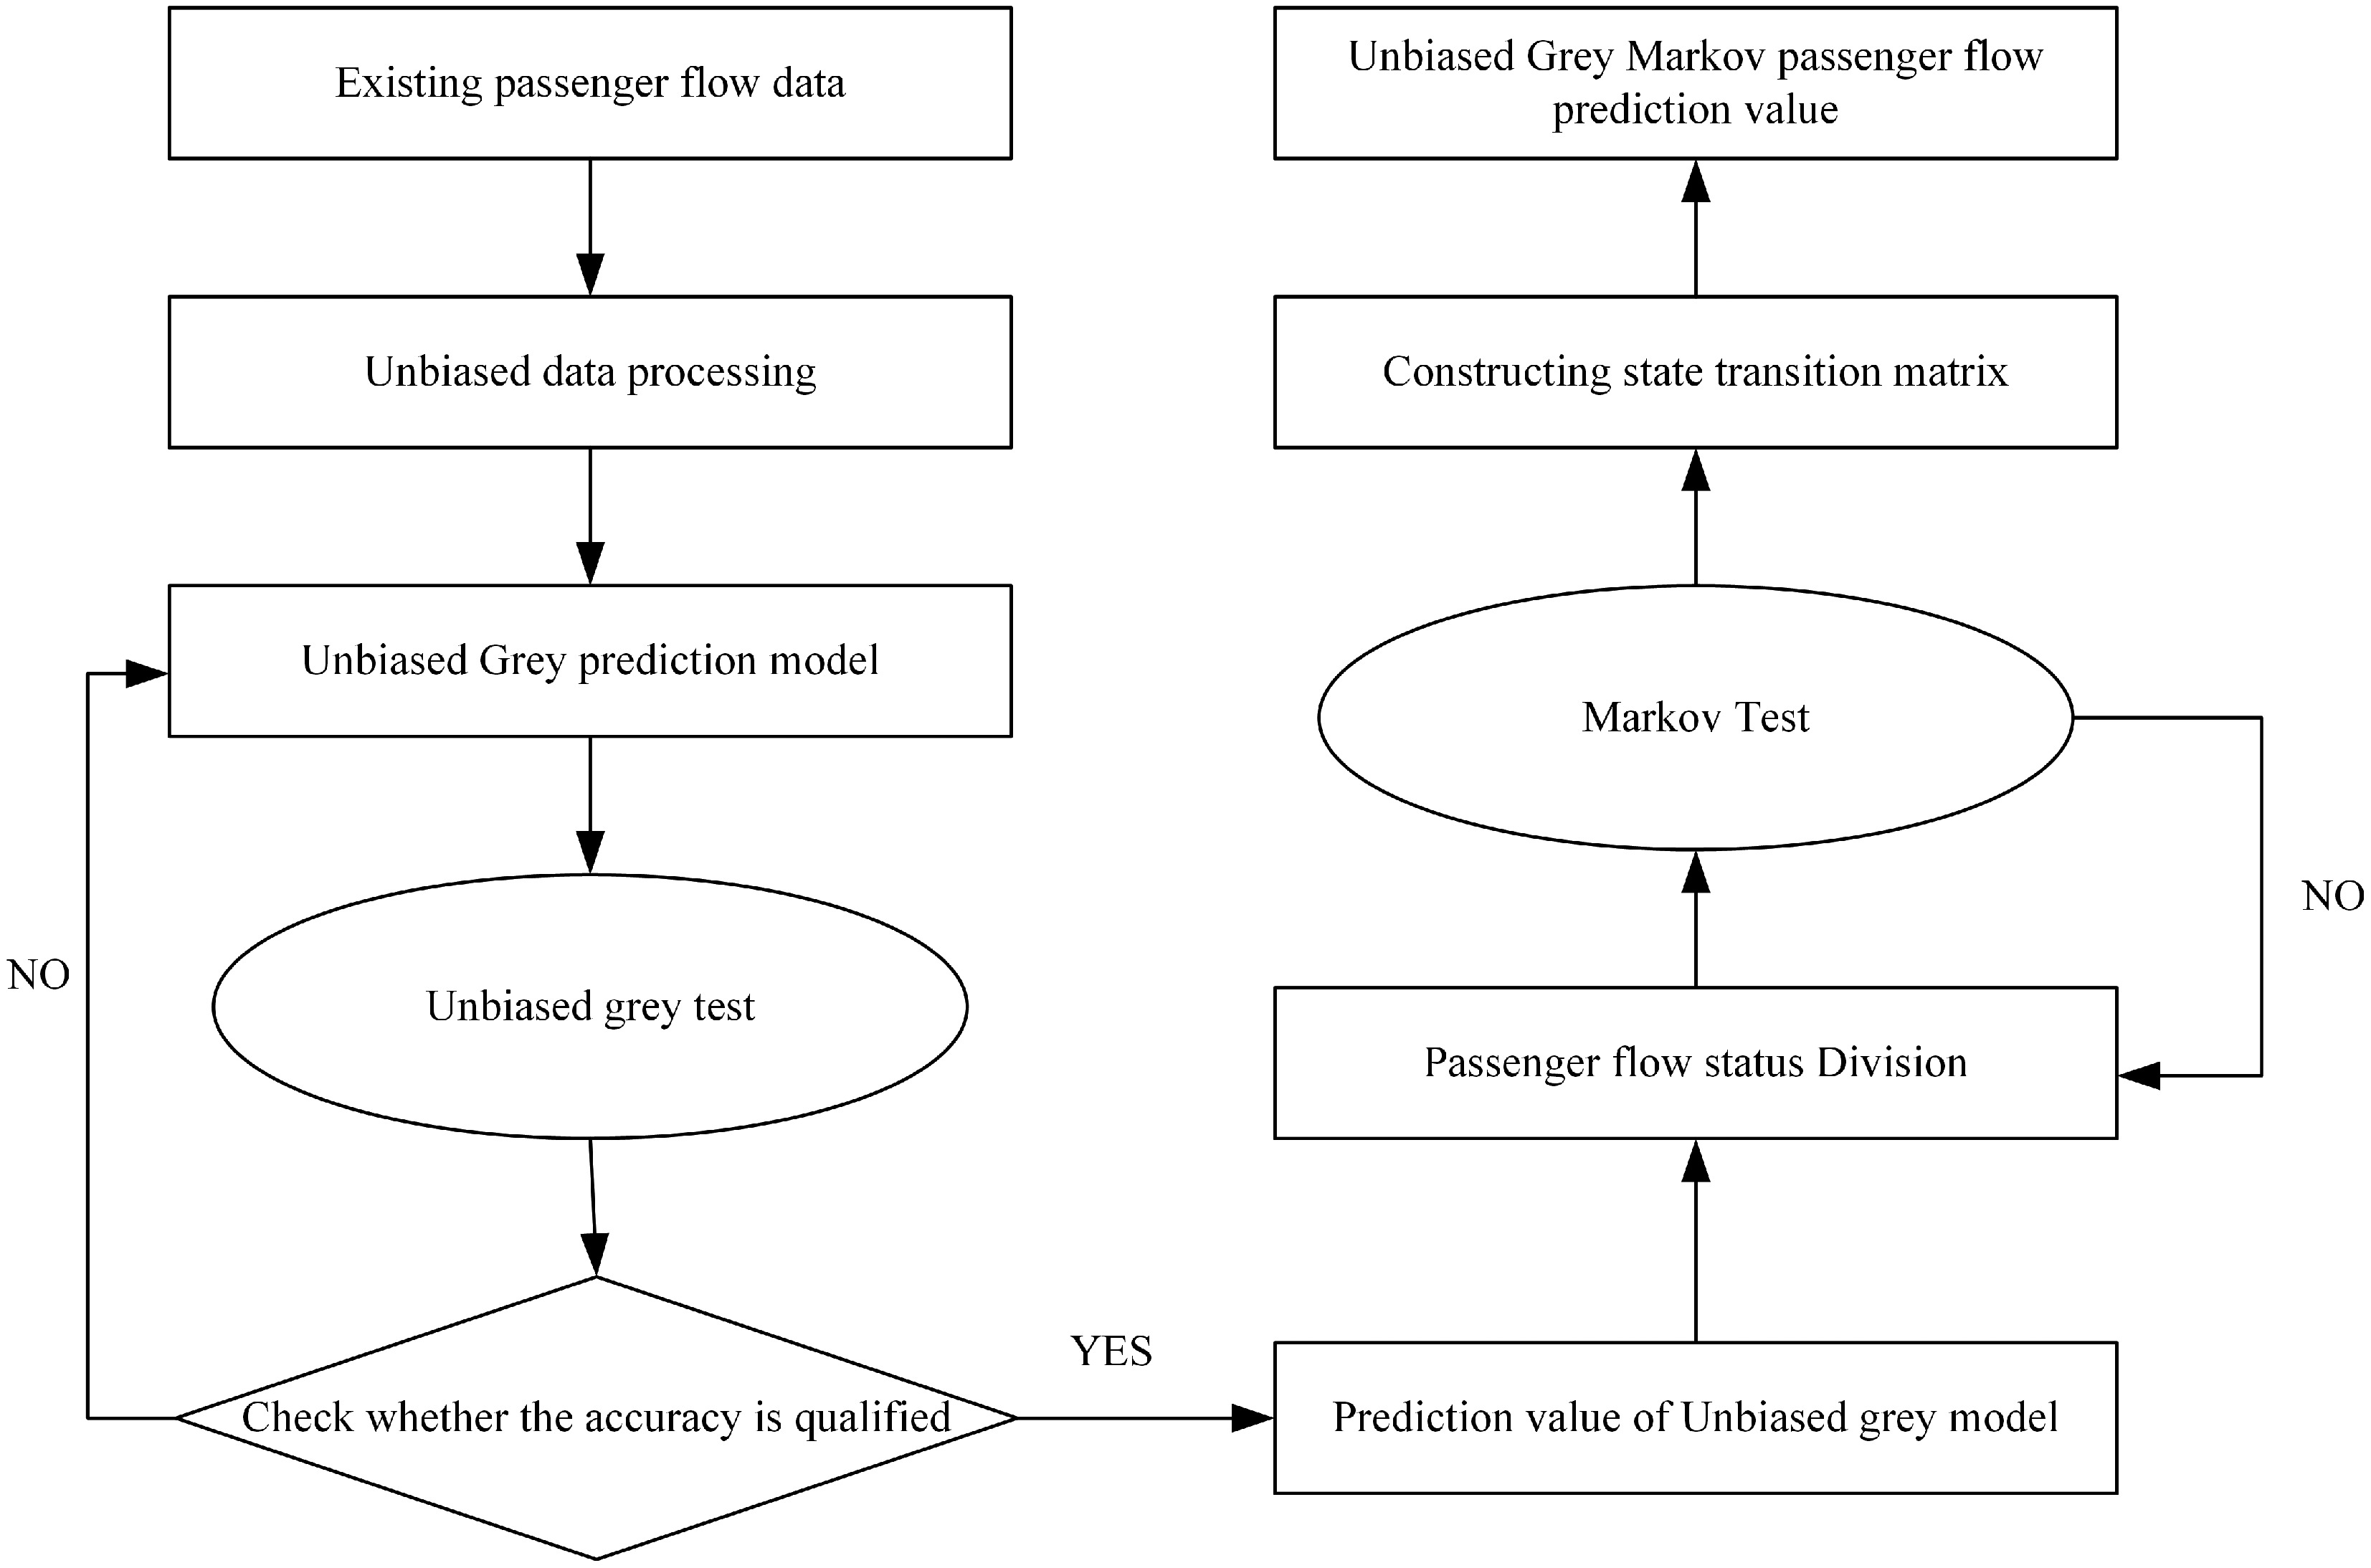
Figure 1.
Technological road map.
-
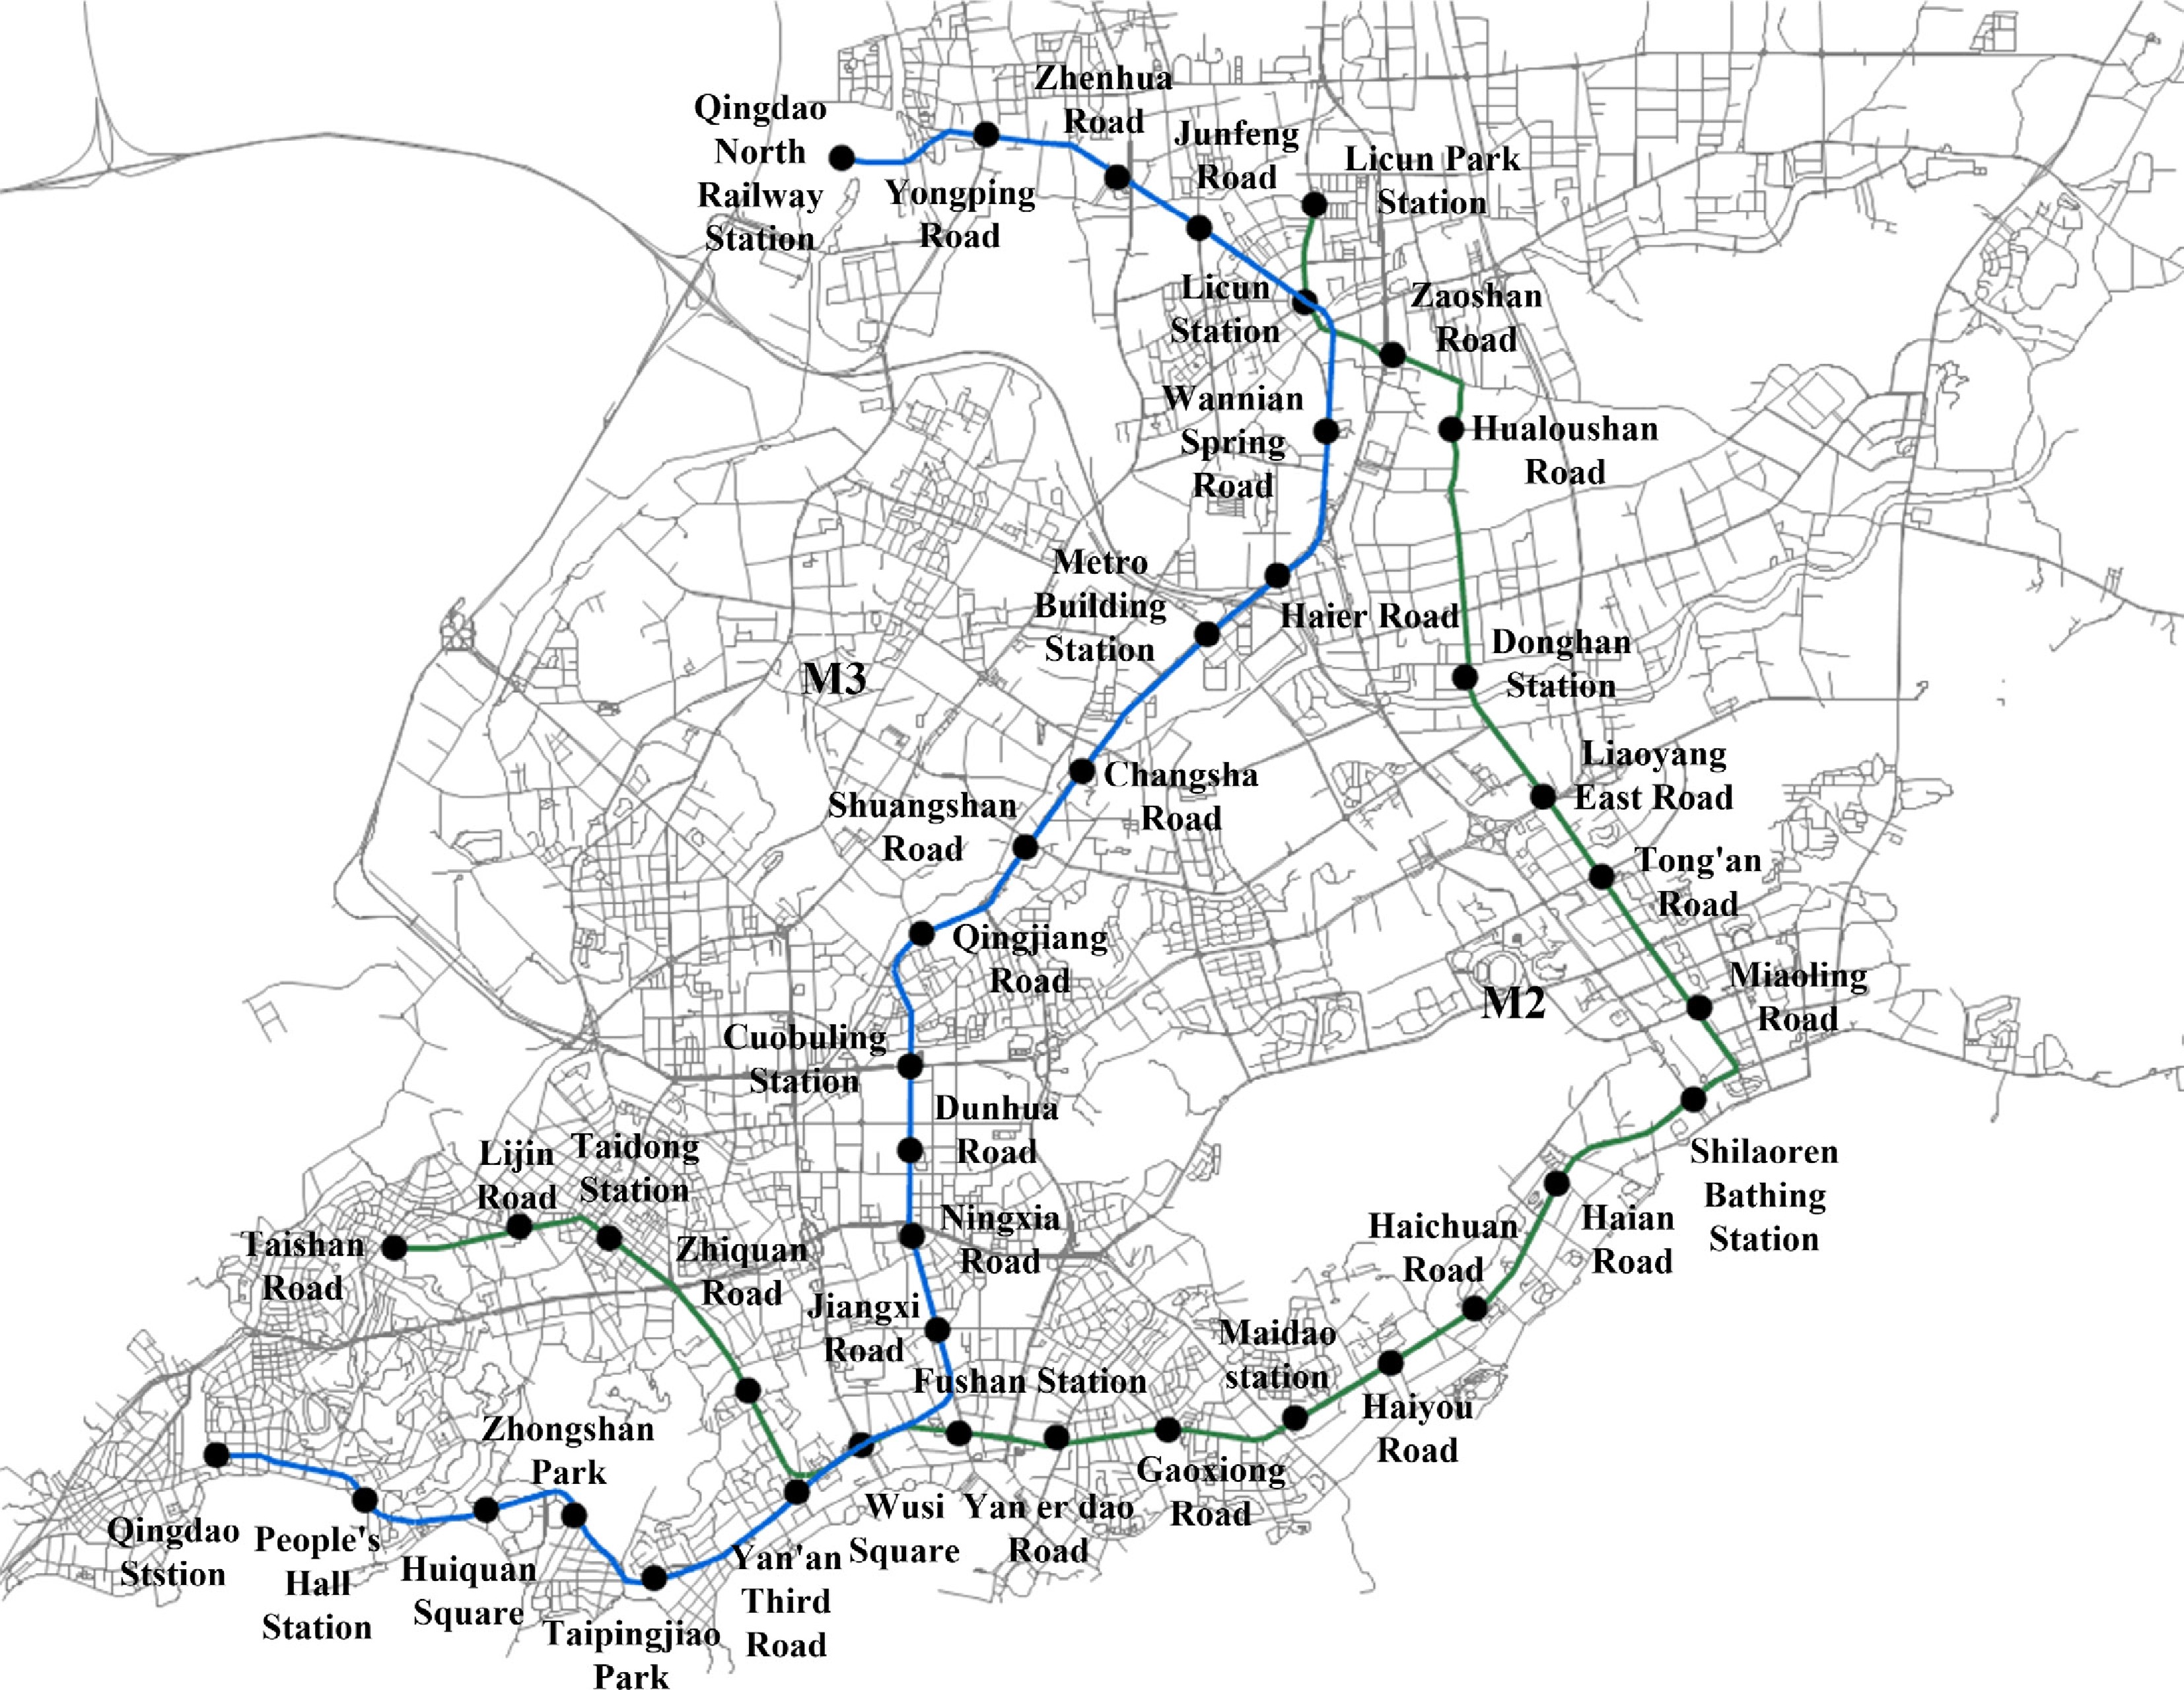
Figure 2.
Route map of Lines 2 and 3. Source: the authors.
-
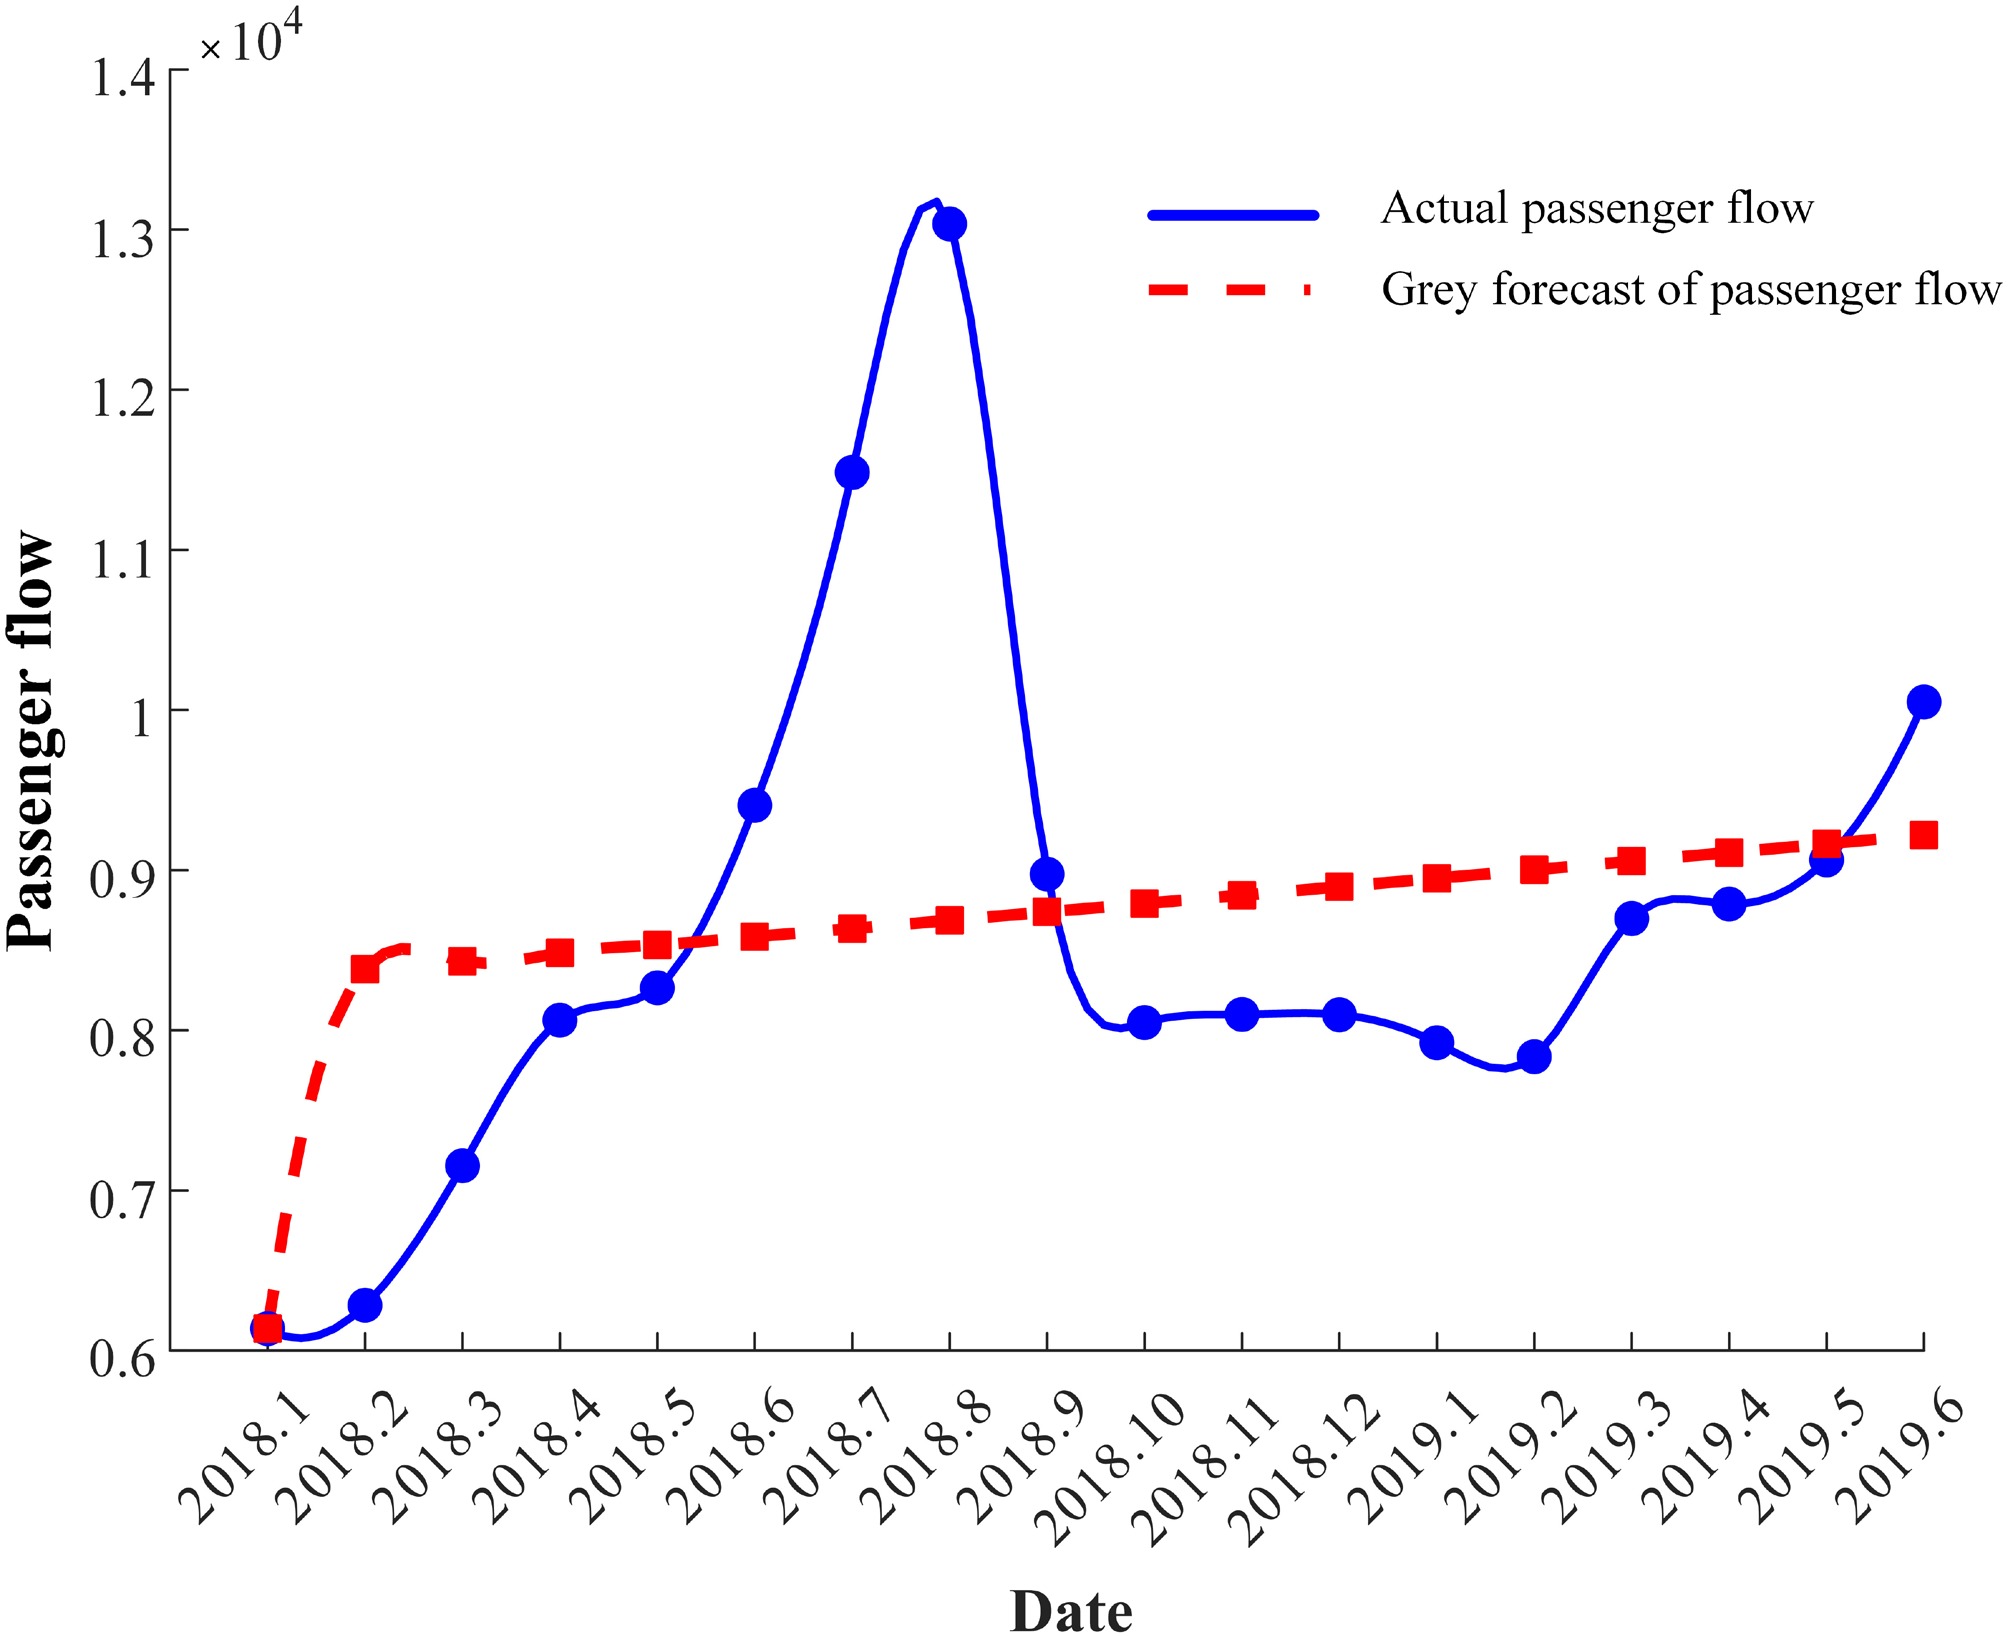
Figure 3.
Fitting diagram of the actual passenger flow and the grey model's forecasted passenger flow.
-
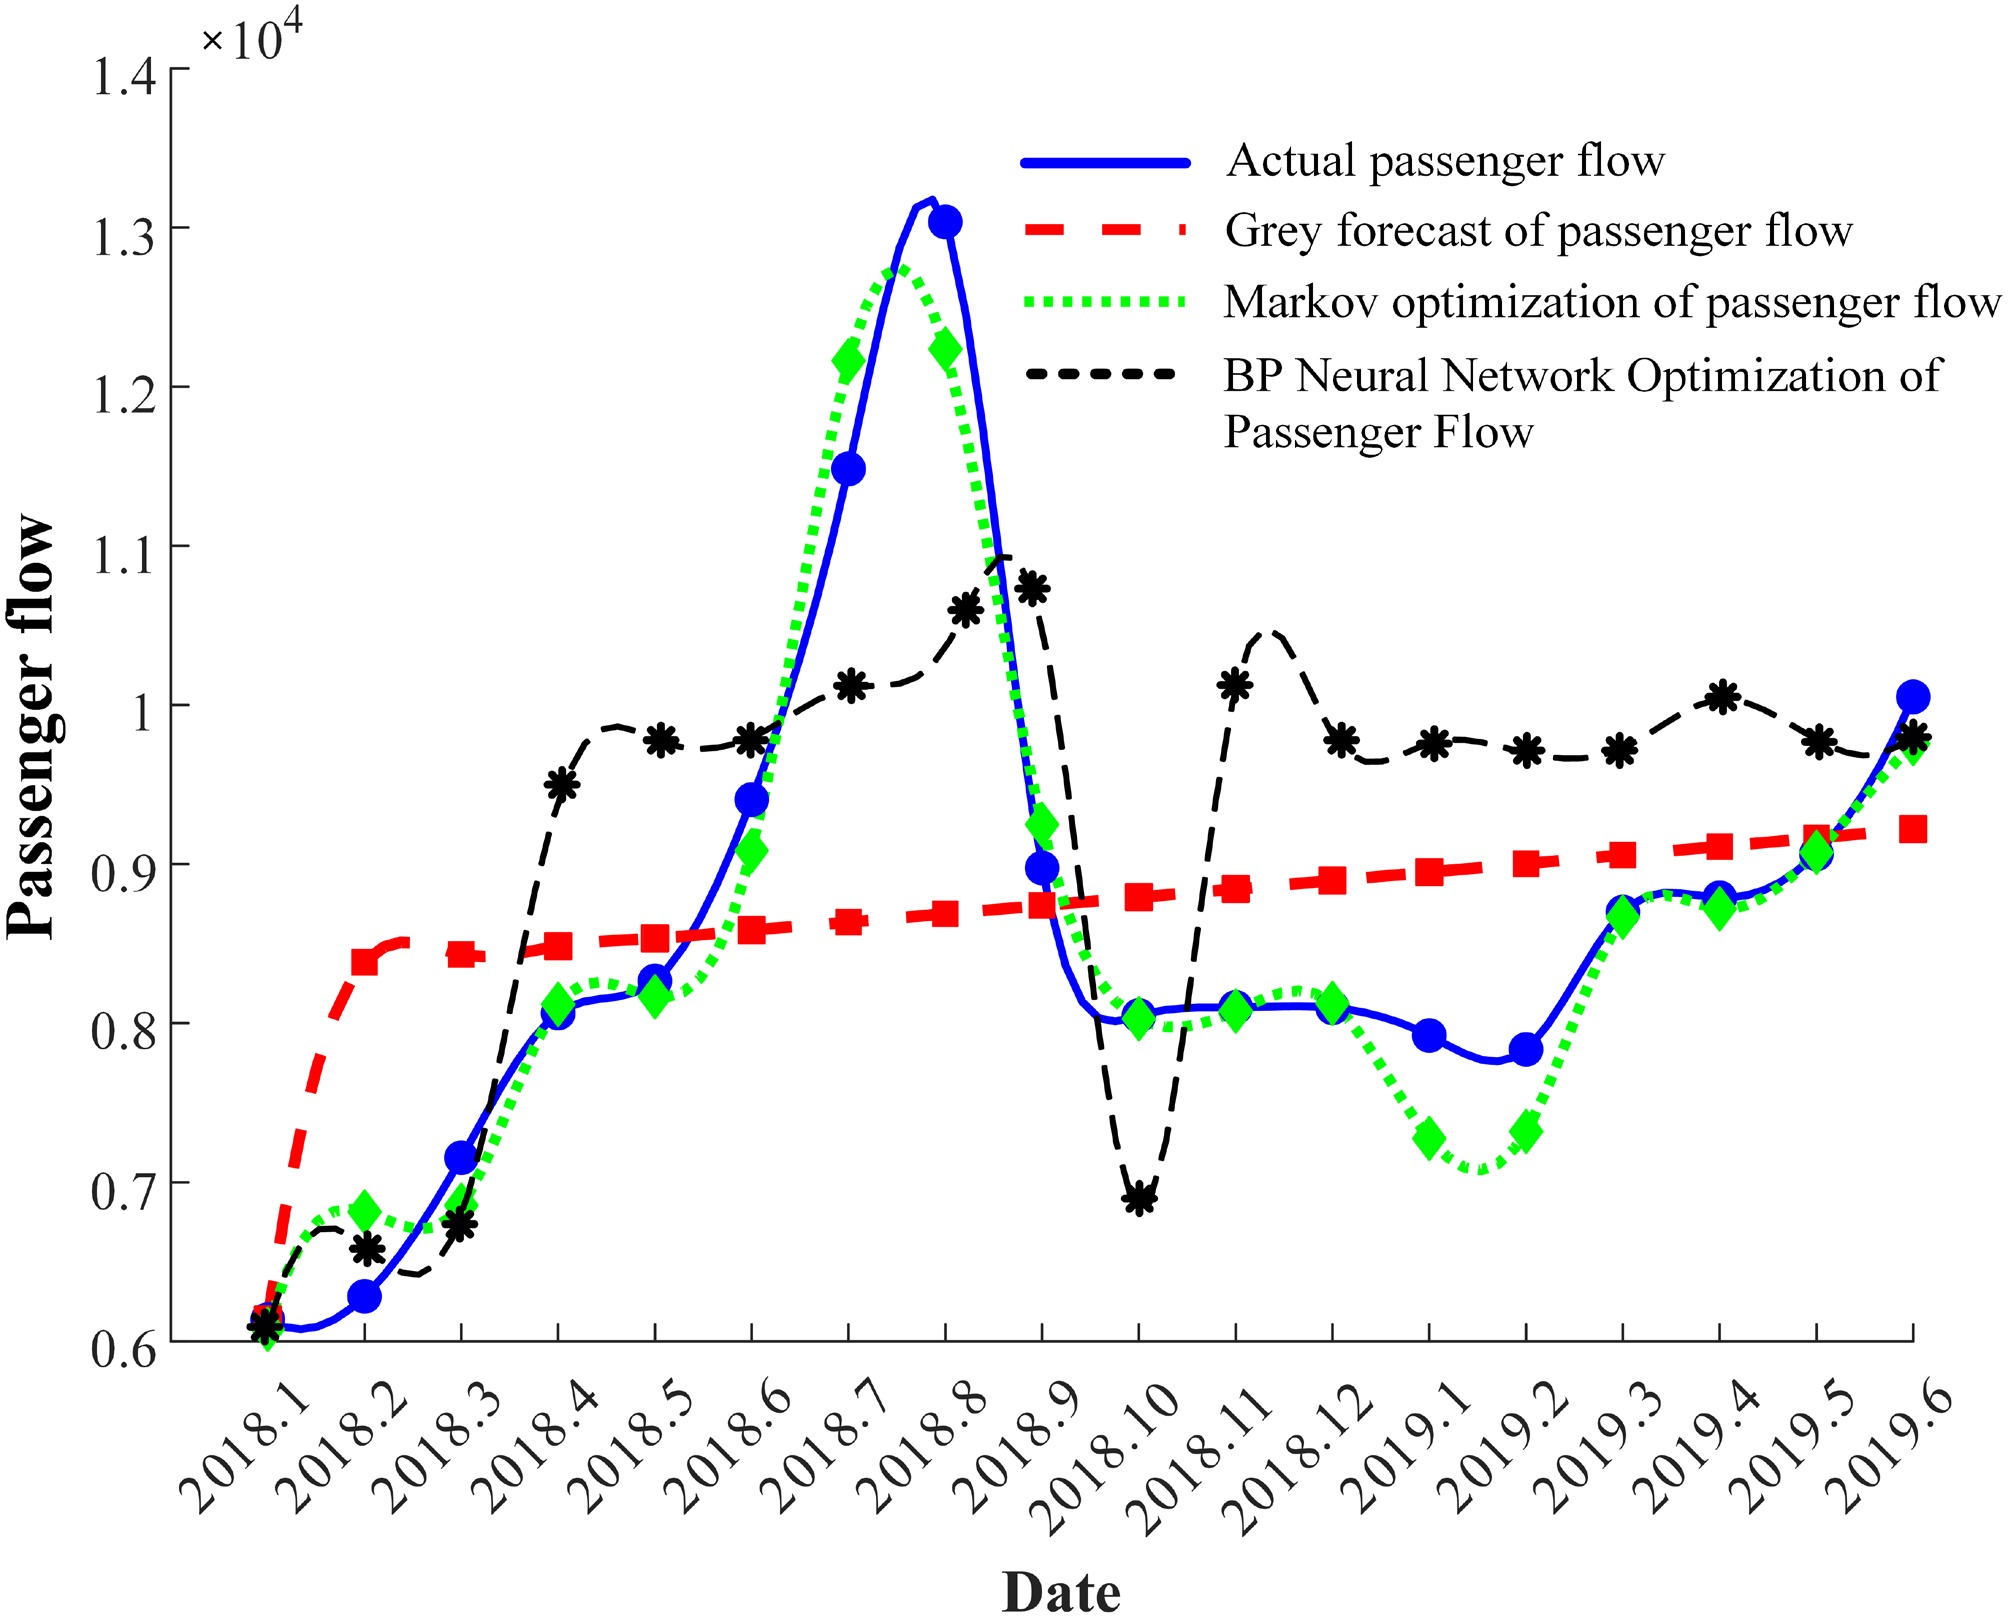
Figure 4.
Comparison of the fits of four datasets.
-
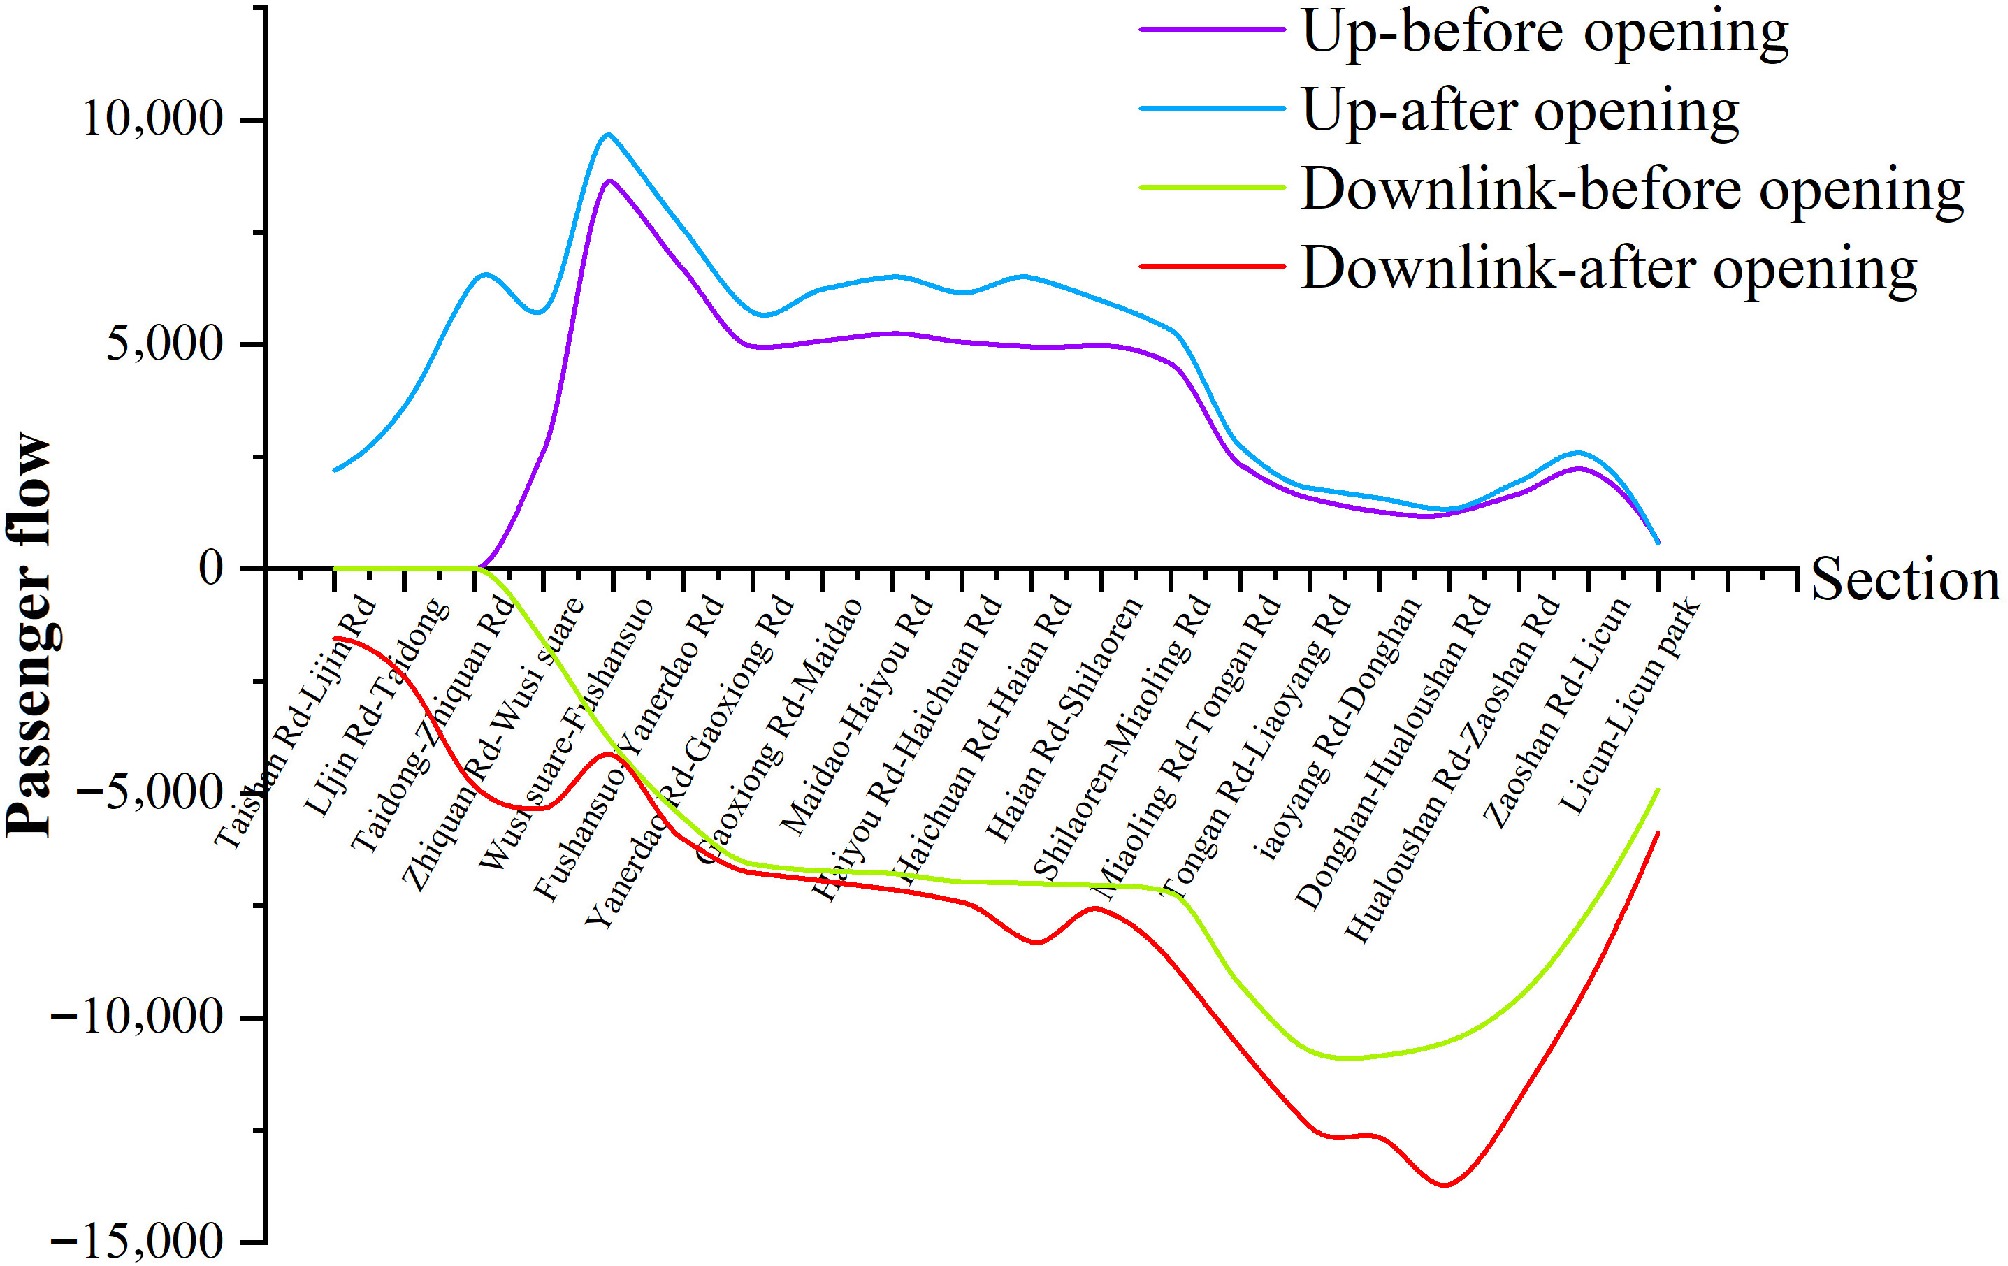
Figure 5.
Maximum cross-sectional passenger flows through each station before and after the opening of the second phase of Line 2.
-
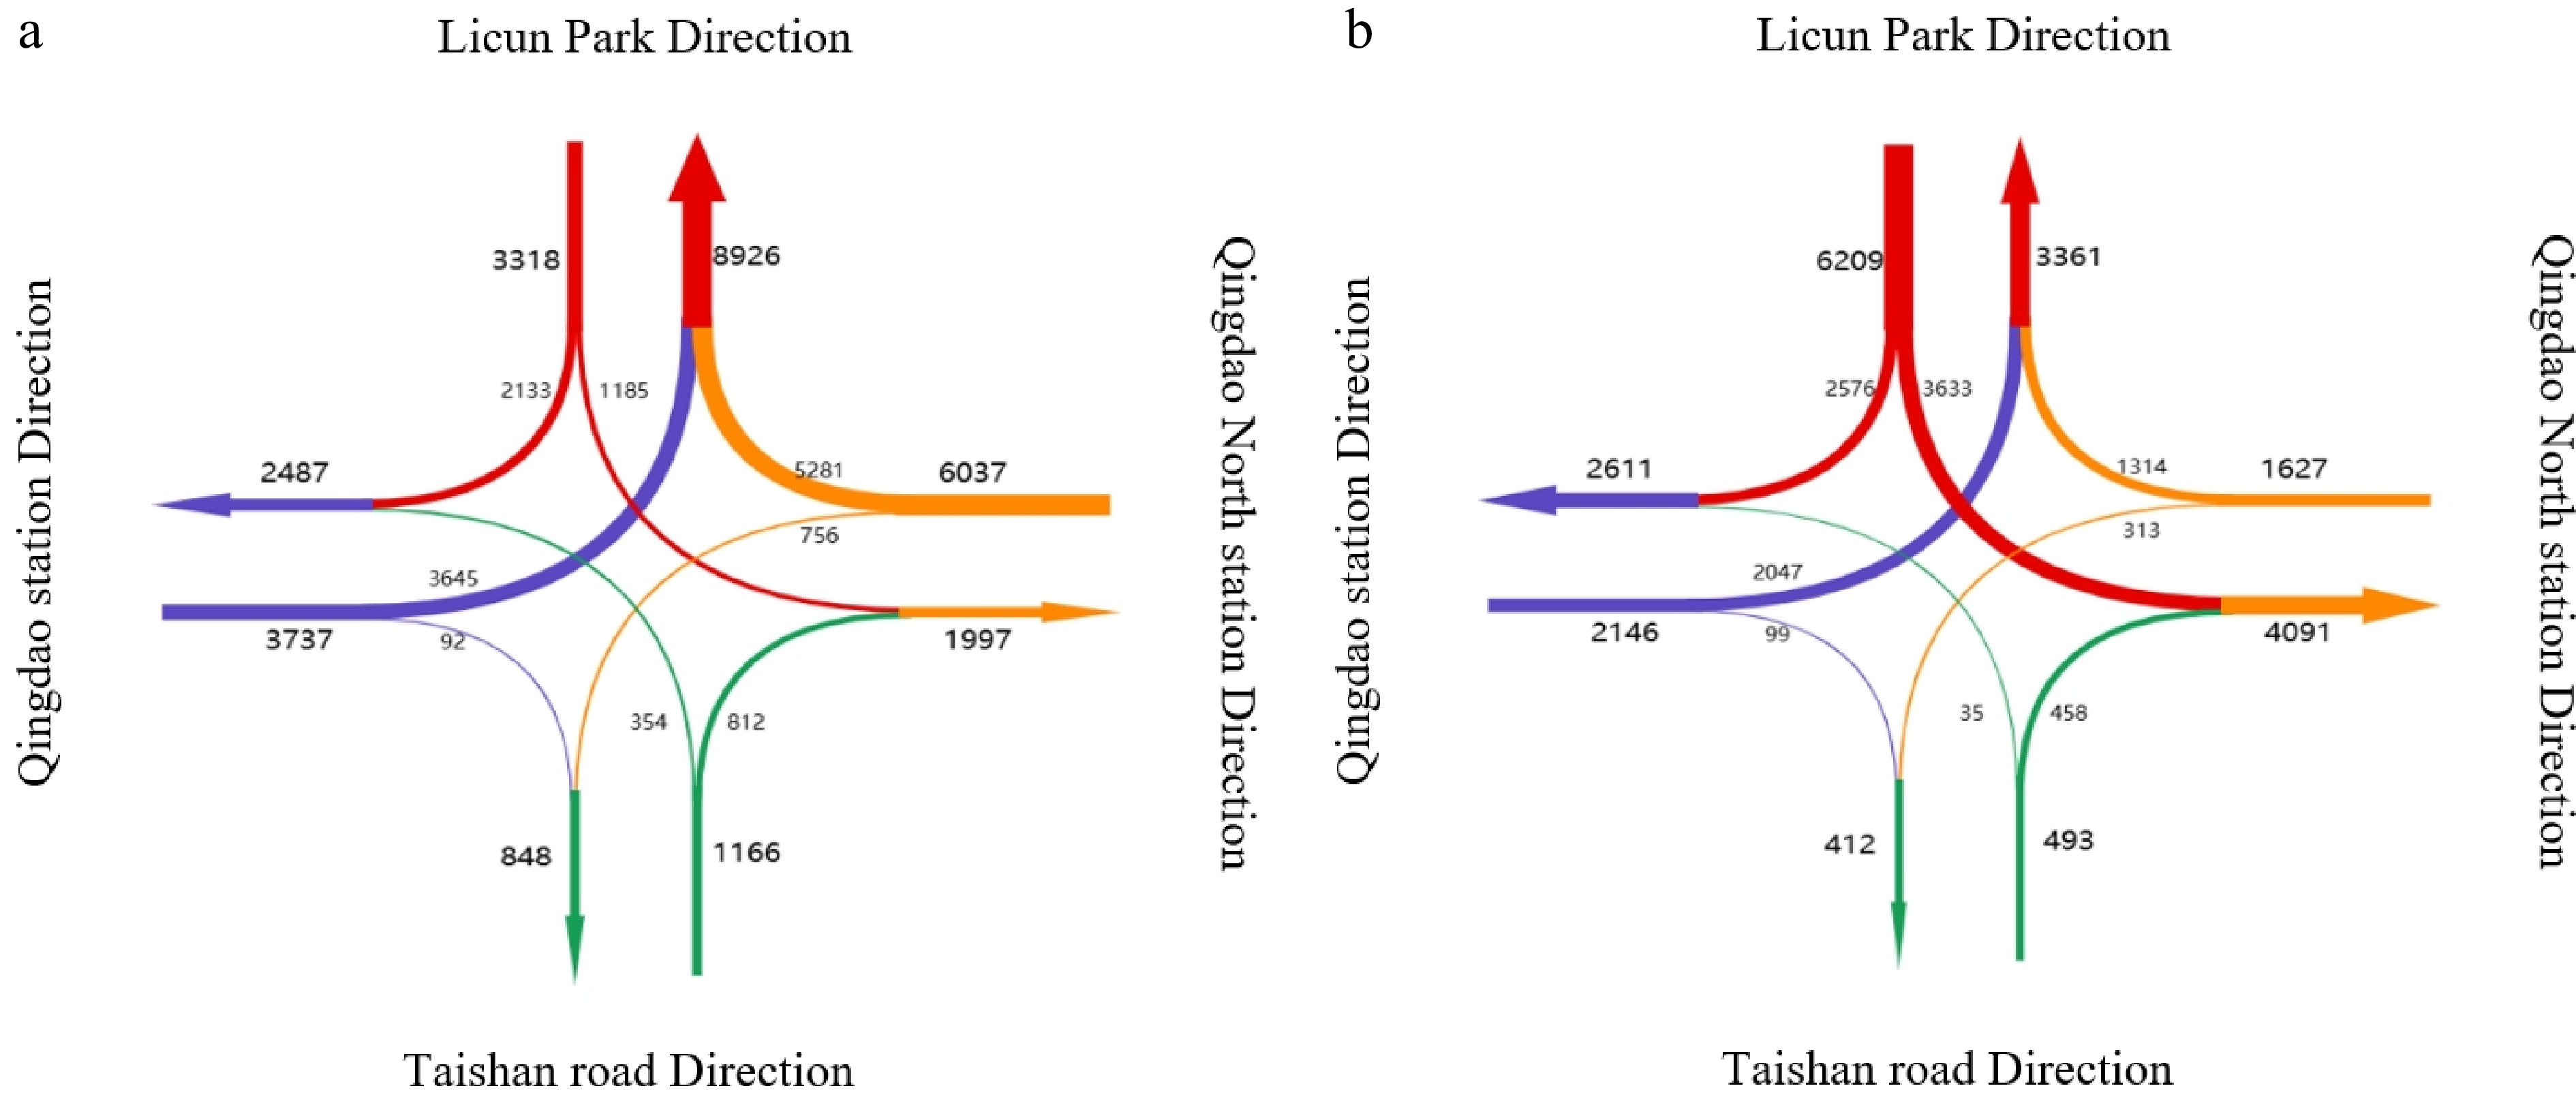
Figure 6.
Predicted direction of passenger flows through Wu Si Square Station in the morning and evening peak times. (a) Morning rush hour. (b) Evening rush hour.
-
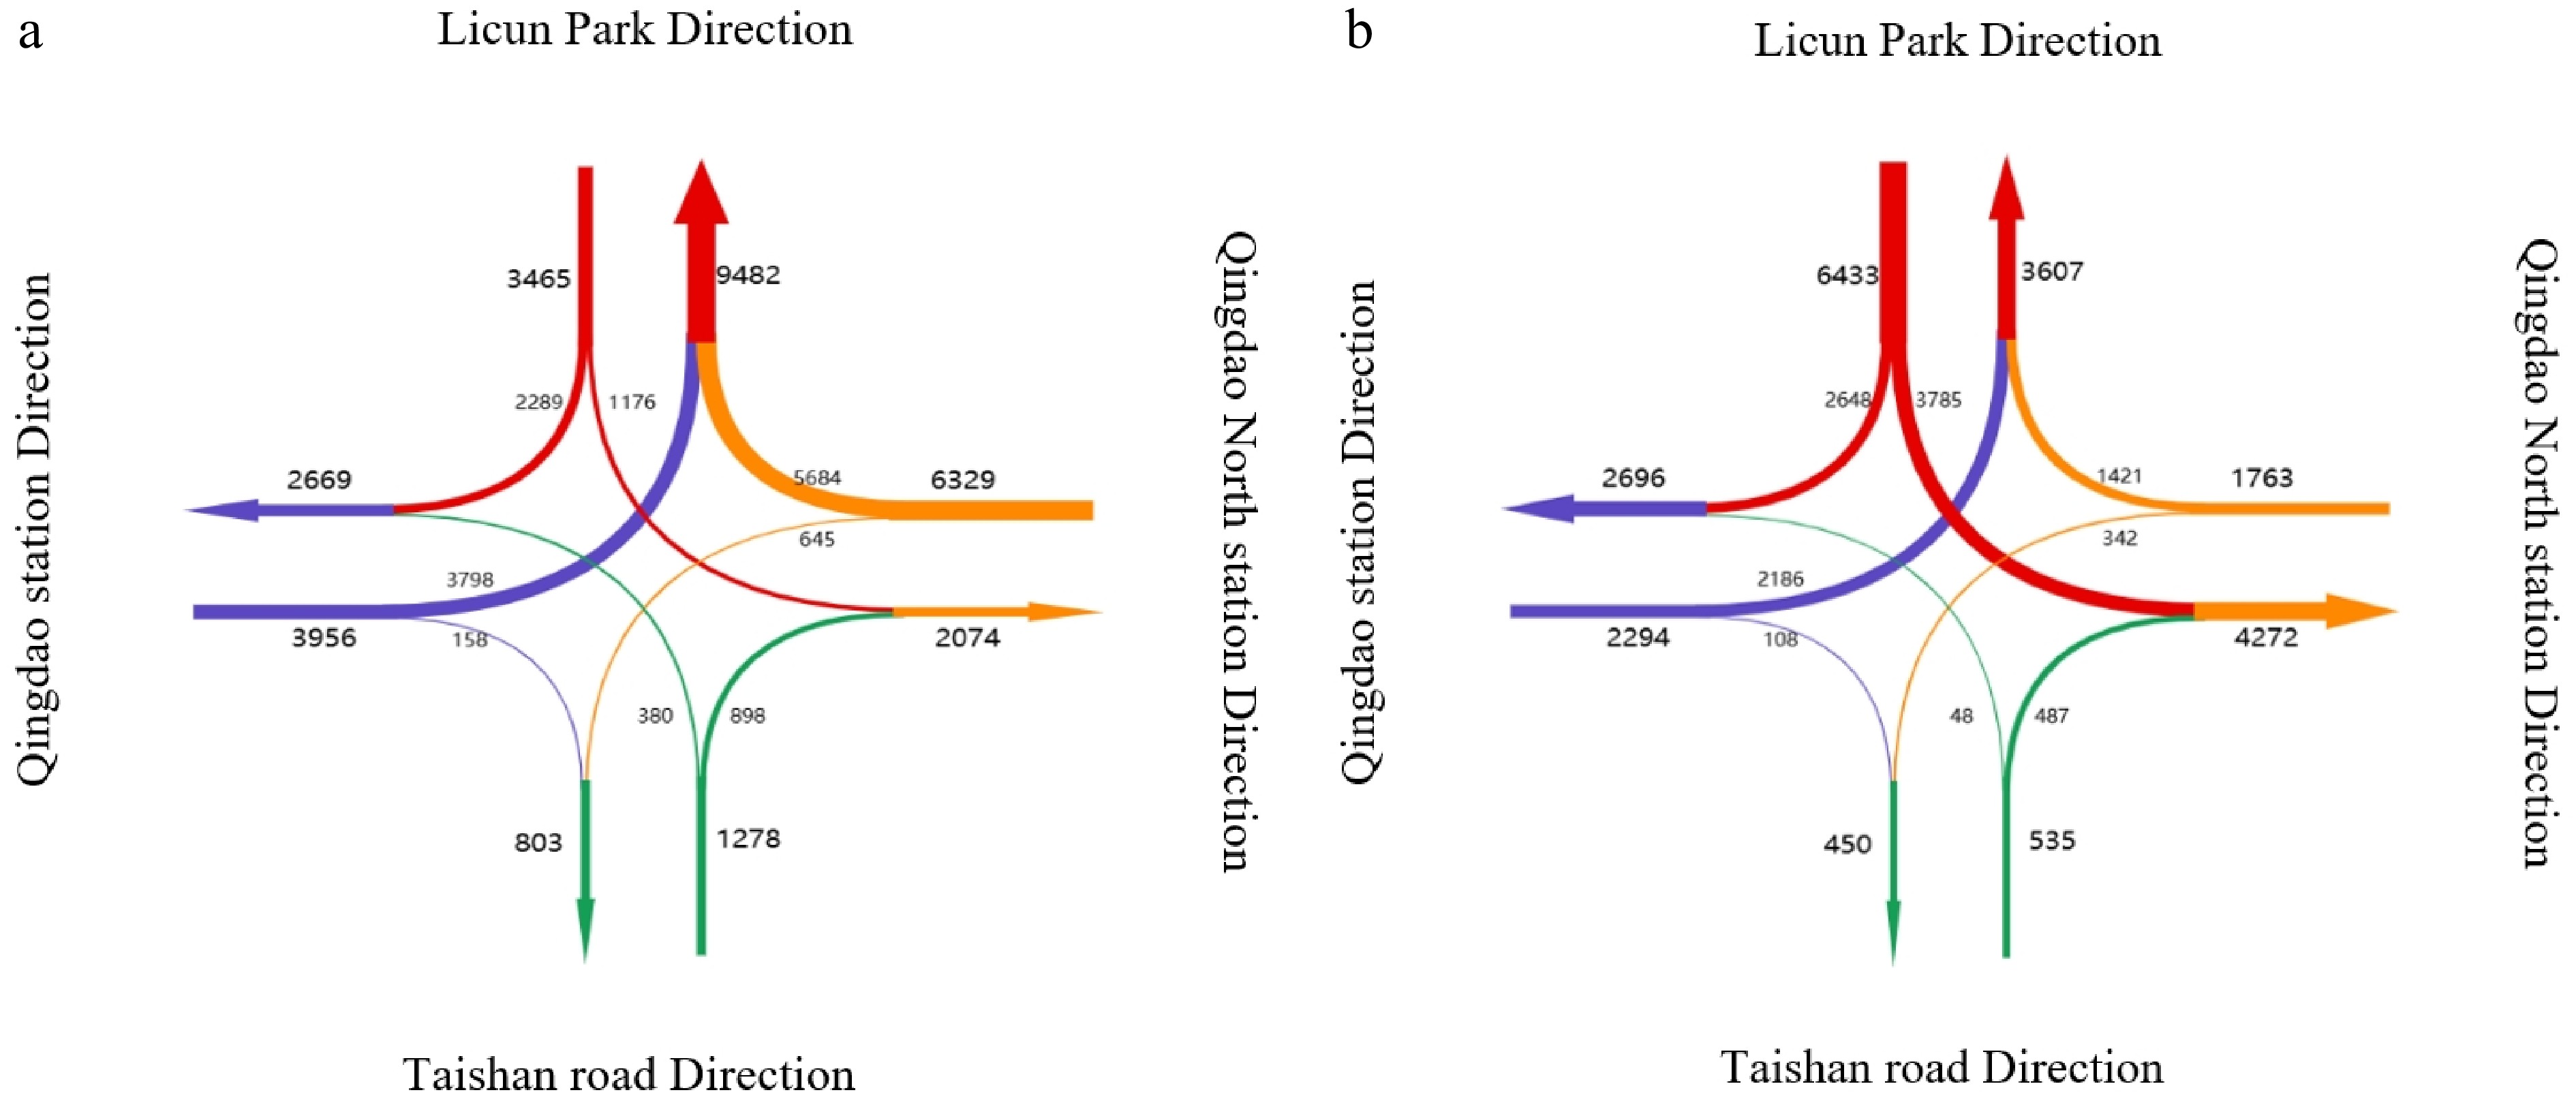
Figure 7.
Actual direction of passenger flows through Wu Si Square Station in the morning and evening peak times. (a) Morning rush hour. (b) Evening rush hour.
-
Inspection-level accuracy First-order accuracy Second-order accuracy Third-order accuracy Fourth-order accuracy D D < 0.35 0.35 ≤ D < 0.5 0.5 ≤ D < 0.75 D ≥ 0.75 Table 1.
Inspection-level parameters.
-
Date Average daily passenger
flow (persons)Date Average daily passenger
flow (persons)2018.1 6,138 2018.10 8,049 2018.2 6,284 2018.11 8,100 2018.3 7,155 2018.12 8,098 2018.4 8,064 2019.1 7,923 2018.5 8,266 2019.2 7,836 2018.6 9,406 2019.3 8,699 2018.7 11,484 2019.4 8,789 2018.8 13,036 2019.5 9,065 2018.9 8,976 2019.6 10,051 Table 2.
Average daily passenger flows into Shilaoren Bathing Beach Station on weekdays
-
Date Predicted value (persons) Relative
error (%)Date Predicted value (persons) Relative
error (%)2018.1 6,138 0.00 2018.10 8,792 −9.23 2018.2 8,383 −33.41 2018.11 8,844 −9.19 2018.3 8,433 −17.87 2018.12 8,897 −9.86 2018.4 8,484 −5.20 2019.1 8,950 −12.96 2018.5 8,534 −3.24 2019.2 9,003 −14.90 2018.6 8,585 8.73 2019.3 9,057 −4.11 2018.7 8,636 24.80 2019.4 9,111 −3.66 2018.8 8,688 33.36 2019.5 9,165 −1.11 2018.9 8,740 2.63 2019.6 9,220 8.27 Table 3.
The grey prediction model's predictions and relative error
-
Parameter $ \overline{X} $ S1 $ \overline{q} $ S2 D Numerical value 8,634 1,661 1,023 1,093 0.658 Table 4.
The grey model's inspection parameters
-
Status range E1 E2 E3 E4 E5 E6 Interval division [−34, −12] [−10, −9] [−6, −3] [−2, 0] [2, 9] [24, 34] Table 5.
Division of status intervals
-
Date Optimized value (persons) Date Optimized value (persons) 2018.1 6,077 2018.10 8,029 2018.2 6,815 2018.11 8,077 2018.3 6,856 2018.12 8,125 2018.4 8,119 2019.1 7,276 2018.5 8,167 2019.2 7,320 2018.6 9,085 2019.3 8,667 2018.7 12,163 2019.4 8,719 2018.8 12,237 2019.5 9,074 2018.9 9,249 2019.6 9,757 Table 6.
Optimized data of the Markov model
-
Date Optimized value (persons) Actual value (persons) Relative error 2019.7 12,218 13,567 9.94% 2019.8 13,172 14,600 7.73% 2019.9 10,637 9,772 8.85% Table 7.
Comparison of optimized data with the original data.
Figures
(7)
Tables
(7)