-
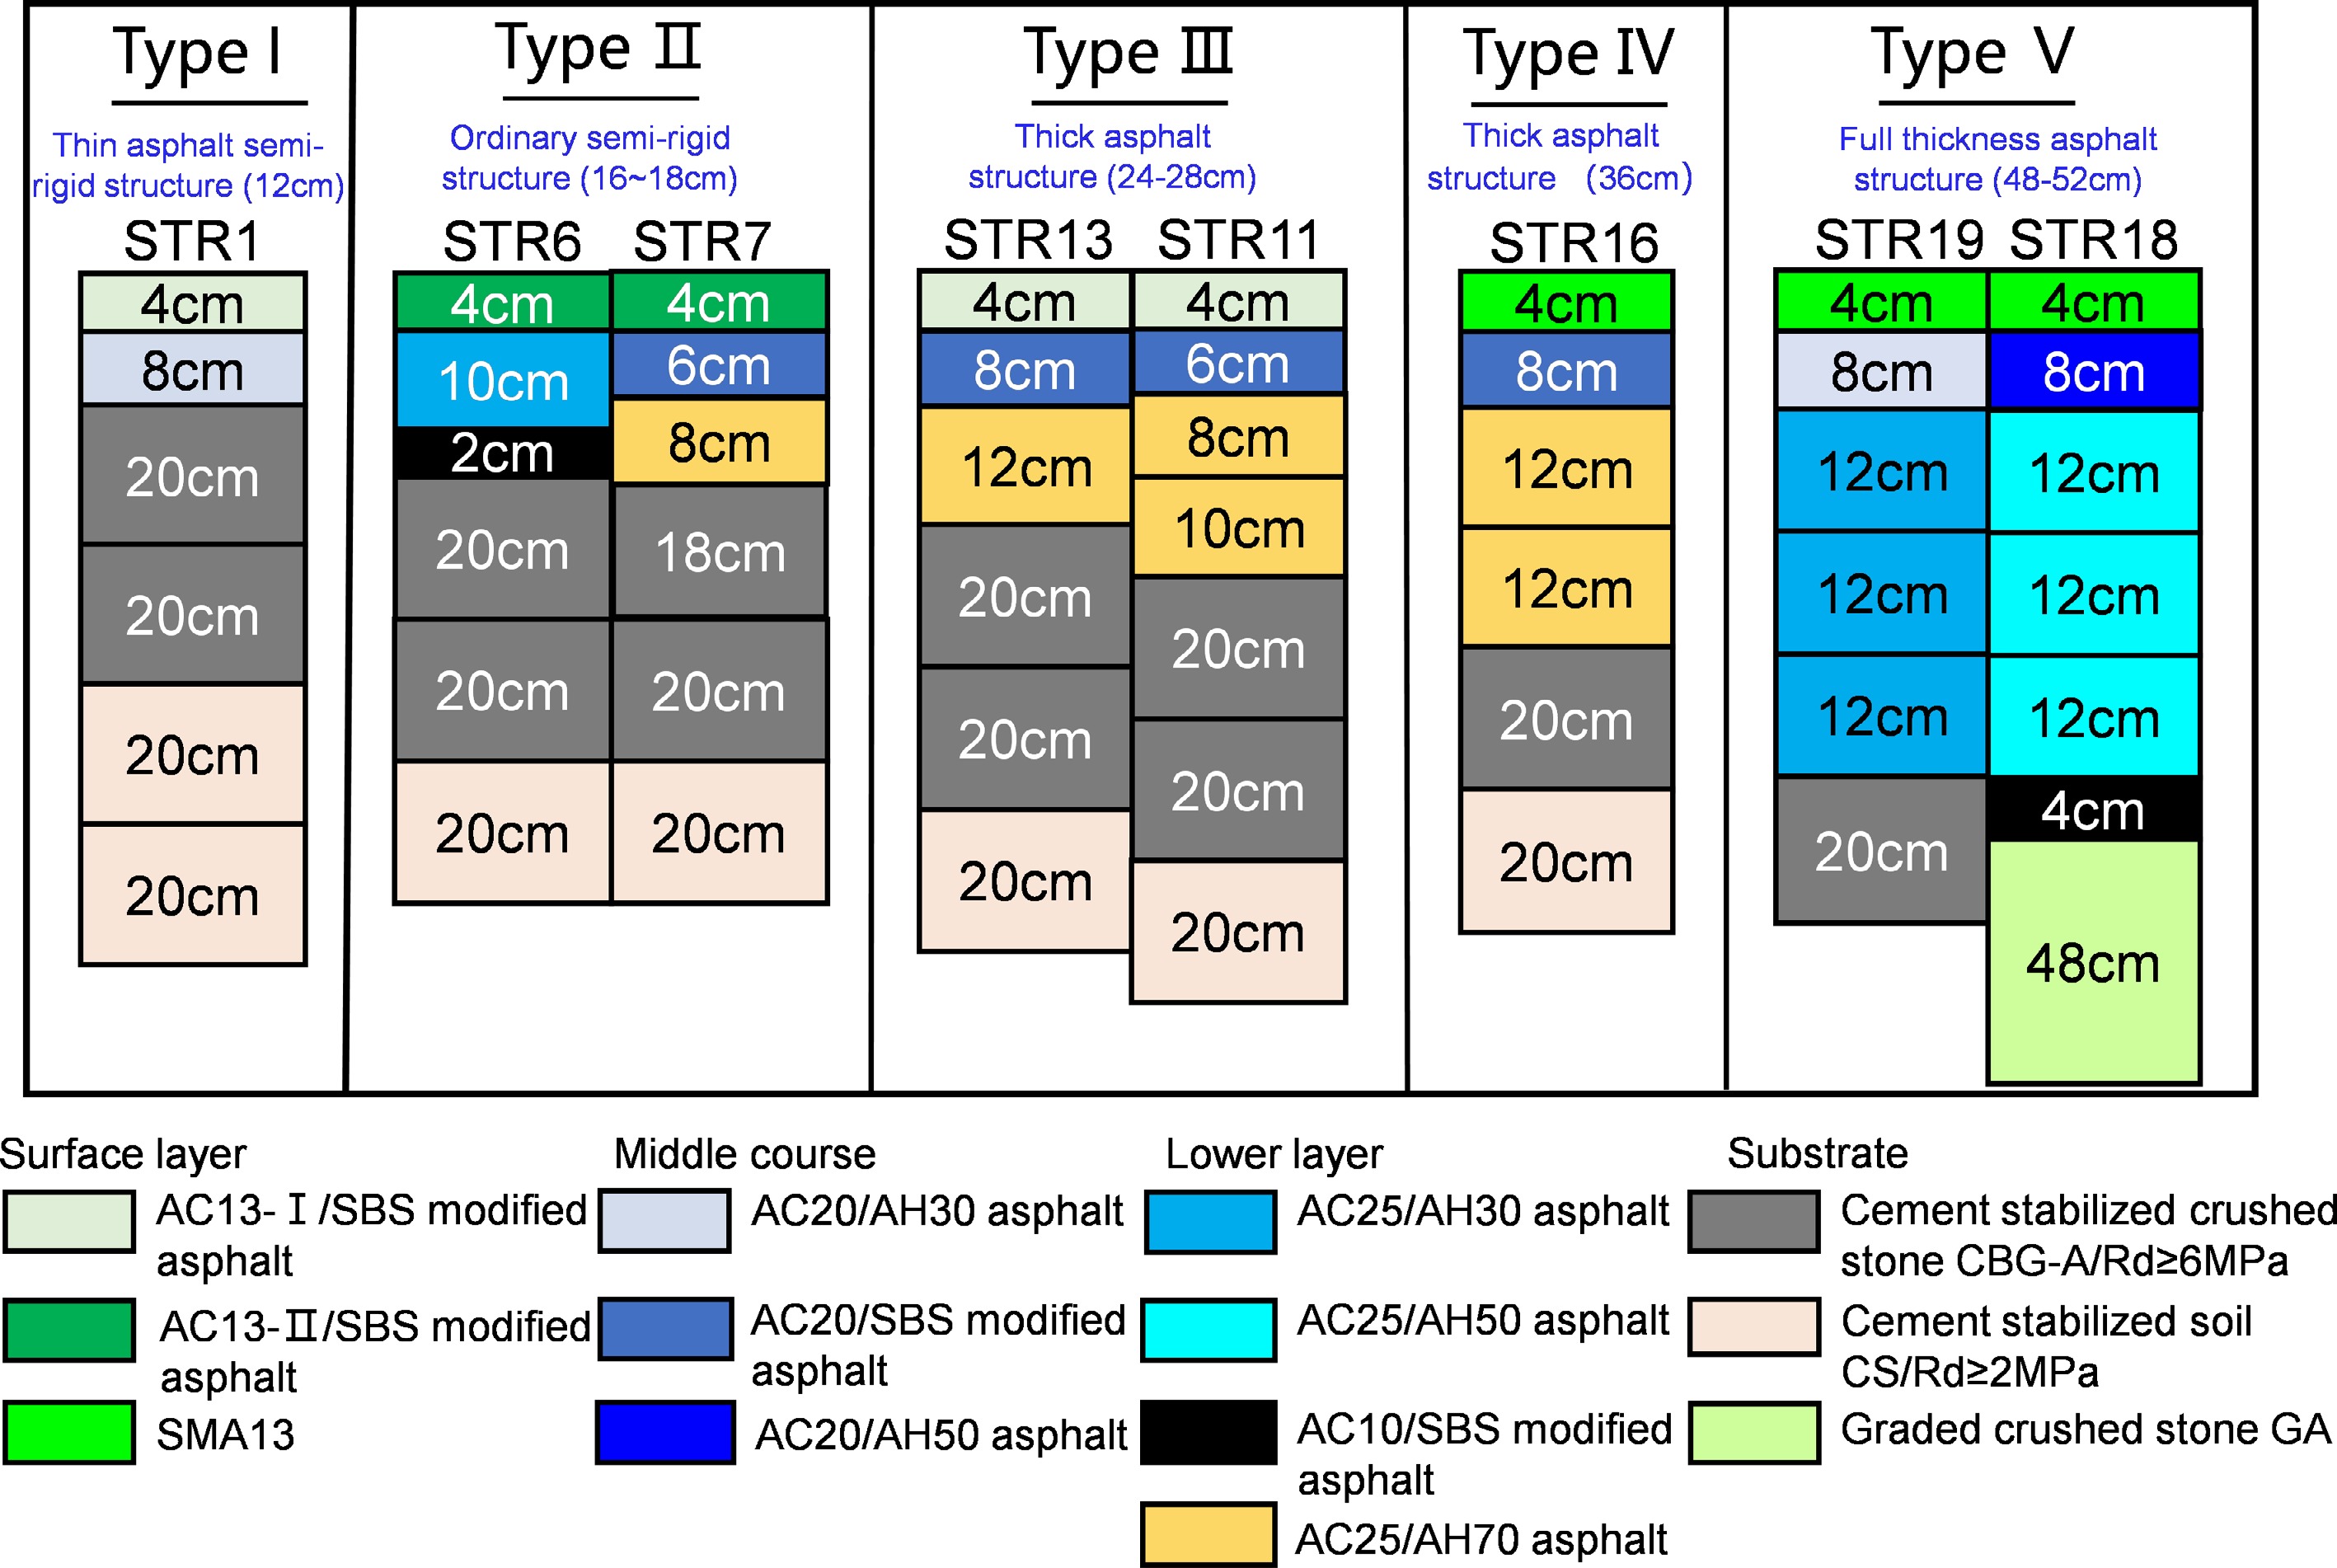
Figure 1.
Longitudinal section of typical structure.
-
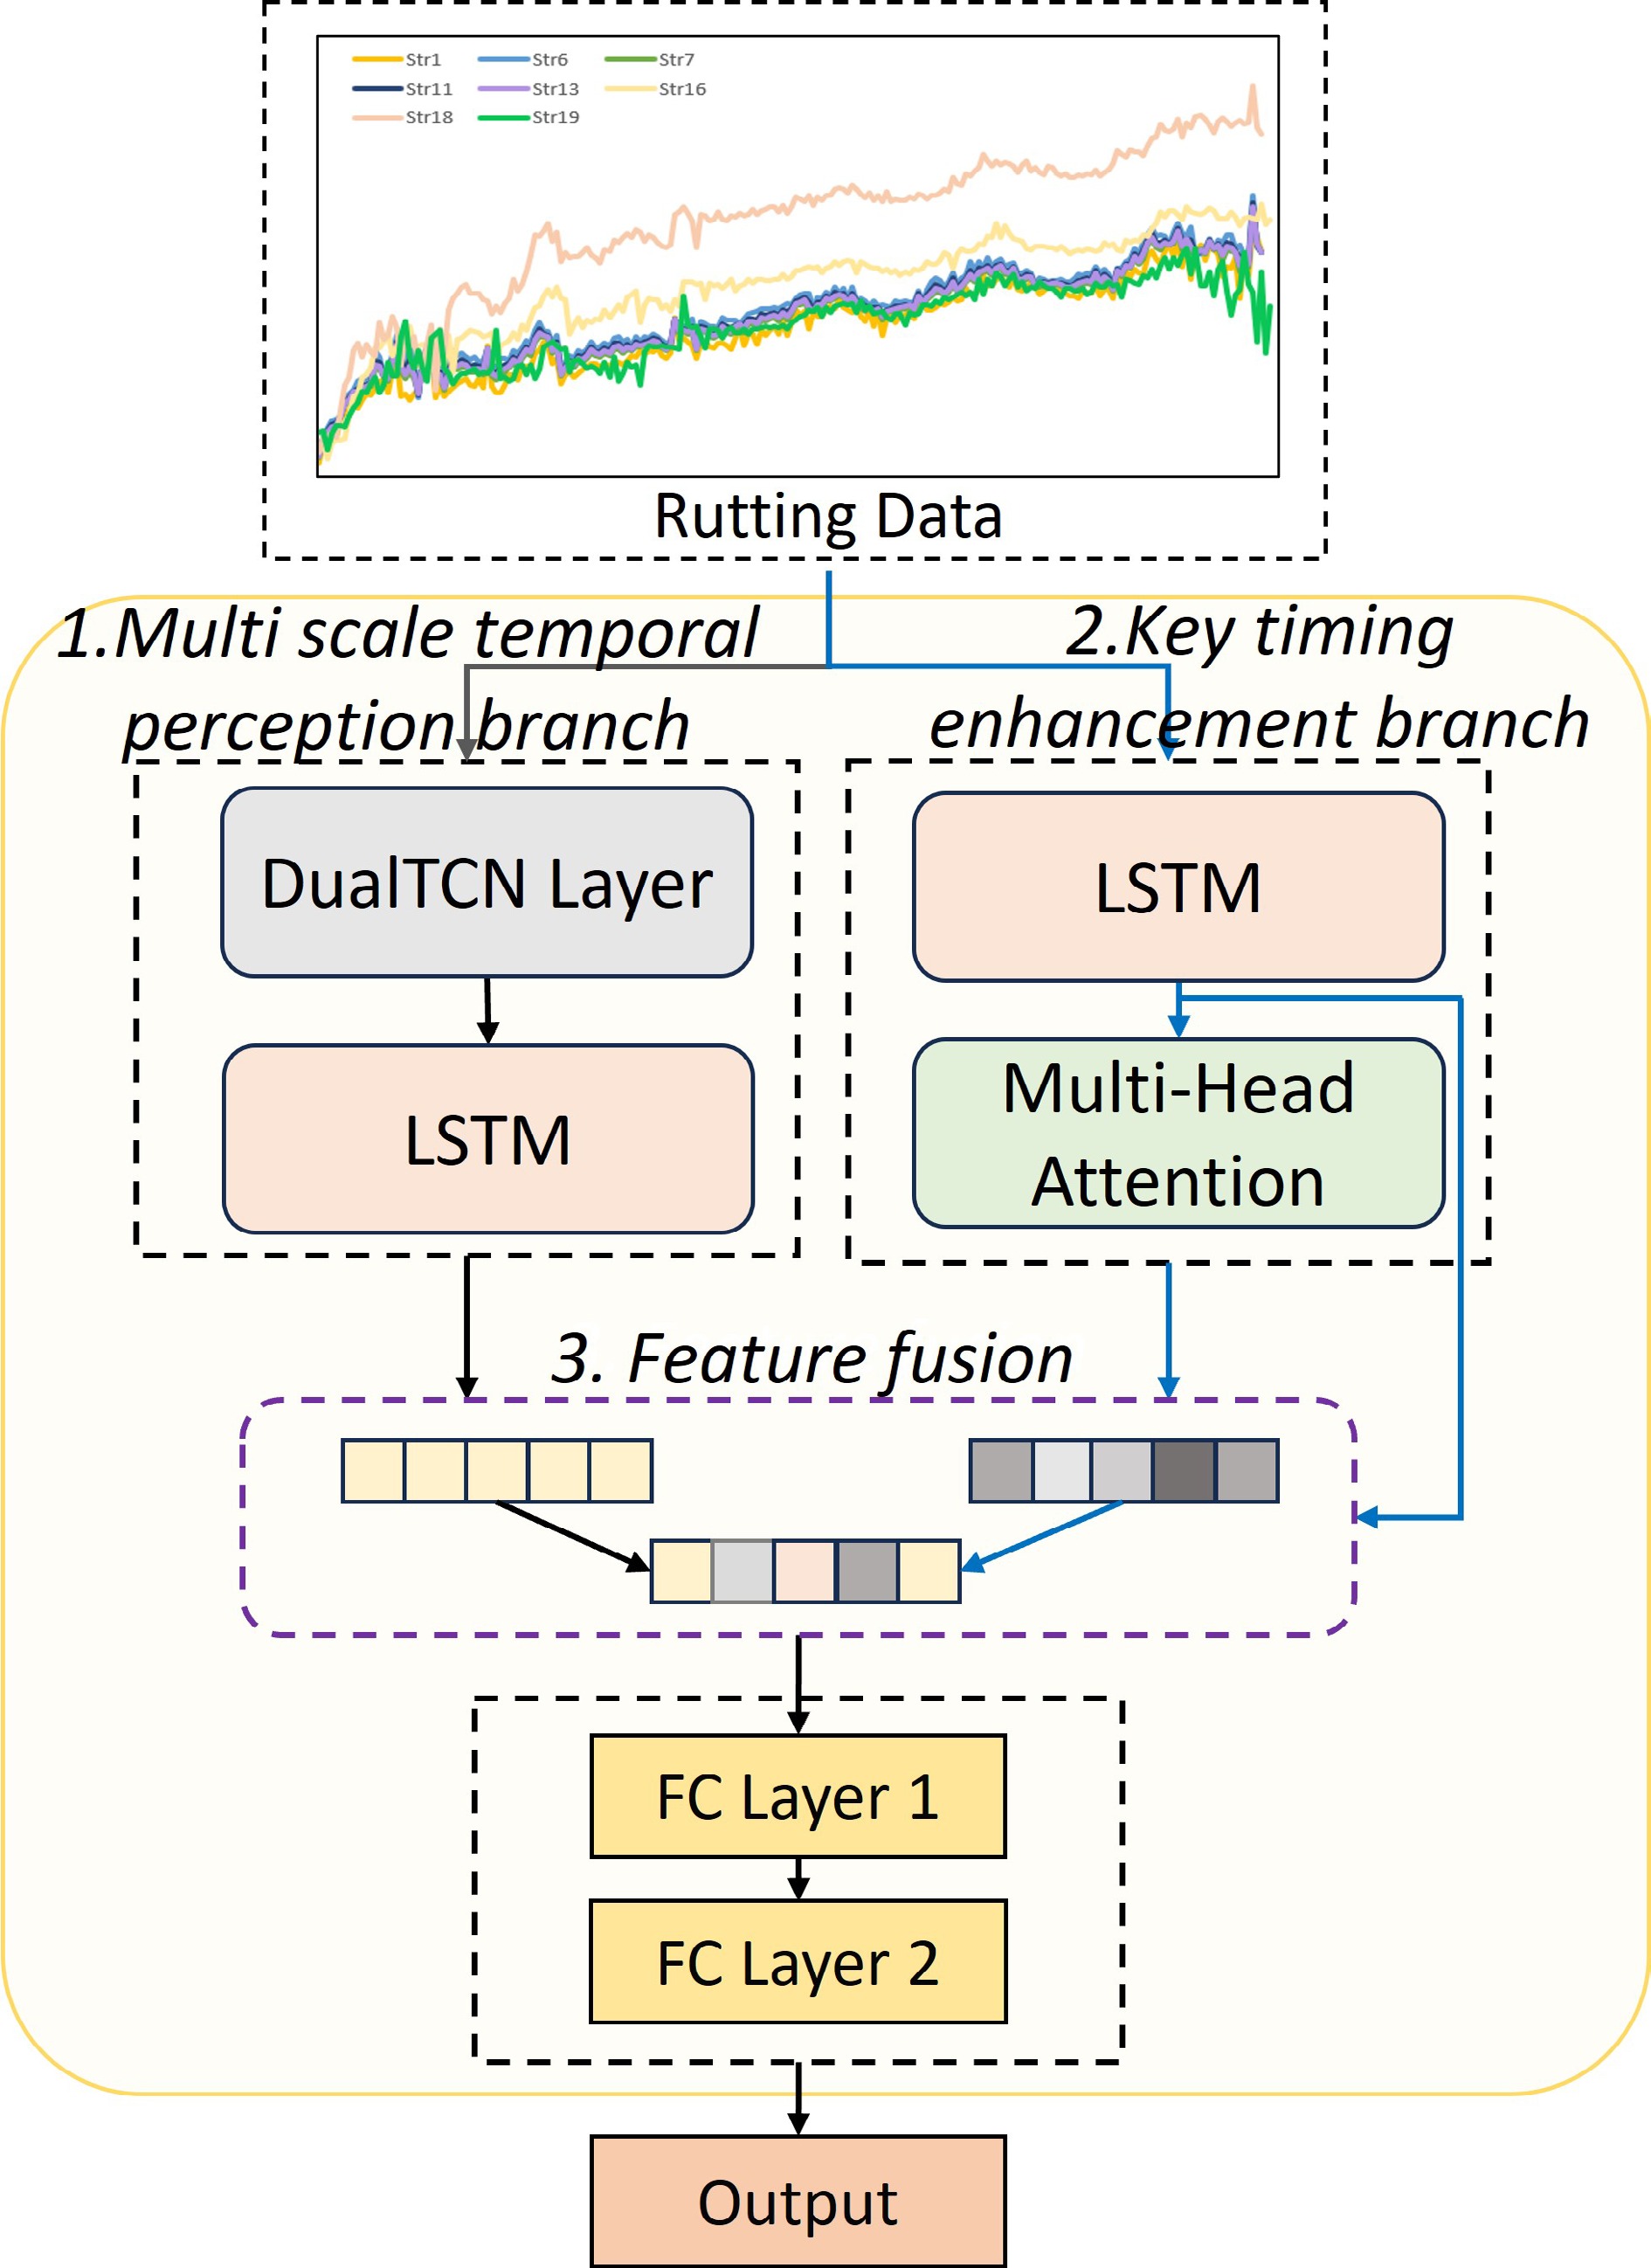
Figure 2.
DSAN model overall architecture diagram.
-
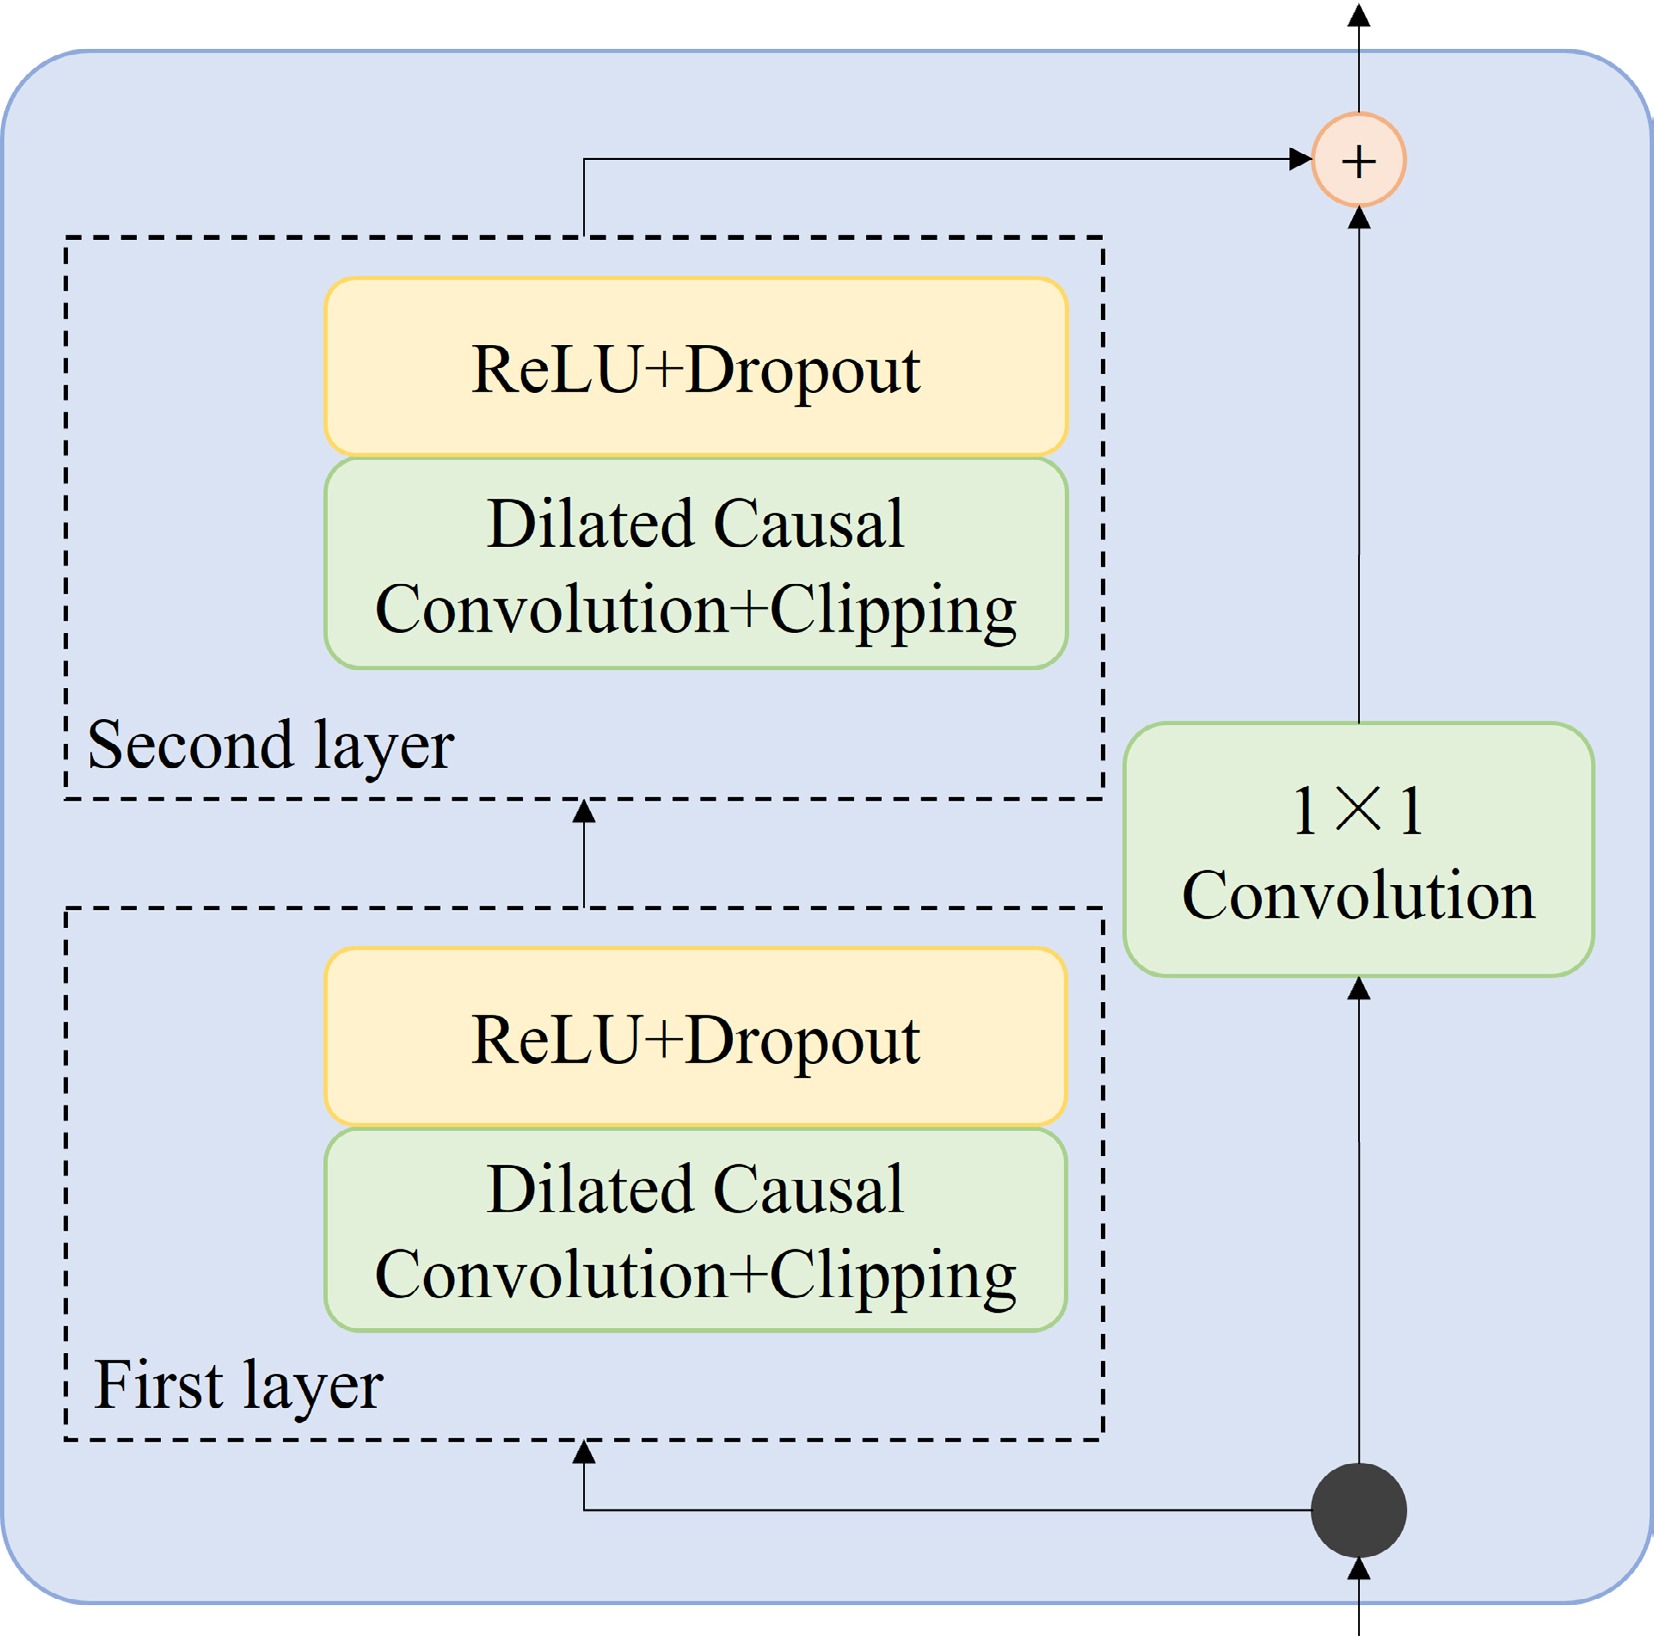
Figure 3.
DualTCN temporal block structure.
-
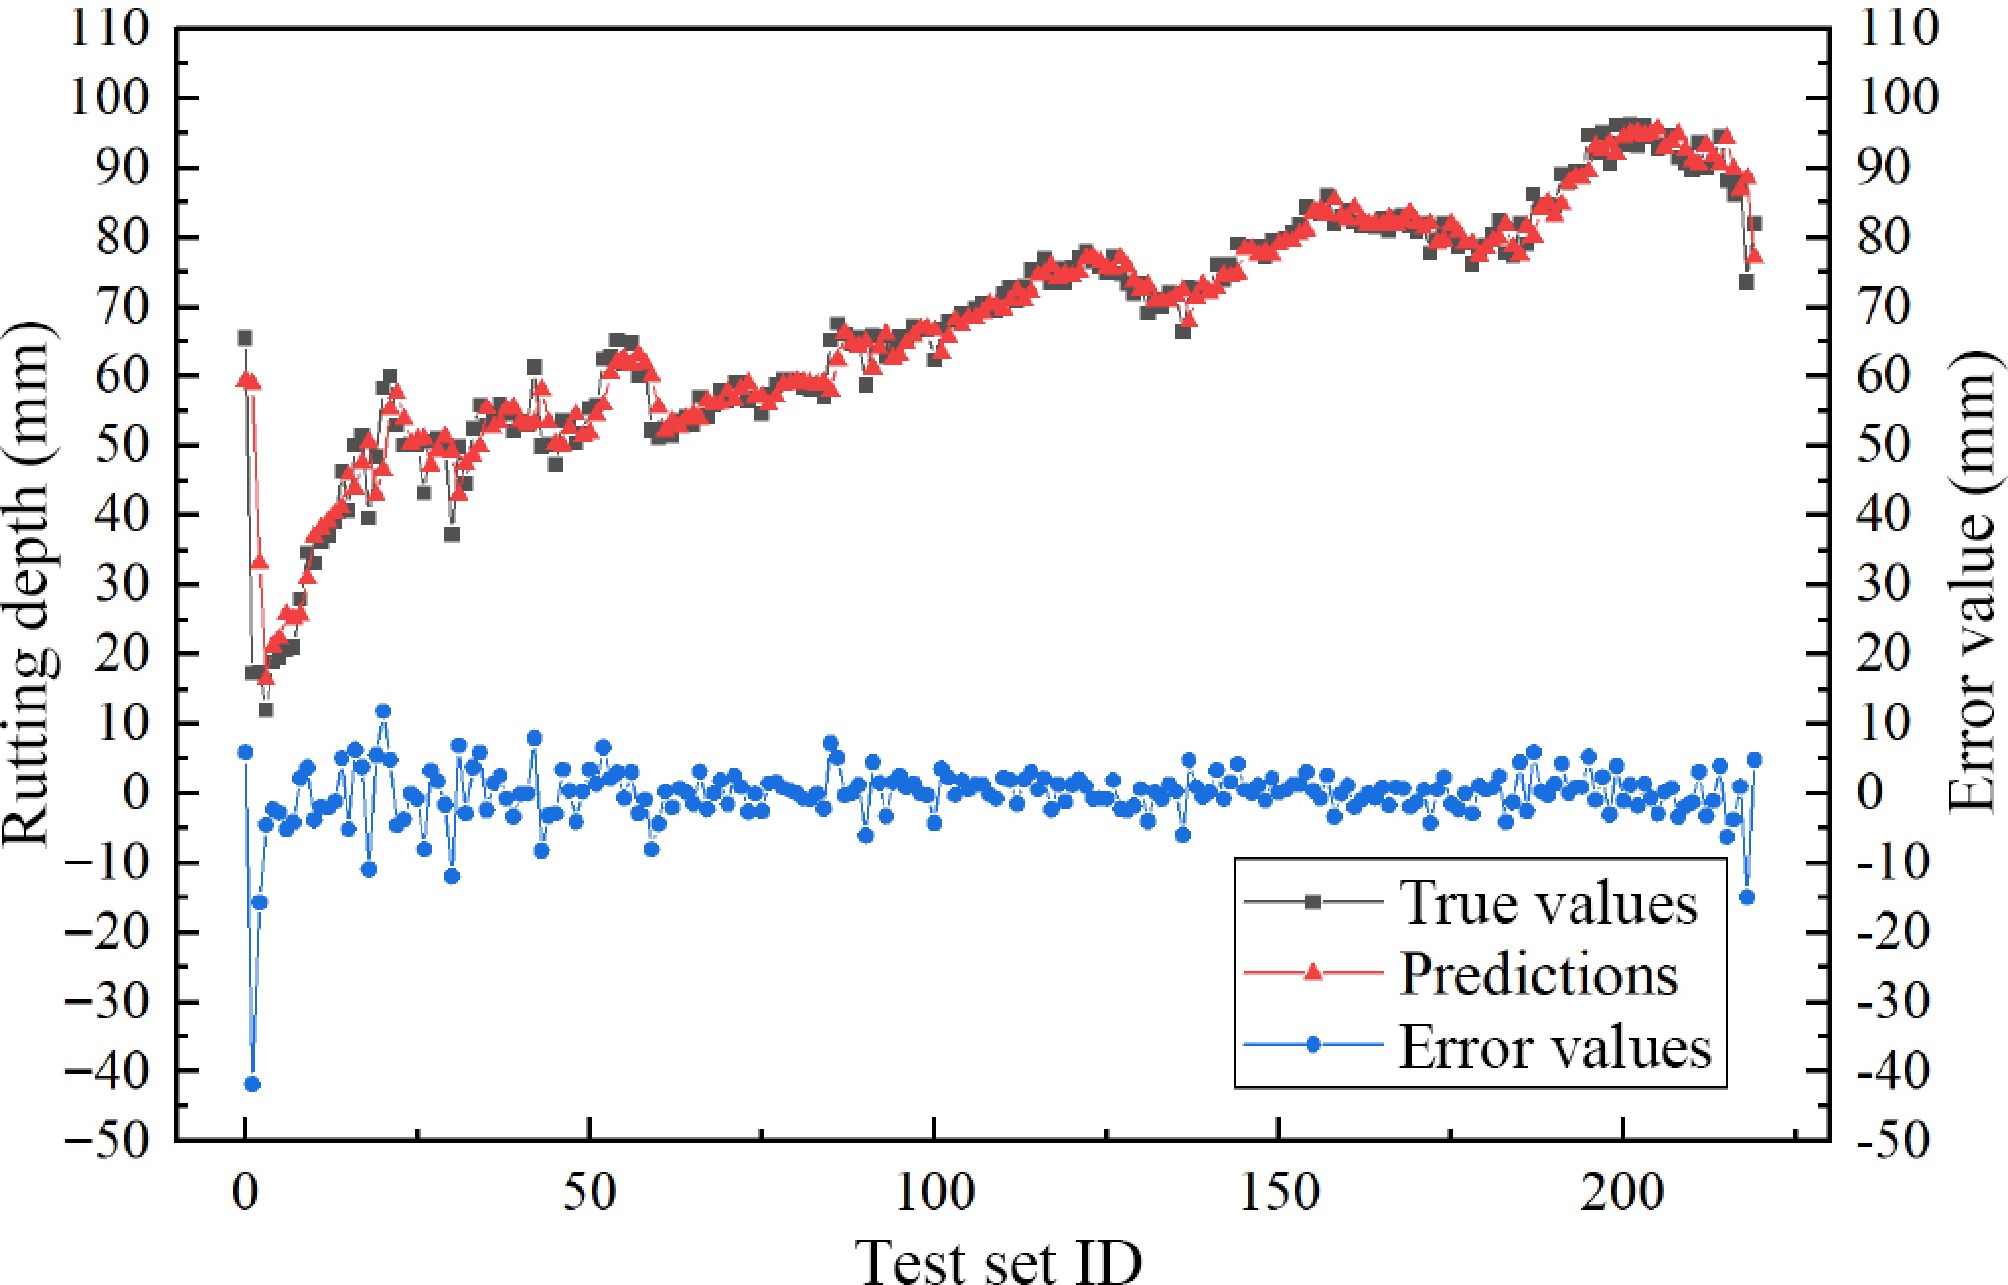
Figure 4.
Comparison of observed and predicted values.
-
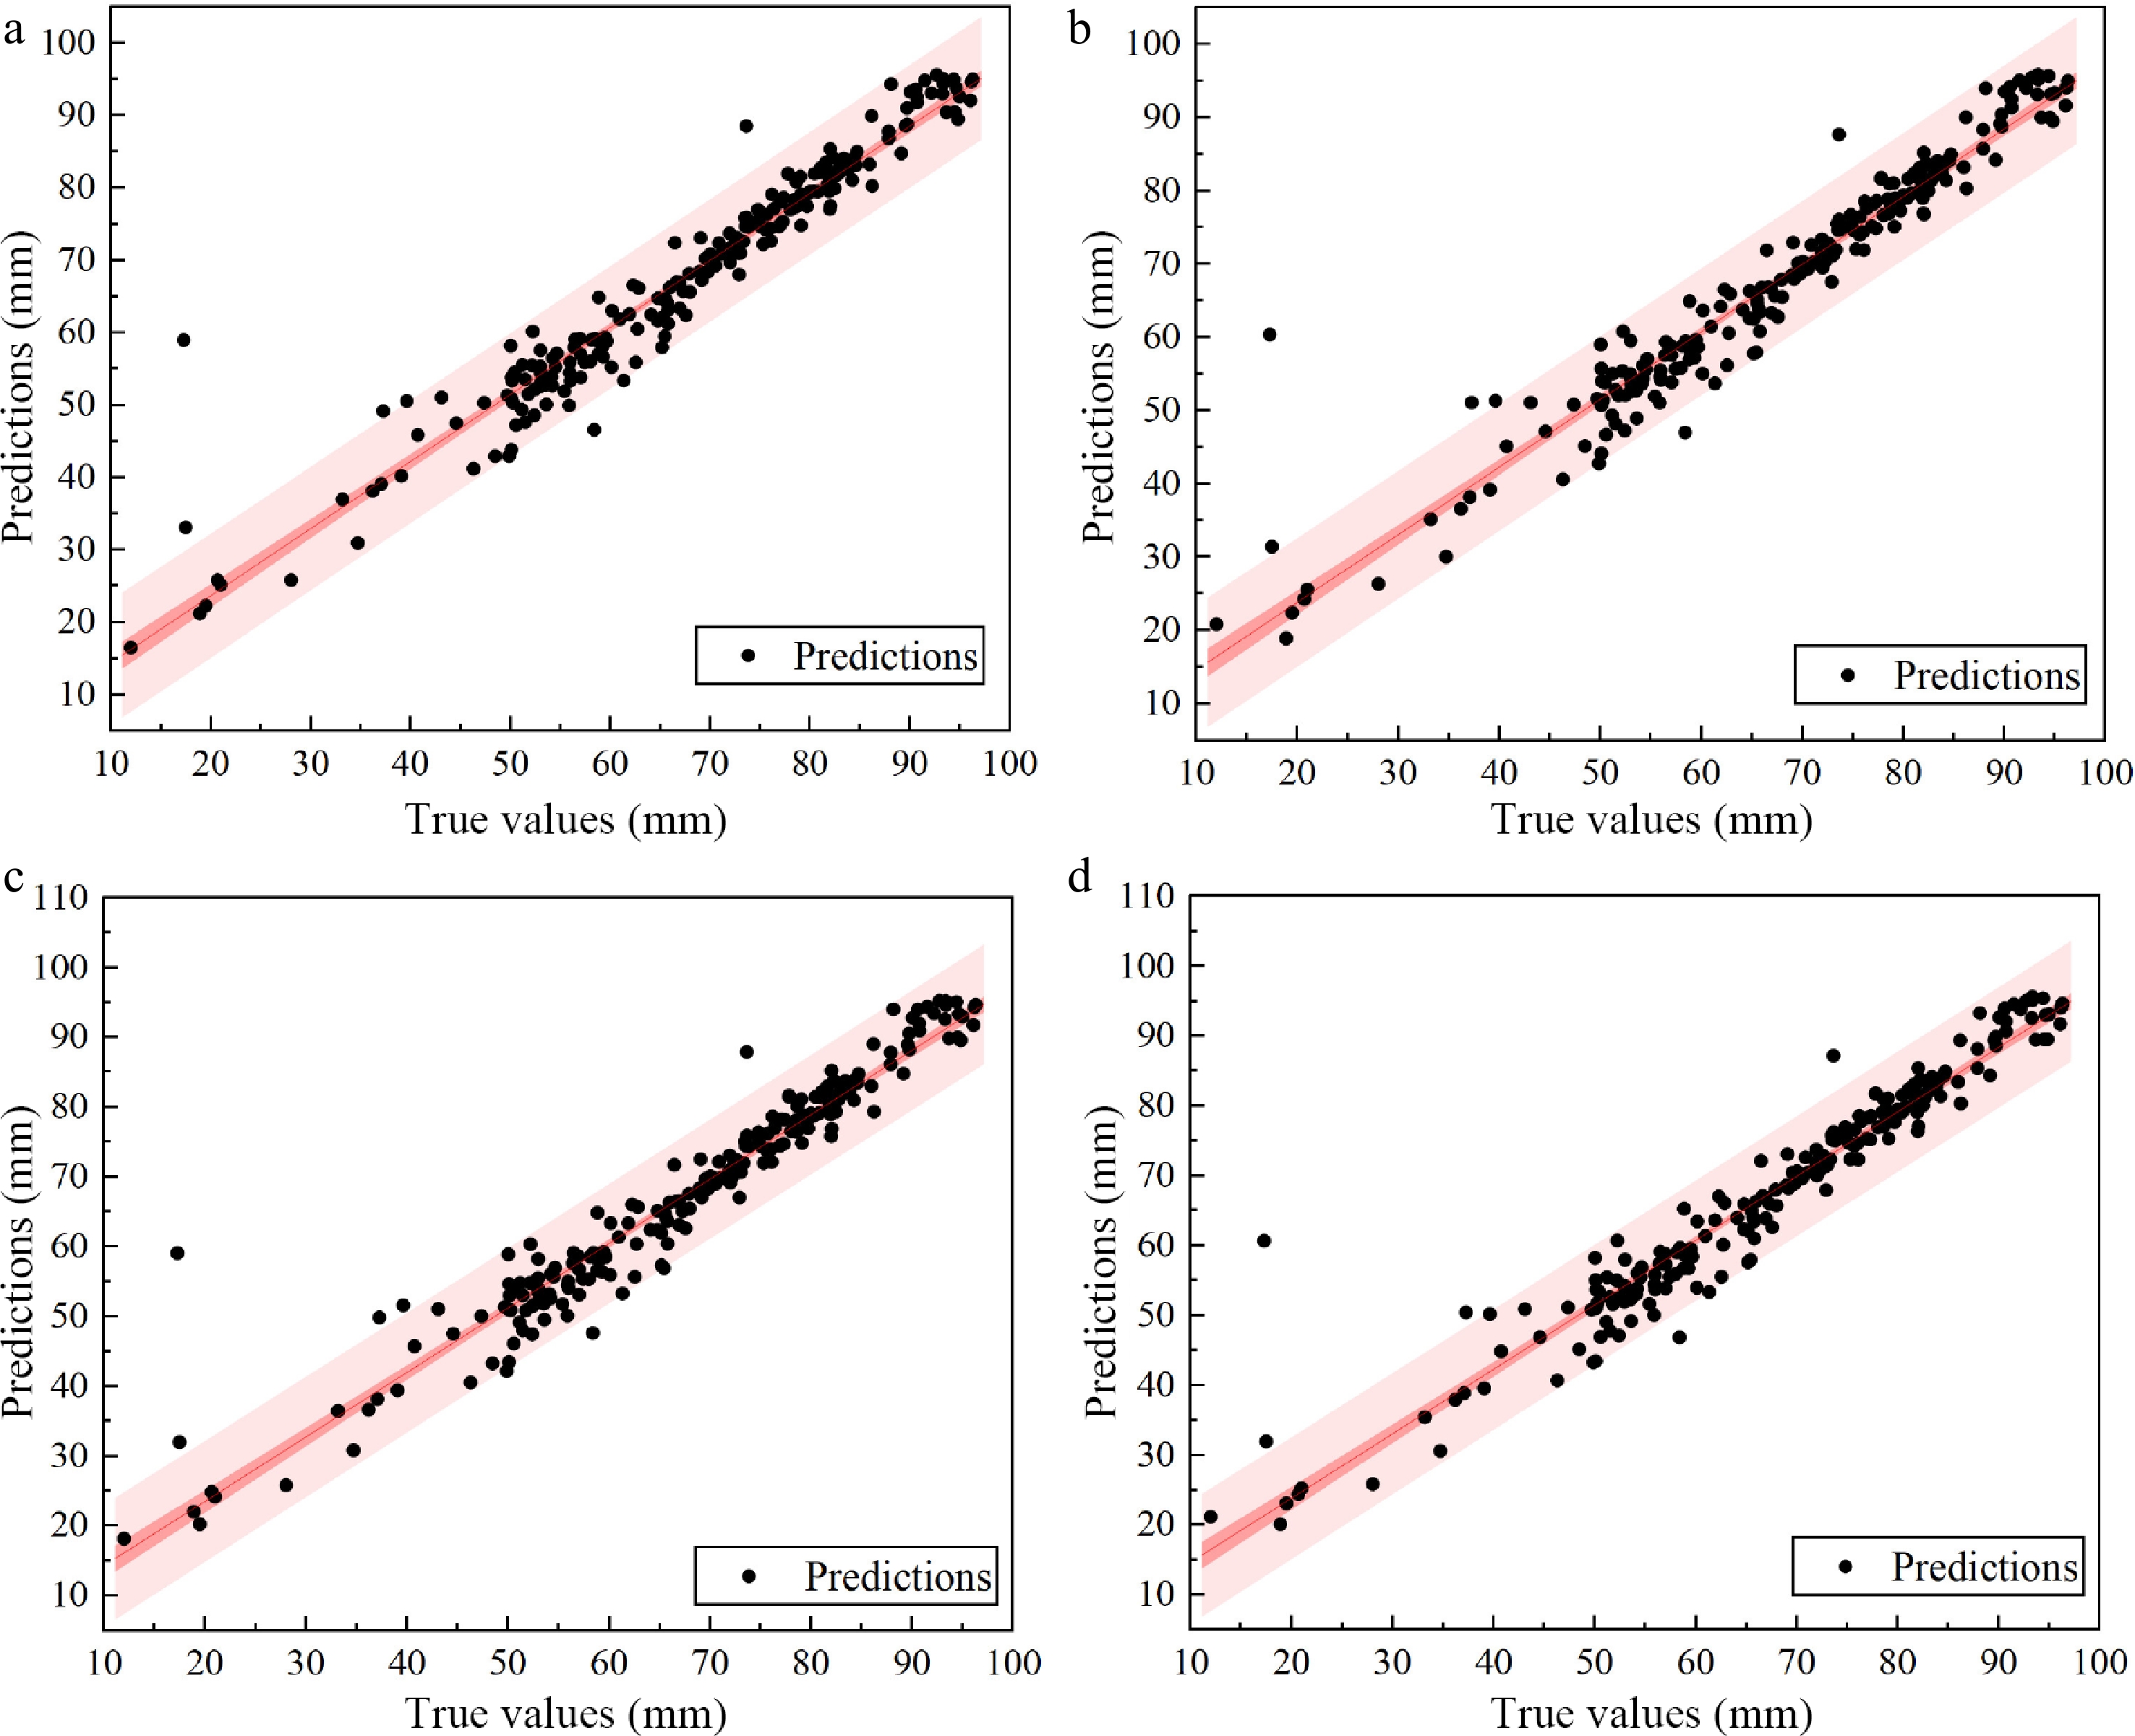
Figure 5.
Effect of scatter diagram of each model. (a) DSAN. (b) LSTM. (c) LSTM-Attn. (d) TCN_LSTM.
-
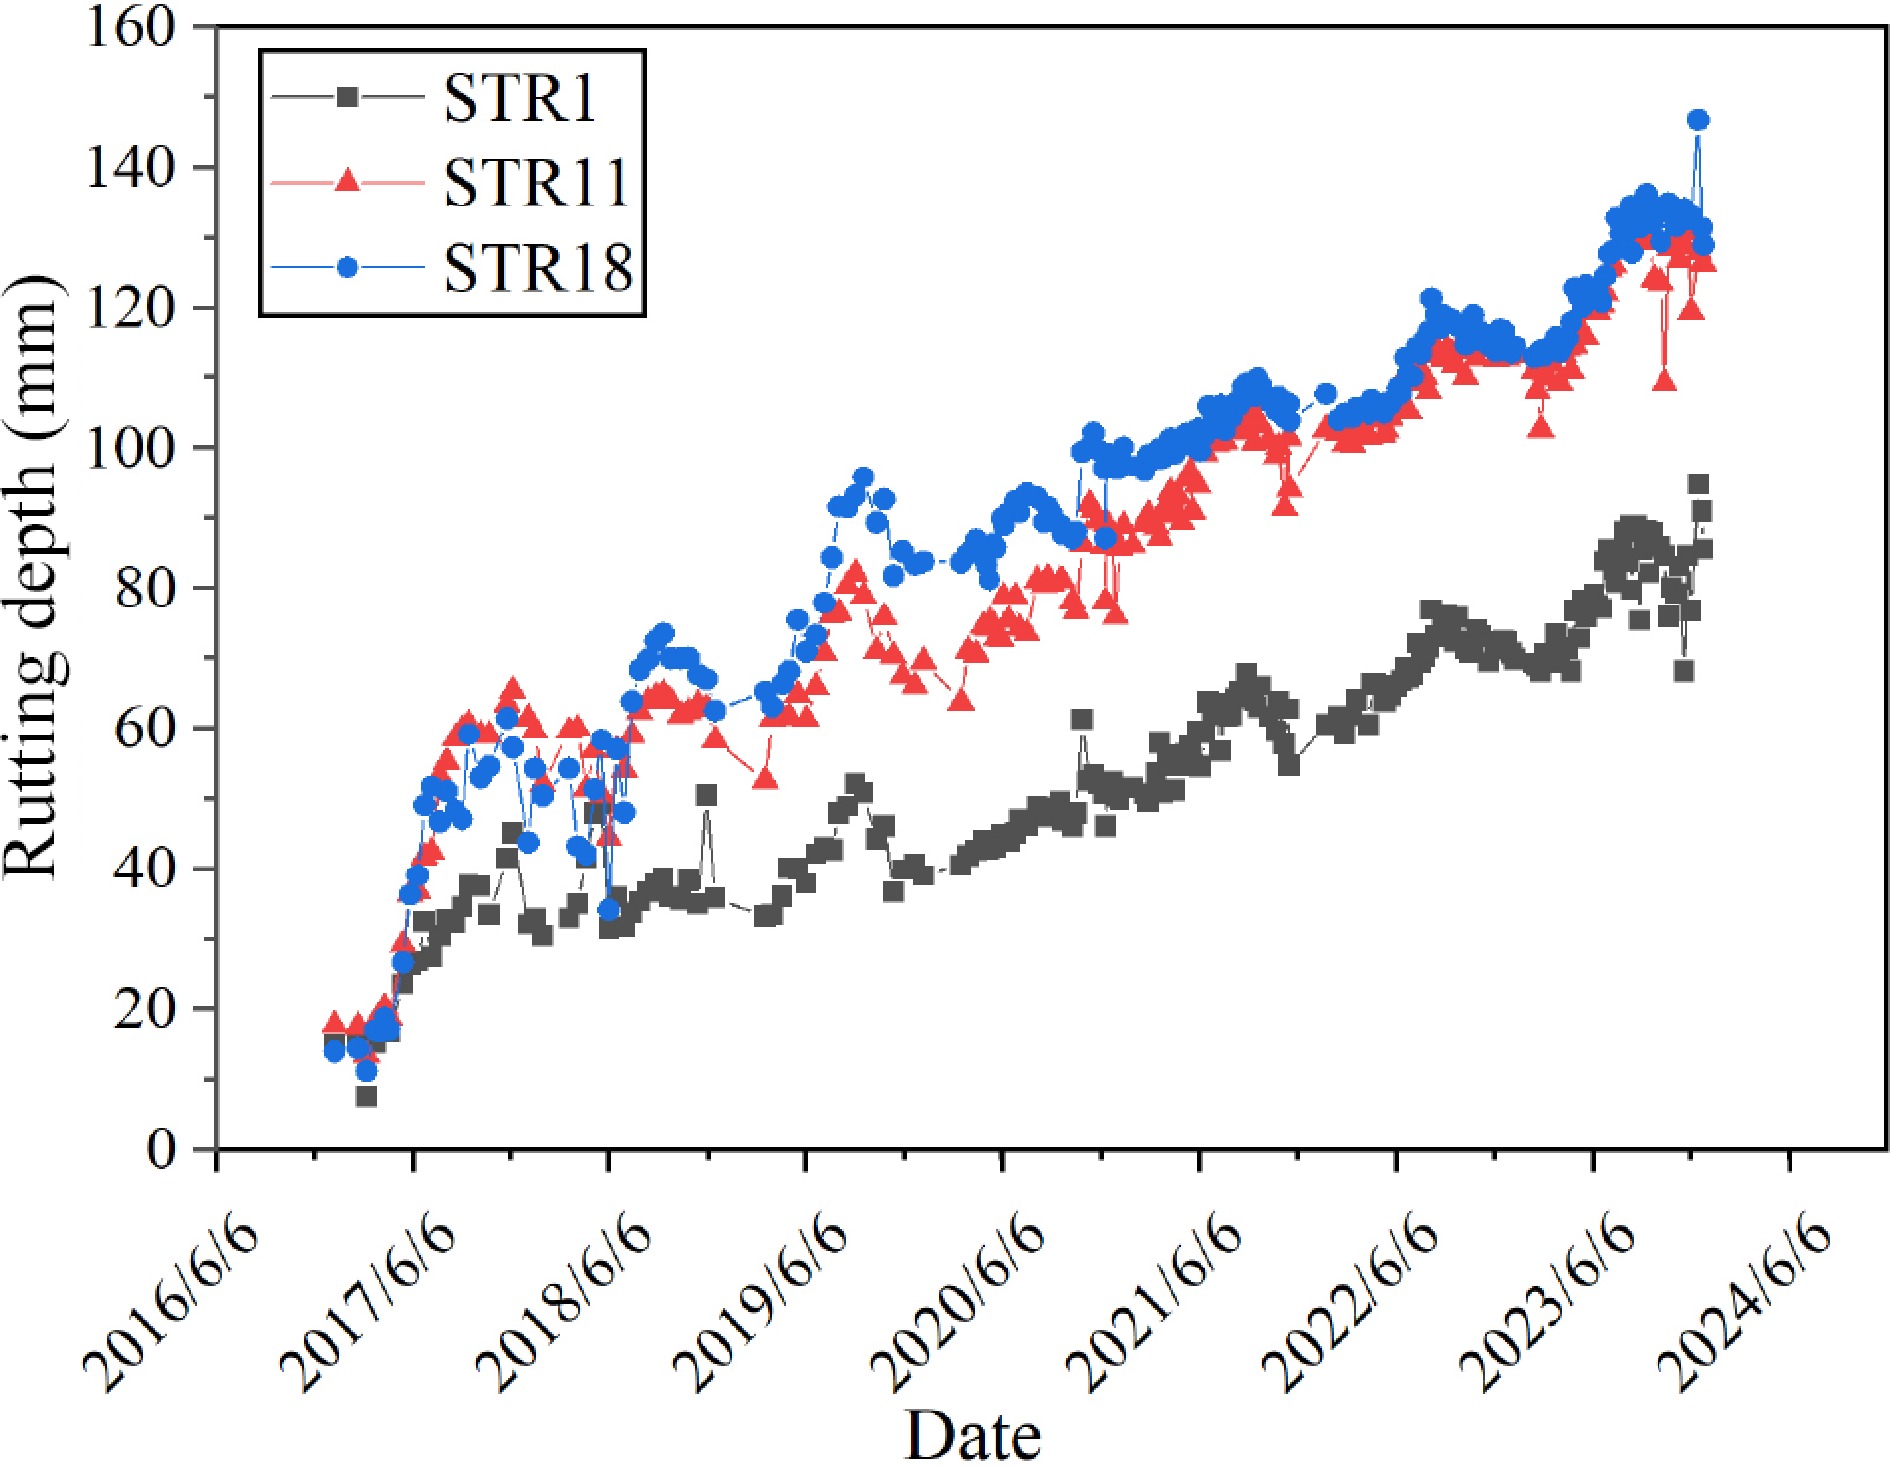
Figure 6.
Comparison of the rutting depth of asphalt structures with different thicknesses over time.
-
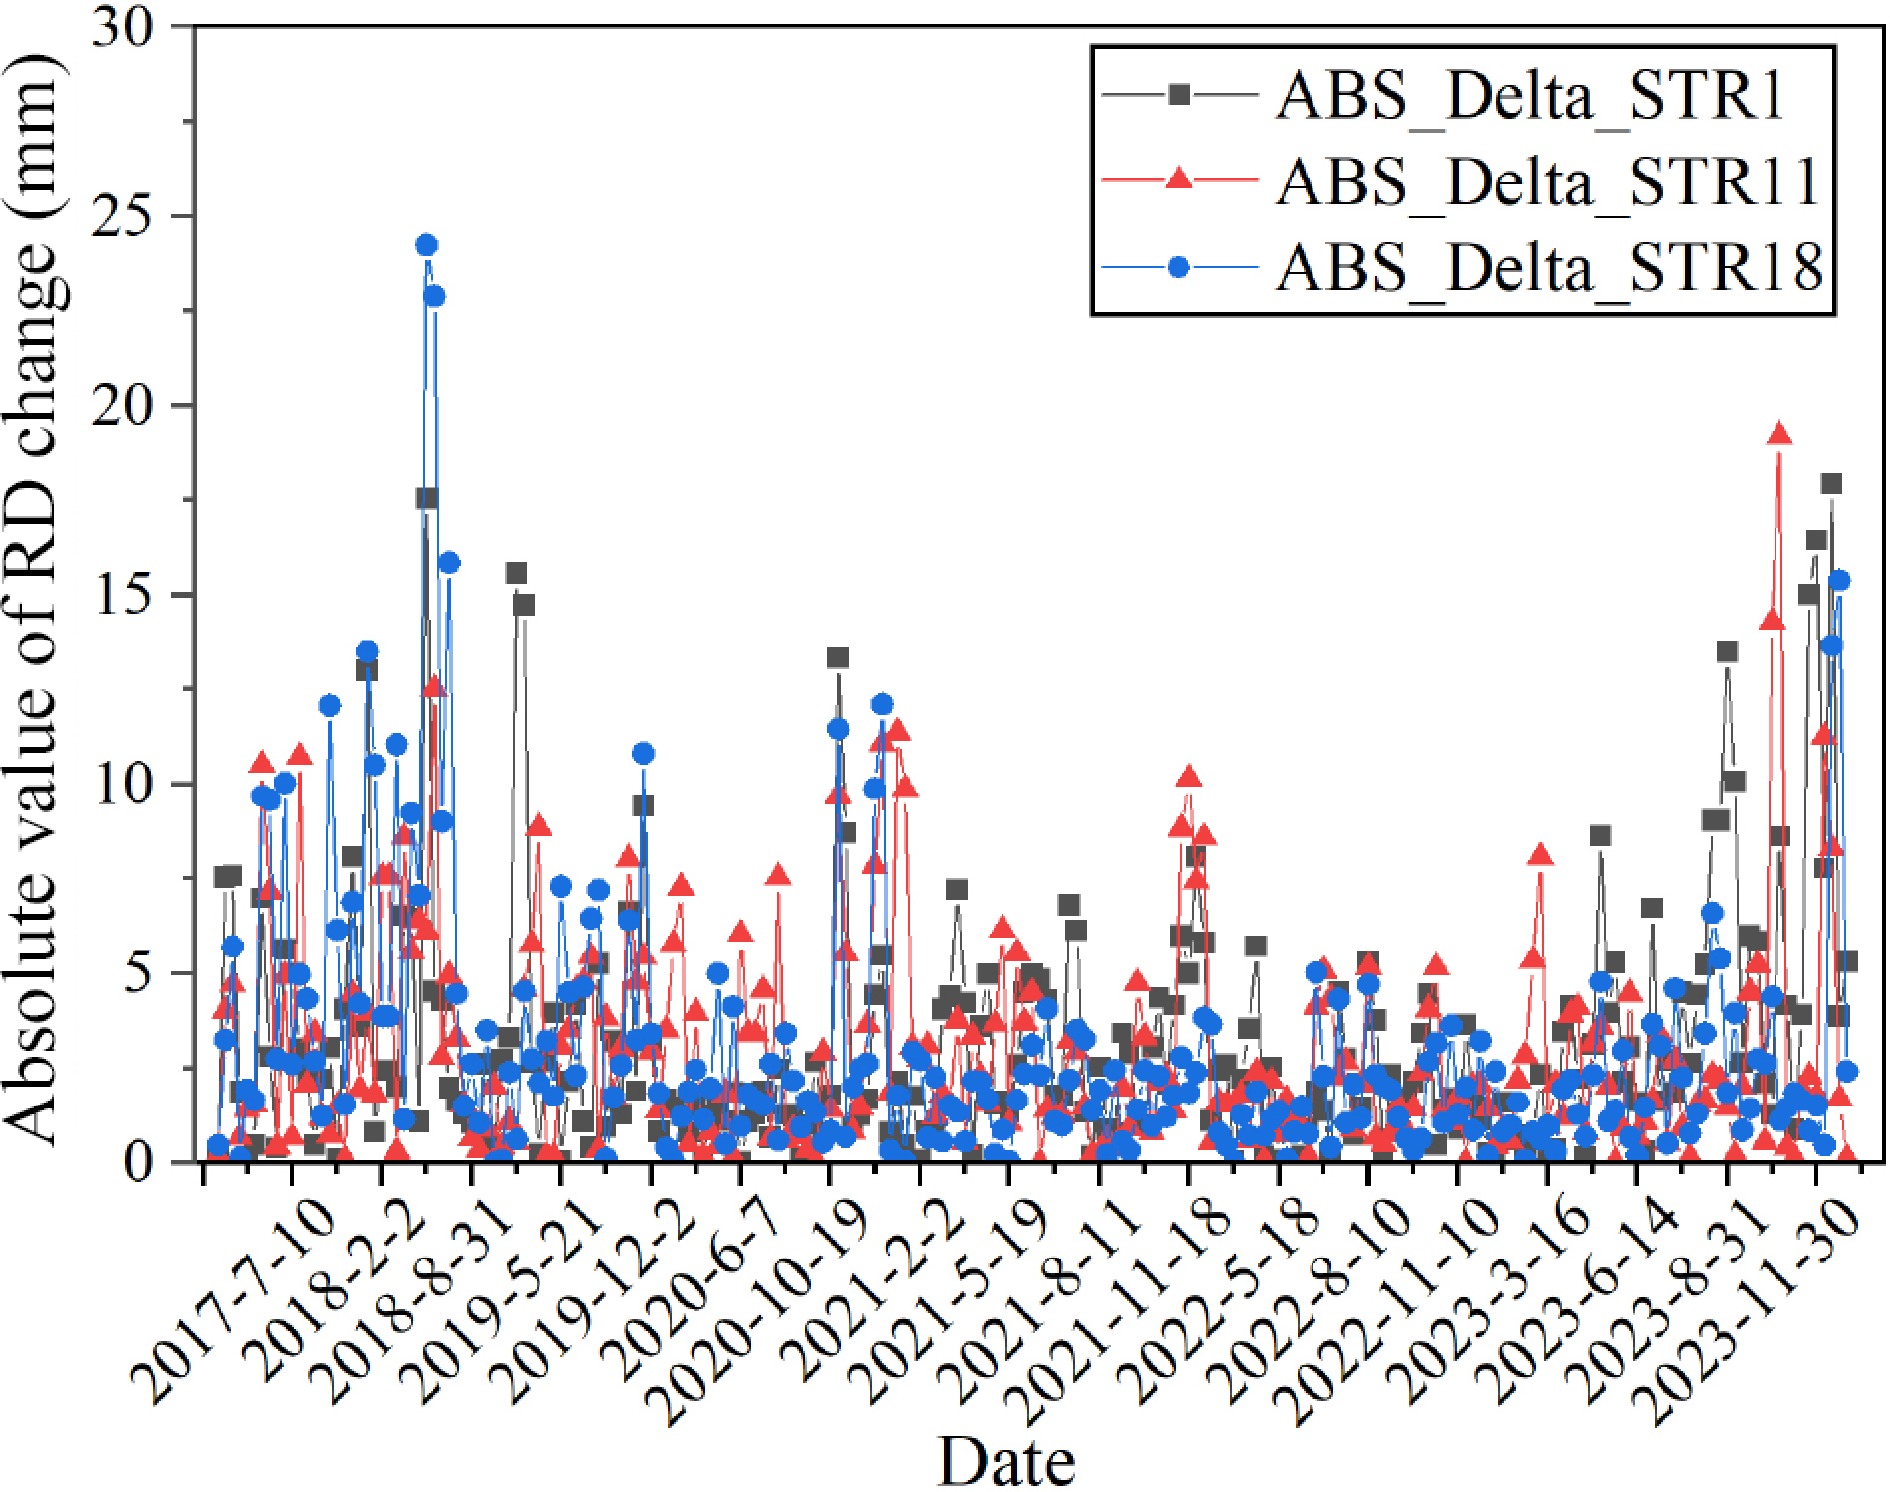
Figure 7.
Absolute value distribution of rutting depth variation of asphalt structures with different thicknesses.
-
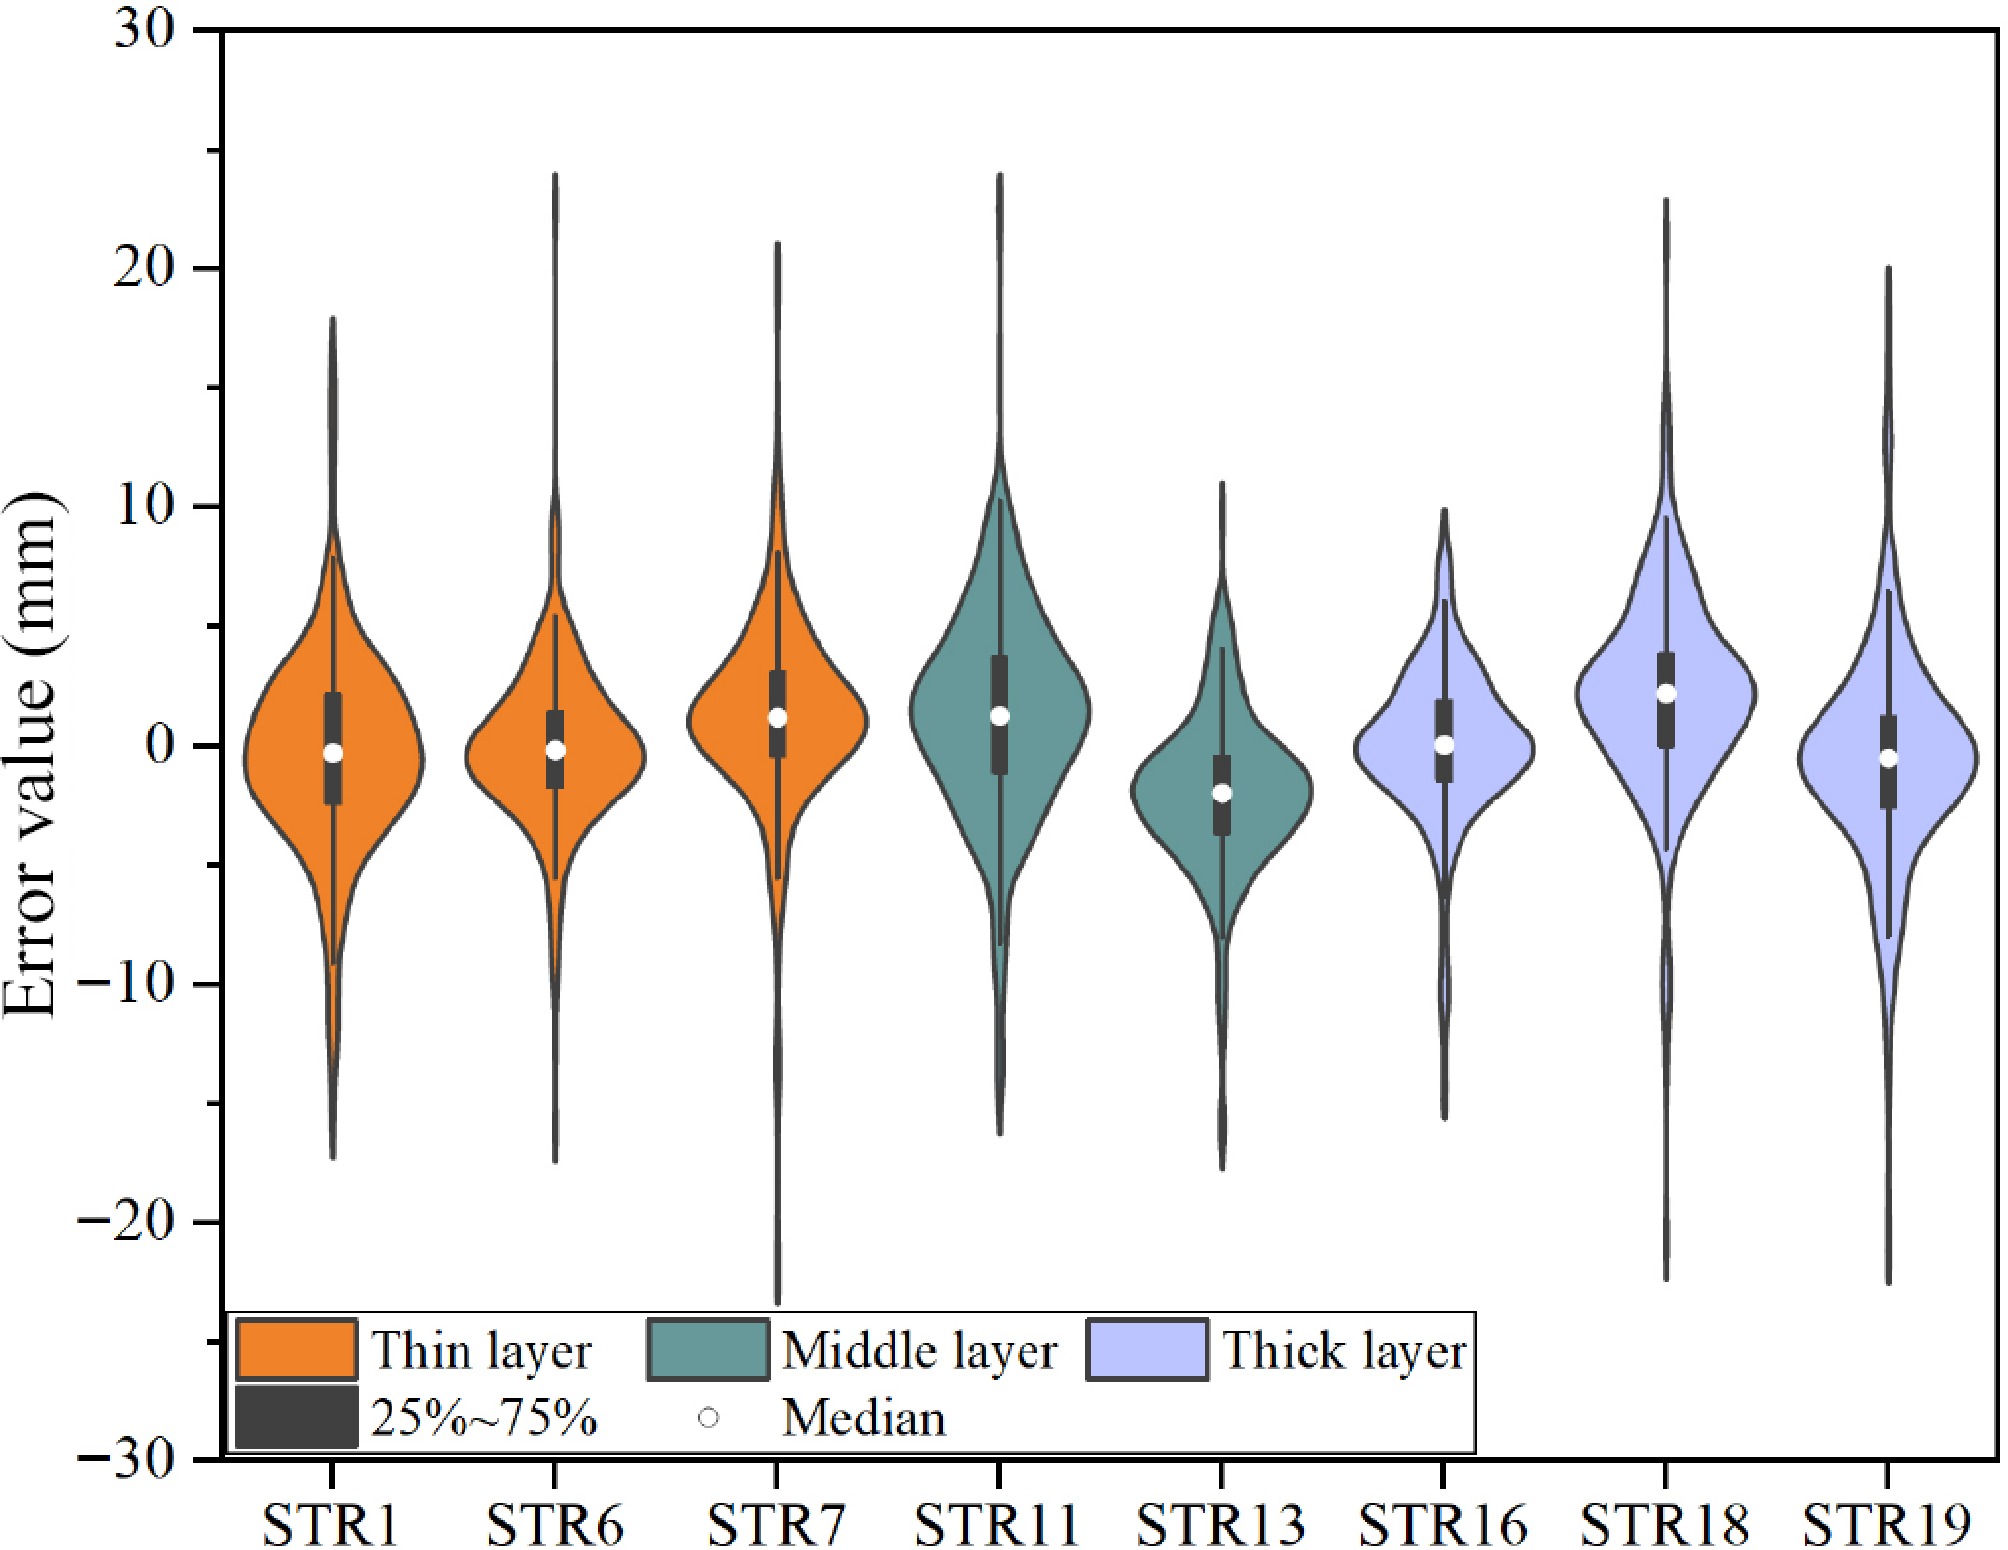
Figure 8.
Distribution characteristics of errors in microstructure and thickness.
-
Structure No. AC layer thickness (cm) Base course type STR1 12 Thin asphalt semi-rigid structure STR6 16 Ordinary semi-rigid structure STR7 18 Ordinary semi-rigid structure STR13 24 24~28 cm thick asphalt structure STR11 28 24~28 cm thick asphalt structure STR16 36 36 cm thick asphalt structure STR19 48 Full-depth asphalt structure STR18 52 Full-depth asphalt structure Table 1.
Table of typical structural parameters.
-
Parameter name Value Look_back 12 Hidden_dim 128 Layers of TCN 2 Layers of LSTM 1 Heads of MSA 8 Learning_rate 0.001 Table 2.
Hyperparameters for model training.
-
Model RMSE MAE R2 LSTM 4.581 2.696 0.93 TCN_LSTM 4.527 2.728 0.932 LSTM_Attn 4.562 2.665 0.931 DSAN 4.272 2.452 0.943 Table 3.
Comparison of the prediction performance of various models.
-
Thickness grouping Model Evaluation metric RMSE MAE R2 Thin layer structure group DSAN 5.3 3.32 0.913 TCN-only 5.721 3.632 0.898 LSTM-only 5.573 3.541 0.903 LSTM + MHA-only 5.424 3.44 0.908 DualTCN-only 5.514 3.53 0.904 DSAN (without TCN) 5.628 3.579 0.902 DSAN (without MSA) 5.649 3.588 0.9 Middle structure group DSAN 5.514 3.706 0.959 TCN-only 6.626 4.612 0.942 LSTM-only 5.991 4.17 0.951 LSTM + MHA-only 5.629 3.917 0.956 DualTCN-only 6.165 4.29 0.947 DSAN (without TCN) 5.728 3.986 0.955 DSAN (without MSA) 5.93 4.126 0.952 Thick layer structure group DSAN 5.808 3.819 0.958 TCN-only 6.482 4.131 0.947 LSTM-only 6.29 4.01 0.951 LSTM + MHA-only 5.905 3.763 0.956 DualTCN-only 6.391 4.073 0.95 DSAN (without TCN) 5.905 3.763 0.955 DSAN (without MSA) 6.288 4.013 0.951 Table 4.
Ablation study of proposed models.
-
Thickness grouping Model Evaluation metric Relative improvement (%) RMSE MAE R2 RMSE MAE R2 Thin layer structure group DSAN 5.3 3.32 0.913 4.9% 6.2% 1% LSTM 5.573 3.541 0.903 Middle structure group DSAN 5.514 3.706 0.959 8.0% 11.1% 0.8% LSTM 5.991 4.17 0.951 Thick layer structure group DSAN 5.808 3.819 0.958 7.7% 4.8% 0.7% LSTM 6.29 4.01 0.951 Table 5.
Comparison of model performance under different thickness groups.
-
Structure number Evaluation metric RMSE MAE R2 STR1 5.3 3.32 0.913 STR6 4.599 2.657 0.933 STR7 5.118 3.127 0.966 STR13 4.993 3.239 0.917 STR11 5.514 3.706 0.959 STR16 4.549 2.527 0.949 STR19 4.976 3.299 0.9 STR18 5.808 3.819 0.958 Table 6.
Leave-one-structure-out (LOSO) tests of proposed models.
Figures
(8)
Tables
(6)