-
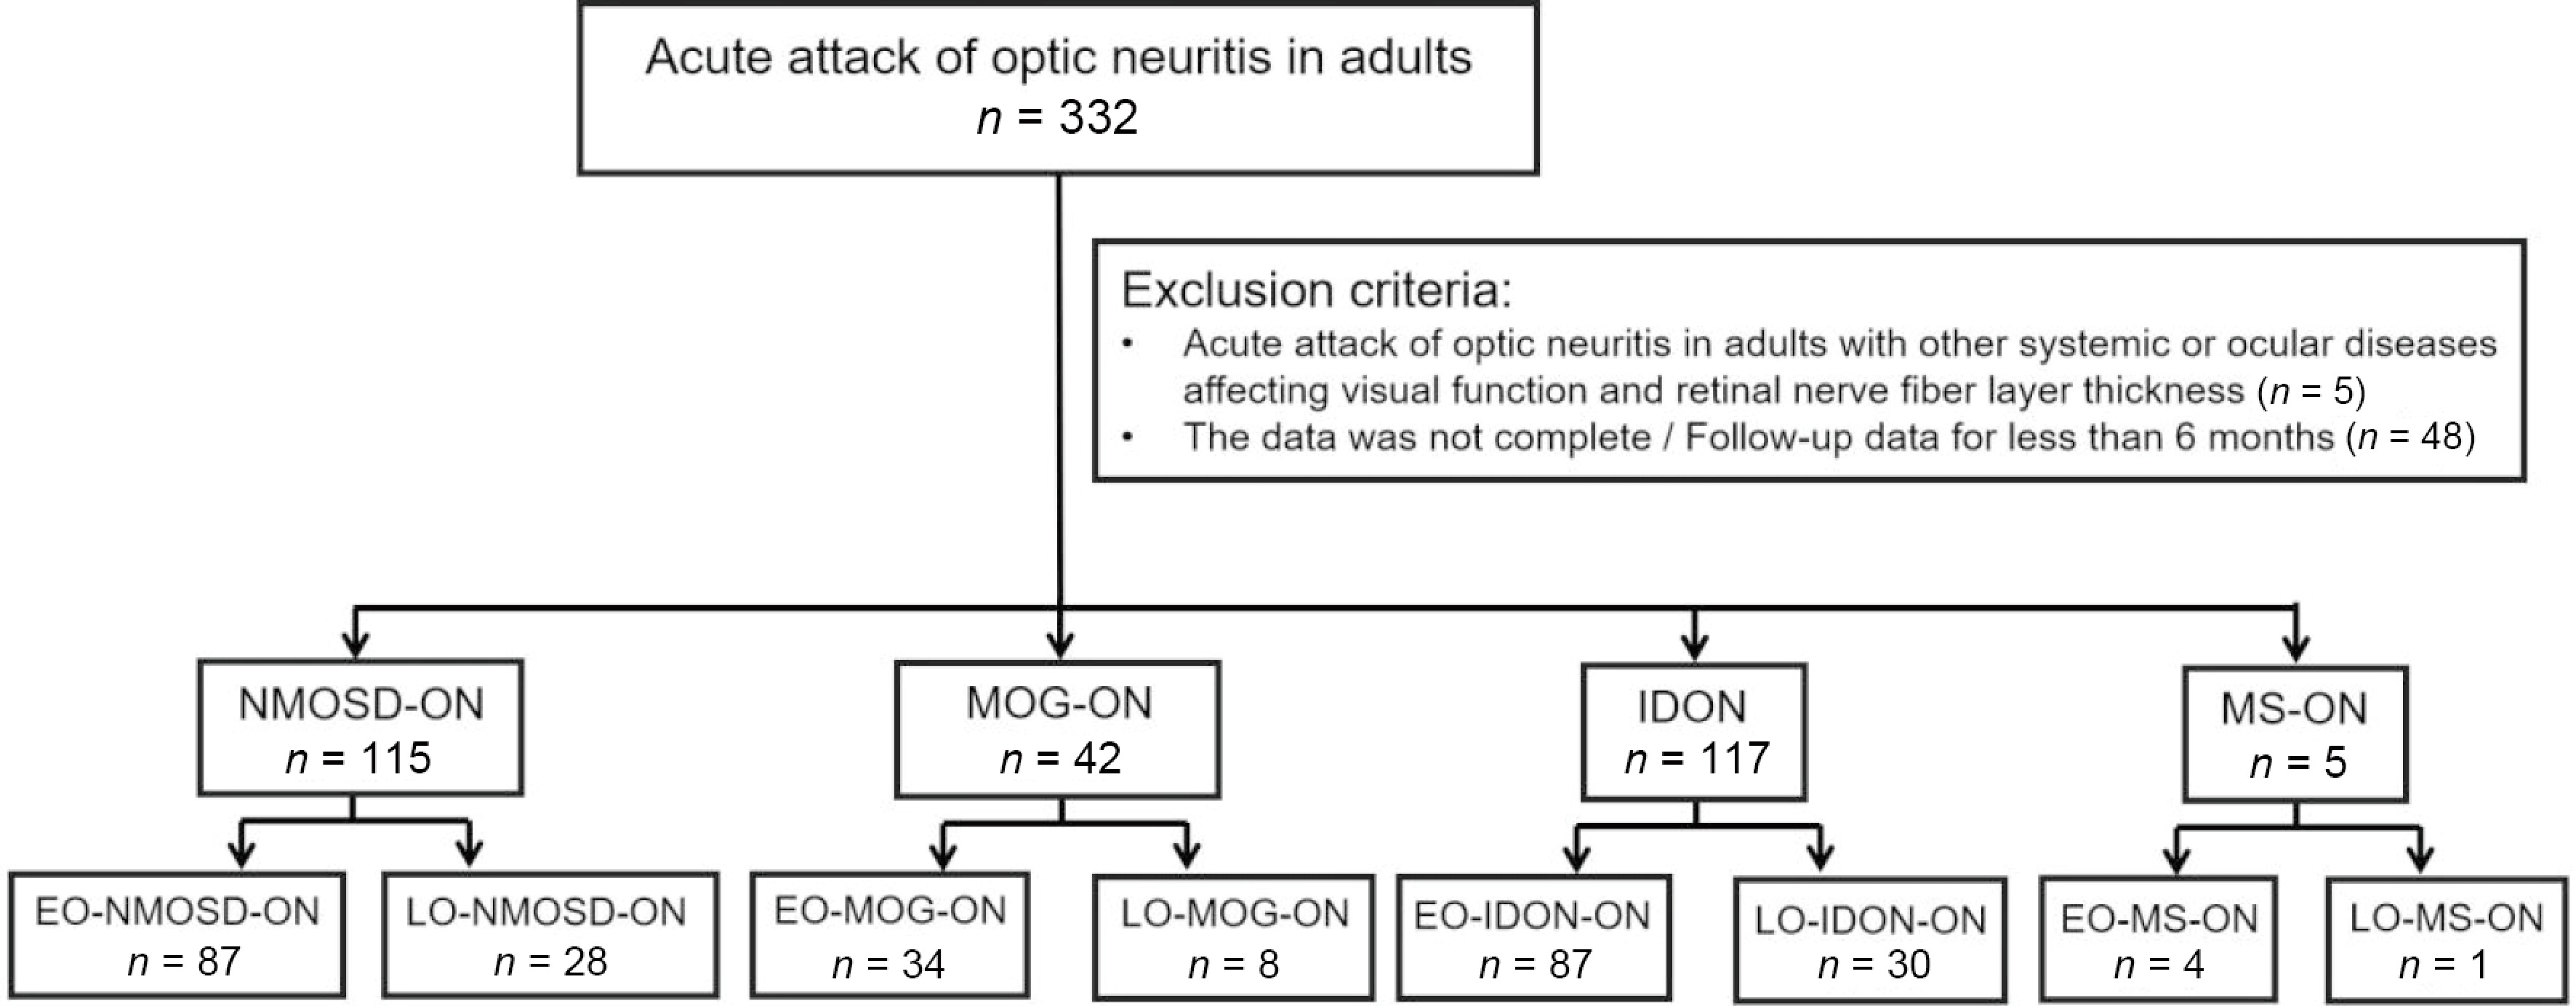
Figure 1.
Flowchart of the patient groupings according to the ON subtype and age. Abbreviations: ON, optic neuritis; NMOSD-ON, neuromyelitis optica spectrum disorder-related optic neuritis; MOG-ON, myelin oligodendrocyte glycoprotein antibody-related optic neuritis; IDON, idiopathic optic neuritis; MS-ON, multiple sclerosis-related optic neuritis; LO, late onset, ≥ 50 years of age at the onset of ON; EO, early onset, < 50 years of age at the onset of ON.
-
All ON EO-ON LO-ON Statistical approach p-value Number of cases, n (%) 205 (75.6) 66 (24.4) Female-to-male ratio 137:68 (2:1) 49:17 (2.8:1) χ2 test 0.356 Age, years, median (IQR) 34 (27–41) 56 (53–61.25) Age, years, range 18–49 50–83 Bilateral-to-unilateral ratio (bilateral %) 39:166 (20.6%) 18:48 (27.3%) χ2 test 0.153 Monophasic-to-relapsing ratio (relapsing %) 82:123 (60%) 32:34 (51.5%) χ2 test 0.225 Autoantibodies 55 (26.8%) 17 (25.8%) χ2 test 0.864 ANA (+) 31 (15.1%) 7 (10.6%) χ2 test 0.358 SSA (+) 12 (5.6%) 5 (7.6%) Fisher's exact test 0.616 SSB (+) 3 (1.5%) 2 (3.0%) Fisher's exact test 0.598 HLA-B27 (+) 6 (2.9%) 1 (1.5%) Fisher's exact test 0.855 TPOAb (+), TGAb (+) 3 (1.5%) 2 (3.0%) Fisher's exact test 0.598 Other central nervous system lesions (MRI) Brain 29 (14.1%) 16 (24.2%) χ2 test 0.055 Spinal 16 (7.8%) 3 (4.5%) Fisher's exact test 0.532 Clinical manifestations Headache 30 (14.6%) 9 (13.6%) χ2 test 0.841 Ophthalmodynia 79 (38.5%) 17 (25.8%) χ2 test 0.059 Vomiting hiccups 11 (5.4%) 0 (0%) Fisher's exact test 0.071 Acroanesthesia 26 (12.7%) 5 (7.6%) Fisher's exact test 0.257 Optic disc edema 81 (39.5%) 24 (36.4%) χ2 test 0.648 BCVA, logMAR, median (IQR) Onset 1.60 (0.60–1.85) 1.85 (0.70–2.00) Mann–Whitney U-test 0.078 ≤ 20/200 (n) 148 51 χ2 test 0.417 Final 0.40 (0.097–1.30) 0.60 (0.30–1.52) Mann–Whitney U-test 0.003** ≤ 20/200 (n) 72 27 χ2 test 0.396 VF MD, dB, median (IQR) Onset −25.69 (−33.48 to −15.26) −26.58 (−33.78 to −18.4) Mann–Whitney U-test 0.591 Final −5.90 (−13.21 to −1.86) −16.35 (−29.48 to −4.59) Mann–Whitney U-test 0.001** Final pRNFL, mm, median (IQR) 66.00 (58.00–80.00) 65.00 (55.50–75.50) Mann–Whitney U-test 0.245 Final GCIPL, mm, median (IQR) 56.00 (52.00–63.50) 56.00 (51.00–66.00) Mann–Whitney U-test 0.711 ON, optic neuritis; LO, late onset, ≥ 50 years of age at the onset of ON; EO, early onset, < 50 years of age at the onset of ON; BCVA, best-corrected visual acuity; VF, visual field; MD, mean deviation; pRNFL, peripapillary retinal nerve fiber layer; GCIPL, ganglion cell layer–inner plexiform layer. *: < 0.05, **: < 0.01, ***: < 0.001. Table 1.
Clinical outcomes of LO- and EO-ON in all adult patients.
-
NMOSD-ON EO-NMOSD-ON LO-NMOSD-ON Statistical approach p-value Number of cases, n (%) 84 (75.00%) 28 (25.00) Female-to-male ratio 69:15 (4.6:1) 26:2 (13:1) Fisher's exact test 0.29 Age, years, median (IQR) 35.00 (27.00–41.75) 54.50 (52.00–61.75) Age, years, range 18–49 50–83 Bilateral-to-unilateral ratio (bilateral %) 5:79 (5.95%) 5:23 (17.86%) Fisher's exact test 0.117 Monophasic-to-relapsing ratio (relapsing %) 14:70 (83.33%) 7:21 (75%) χ2 test 0.328 Autoantibodies 40 (47.62%) 11 (39.29%) χ2 test 0.443 ANA (+) 22 (26.19%) 4 (14.29%) Fisher's exact test 0.301 SSA (+) 12 (14.29%) 3 (10.71%) Fisher's exact test 0.873 SSB (+) 3 (3.57%) 2 (7.14%) Fisher's exact test 0.597 HLA-B27(+) 2 (2.38%) 0 (0.00%) Fisher's exact test 1.0 TPOAb (+), TGAb (+) 1 (1.19%) 2 (7.14%) Fisher's exact test 0.154 Other central nervous system lesions (MRI) Brain 10 (11.90%) 3 (10.71%) Fisher's exact test 1.0 Spinal 6 (7.14%) 1 (3.57%) Fisher's exact test 0.822 Clinical manifestations Headache 15 (17.86%) 4 (14.29%) Fisher's exact test 0.884 Ophthalmodynia 40 (47.62%) 9 (32.14%) χ2 test 0.153 Vomiting hiccups 9 (10.71%) 0 (0%) Fisher's exact test 0.109 Acroanesthesia 21 (25.00%) 2 (7.14%) Fisher's exact test 0.079 Optic disc edema 28 (33.33%) 9 (32.14%) χ2 test 0.908 BCVA, logMAR, median (IQR) Onset 1.85 (1.07–2.00) 1.85 (1.00–2.00) Mann–Whitney U-test 0.346 ≤ 20/200 (n) 70 (83.33%) 23 (82.14%) χ2 test 0.884 Final 0.69 (0.20–1.60) 0.80 (0.42–1.79) Mann–Whitney U-test 0.791 ≤ 20/200 (n) 39 (46.4%) 14 (50%) χ2 test 0.743 VF MD, dB, median (IQR) Onset −32.11 (−34.00 to −16.76) −31.80 (−34.00 to −18.46) Mann–Whitney U-test 0.264 Final −15.54 (−28.15 to −5.99) −18.94 (−33.90 to −5.88) Mann–Whitney U-test 0.847 Final pRNFL, mm, median (IQR) 62.00 (56.00–71.00) 64.00 (54.00–74.00) Mann–Whitney U-test 0.744 Final GCIPL, mm, median (IQR) 55.00 (50.00,58.50) 52.00 (47.00–58.75) Mann–Whitney U-test 0.939 ON, optic neuritis; NMOSD-ON, neuromyelitis optica spectrum disorder-related ON; LO, late onset, age at ON onset ≥ 50 years; EO, early onset, age at ON onset < 50 years; BCVA, best-corrected visual acuity; MD, mean deviation; pRNFL, peripapillary retinal nerve fiber layer; GCIPL, ganglion cell layer–inner plexiform layer. *: < 0.05, **: < 0.01, ***: < 0.001. Table 2.
Clinical outcomes of LO-NMOSD-ON and EO-NMOSD-ON.
-
MOG-ON EO-MOG-ON LO-MOG-ON Statistical approach p-value Number of cases, n (%) 34 (81%) 8 (19%) Female-to-male ratio 19:15 (1.26:1) 6:2 (3:1) Fisher's exact test 0.206 Age, years, median (IQR) 31.5 (27.00–37.25) 53.5 (52.00–61.75) Age, years, range 22–49 51–67 Bilateral-to-unilateral ratio (bilateral %) 8:26 (23.52%) 2:6 (25%) Fisher's exact test 1.0 Monophasic-to-relapsing ratio (relapsing %) 9:25 (74%) 3:5 (62.5%) Fisher's exact test 0.852 Autoantibodies 3 (8.82%) 1 (12.5%) Fisher's exact test 0.352 ANA (+) 1 (3.1%) 0 (0%) Fisher's exact test 1.0 SSA (+) 0 (0%) 0 (0%) Fisher's exact test 1.0 SSB (+) 0 (0%) 0 (0%) Fisher's exact test 1.0 HLA-B27 (+) 0 (0%) 1 (14.3%) Fisher's exact test 0.179 TPOAb (+), TGAb (+) 2 (6.2%) 0 (0%) Fisher's exact test 1.0 Other central nervous system lesions (MRI) Brain 2 (6.2%) 0 (0%) Fisher's exact test 1.0 Spinal 1 (3.1%) 0 (0%) Fisher's exact test 1.0 Clinical manifestations Headache 7 (21.9%) 2 (28.6%) Fisher's exact test 1.0 Ophthalmodynia 17 (50%) 5 (71.4%) Fisher's exact test 1.0 Vomiting hiccups 1 (3.1%) 0 (0%) Fisher's exact test 1.0 Acroanesthesia 1 (3.1%) 0 (0%) Fisher's exact test 1.0 Optic disc edema 17 (50%) 4 (57.1%) Fisher's exact test 1.0 BCVA, logMAR, median (IQR) Onset 1.3 (0.30–1.70) 1.85 (1.05–2.50) Mann–Whitney U-test 0.008** ≤ 20/200 (n) 23 (67.6%) 7 (87.5%) Fisher's exact test 0.494 Final 0.10 (0.00–0.30) 0.25 (0.15–0.52) Mann–Whitney U-test 0.041* ≤ 20/200 (n) 3 (8.8%) 0 (0.00%) Fisher's exact test 1.0 VF MD, dB, median (IQR) Onset −23.37 (−33.10 to −6.42) −24.3 (−32.26 to −17.26) Mann–Whitney U-test 0.109 Final −3.62 (−6.08 to −1.57) −2.94 (−6.13 to −2.77) Mann–Whitney U-test 0.749 Final pRNFL, mm, median (IQR) 74.00 (63.00–83.50) 71.00 (66.50–85.50) Mann–Whitney U-test 0.689 Final GCIPL, mm, median (IQR) 59.00 (54.00–66.25) 58.00 (54.00–72.00) Mann–Whitney U-test 0.336 ON, optic neuritis; MOG-ON, myelin oligodendrocyte glycoprotein antibody-related ON; LO, late onset, ≥ 50 years of age at the onset of ON; EO, early onset, < 50 years of age at the onset of ON; BCVA, best-corrected visual acuity; VF, visual field; MD, mean deviation; pRNFL, peripapillary retinal nerve fiber layer; GCIPL, ganglion cell layer–inner plexiform layer. *: < 0.05, **: < 0.01, ***: < 0.001. Table 3.
Clinical outcomes of LO-MOG-ON and EO-MOG-ON.
-
IDON EO-IDON LO-IDON Statistical approach p-value Number of cases, n (%) 87 (74.4%) 30 (25.6%) Female-to-male ratio 49:38 (1.3:1) 17:13 (1.3:1) χ2 test 0.974 Age, years, median (IQR) 34.00 (27.00–41.00) 57.50 (54.00–61.5) Age, years, range 19–49 51–77 Bilateral-to-unilateral (bilateral %) 26:61 (29.9%) 11:19 (36.7%) χ2 test 0.491 Monophasic-to-relapsing (relapsing %) 59:28 (32.2%) 22:8 (26.7%) χ2 test 0.572 Autoantibodies 12 (13.8%) 5 (16.7%) Fisher's exact test 0.7 ANA (+) 8 (9.2%) 3 (10%) Fisher's exact test 1.0 SSA (+) 0 (0%) 2 (6.67%) Fisher's exact test 0.064 SSB (+) 0 (0%) 0 (0%) Fisher's exact test 1.0 HLA-B27 (+) 4 (4.6%) 0 (0%) Fisher's exact test 0.571 TPOAb (+), TGAb (+) 0 (0%) 0 (0%) Fisher's exact test 1.0 Other central nervous system lesions (MRI) Brain 17 (19.5%) 13 (43.3%) χ2 test 0.01* Spinal 9 (10.3%) 2 (6.67%) Fisher's exact test 0.816 Clinical manifestations Headache 8 (9.2%) 3 (10%) Fisher's exact test 1.0 Ophthalmodynia 14 (16.1%) 3 (10%) Fisher's exact test 0.606 Vomiting hiccups 1 (1.15%) 0 (0%) Fisher's exact test 1.0 Acroanesthesia 4 (4.6%) 3 (10%) Fisher's exact test 0.37 Optic disc edema 36 (41.3%) 11 (36.7%) χ2 test 0.65 BCVA, logMAR, median (IQR) Onset 1.52 (0.60–1.85) 1.70 (0.60–2.00) Mann–Whitney U-test 0.363 ≤ 20/200 (n) 55 (63.2%) 21 (70%) χ2 test 0.502 Final 0.20 (0.00–0.50) 0.40 (0.20–1.00) Mann–Whitney U-test 0.012* ≤ 20/200 (n) 30 (34.5%) 13 (43.3%) χ2 test 0.386 VF MD, dB, median (IQR) Onset −22.31 (−31.66 to −13.23) −24.96 (−31.45 to −17.4) Mann–Whitney U-test 0.345 Final −5.90 (−13.21 to −1.68) −19.73 (−30.78 to −9.84) Mann–Whitney U-test 0.0004*** Final pRNFL, mm, median (IQR) 70.00 (57.50–82.50) 64.00 (55–79) Mann–Whitney U-test 0.191 Final GCIPL, mm, median (IQR) 58.00 (53.75–64.50) 58.50 (51.70–75) Mann–Whitney U-test 0.714 Abbreviations: ON, optic neuritis; IDON, idiopathic ON; LO, late onset, ≥ 50 years of age at the onset of ON; EO, early onset, < 50 years of age at the onset of ON; BCVA, best-corrected visual acuity; VF, visual field; MD, mean deviation; pRNFL, peripapillary retinal nerve fiber layer; GCIPL, ganglion cell layer–inner plexiform layer. *: < 0.05, **: < 0.01, ***: < 0.001 Table 4.
Clinical outcomes of LO-IDON and EO-IDON.
-
LO-ON p-value NMOSD MOG IDON Statistical approach p0 p1† p2† p3† Number of cases, n (%) 28 (25%) 8 (19%) 30 (25.6%) χ2 test 0.68 0.437 0.911 0.39 Female-to-male ratio 26:2 (13:1) 6:2 (3:1) 17:13 (1.3:1) Fisher–Freeman–Halton exact test 0.005** 0.207 0.009** 0.592 Age, years, median (IQR) 54.50 (52.00–61.75) 53.5 (52.00–61.75) 57.50 (54.00–61.5) Kruskal–Wallis H-test 0.186 0.3 0.185 0.088 Age, years, range 50–83 51–67 51–77 Bilateral-to-unilateral ratio (bilateral %) 5:23 (16%) 2:6 (25%) 11:19 (36.7%) Fisher–Freeman–Halton exact test 0.267 1.0 0.109 0.843 Monophasic-to-relapsing ratio (relapsing %) 7:21 (75%) 3:5 (62.5%) 22:8 (26.7%) Fisher–Freeman–Halton exact test 0.001** 0.804 0.001** 0.108 Autoantibodies 11 (39.3%) 1 (12.5%) 5 (16.7%) Fisher–Freeman–Halton exact test 0.108 0.321 0.054 1.0 ANA (+) 4 (14.3%) 0 (0%) 3 (10%) Fisher–Freeman–Halton exact test 0.748 0.548 0.689 1.0 SSA (+) 3 (10.7%) 0 (0%) 2 (6.67%) Fisher–Freeman–Halton exact test 0.828 1.0 0.65 1.0 SSB (+) 2 (7.1%) 0 (0%) 0 (0%) Fisher–Freeman–Halton exact test 0.406 1.0 0.202 1.0 HLA-B27(+) 0 1 (14.3%) 0 (0%) Fisher–Freeman–Halton exact test 0.121 0.233 1.0 1.0 TPOAb (+), TGAb (+) 2 (7.1%) 0 (0%) 0 (0%) Fisher–Freeman–Halton exact test 0.406 1.0 1.0 1.0 Other central nervous system lesions (MRI) Brain 3 (10.7%) 0 (0%) 13 (43.3%) Fisher–Freeman–Halton exact test 0.005** 1.0 0.024* 0.034* Spinal 1 (3.6%) 0 (0%) 2 (6.67%) Fisher–Freeman–Halton exact test 1.0 1.0 1.0 1.0 Clinical manifestations Headache 4 (14.3%) 2 (28.6%) 3 (10%) Fisher–Freeman–Halton exact test 0.472 0.565 0.813 0.279 Ophthalmodynia 9 (32.1%) 5 (71.4%) 3 (10%) Fisher–Freeman–Halton exact test 0.007** 0.204 0.02* 0.005** Vomiting hiccups 0 0 (0%) 0 (0%) Fisher–Freeman–Halton exact test 1.0 1.0 1.0 1.0 Acroanesthesia 2 (7.1%) 0 (0%) 3 (10%) Fisher–Freeman–Halton exact test 1.0 1.0 1.0 1.0 Optic disc edema 9 (32.1%) 4 (57.1%) 11 (36.7%) Fisher–Freeman–Halton exact test 0.677 0.666 0.959 0.687 BCVA, logMAR, median (IQR) Onset 1.85 (1.00–2.00) 1.85 (1.05–2.50) 1.7 (0.6–2.0) Kruskal–Wallis H-test 0.588 0.553 0.301 0.422 ≤ 20/200 (n) 23 (82.14%) 7 (87.5%) 21 (70%) Fisher–Freeman–Halton exact test 0.501 1.0 0.28 0.584 Final 0.80 (0.42–1.79) 0.25 (0.15–0.52) 0.40 (0.20–1.00) Kruskal–Wallis H-test 0.05* 0.02* 0.356 0.004** ≤ 20/200 (n) 14 (50%) 0 (0.00%) 13 (43.3%) Fisher–Freeman–Halton exact test 0.032* 0.013* 0.611 0.034* VF MD, dB, median (IQR) Onset −31.80
(−34.00 to −18.46)−24.3
(−32.26, −17.26)−24.96
(−31.45, −17.4)Kruskal–Wallis H-test 0.366 0.427 0.162 0.917 Final −18.94
(−33.90 to −5.88)−2.94
(−6.13, −2.77)−19.73
(−30.78, −9.84)Kruskal–Wallis H-test 0.006** 0.003** 0.327 0.005** Final pRNFL, mm, median (IQR) 64.00 (54.00–74.00) 71.00 (66.50–85.50) 64.00 (55.00–79.00) Kruskal–Wallis H-test 0.192 0.061 0.691 0.137 Final GCIPL, mm, median (IQR) 52.00 (47.00–58.75) 58 (54.00–72.00) 58.5 (51.70–75) Kruskal–Wallis H-test 0.066 0.096 0.031* 0.947 Abbreviations: ON, optic neuritis; NMOSD-ON, neuromyelitis optica spectrum disorder-related ON; MOG-ON, myelin oligodendrocyte glycoprotein antibody-related ON; IDON, idiopathic ON; LO, late onset, ≥ 50 years of age at the onset of ON; BCVA, best-corrected visual acuity; MD, mean deviation; pRNFL, peripapillary retinal nerve fiber layer; GCIPL, ganglion cell layer–inner plexiform layer; p0, comparison among the three groups (NMOSD-ON, MOG-ON, and IDON); p1, the NMOSD-ON group compared with the MOG-ON group; p2, the NMOSD-ON group compared with the IDON group; p3, the MOG-ON group compared with the IDON group. † Bonferroni correction was applied for multiple comparisons in p1, p2, and p3. *: < 0.05, **: < 0.01, ***: < 0.001. Table 5.
Comparison of clinical information among the patients with LO-NMOSD-ON, LO-MOG-ON, and LO-IDON.
Figures
(1)
Tables
(5)