-
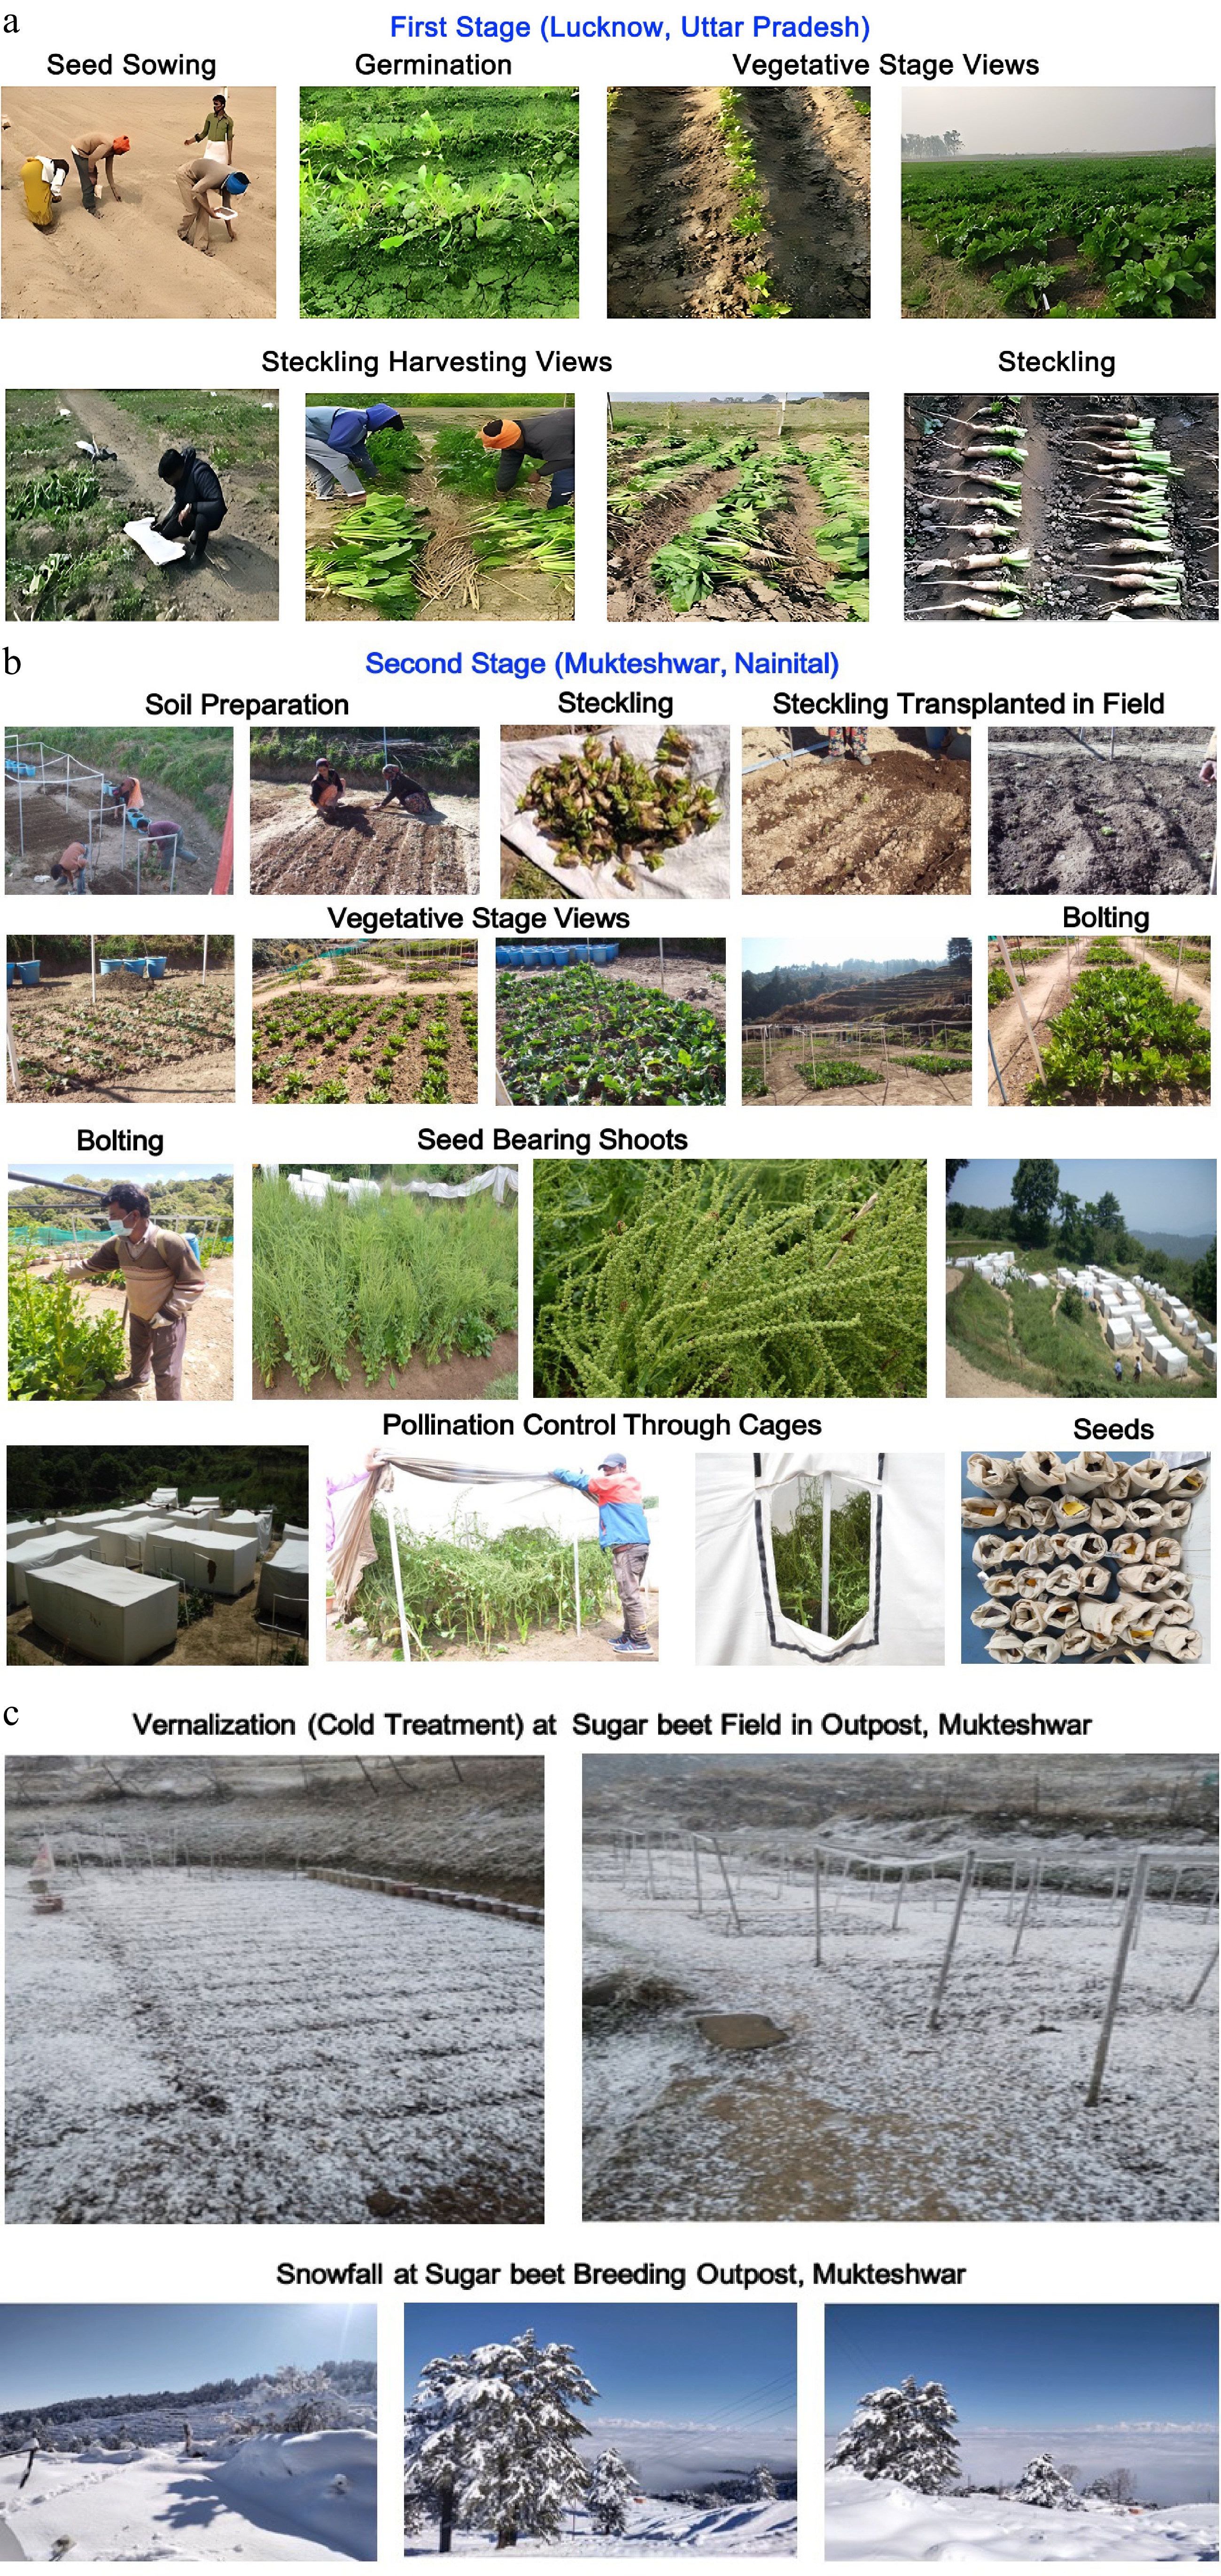
Figure 1.
Steckling transplanting method of sugar beet seed production.
-
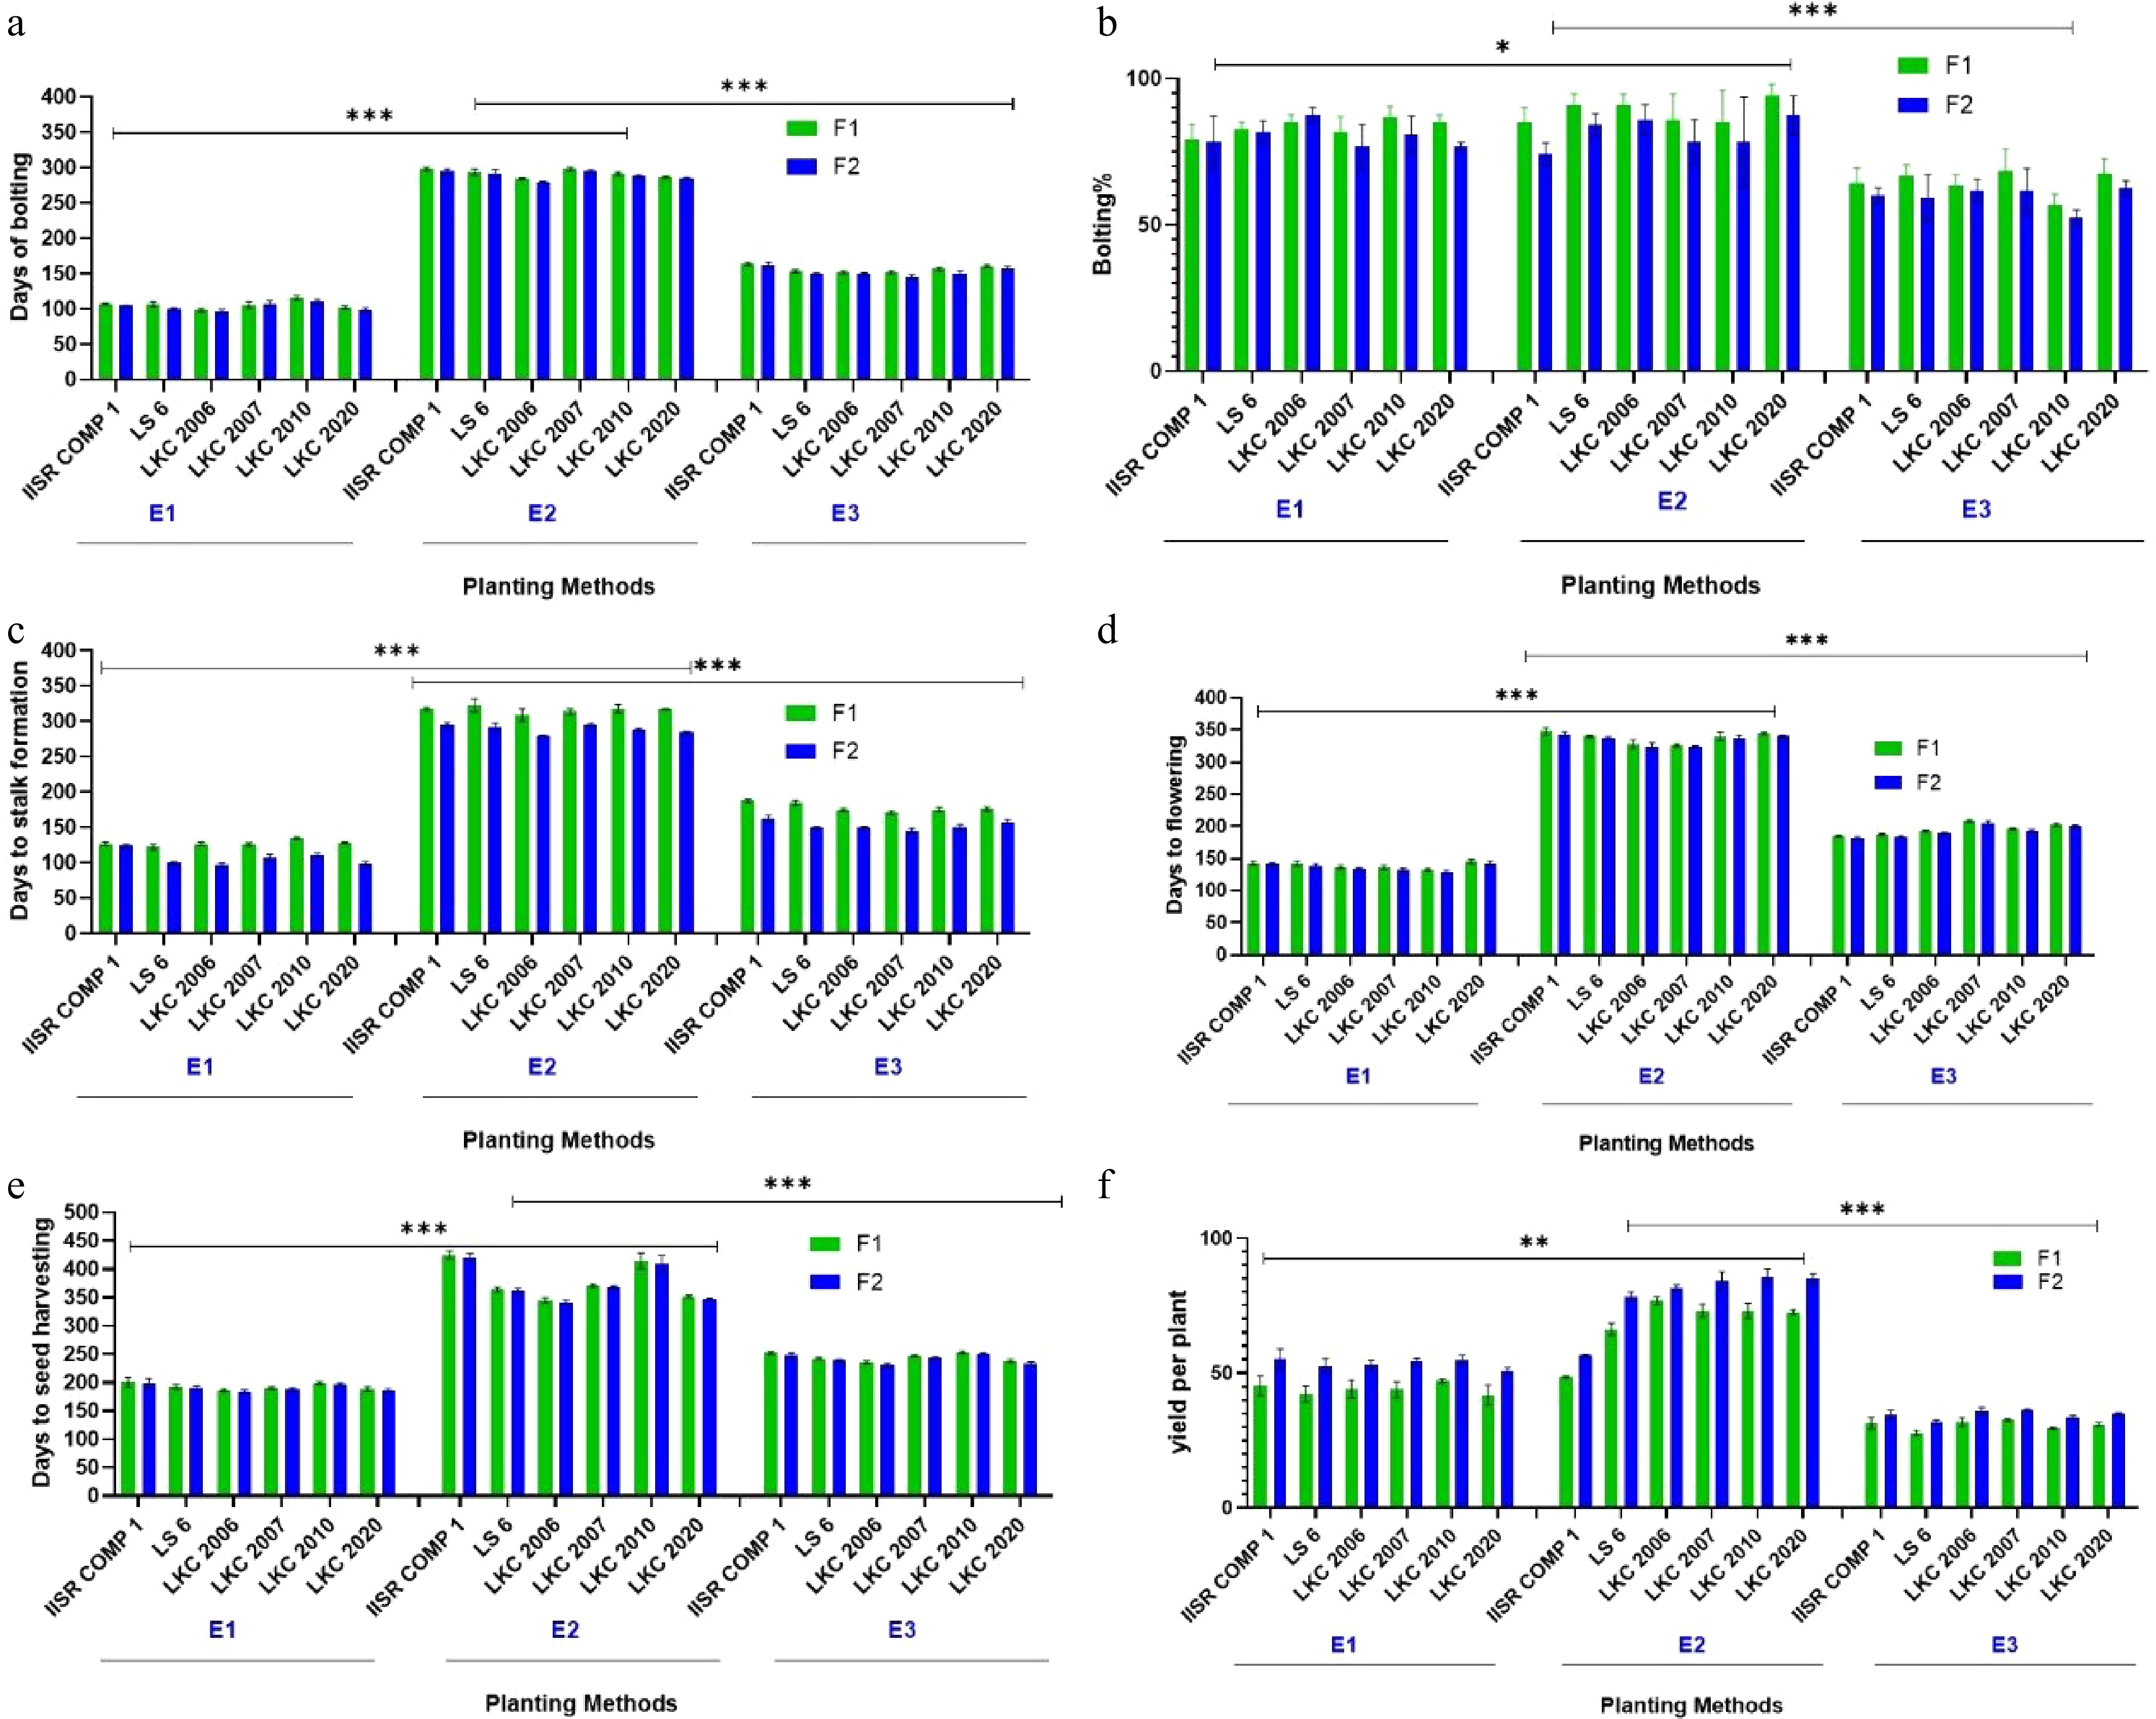
Figure 2.
Comparative assessment of planting methods and fertilizer doses based on recorded observations (a) Days to bolting. (b) Bolting per cent. (c) Days to stalk formation. (d) Days to flowering. (e) Days to seed harvesting. (f) Yield per plant. *** Highly significant (p < 0.001), and ** or * denotes significant differences (p < 0.05).
-
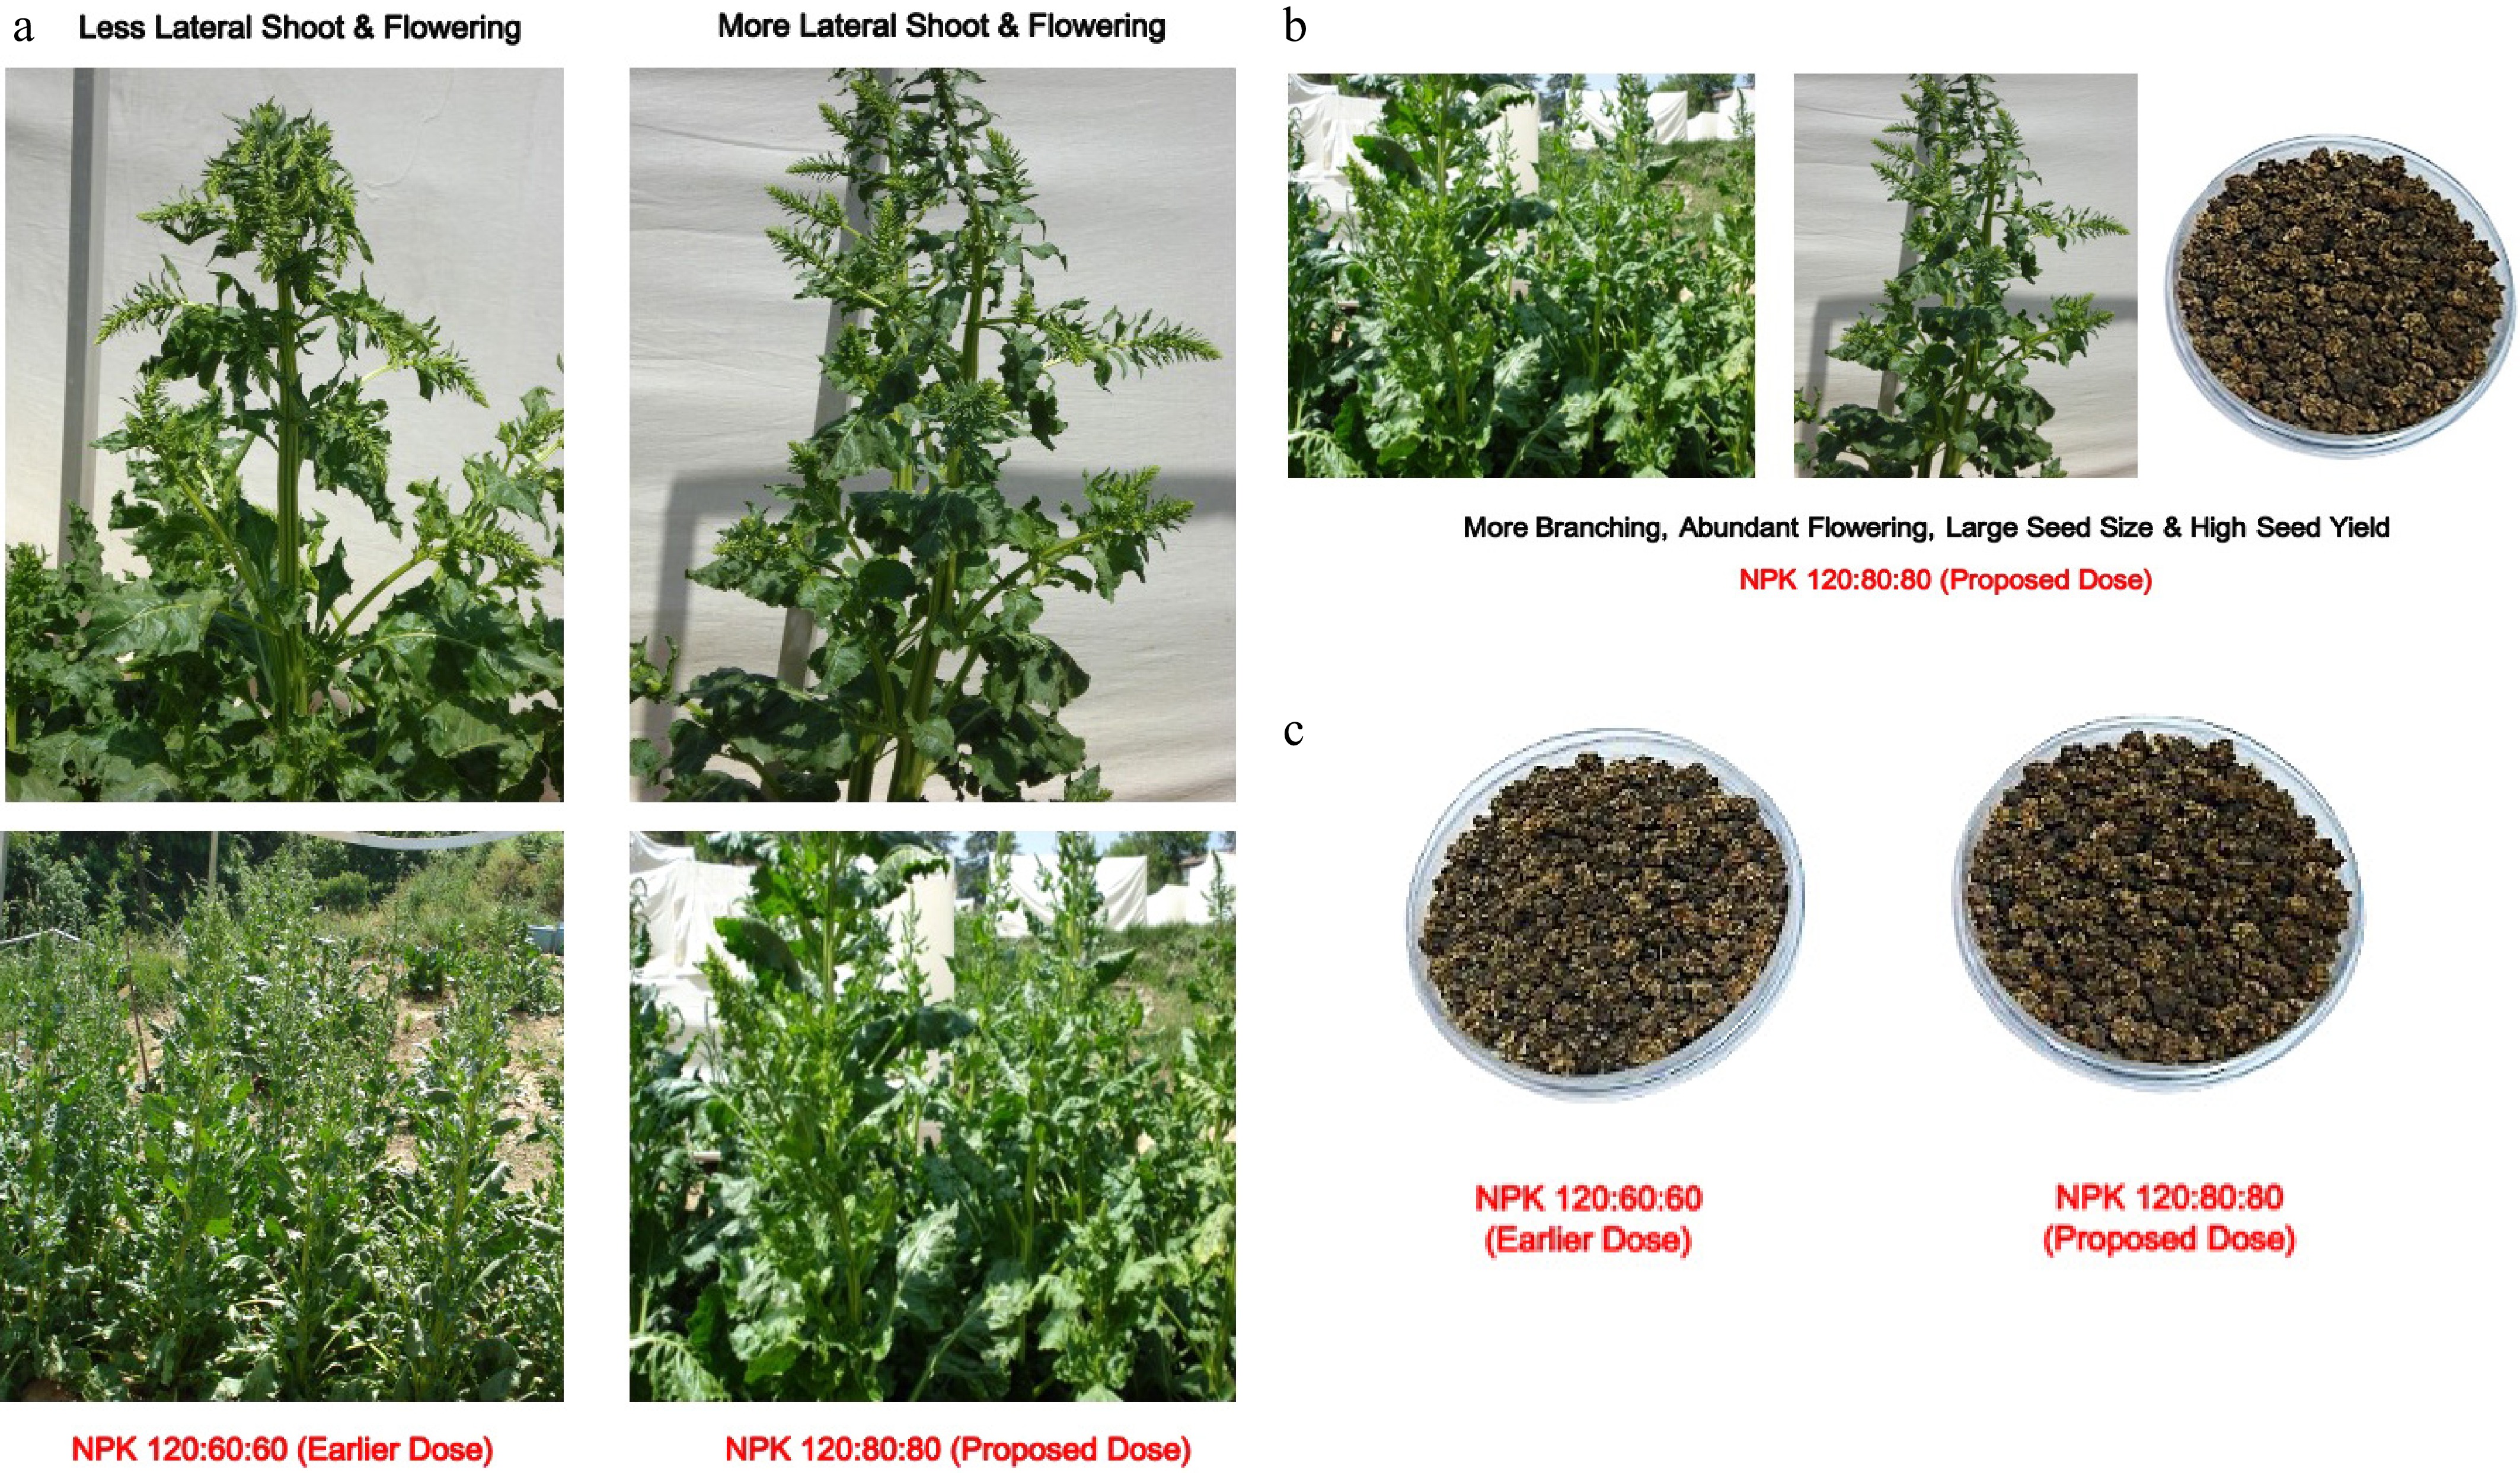
Figure 3.
Fertilizer dosage regimen for high and quality seed production in sugar beet.
-
Genotypes Characteristics LKC 2020 High ethanol potential even under drought stress, tolerance to Spodoptera litura (Armyworm) LKC 2010 Drought tolerance, elevated sucrose content, and robust bioethanol recovery LKC 2006 High temperature tolerant LKC 2007 Water deficit stress tolerant; high root yields and superior juice quality; high temperature tolerant IISR Comp 1 High temperature tolerant; salinity tolerant LS 6 High sugar content Table 1.
Characteristics of ICAR-ISRI identified sugar beet genotypes used in the study.
-
Planting/sowing method Steckling (E1) Pit method (E3) Direct seeded (E2) Location Lucknow (sowing) Mukteshwar (transplanting) Mukteshwar Sowing 1st fortnight of October May/June Transplanting 2nd fortnight of December 1st fortnight of March Not applicable Seed harvesting Aug (2nd fortnight) to September (1st fortnight) Key activities Sowing and steckling preparation at Lucknow (October–December); selection, trimming, and transport of healthy stecklings to Mukteshwar and transplantation, crop care, flowering, and seed setting (December–September). Sowing at ICAR-ISRI, Lucknow (October); selection and transport of stecklings to Mukteshwar; placement of roots in pre-dug pits (60 cm × 100 cm) before snowfall; natural cold treatment for vernalization during winter; retrieval and field transplantation after snowmelt and crop growth, flowering, and seed harvest (July–September). Direct sowing of sugar beet seeds at Mukteshwar (May–June); continuous crop growth without transplantation; regular irrigation, nutrient, and pest management; flowering, seed maturation, and harvesting (September next year). Table 2.
Description of different planting methods.
-
Planting style Germplasm Stalk percentage
(mean ± SD)Flowering percentage
(mean ± SD)Germination percentage
(mean ± SD)Test weight
(mean ± SD with rank)F1 F2 F1 F2 F1 F2 F1 F2 E1 IISR COMP 1 69.17 ± 3.75 65.00 ± 5.00 61.67 ± 8.75 58.33 ± 7.64 90.95 ± 2.88 85.98 ± 3.29 2.46 ± 0.03 3.18 ± 0.02 LS 6 80.00 ± 6.46 75.83 ± 5.15 71.67 ± 3.75 70.83 ± 2.89 92.46 ± 2.29 88.21 ± 2.46 2.33 ± 0.03 3.14 ± 0.06 LKC 2006 86.67 ± 1.44 78.33 ± 2.89 85.00 ± 5.00 70.83 ± 4.96 96.37 ± 2.34 91.57 ± 2.18 2.56 ± 0.04 3.24 ± 0.08 LKC 2007 85.83 ± 5.15 71.67 ± 2.89 80.00 ±6.45 69.17 ± 5.27 90.91 ± 1.76 85.35 ± 2.12 2.44 ± 0.03 3.04 ± 0.04 LKC 2010 74.17 ± 3.75 68.33 ± 2.89 87.50 ± 6.45 62.50 ± 4.79 89.38 ± 0.86 84.63 ± 2.03 2.35 ± 0.02 2.74 ± 0.34 LKC 2020 71.67 ± 3.75 65.83 ± 5.15 85.00 ± 2.89 64.17 ± 5.85 92.16 ± 2.11 88.28 ± 1.99 2.51 ± 0.07 3.23 ± 0.07 E2 IISR COMP 1 82.50 ± 4.33 70.00 ± 2.50 87.50 ± 2.50 65.00 ± 4.33 92.51 ± 1.99 88.54 ± 2.06 2.70 ± 0.18 3.10 ± 0.07 LS 6 90.83 ± 3.75 83.33 ± 2.89 95.83 ± 1.44 75.83 ± 1.44 93.28 ± 0.99 87.85 ± 1.42 2.52 ± 0.08 3.18 ± 0.02 LKC 2006 86.67 ± 5.00 81.67 ± 3.89 90.00 ± 2.89 73.33 ± 8.06 95.17 ± 0.91 91.84 ± 1.34 4.31 ± 0.09 4.84 ± 0.05 LKC 2007 84.17 ± 8.06 75.83 ± 7.5 82.50 ± 6.45 69.17 ± 7.50 91.74 ± 1.04 88.82 ± 1.01 4.35 ± 0.03 3.50 ± 0.34 LKC 2010 84.17 ±10.93 74.17 ± 16.07 80.83 ± 8.96 66.67 ± 17.56 91.51 ± 1.75 87.25 ± 1.87 4.08 ± 0.08 3.44 ± 0.06 LKC 2020 90.00 ± 2.89 81.67 ± 6.29 84.17 ± 3.75 74.17 ± 3.75 94.56 ± 0.88 90.87 ± 1.55 4.15 ± 0.04 3.55 ± 0.16 E3 IISR COMP 1 56.67 ± 7.64 61.67 ± 7.64 55.83 ± 3.75 51.67 ± 6.29 88.43 ± 1.45 86.35 ± 1.93 1.08 ± 0.02 1.53 ± 0.04 LS 6 55.83 ± 5.15 53.33 ± 5.00 54.17 ± 5.15 45.83 ± 3.75 95.22 ± 1.11 92.87 ± 1.57 1.35 ± 0.04 1.86 ± 0.09 LKC 2006 59.17 ± 3.89 55.83 ± 3.89 60.00 ± 6.29 53.33 ± 1.44 93.64 ± 0.99 89.74 ± 1.36 1.77 ± 0.04 2.12 ± 0.08 LKC 2007 62.50 ± 2.50 60.00 ± 6.29 57.50 ± 5.00 59.17 ± 4.79 90.32 ± 1.28 86.44 ± 1.45 1.46 ± 0.09 1.58 ± 0.11 LKC 2010 53.33 ± 3.79 50.00 ± 5.00 50.00 ± 4.33 46.67 ± 5.77 90.33 ± 1.45 86.18 ± 1.74 1.14 ± 0.05 1.29 ± 0.07 LKC 2020 65.00 ± 4.33 57.50 ± 5.00 61.67 ± 3.75 55.00 ± 5.00 91.63 ± 1.17 87.76 ± 1.68 1.15 ± 0.03 1.31 ± 0.06 * F1-120:60:60; F2-120:80:80; bold data denotes the highest values in each column (F1 and F2 separately for each trait), to highlight the most significant data. Table 3.
Mean ± standard deviation of agro-morphological traits under different planting methods and NPK fertilizer levels.
Figures
(3)
Tables
(3)