-
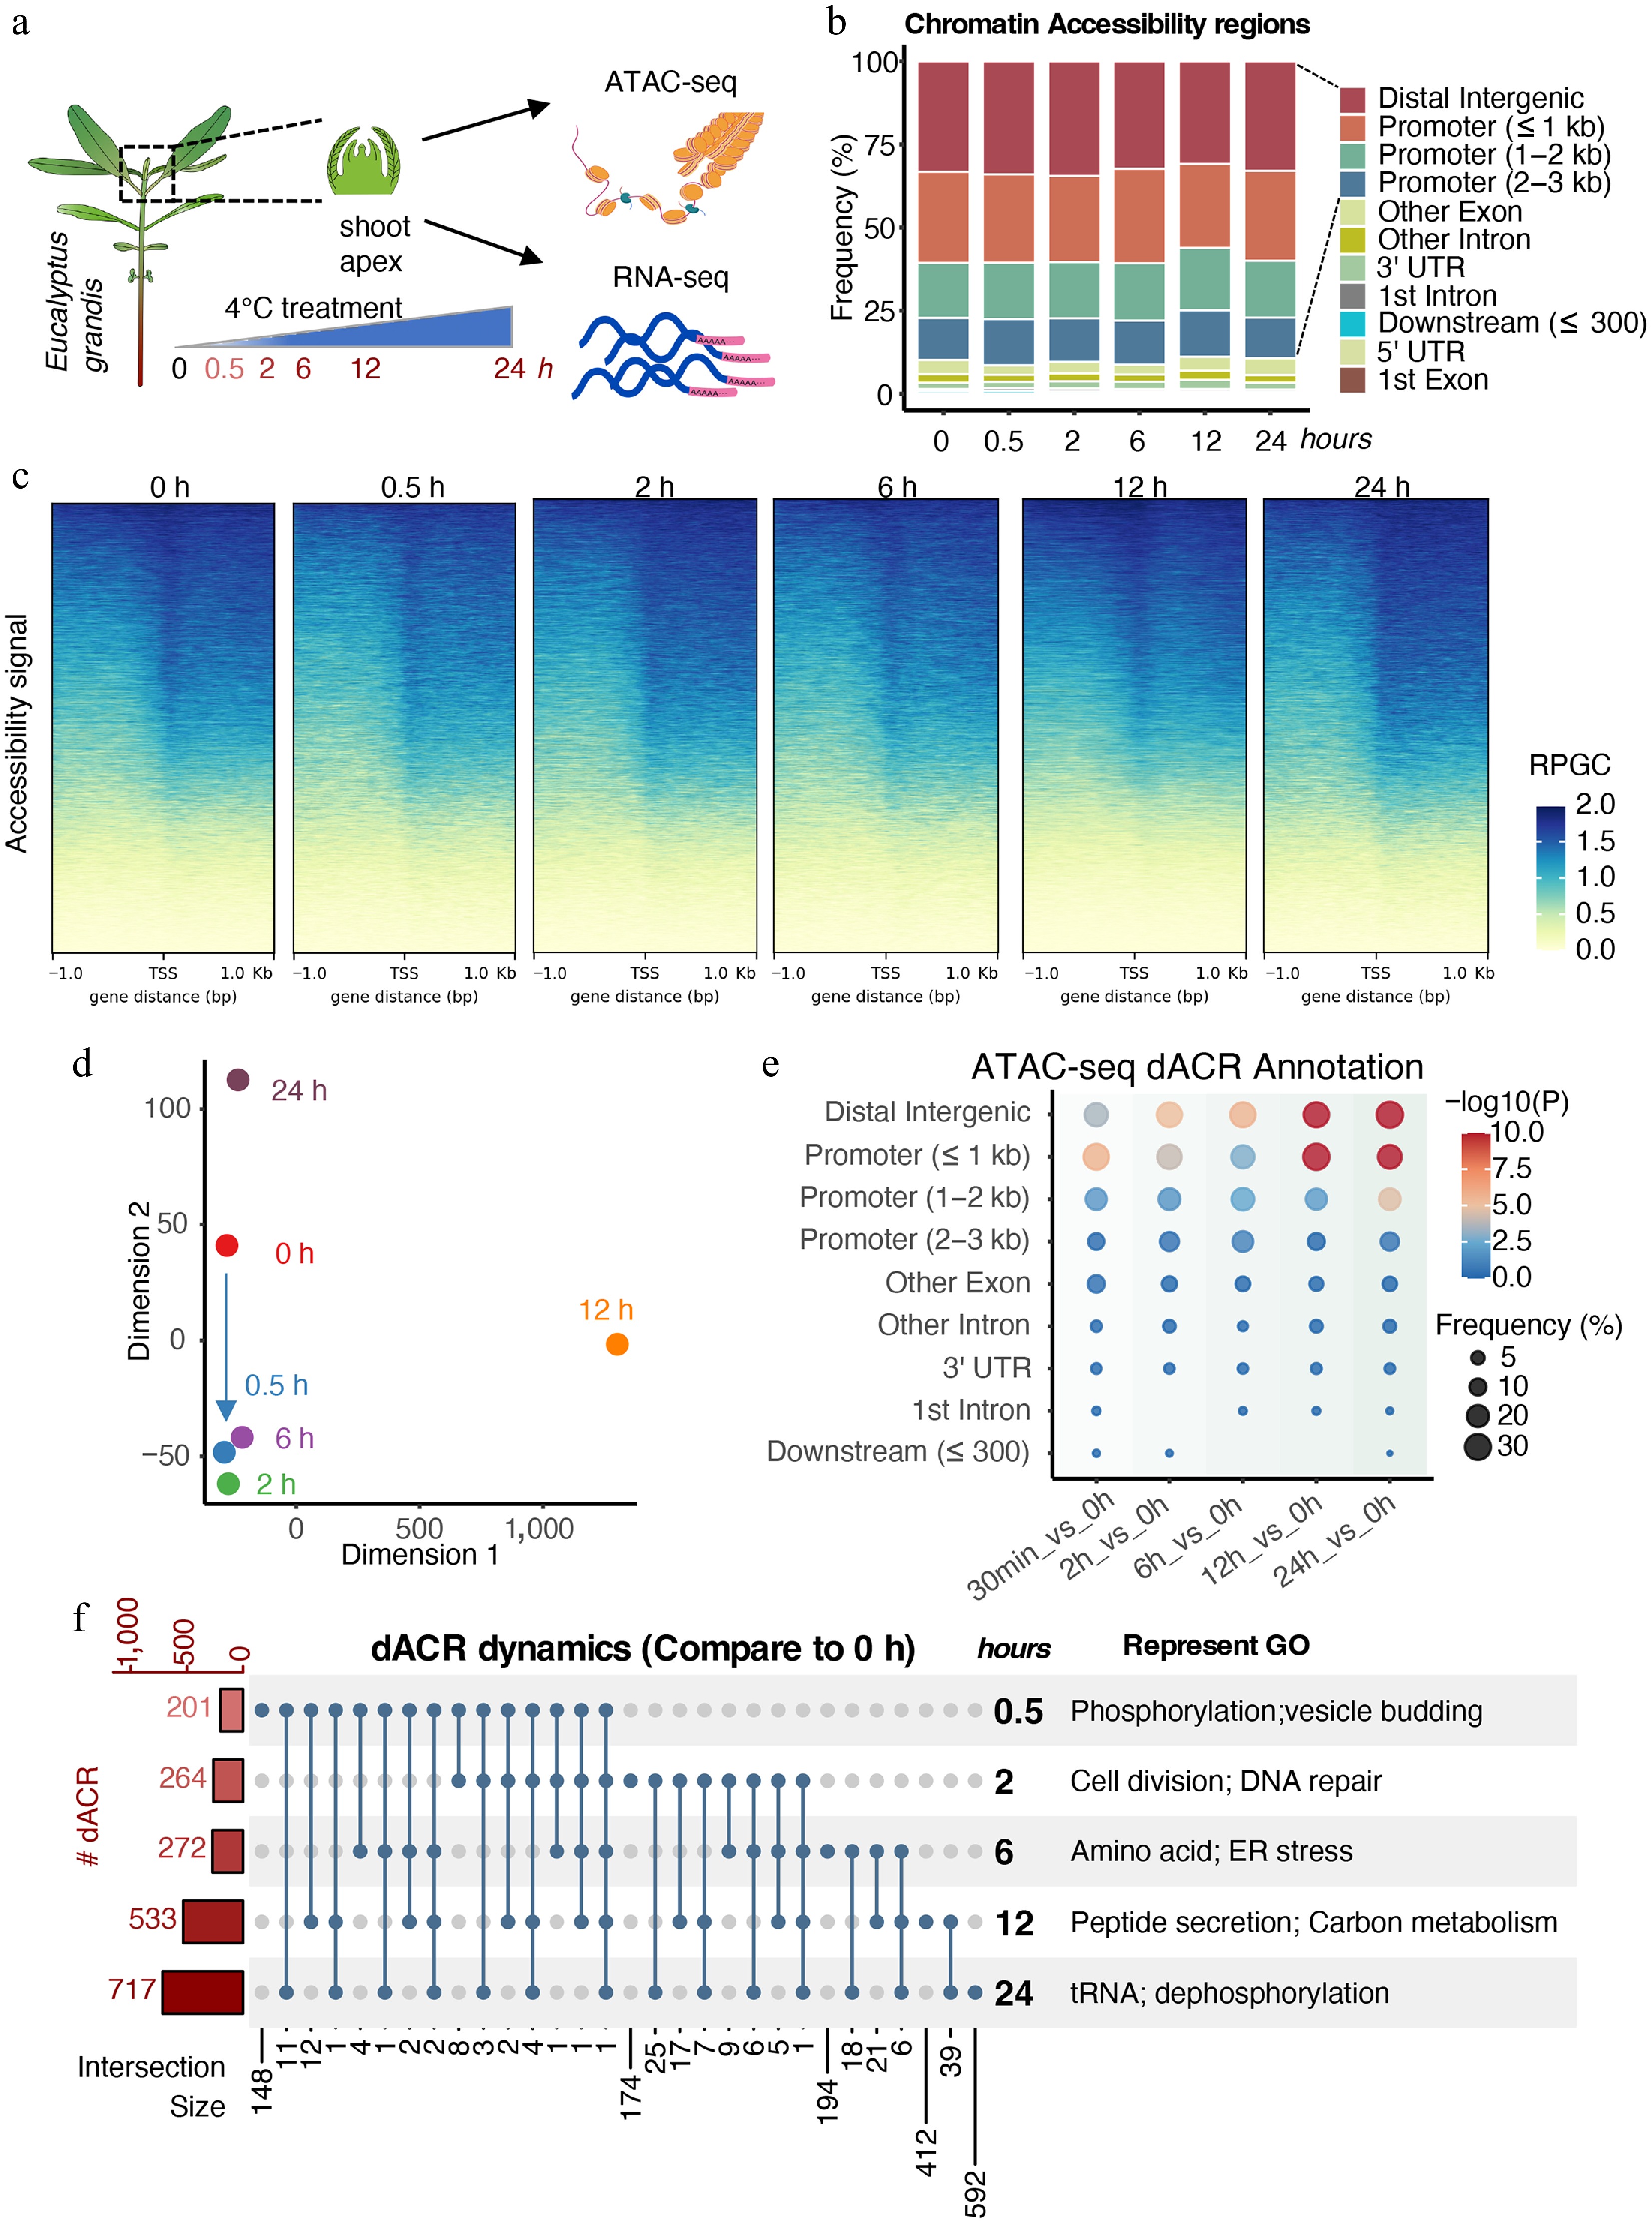
Figure 1.
Dynamic chromatin accessibility of E. grandis under cold stress. (a) Experimental scheme of sampling in this study. (b) Annotation of ATAC-seq peaks. (c) Chromatin accessibility signals around transcription start sites (TSS). Signals were calculated using reads per genomic content (RPGC) normalization. (d) Multidimensional scaling (MDS) analysis of samples. (e) Distribution of differentially accessible regions (dACRs) compared with the 0 h control. (f) Upset plot and GO enrichment analysis of genes associated with dACRs.
-
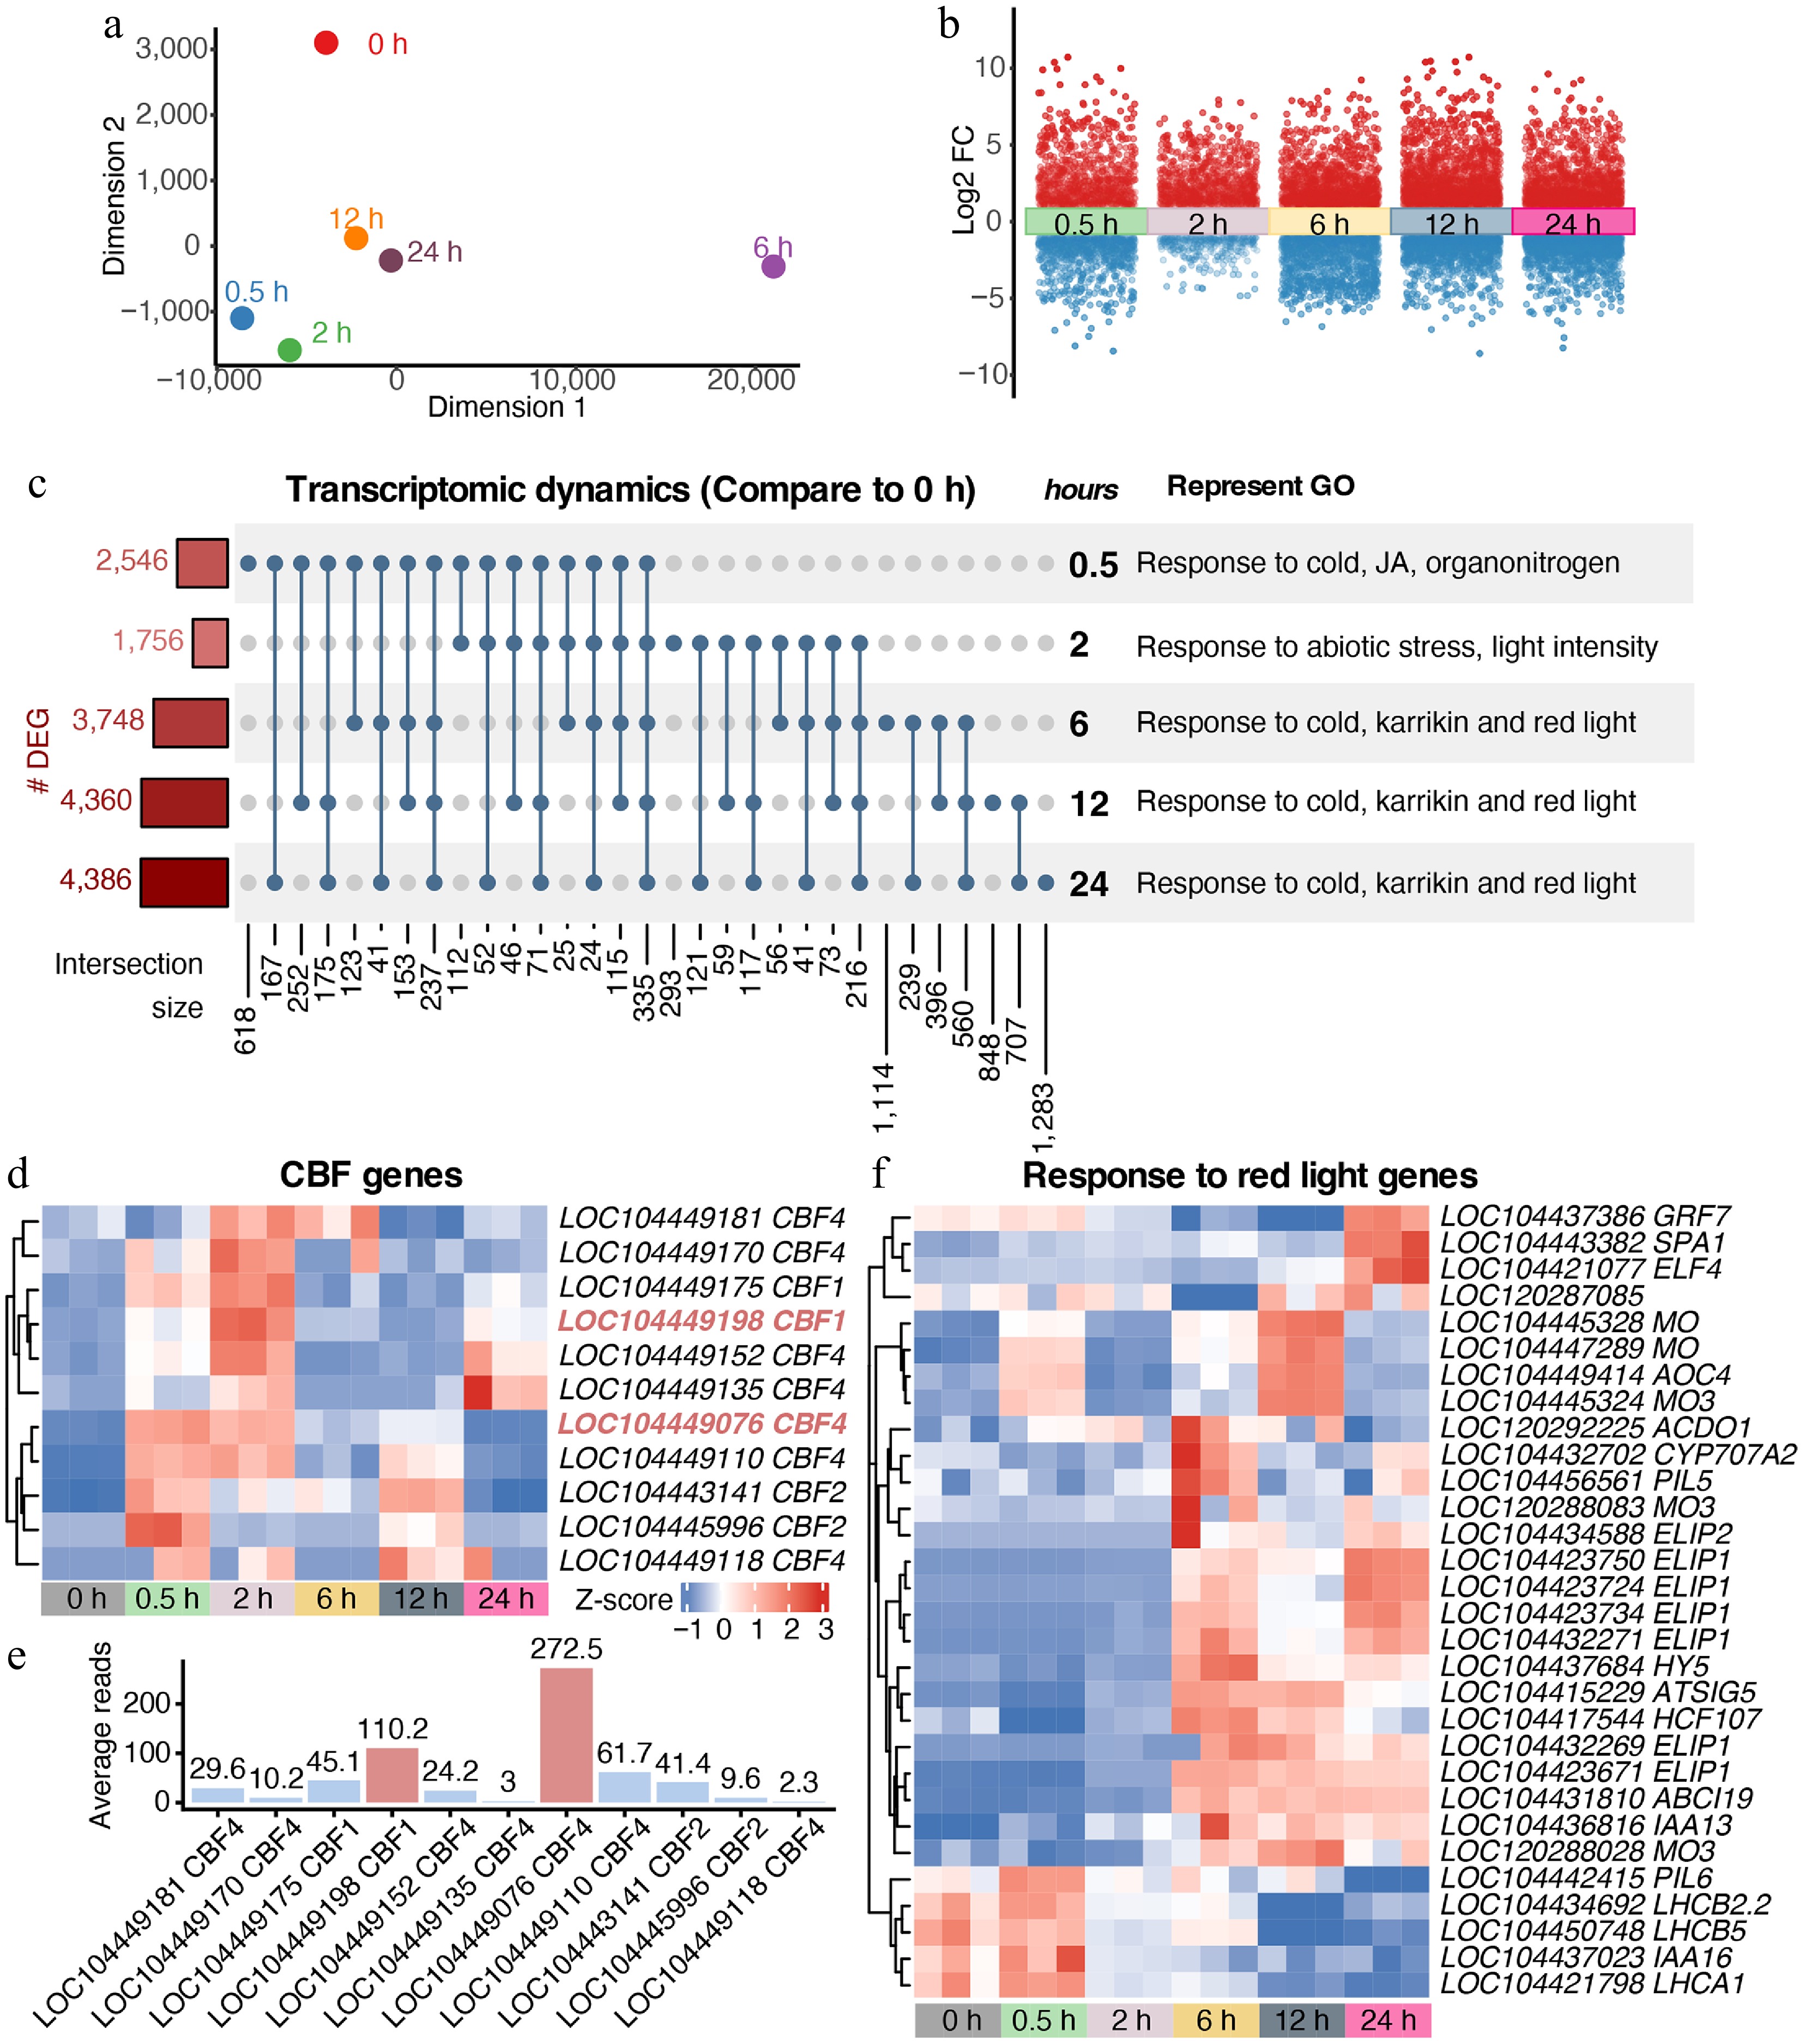
Figure 2.
Rapid transcriptomic reprogramming of E. grandis under cold stress. (a) MDS trajectory of RNA-seq data. (b) Transcriptomic dynamics at different time points under cold stress compared with the 0 h control. (c) Covariation and GO enrichment analysis of differentially expressed genes (DEGs) compared with the 0 h control. (d) and (e) Dynamic expression of putative CBFs in E. grandis. (f) Cold stress reprograms the expression of genes responsive to red light.
-
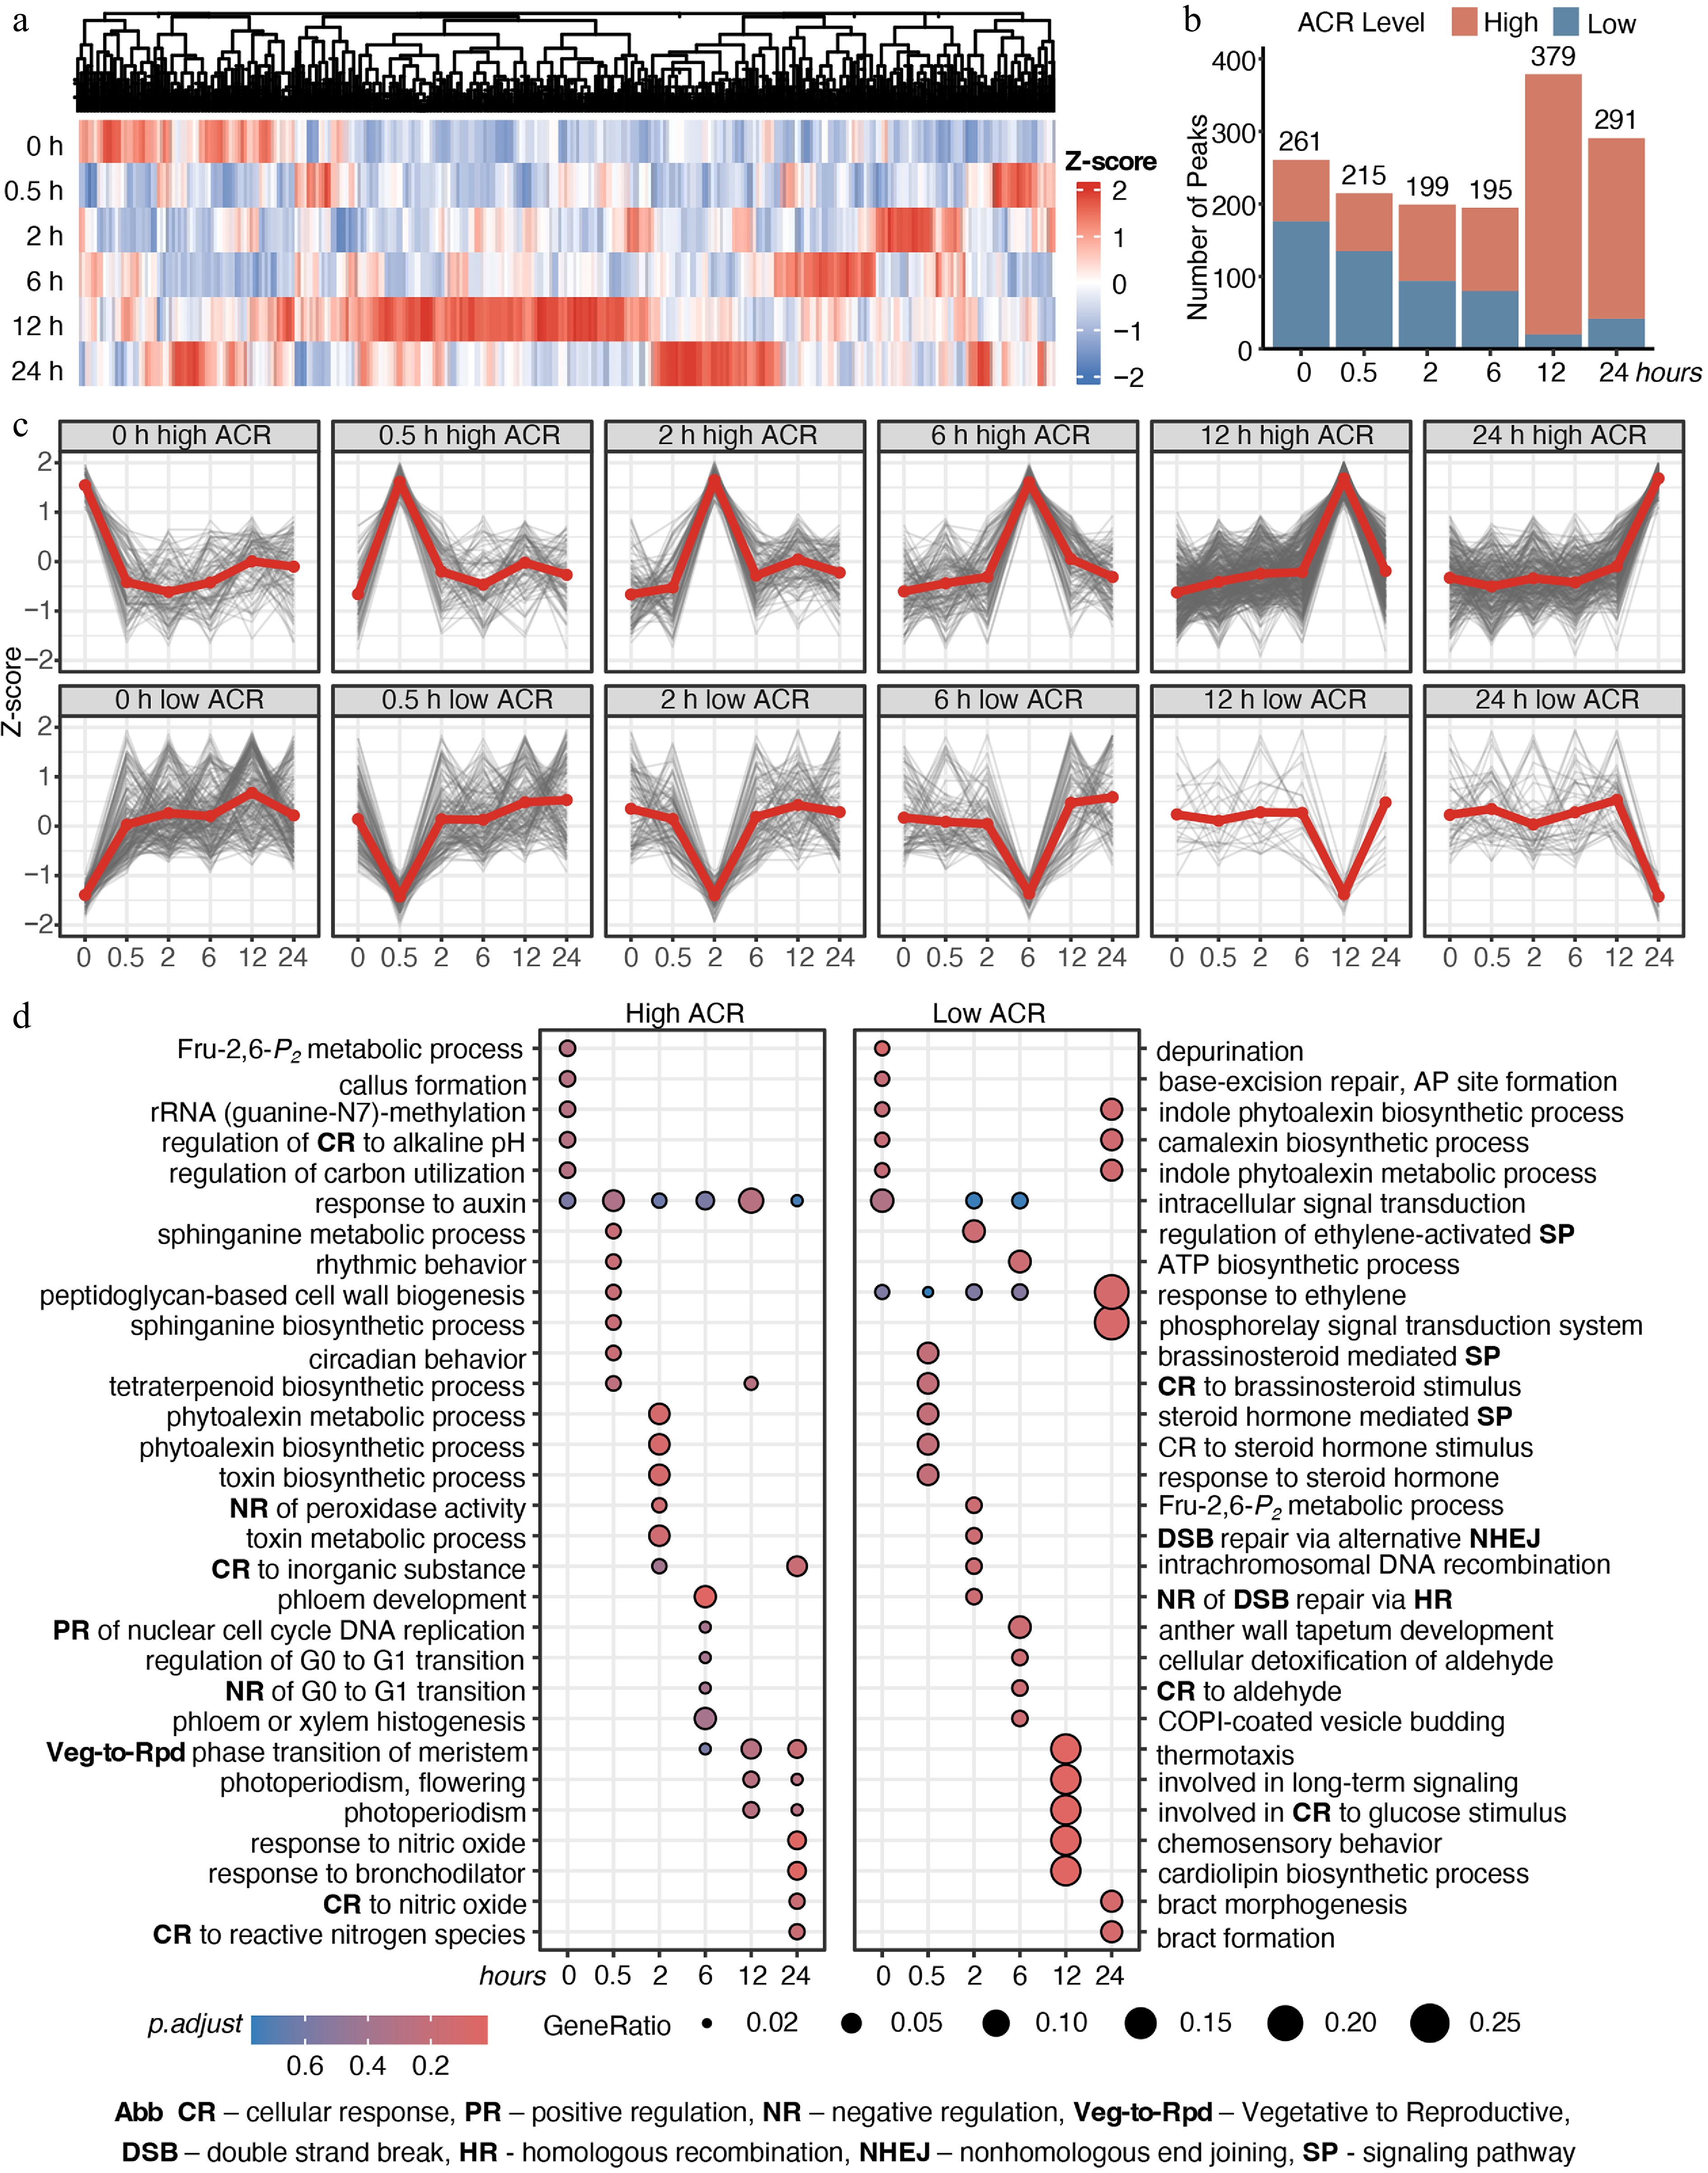
Figure 3.
Time-lapse chromatin accessibility dynamics of E. grandis during cold stress. (a) Time-series significant chromatin accessibility dynamics in the shoot apex. (b) Counts of high- and low-accessibility peaks. (c) Trends of high- and low-accessibility peaks across cold-stress periods. (d) GO enrichment analysis of genes with significant chromatin accessibility peaks. Abbreviations are indicated at the bottom of the figure.
-
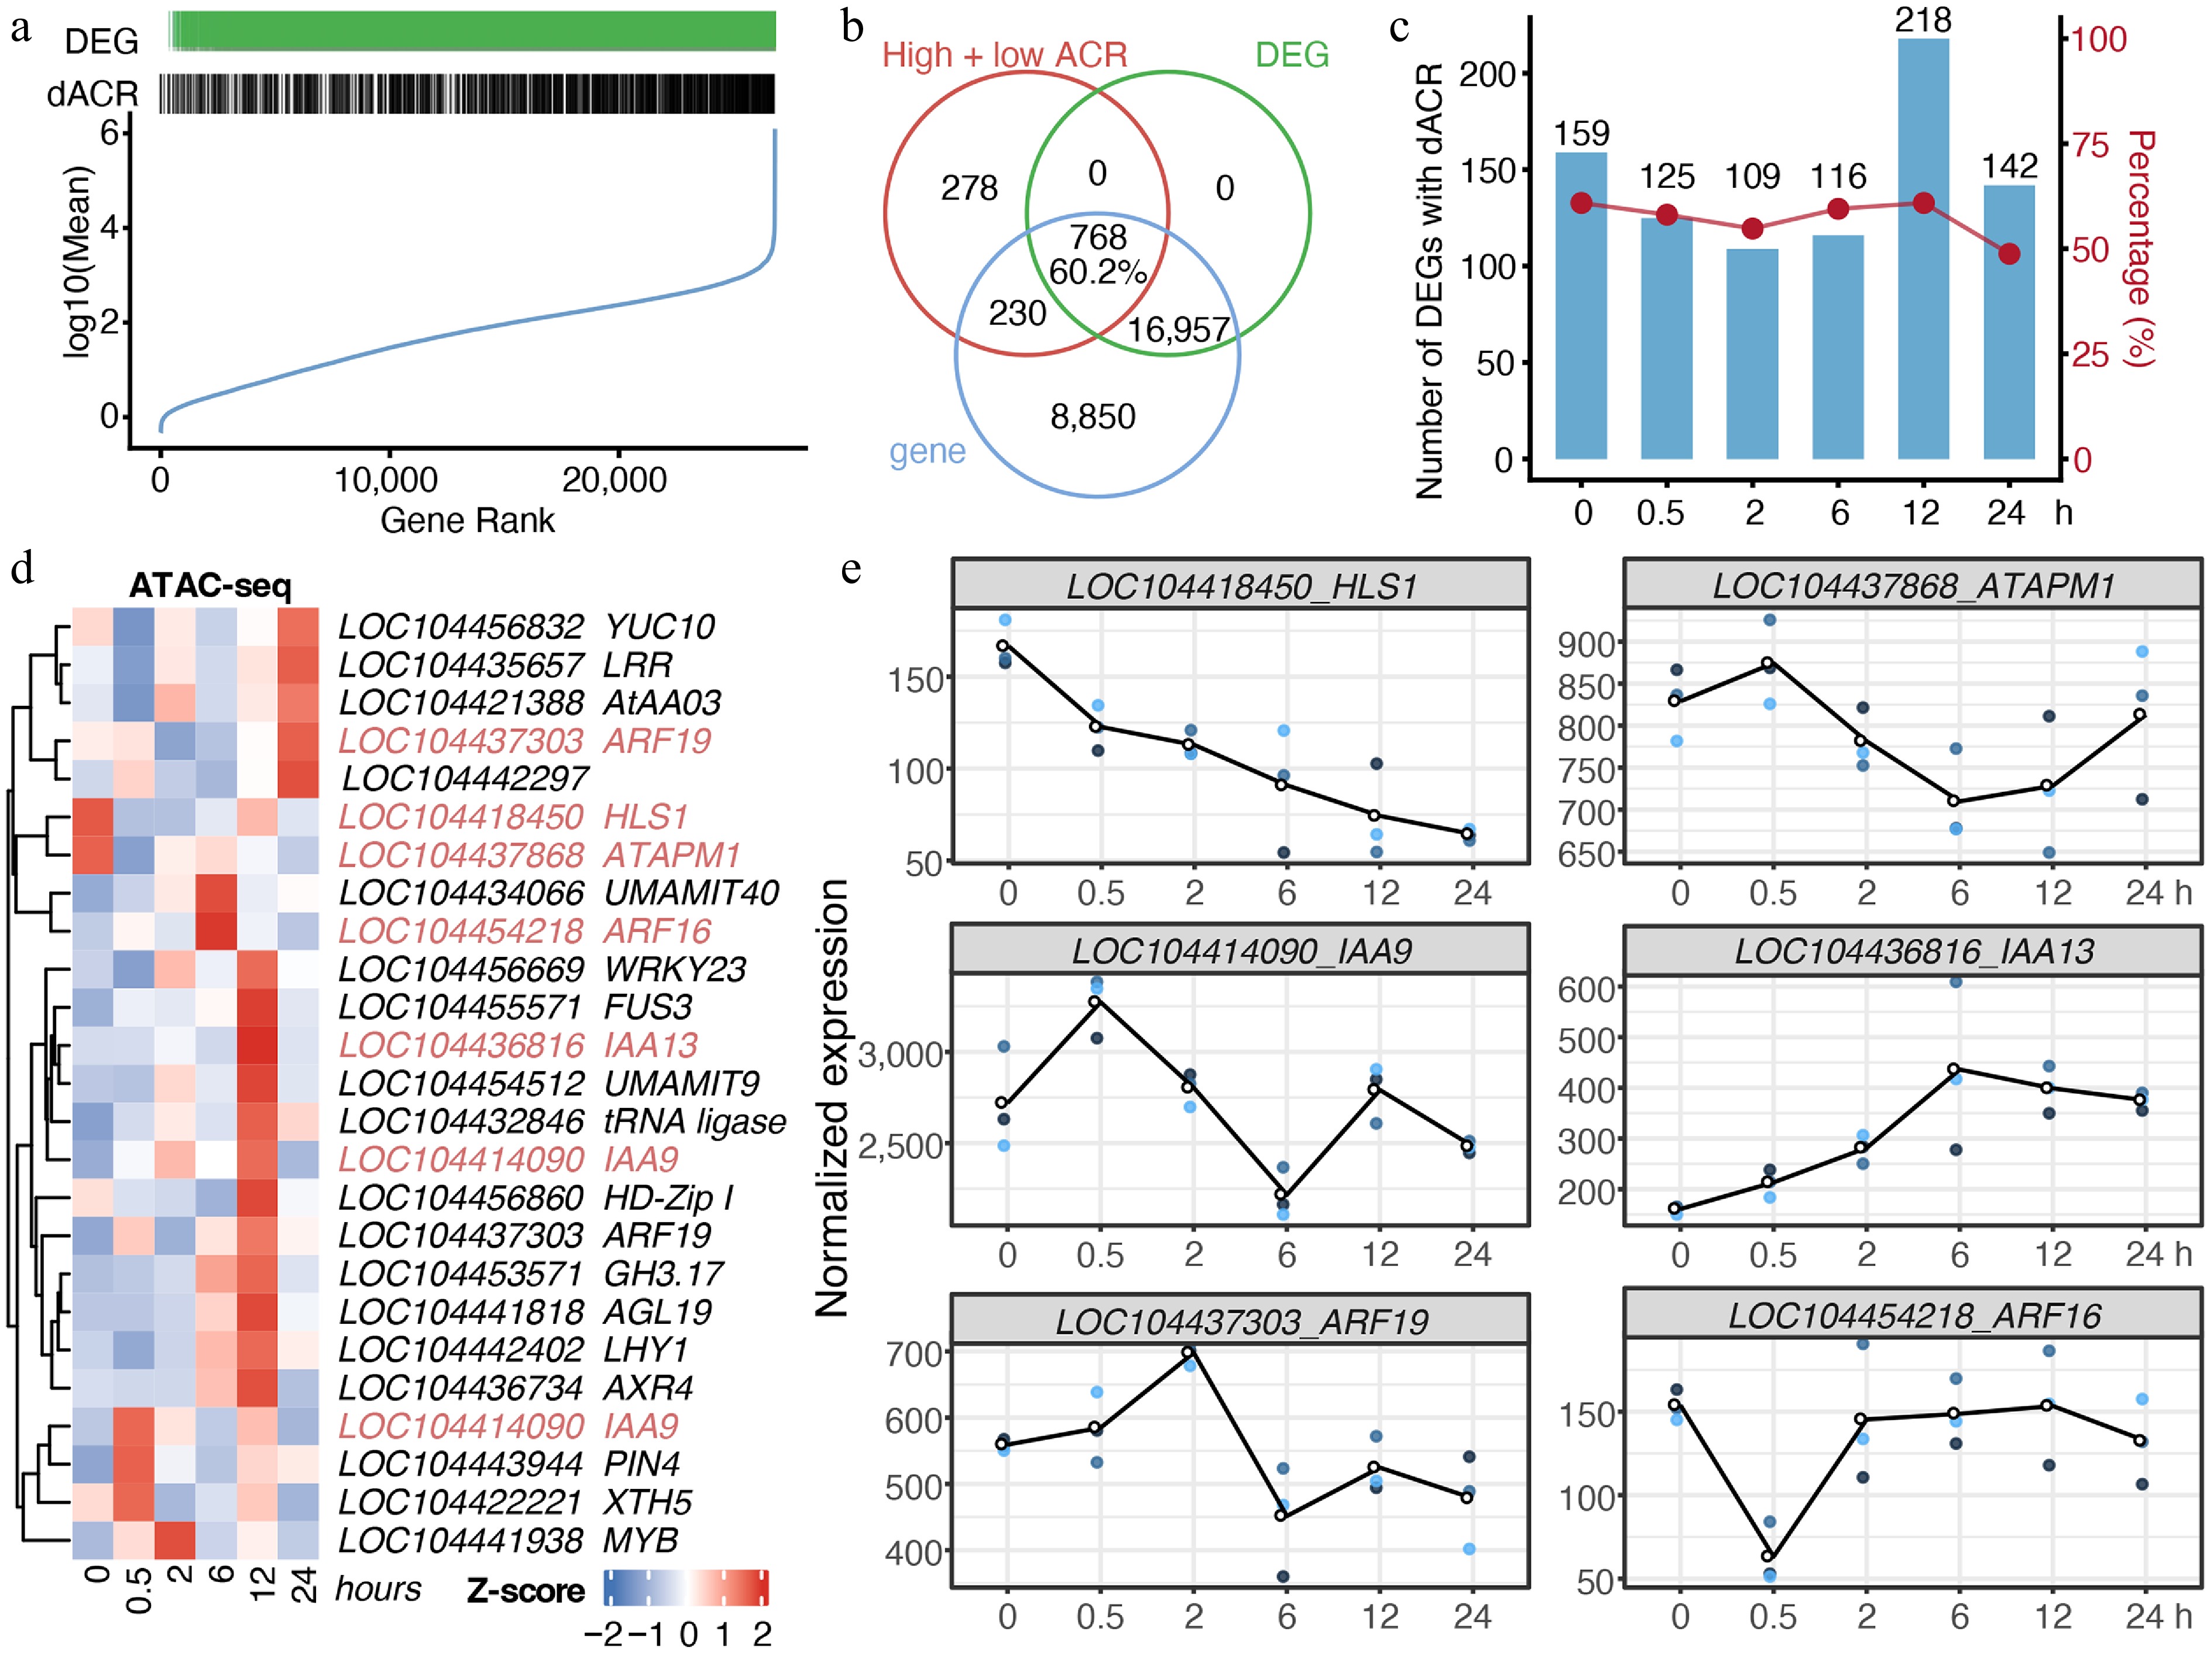
Figure 4.
Chromatin accessibility dynamics under cold stress were associated with transcription. (a) Distribution of genes with differentially chromatin accessible regions (dACRs) and/or differential expression (DEGs). Genes were ranked from low to high average expression. (b) Venn diagram of genes with dACRs, DEGs, and total genes identified in RNA-seq. (c) Counts and proportions of DEGs harboring dACRs. (d) Chromatin accessibility of genes involved in the 'response to auxin' GO term identified in Fig. 3d. Homologs of Arabidopsis genes are indicated after loci IDs. (e) Gene expression dynamics of auxin-responsive genes identified from RNA-seq data. Each time point includes three biological replicates, indicated by dots.
-
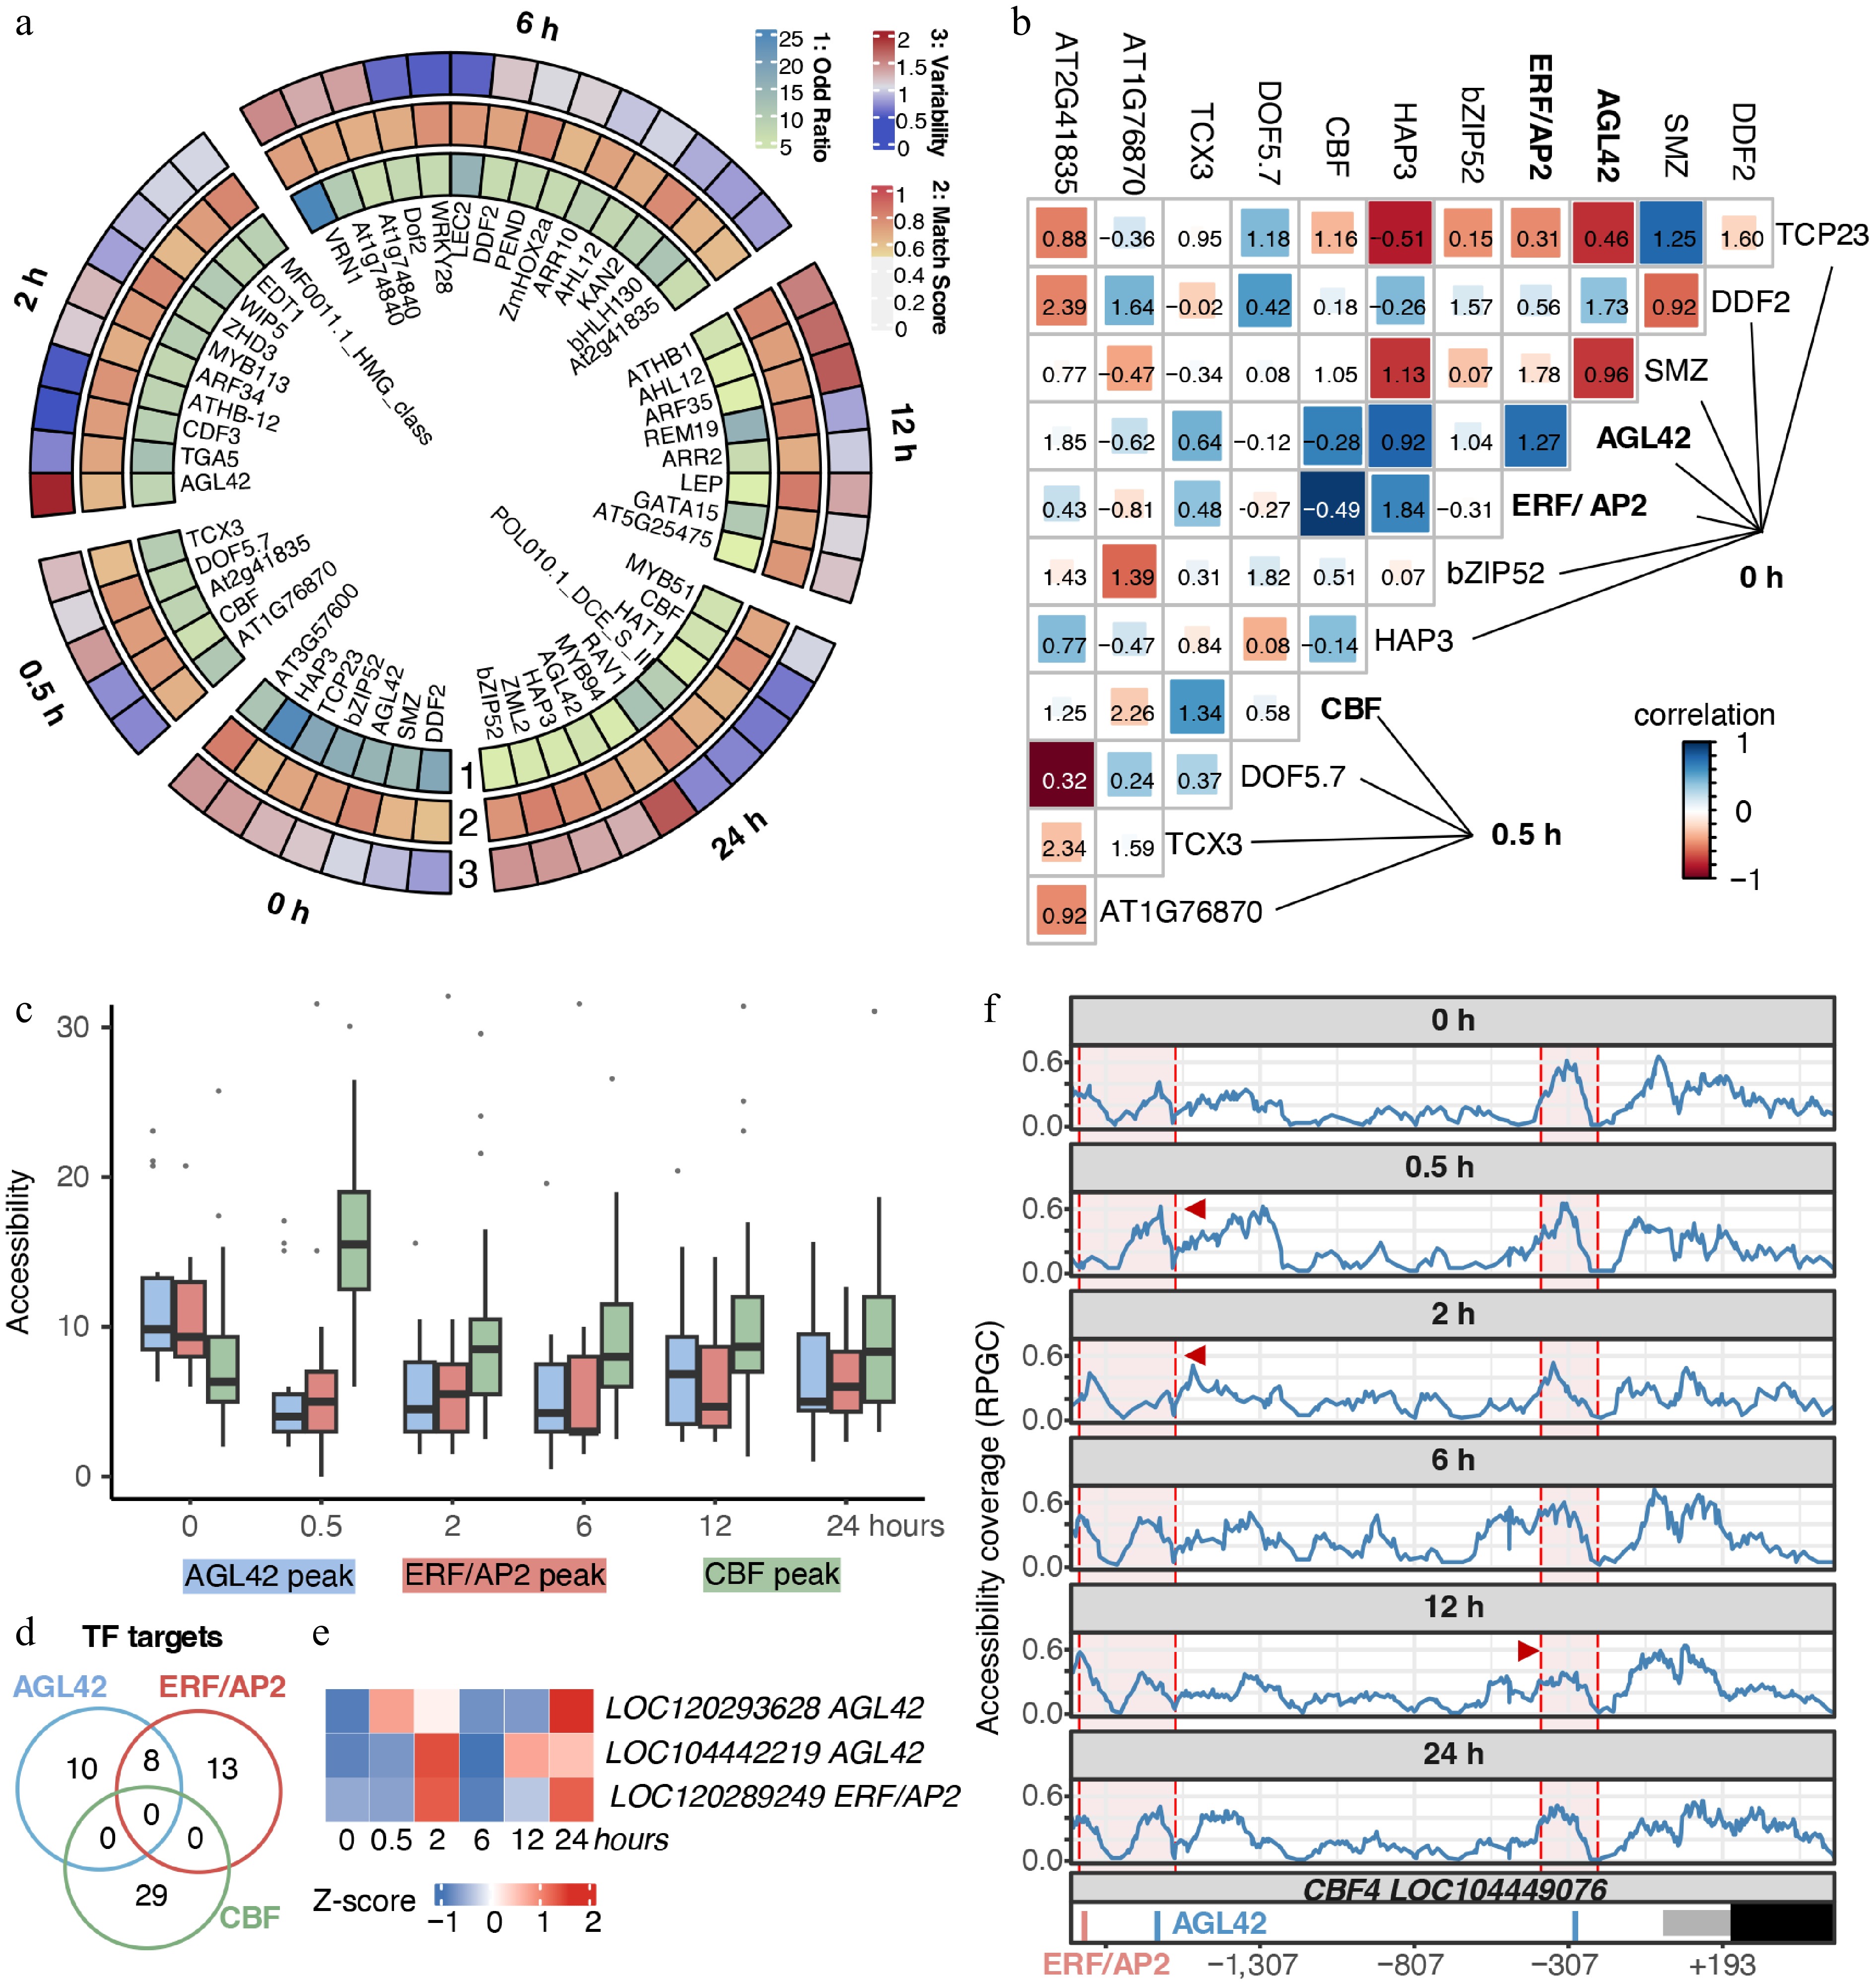
Figure 5.
Chromatin-mediated hierarchical gene regulatory networks of E. grandis during cold stress. (a) Motifs were identified using the Homer suite. Only motifs with p-values higher than the threshold for potential false positives were retained. The Odd ratio was calculated as the percentage of motif-containing targets, divided by the corresponding percentage in the background. Match scores were obtained by comparison with the best-matched transcription factor motifs. Motif variability was calculated using chromVar to reflect motif specificity in the corresponding samples. (b) Chromatin co-accessibility and co-localization analyses between putative TF pairs. Color indicates the correlation coefficient, representing chromatin co-accessibility of TF target regions. Numbers in the figure indicate co-binding scores of putative TFs. (c) Chromatin accessibility level of regions targeted by AGL42-, ERF/AP2-, and CBF-like TFs. (d) Venn diagram of potential target genes of AGL42-, ERF/AP2-, and CBF-like TFs. (e) Time-course gene expression of candidate AGL42 and ERF/AP2 genes. (f) Chromatin accessibility and TF binding sites in the putative CBF4 promoter. Regions enclosed by red shading indicate the vicinity of AGL42 and ERF/AP2 target sites, and positions indicated by red arrows represent regions with significant coverage changes.
-
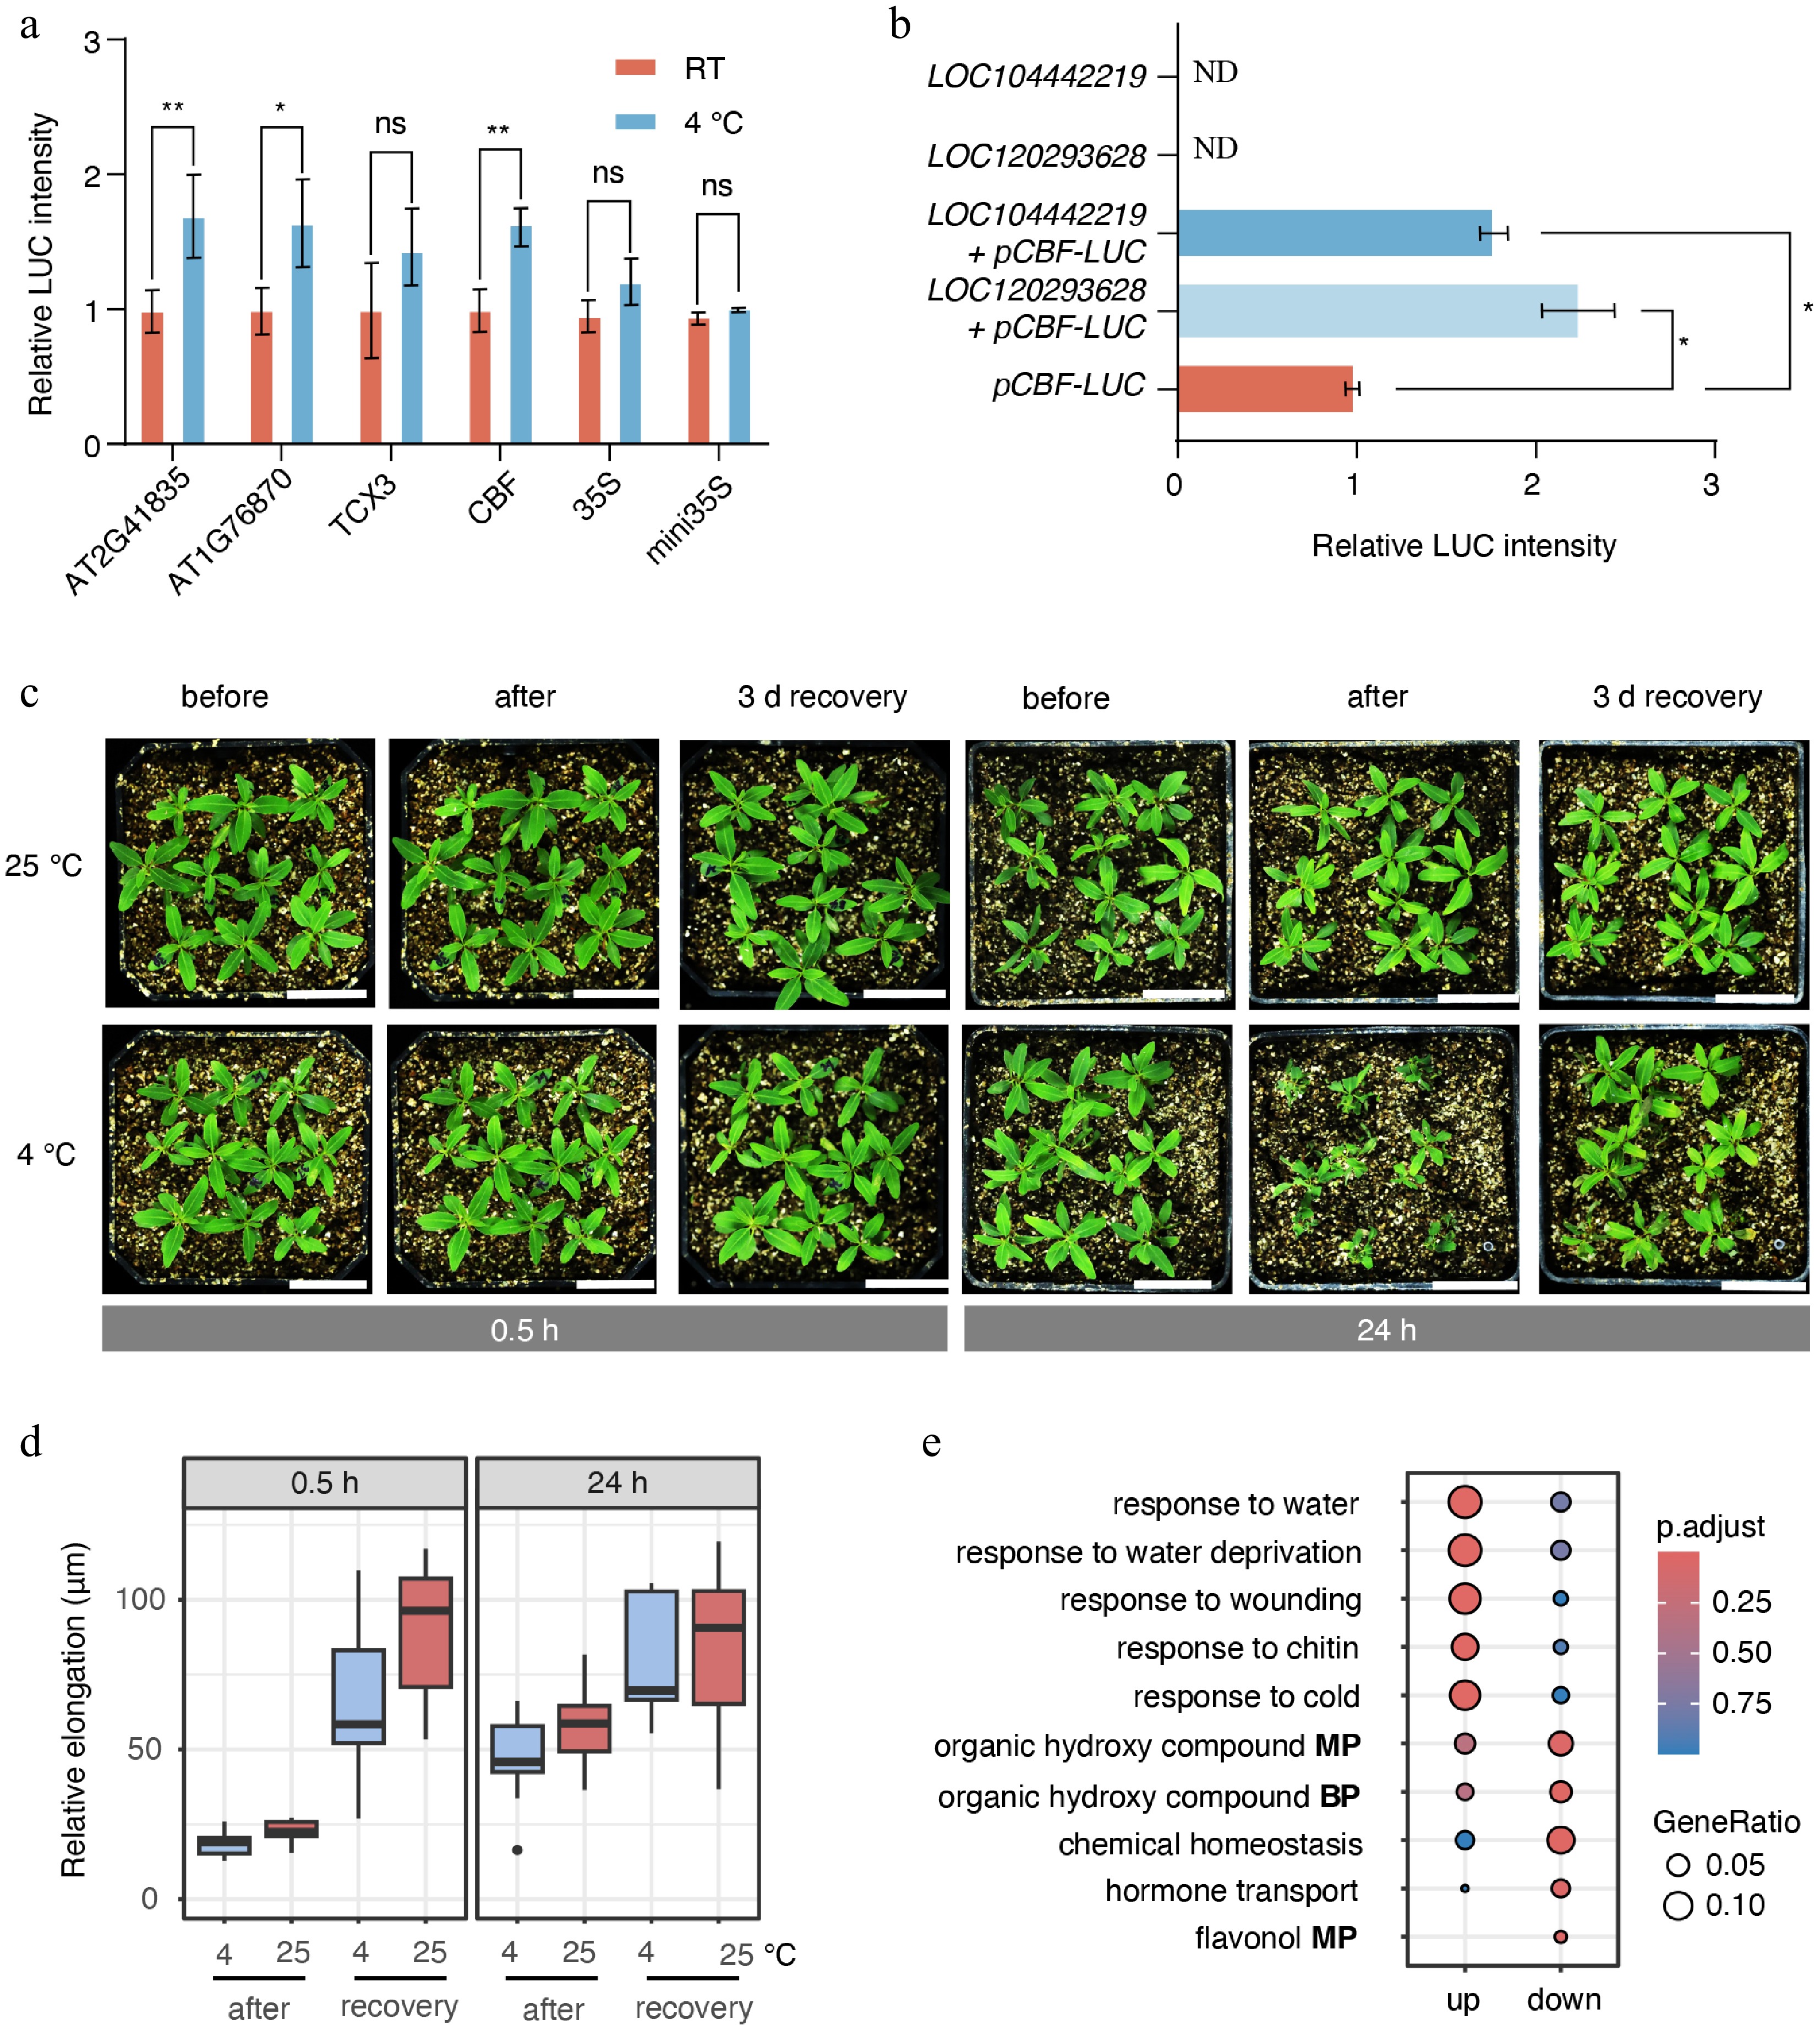
Figure 6.
Cold stress inhibited shoot apex growth. (a) Dual-luciferase assays were used to measure the activity of motifs identified from ATAC-seq data under 0.5 h cold-stress conditions. RT indicates room-temperature control. Statistical significance was evaluated using analysis of variance (ANOVA). p < 0.05 and p < 0.01 are indicated by * and **, respectively. (b) Interaction between the putative transcription factor AGL42 and the promoter of the putative CBF4 gene (LOC104449076). 'ND' indicates not detected. (c) Growth of E. grandis seedlings before cold stress, after cold stress, and after 3 d of recovery. Bar = 3 cm. (d) Relative elongation length after treatment and/or recovery compared with the pre-treatment status. (e) GO enrichment analysis of differentially expressed genes between the 0.5 h stress group, and the 0 h control group. BP indicates 'biological process'; MP indicates 'metabolic process'.
-
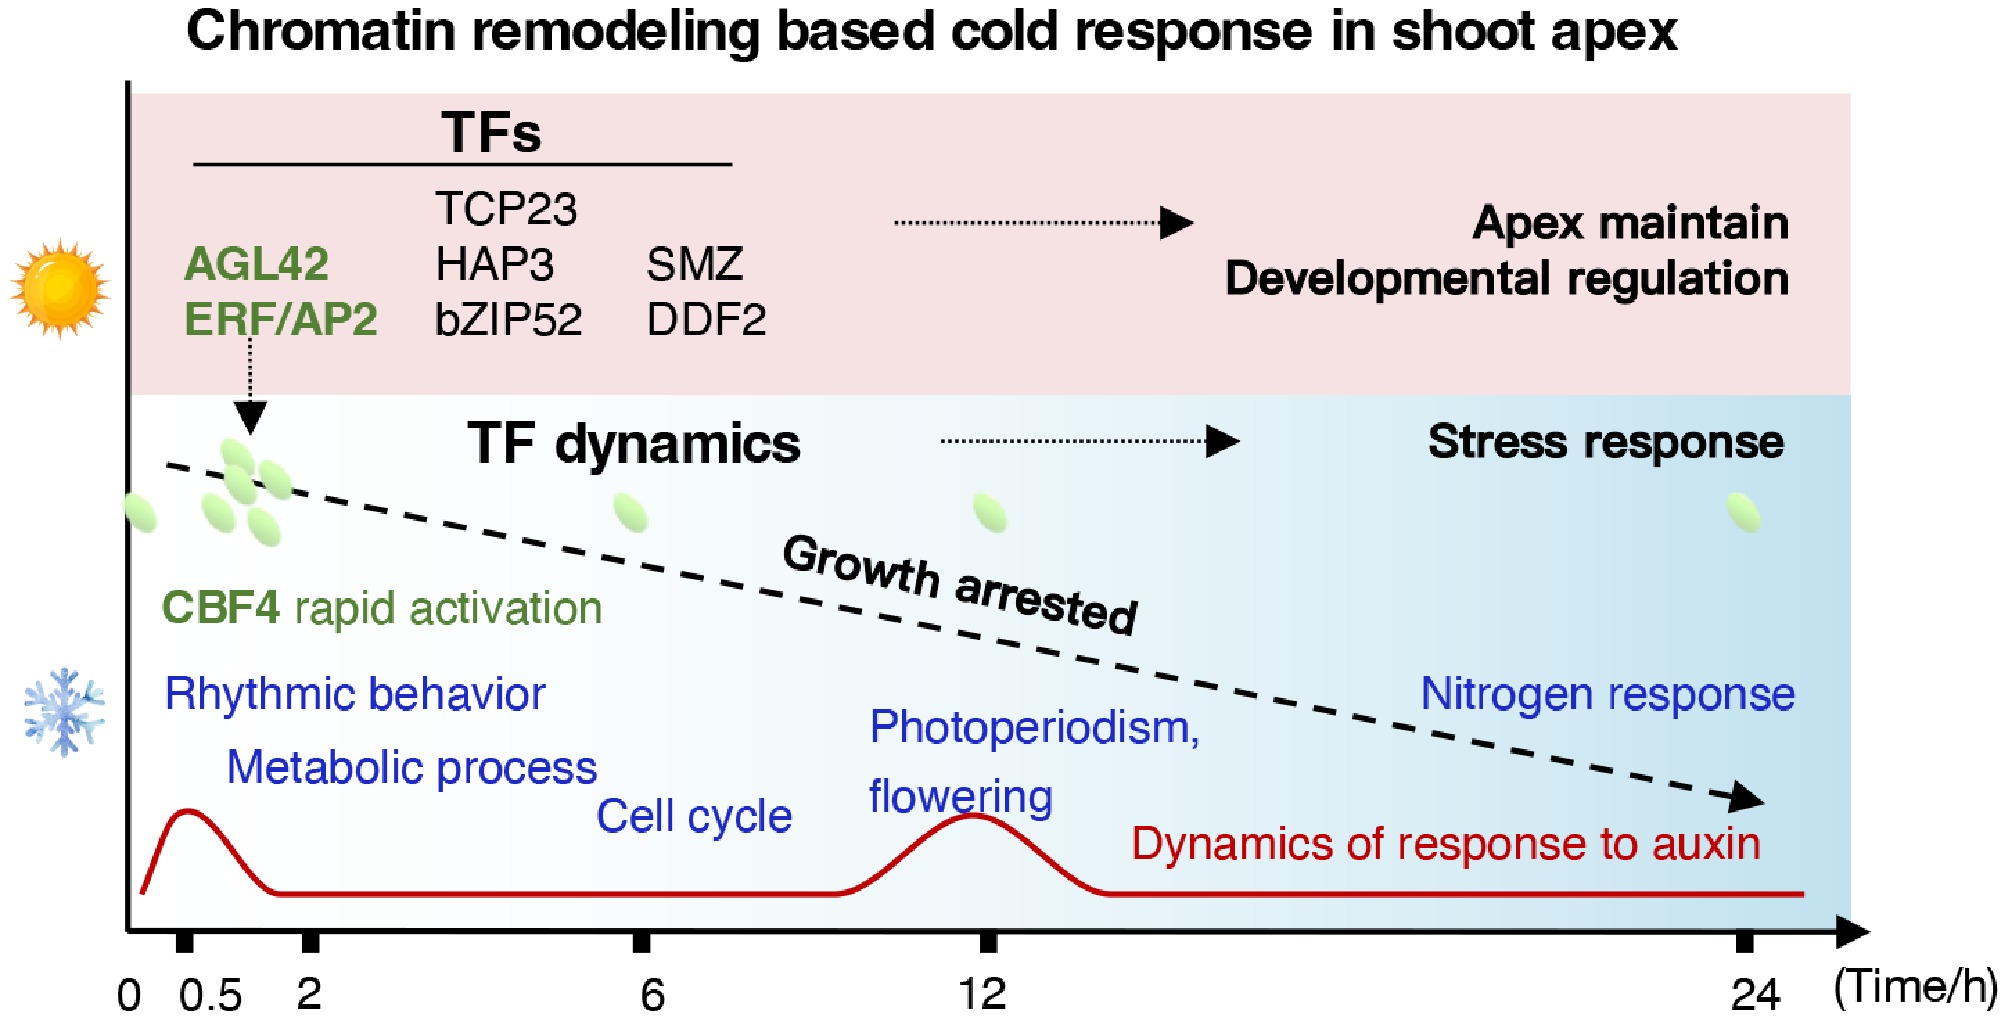
Figure 7.
Temporal hierarchy of chromatin accessibility and transcriptional regulation in E. grandis in response to cold stress.
Figures
(7)
Tables
(0)