-
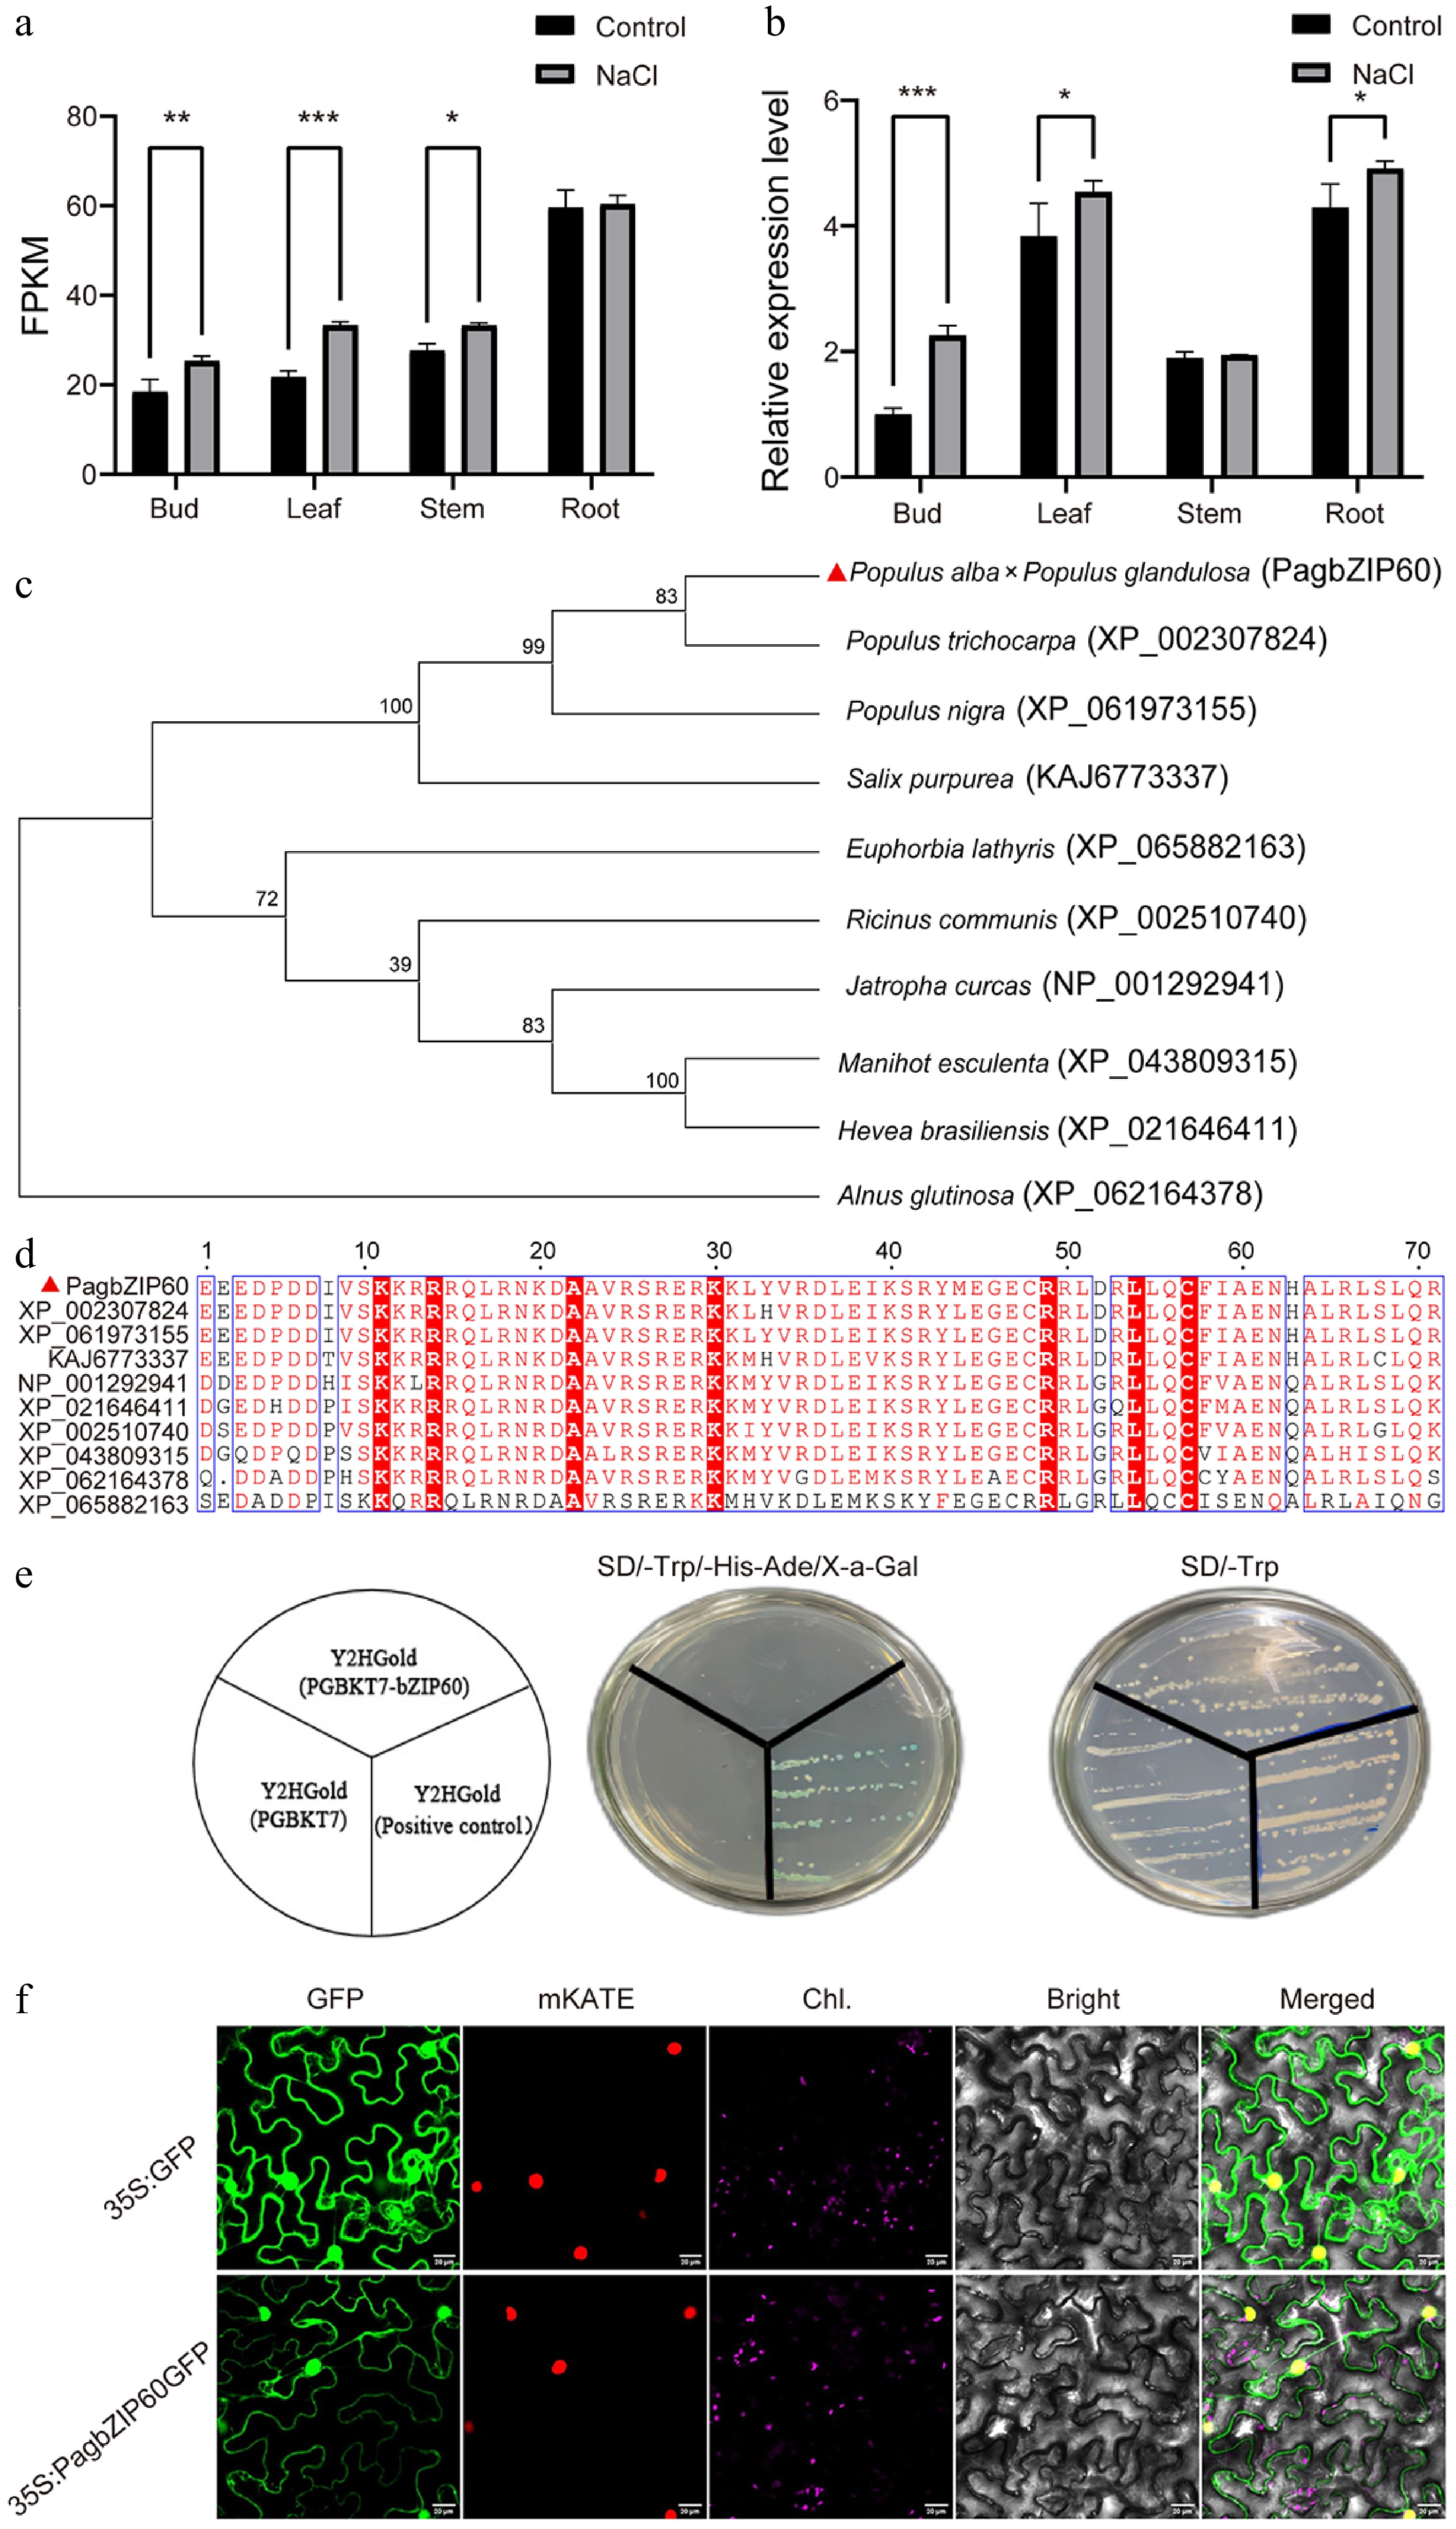
Figure 1.
Gene expression and protein characterization of PagbZIP60. (a) Expression pattern of PagbZIP60 in different tissues of poplar under 150 mM NaCl, detected by RNA-seq. The stars indicate significant differences between samples, * p < 0.05, ** p < 0.01, *** p < 0.001. (b) Expression pattern of PagbZIP60 in different tissues of poplar under 150 mM NaCl, detected by RT-qPCR. (c) Phylogenetic tree of PagbZIP60 and representative plant bZIP proteins. (d) Multiple alignment of the bZIP conserved domain in PagbZIP60. (e) Transactivation assay of PagbZIP60 in yeast cells. (f) Subcellular localization of PagbZIP60 protein in tobacco leaves. GFP: green fluorescence; mKATE: nucleus marker; Chl.: chloroplast marker; Bright: bright field; Merged: merged field; Bar: 20 μm.
-
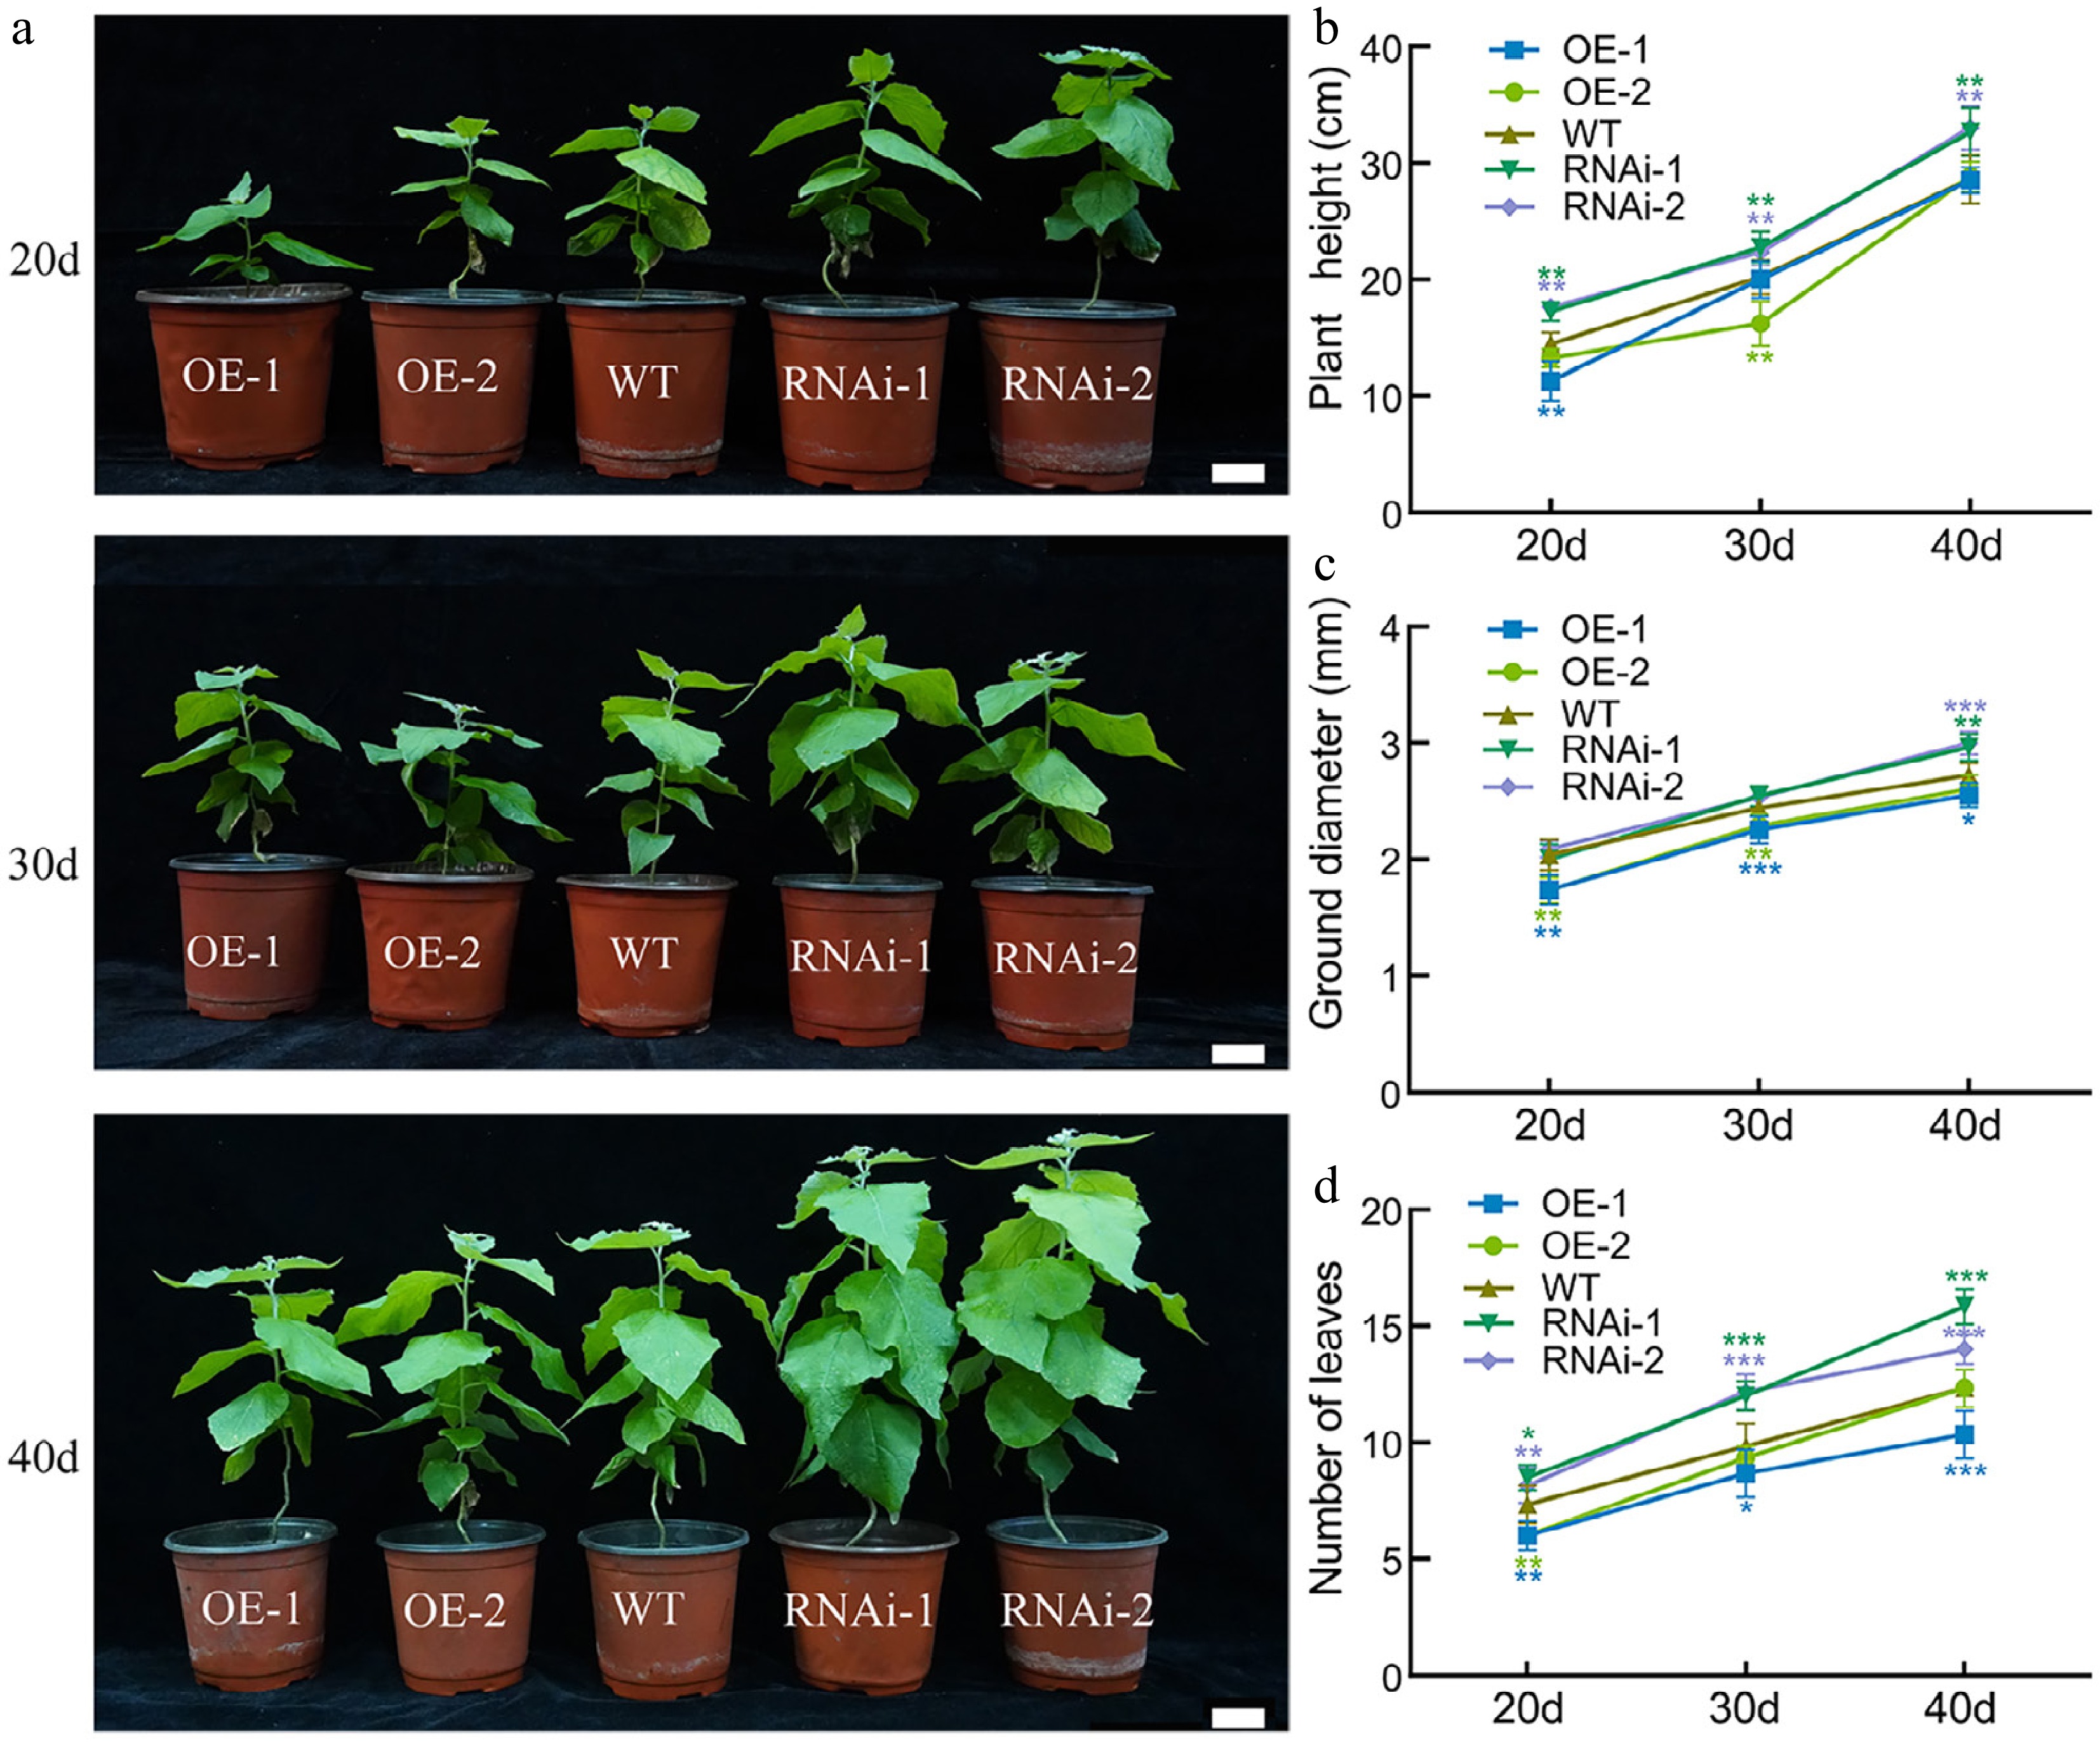
Figure 2.
The growth status of PagbZIP60 transgenic poplar under normal conditions. (a) The growth status of PagbZIP60 transgenic poplar under normal conditions. (b) Plant height, (c) ground diameter, and (d) number of leaves of PagbZIP60 transgenic poplar at different developmental stages. The stars indicate significant differences between PagbZIP60 transgenic poplar and non-transgenic poplar at the same developmental stage (p < 0.05), * p < 0.05, * m p < 0.01, *** p < 0.001. The plot represents the mean ± SD (n = 6). OE: PagbZIP60 overexpression lines, RNAi: PagbZIP60 suppression lines, WT: non-transgenic poplar. Scale bars, 1 cm.
-
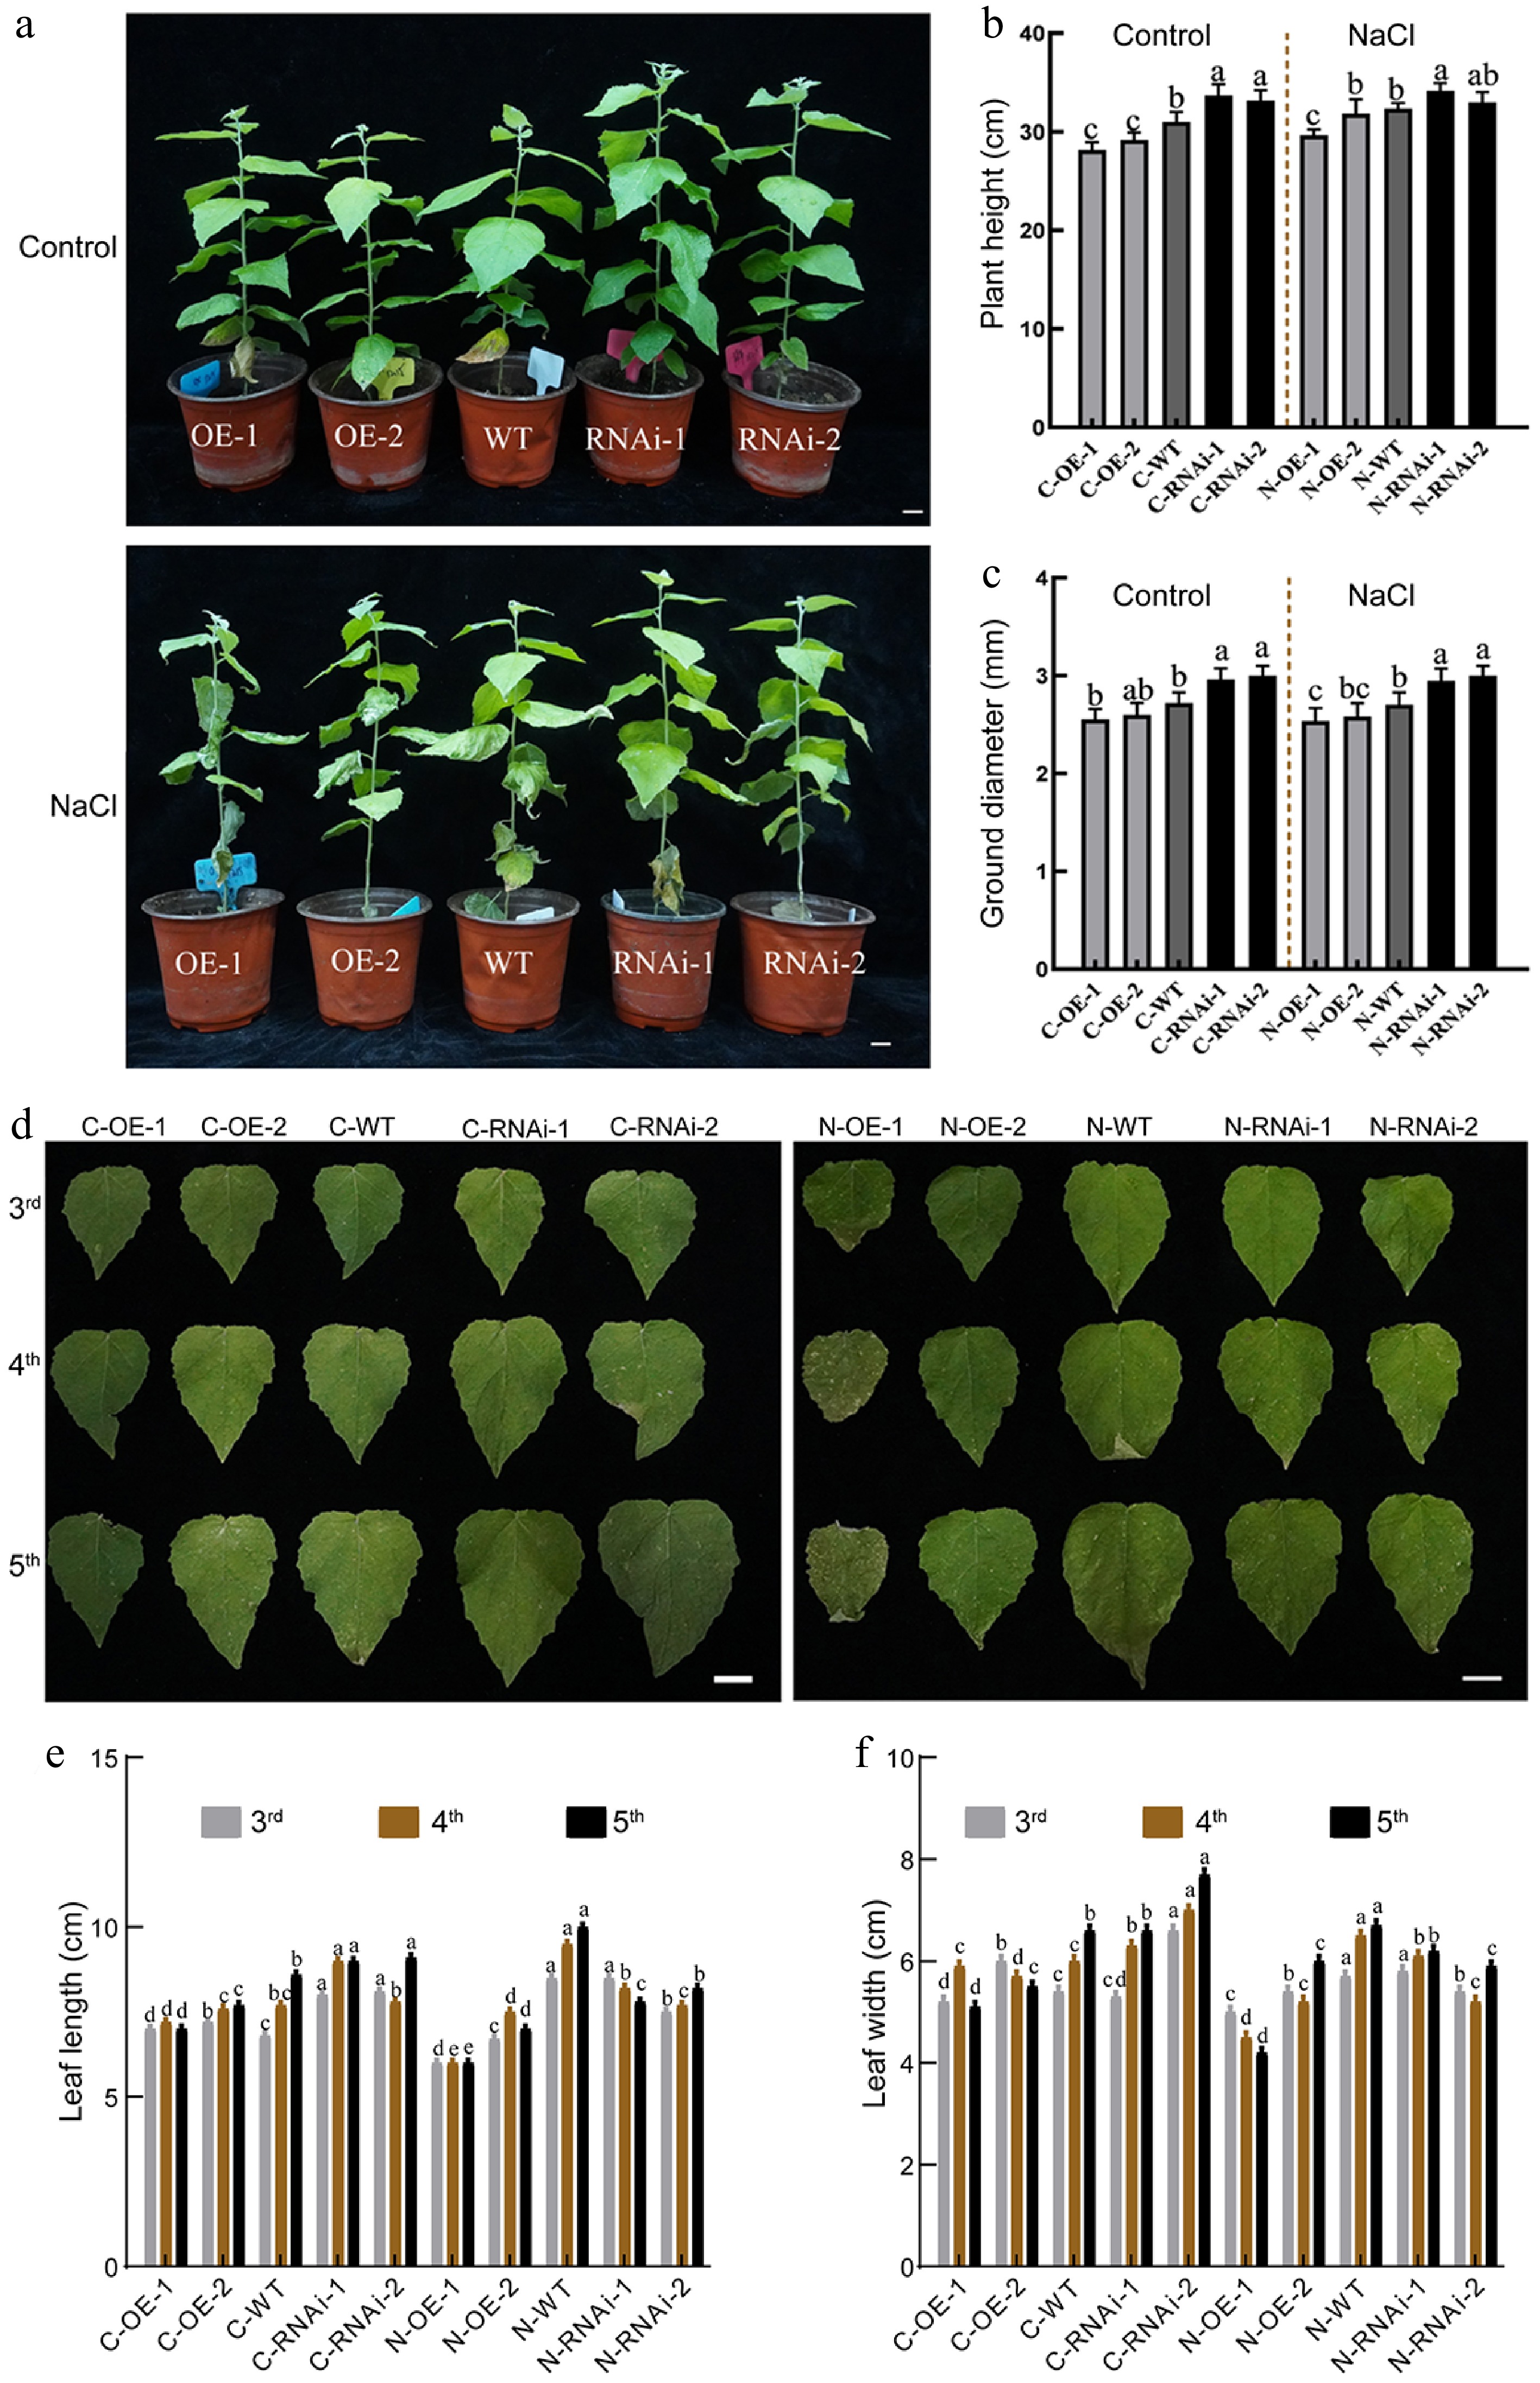
Figure 3.
The growth status of PagbZIP60 transgenic poplar under salt stress (150 mM NaCl) conditions. (a) The growth status of PagbZIP60 transgenic poplar. (b) Plant height, and (c) ground diameter of PagbZIP60 transgenic poplar. (d) The status of mature functional leaves of PagbZIP60 transgenic poplar. (e) Leaf length, and (f) leaf width of PagbZIP60 transgenic poplar. The different lowercase letters indicate significant differences among samples (p < 0.05). The plot represents the mean ± SD (n = 6). OE: PagbZIP60 overexpression lines, RNAi: PagbZIP60 suppression lines, WT: non-transgenic poplar, C: normal control growth condition, N: salt stress with NaCl condition. C-OE-1 represents overexpression line 1 under normal conditions; N-OE-1 represents the same line under salt stress. The same nomenclature applies to other abbreviations. Bars: 1 cm.
-
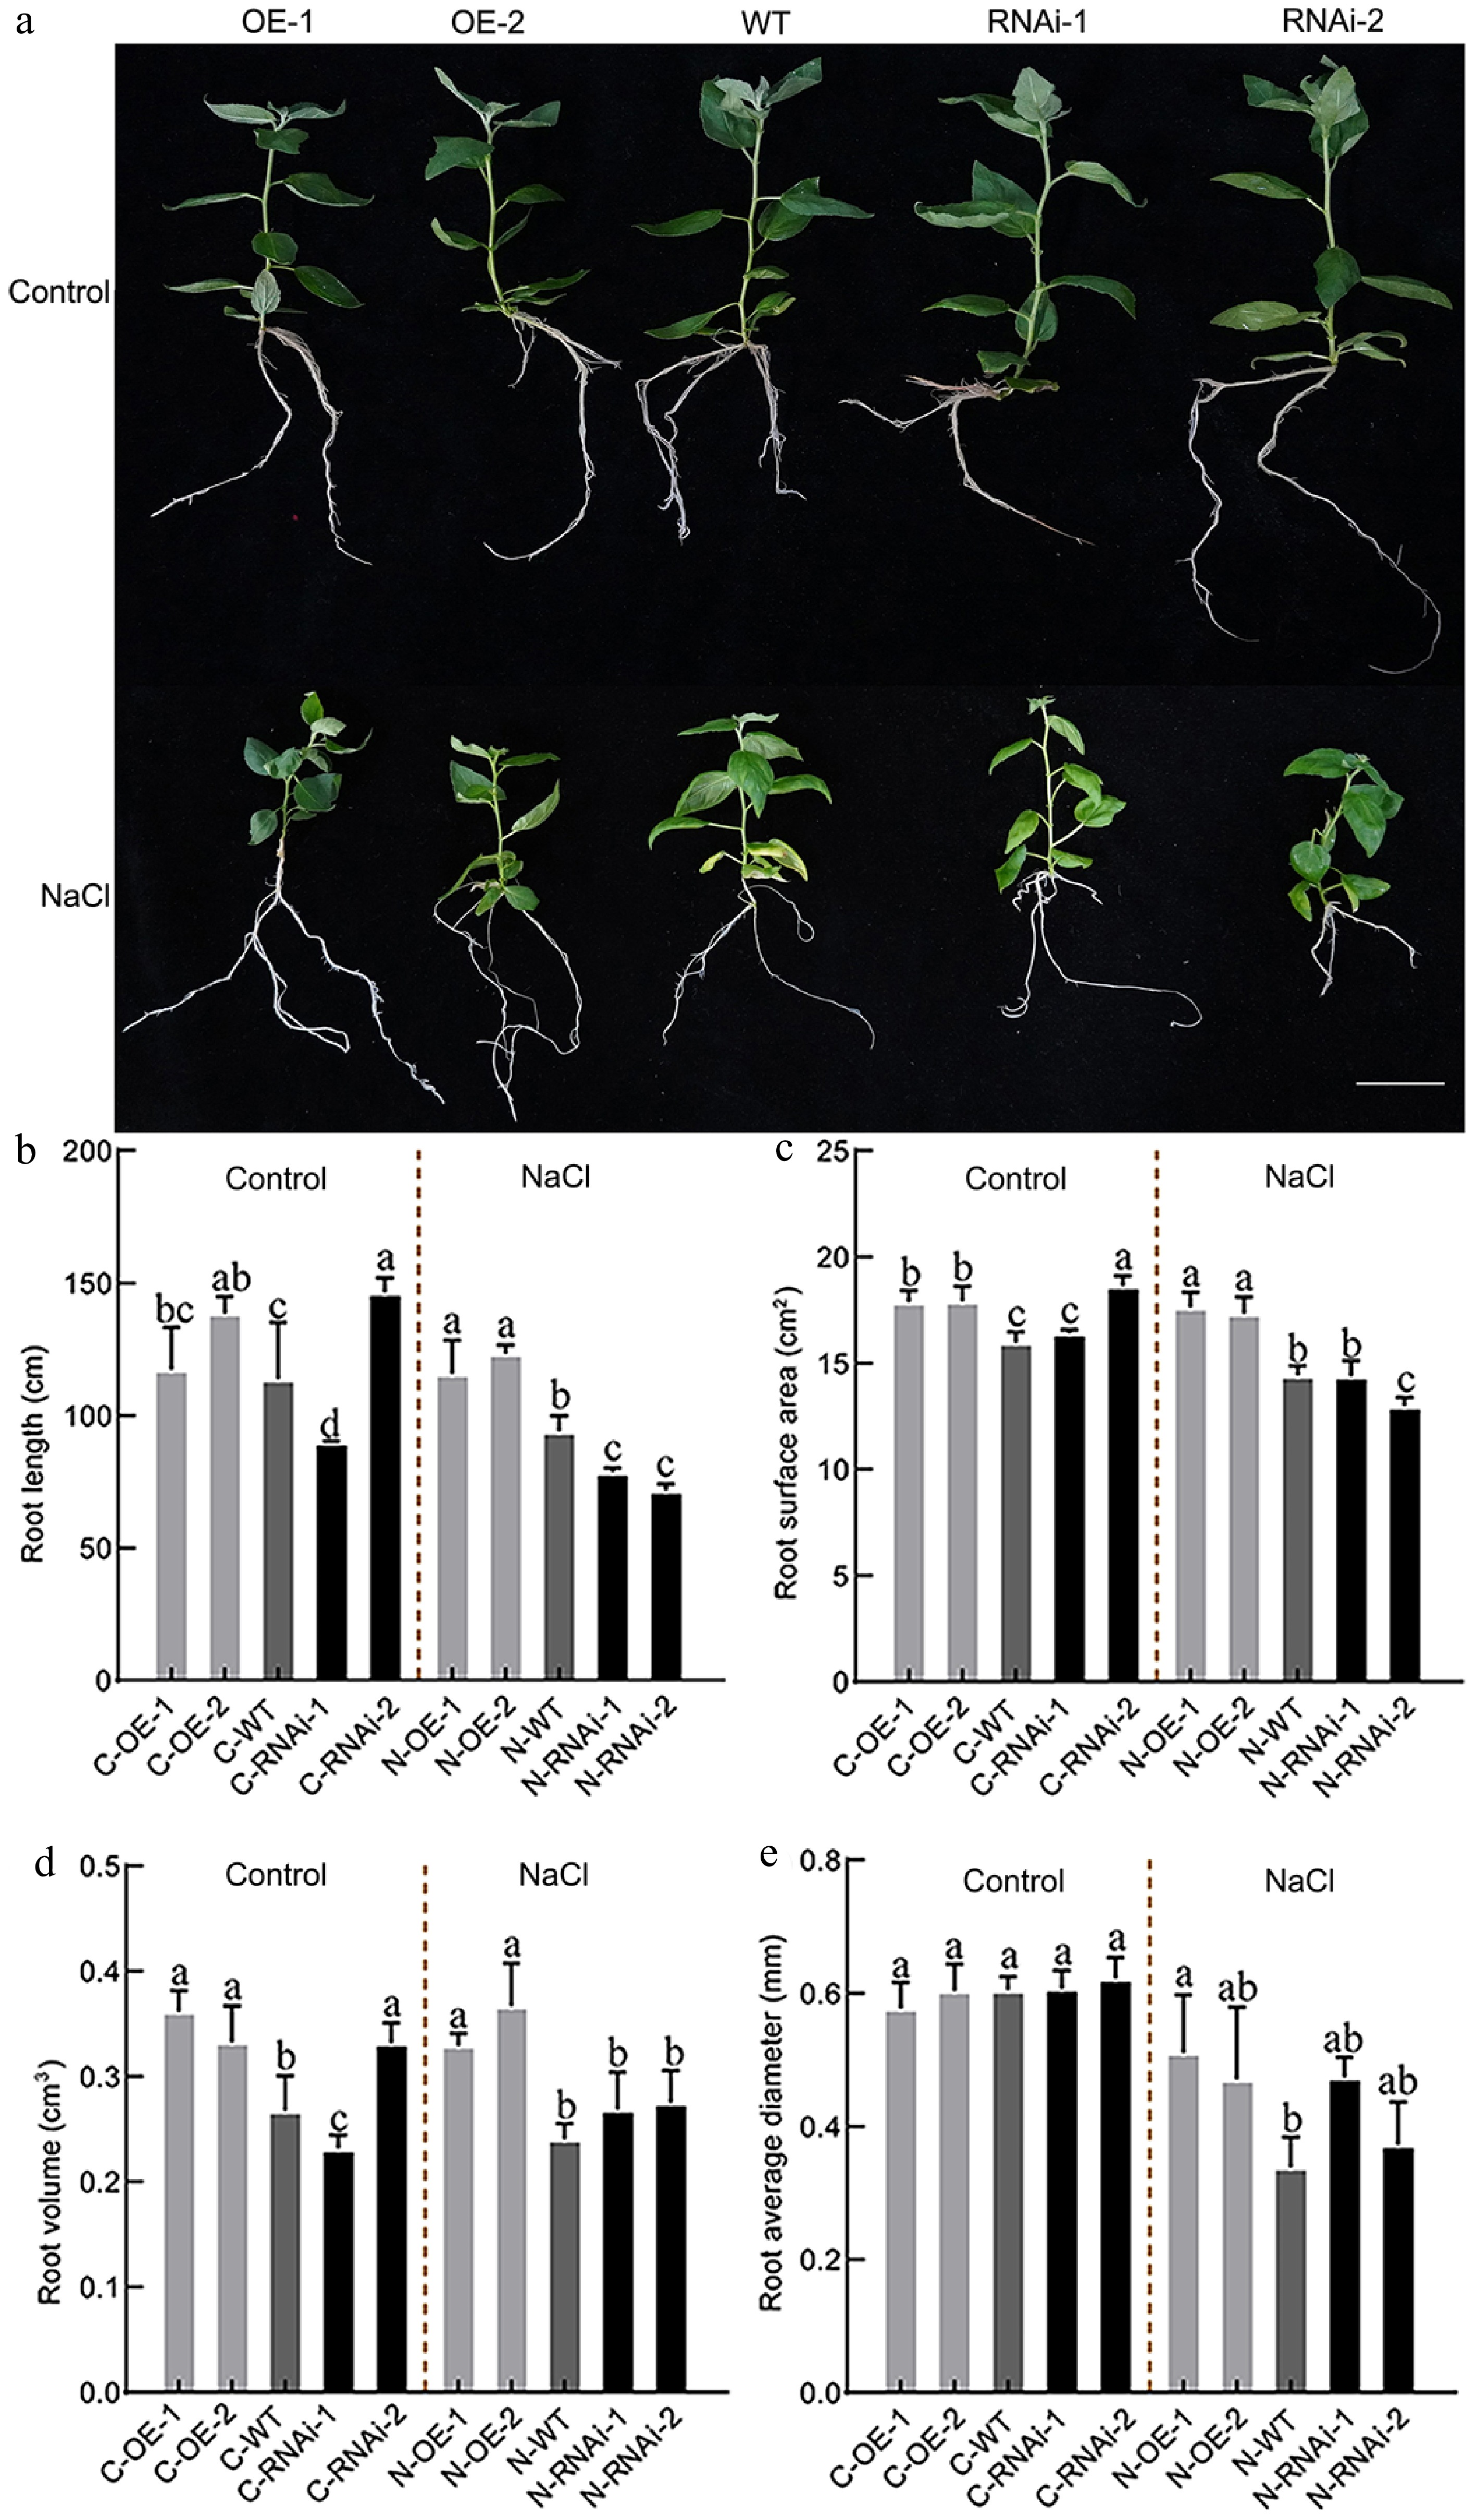
Figure 4.
Root system phenotype analysis of PagbZIP60 transgenic poplar under salt stress. (a) The root status of PagbZIP60 transgenic poplar grown in the 1/2 MS medium containing 50 mM NaCl for 30 d. (b) Total root length, (c) root surface area, (d) root volume, and (e) average diameter of PagbZIP60 transgenic poplar in the 1/2 MS media containing 50 mM NaCl for 30 d. The different lowercase letters indicate significant differences among samples (p < 0.05). The plot represents the mean ± SD (n = 6). OE: PagbZIP60 overexpression lines, RNAi: PagbZIP60 suppression lines, WT: non-transgenic poplar, C: normal control growth condition, N: salt stress with NaCl condition. C-OE-1 represents overexpression line 1 under normal conditions; N-OE-1 represents the same line under salt stress. The same nomenclature applies to other abbreviations. Bars: 1 cm.
-
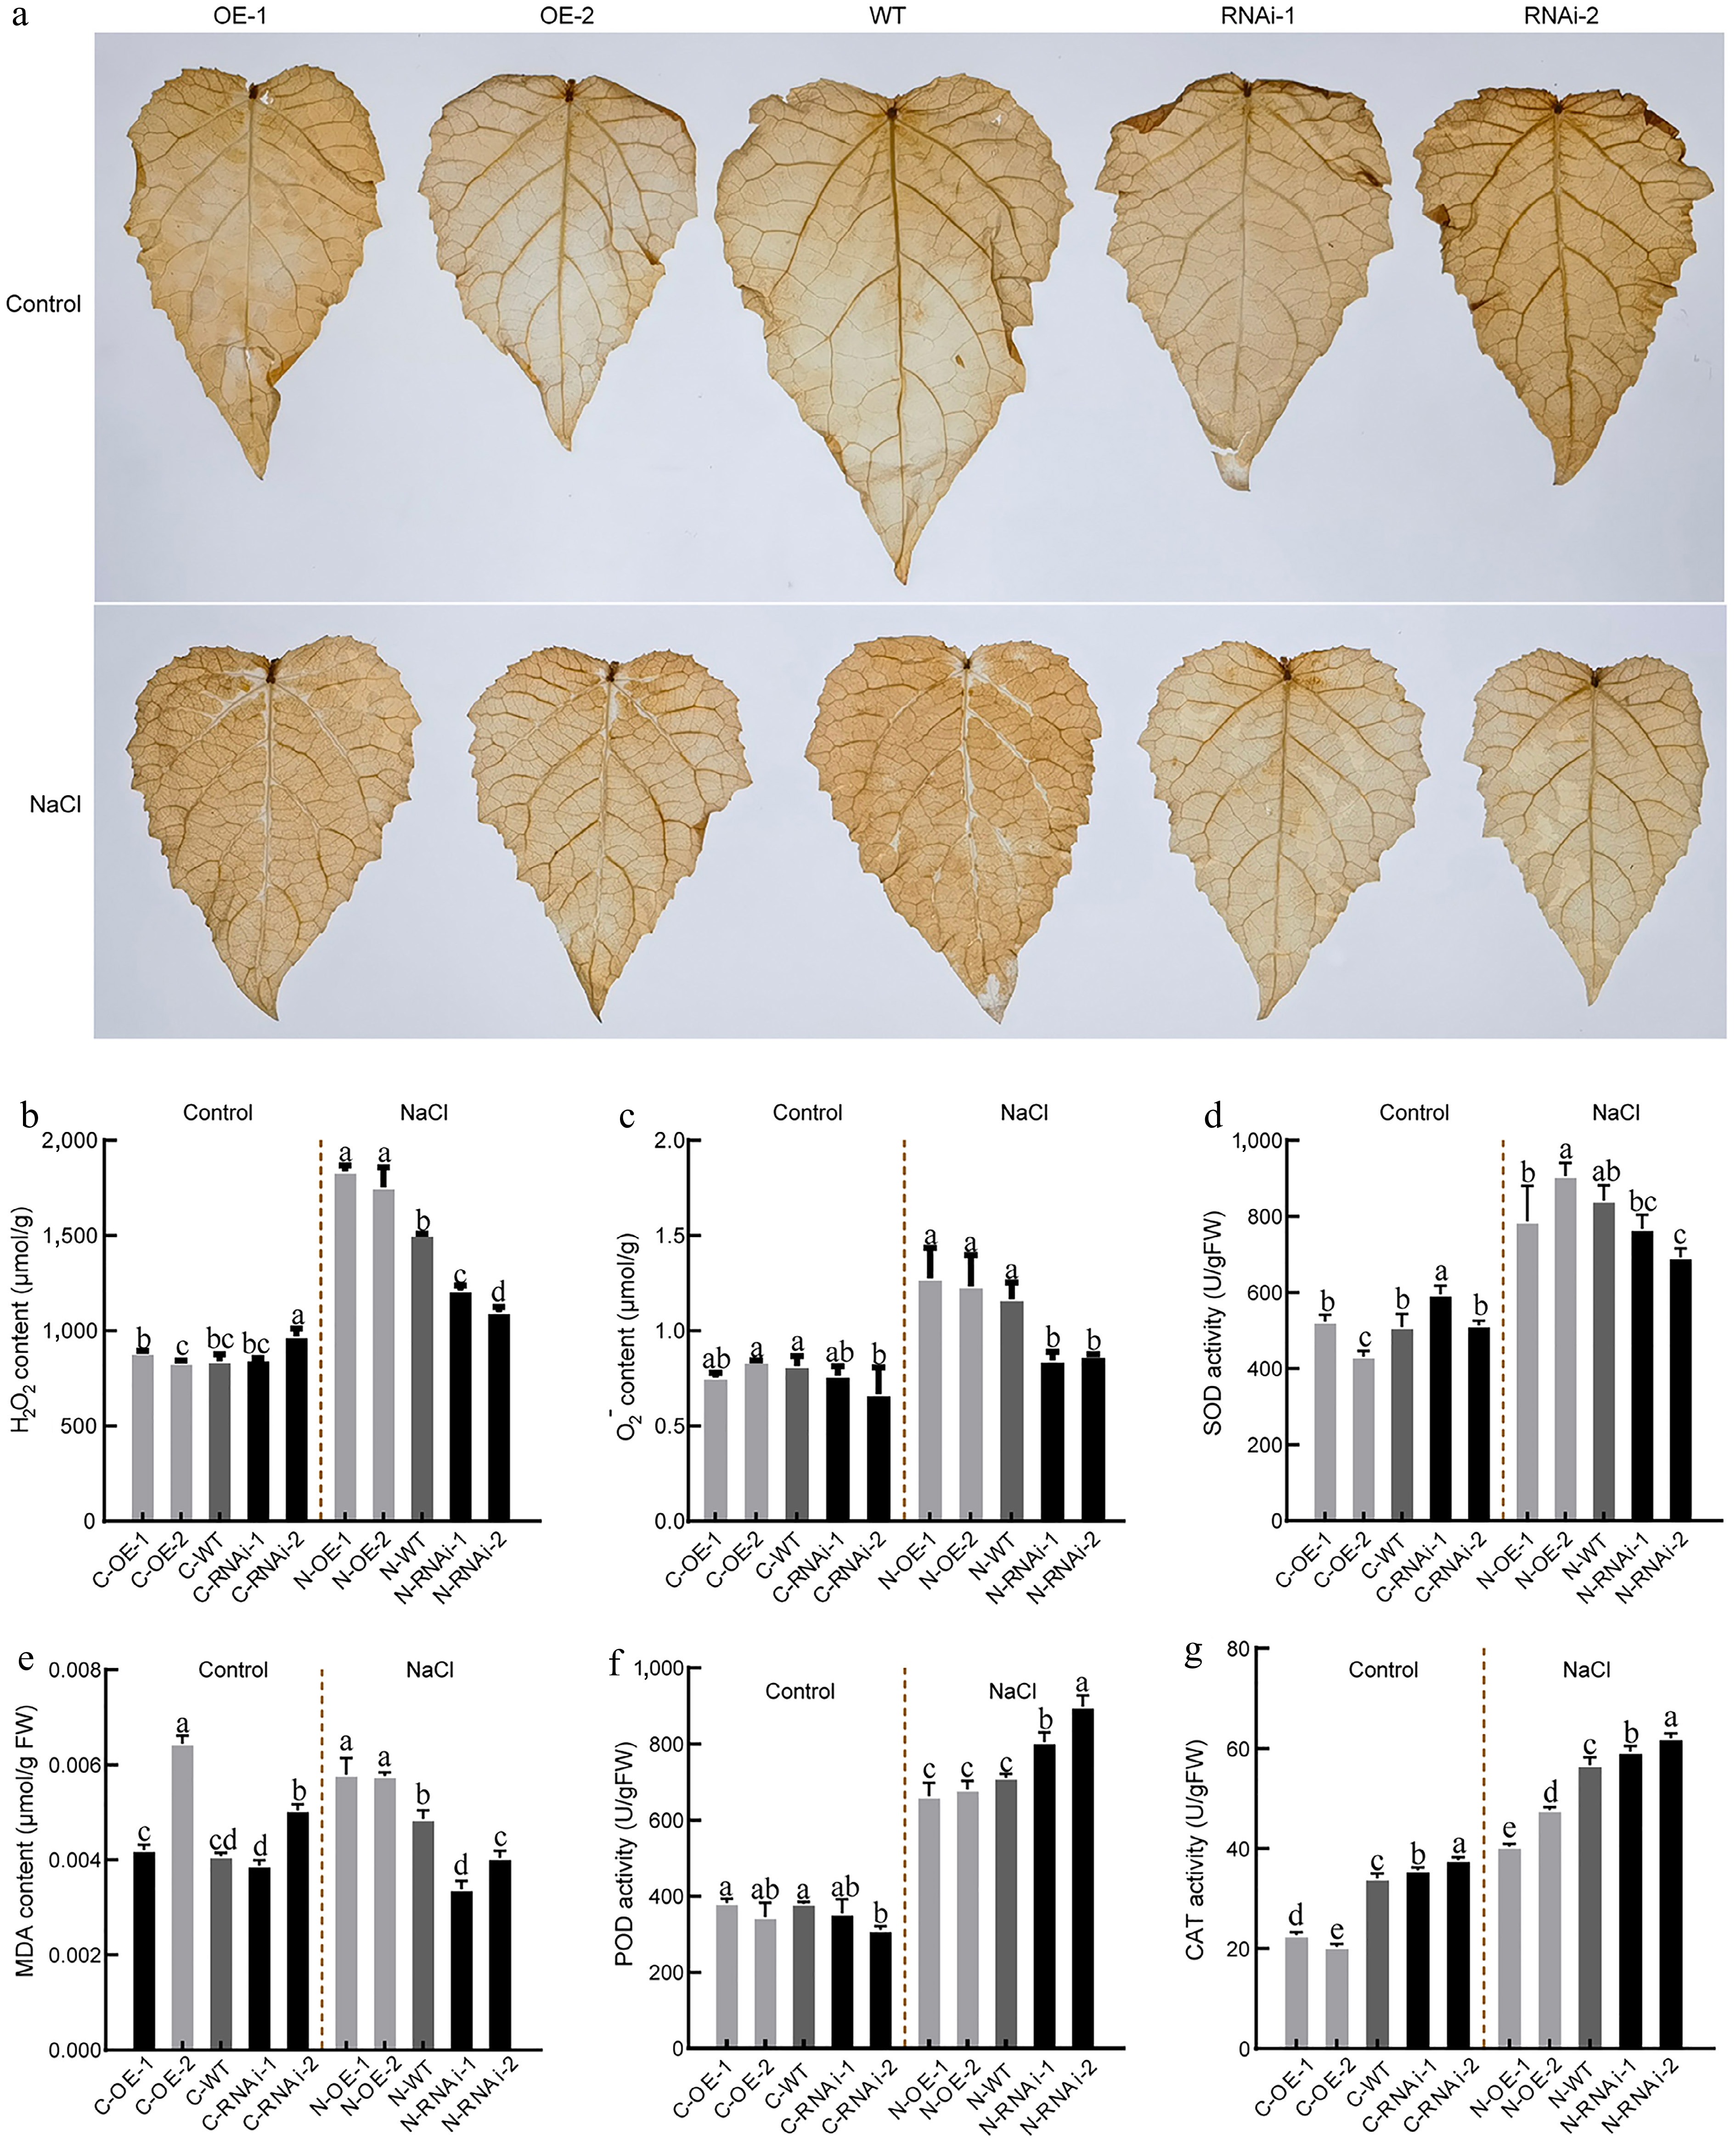
Figure 5.
Antioxidative physiological indices in PagbZIP60 transgenic poplar under salt stress. (a) Diaminobenzidine (DAB) histological staining of the mature functional leaves of PagbZIP60 transgenic poplar grown in the pots with 150 mM NaCl for 10 d. (b) Hydrogen peroxide (H2O2), and (c) superoxide anion O2−) content of the mature functional leaves. (d) Superoxide (SOD), (e) malondialdehyde (MDA) content, (f) peroxidase (POD), and (g) catalase (CAT) activities. The different lowercase letters indicate significant differences among samples (p < 0.05). The plot represents the mean ± SD (n = 6). OE: PagbZIP60 overexpression lines, RNAi: PagbZIP60 suppression lines, WT: non-transgenic poplar, C: normal control growth condition, N: salt stress with NaCl condition. C-OE-1 represents overexpression line 1 under normal conditions; N-OE-1 represents the same line under salt stress. The same nomenclature applies to other abbreviations.
-
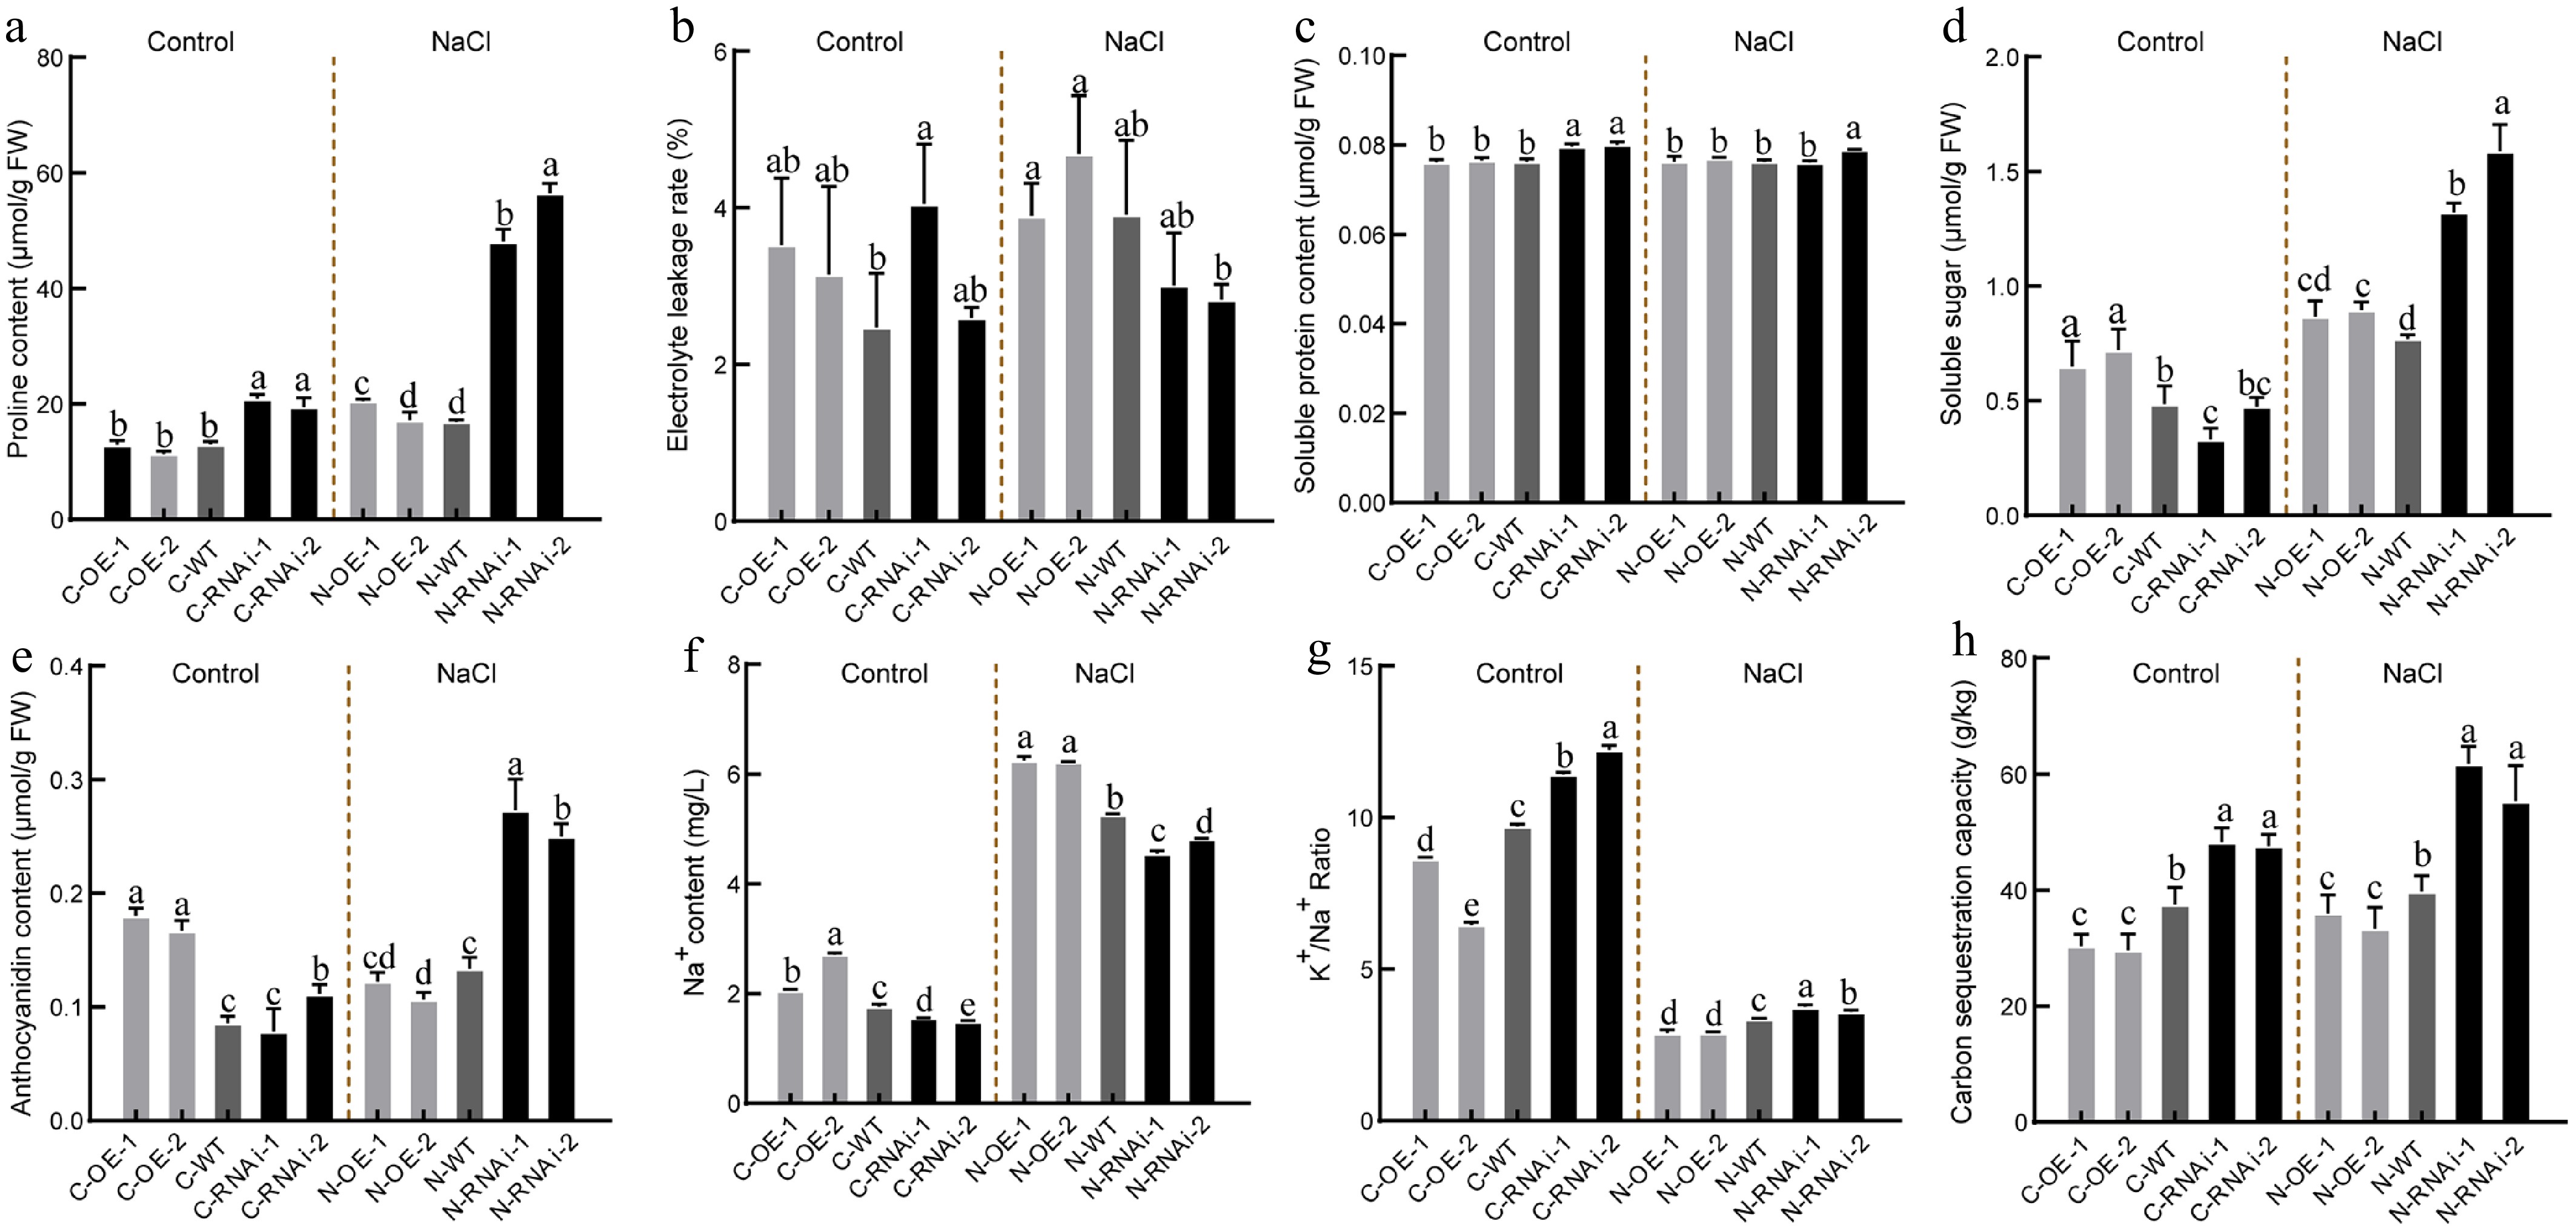
Figure 6.
Osmotic regulation, ion balance and carbon fixation capacity under salt stress in PagbZIP60 transgenic poplar. (a) Proline content, (b) electrolyte leakage, (c) soluble protein content, (d) soluble sugar content, and (e) anthocyanins content. (f) The contents of Na+ and (g) ratio of K+ to Na+. (h) Carbon sequestration capacity of whole plants detected by 20 biological replicates per line. The different lowercase letters indicate significant differences among samples (p < 0.05). The plot represents the mean ± SD (n = 6). OE: PagbZIP60 overexpression lines, RNAi: PagbZIP60 suppression lines, WT: non-transgenic poplar, C: normal control growth condition, N: salt stress with NaCl condition. C-OE-1 represents overexpression line 1 under normal conditions; N-OE-1 represents the same line under salt stress. The same nomenclature applies to other abbreviations.
-
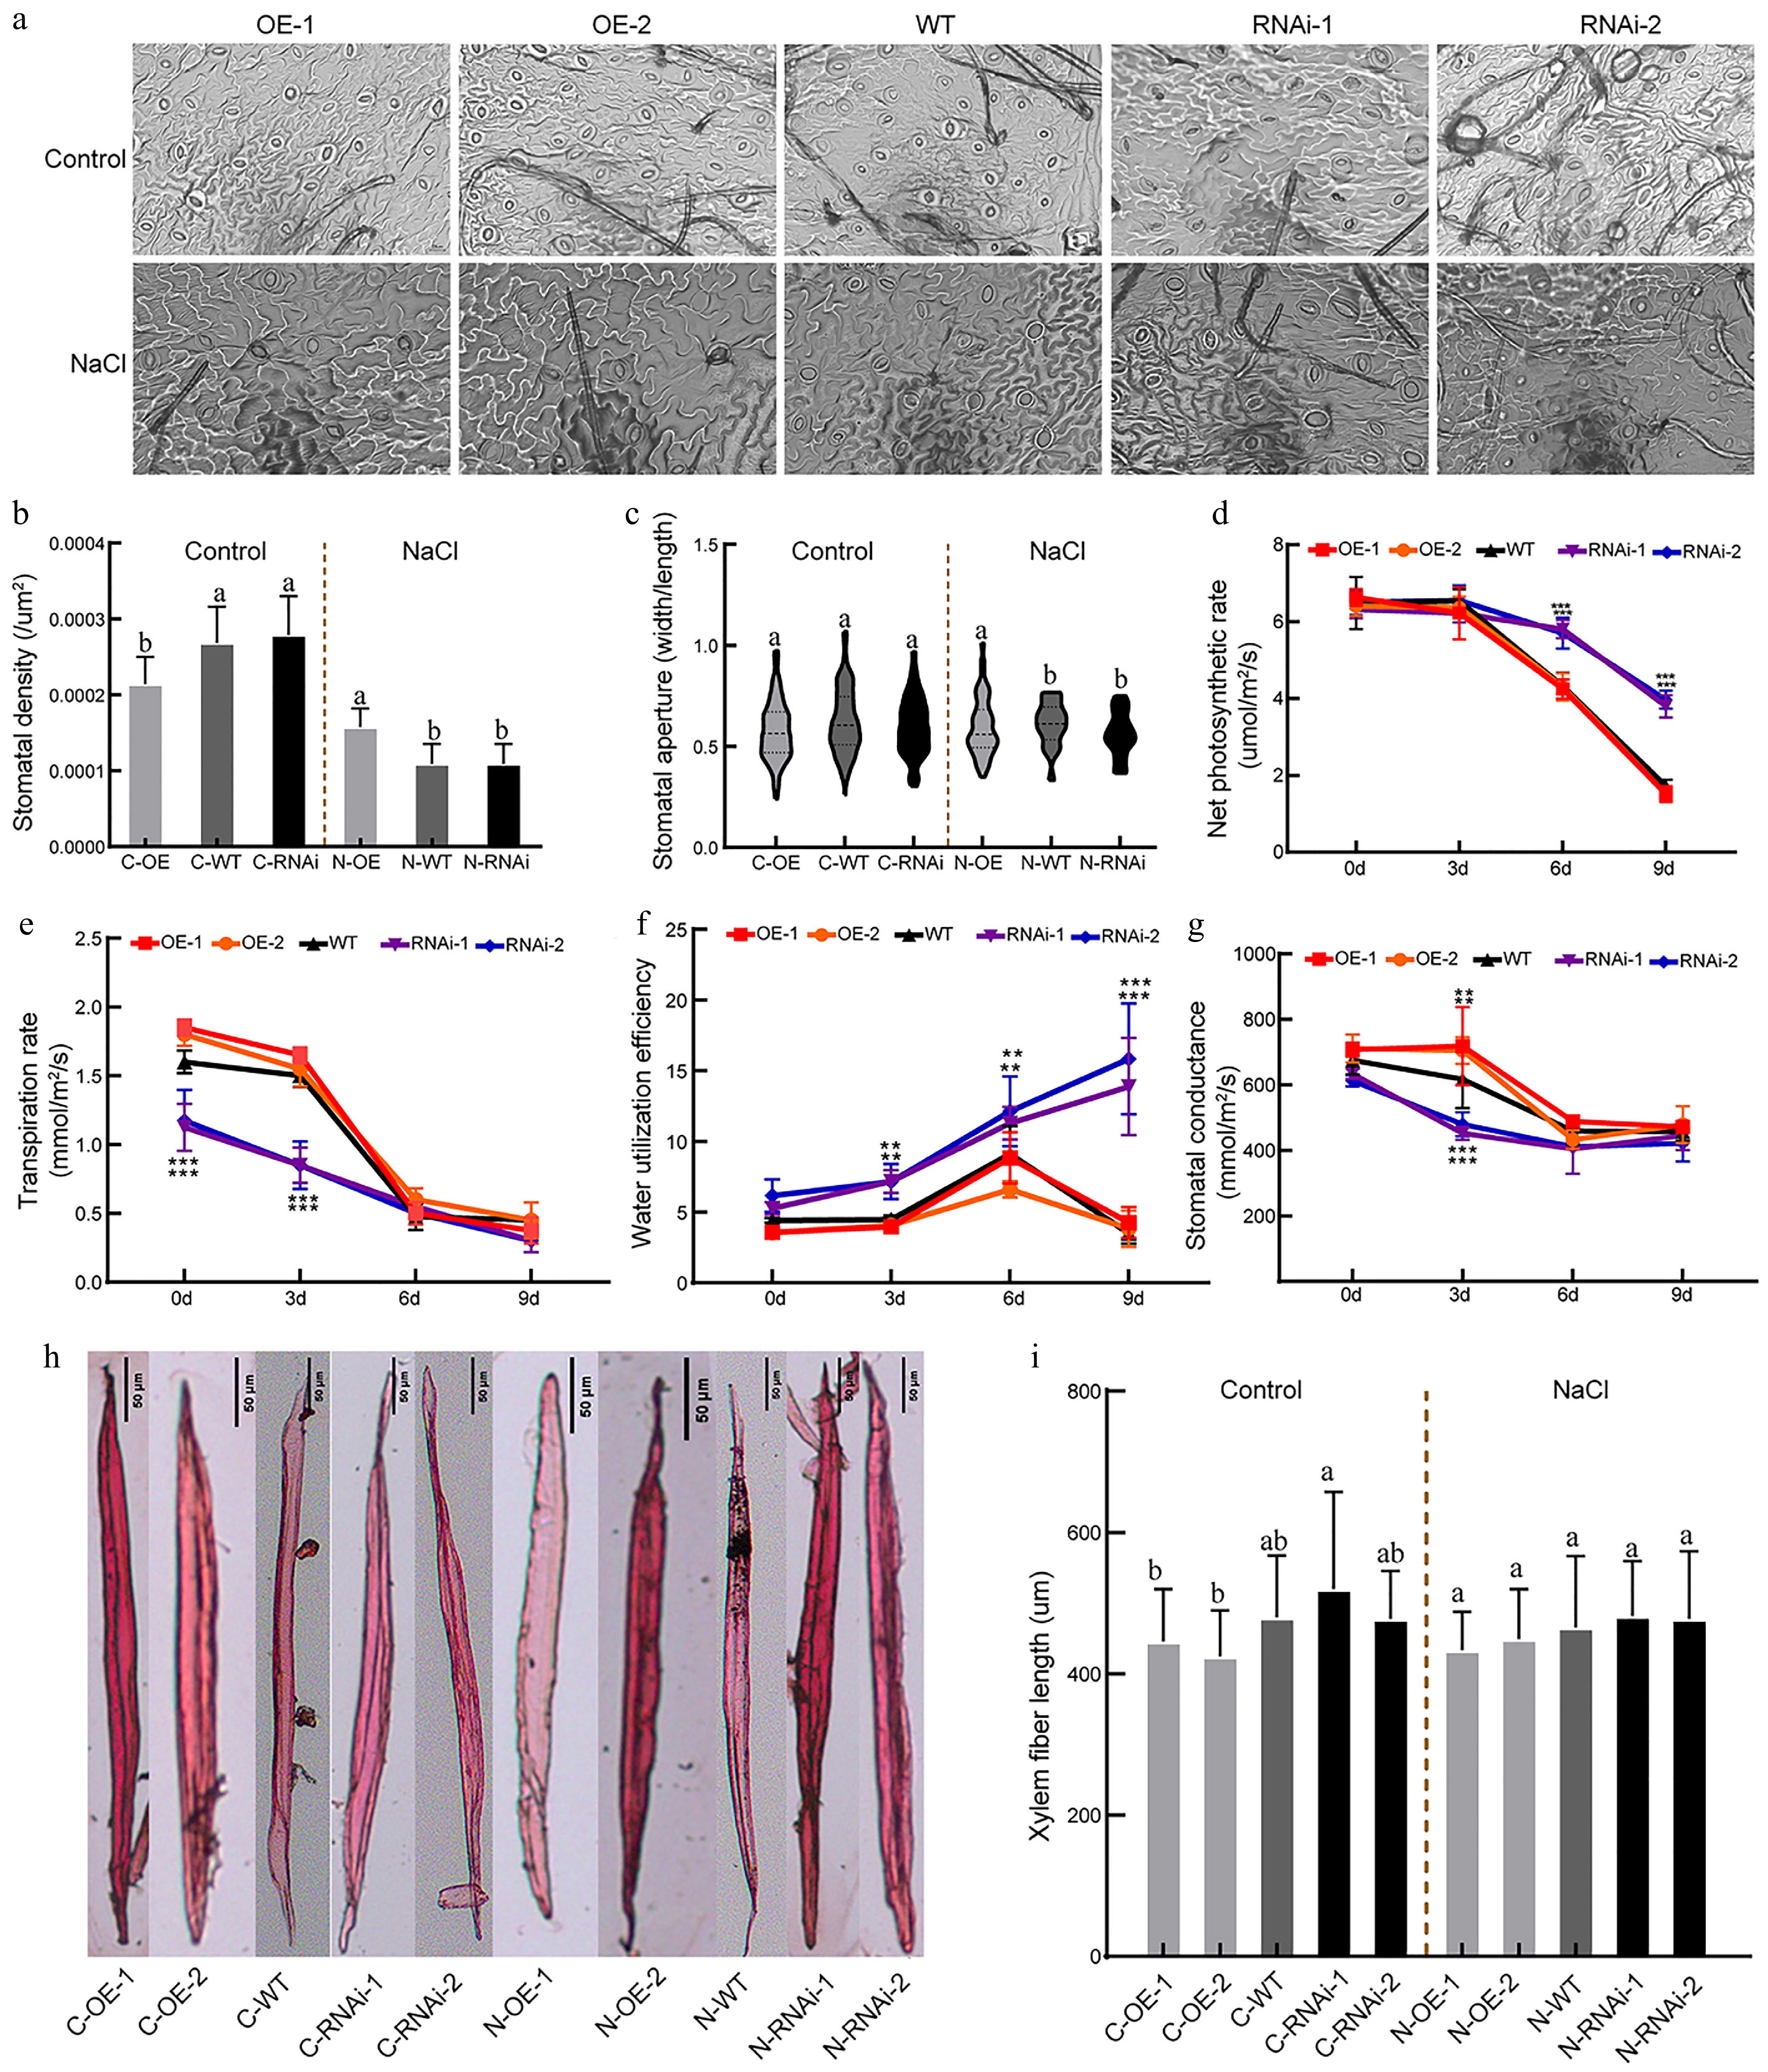
Figure 7.
Photosynthesis indicators and fiber traits of PagbZIP60 transgenic poplar under salt stress conditions. (a) Stomatal morphology of PagbZIP60 transgenic poplar. (b) Density, and (c) aperture of open stomata. (d) Net photosynthetic rate, (e) transpiration rate, (f) water utilization efficiency, and (g) stomatal conductance of leaves. (h) Fiber morphology and length of the stems. The different lowercase letters indicate significant differences among samples (p < 0.05, [b], [c], [i]). The stars indicate significant differences between PagbZIP60 transgenic poplar and non-transgenic poplar at the same developmental stage (p < 0.05, [d]−[g]). * p < 0.05, ** p < 0.01, and *** p < 0.001. The plot represents the mean ± SD (n = 6). OE: PagbZIP60 overexpression lines, RNAi: PagbZIP60 suppression lines, WT: non-transgenic poplar, C: normal control growth condition, N: salt stress with NaCl condition. C-OE-1 represents overexpression line 1 under normal conditions; N-OE-1 represents the same line under salt stress. The same nomenclature applies to other abbreviations. Bar: 50 μm.
-
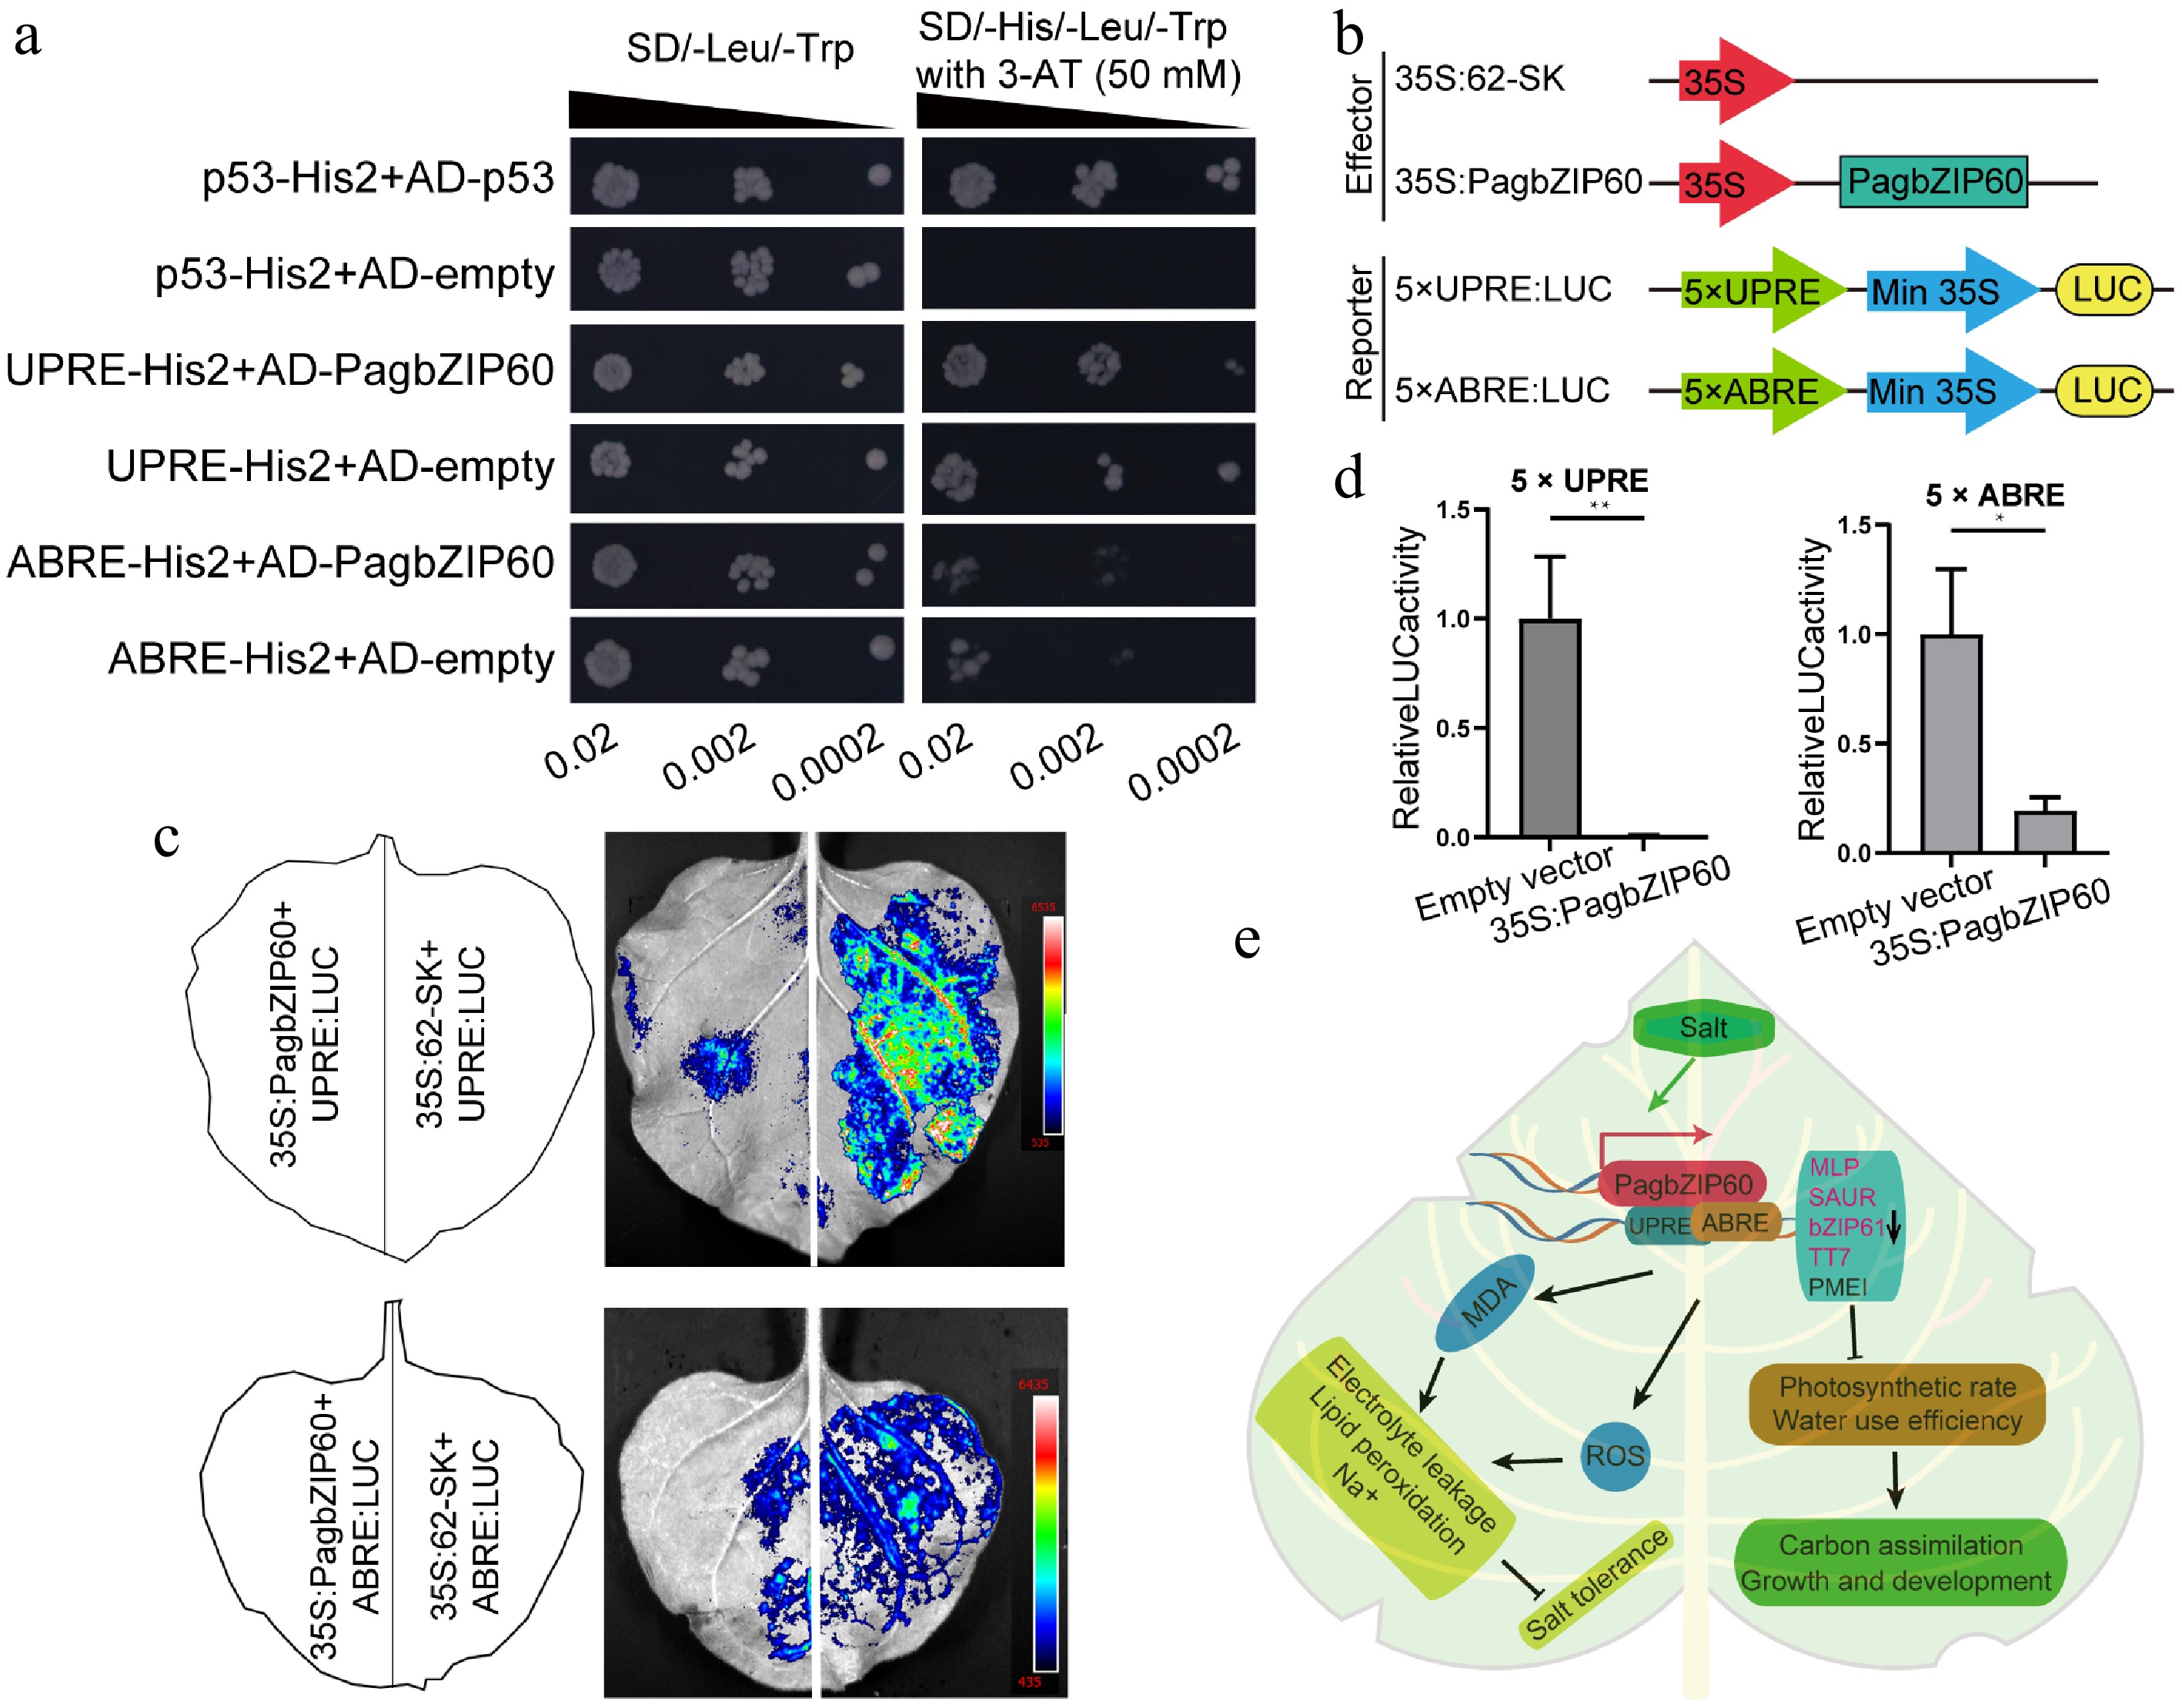
Figure 8.
Downstream targets regulated by PagbZIP60. (a) The binding of PagbZIP60 to UPRE/ABRE motifs was validated using a Y1H assay. Transformed yeast dilutions were plated on synthetic dextrose (SD) media lacking leucine and tryptophan (SD/-Leu/-Trp), and on SD media lacking leucine, tryptophan, and histidine (SD/-His/-Leu/-Trp), with 3-AT (3-amino-1,2,4-triazole). Positive control: p53-His2 + AD-53; Negative control: p53-His2 + AD-empty, UPRE-His2 + AD-empty, ABRE-His2 + AD-empty. (b) PagbZIP60 and five iterations of cis-elements (UPRE/ABRE) were fused to pGreenII 62-SK and pGreenII 0800-LUC vector, respectively. (c) Dual luciferase assays of PagbZIP60 and (d) cis-elements (UPRE/ABRE) by transient expression in tobacco leaves. (e) A model of the mechanism by which PagbZIP60 regulates salt tolerance and carbon assimilation by impairing ROS scavenging and ion homeostasis in poplar. The error bars represent the standard deviation of three biological replicates (n = 3). Statistical significance was determined by one-way ANOVA followed by Tukey's post hoc test. Asterisks denote statistically significant differences (p < 0.05), * p < 0.05, ** p < 0.01, *** p < 0.001.
Figures
(8)
Tables
(0)