-
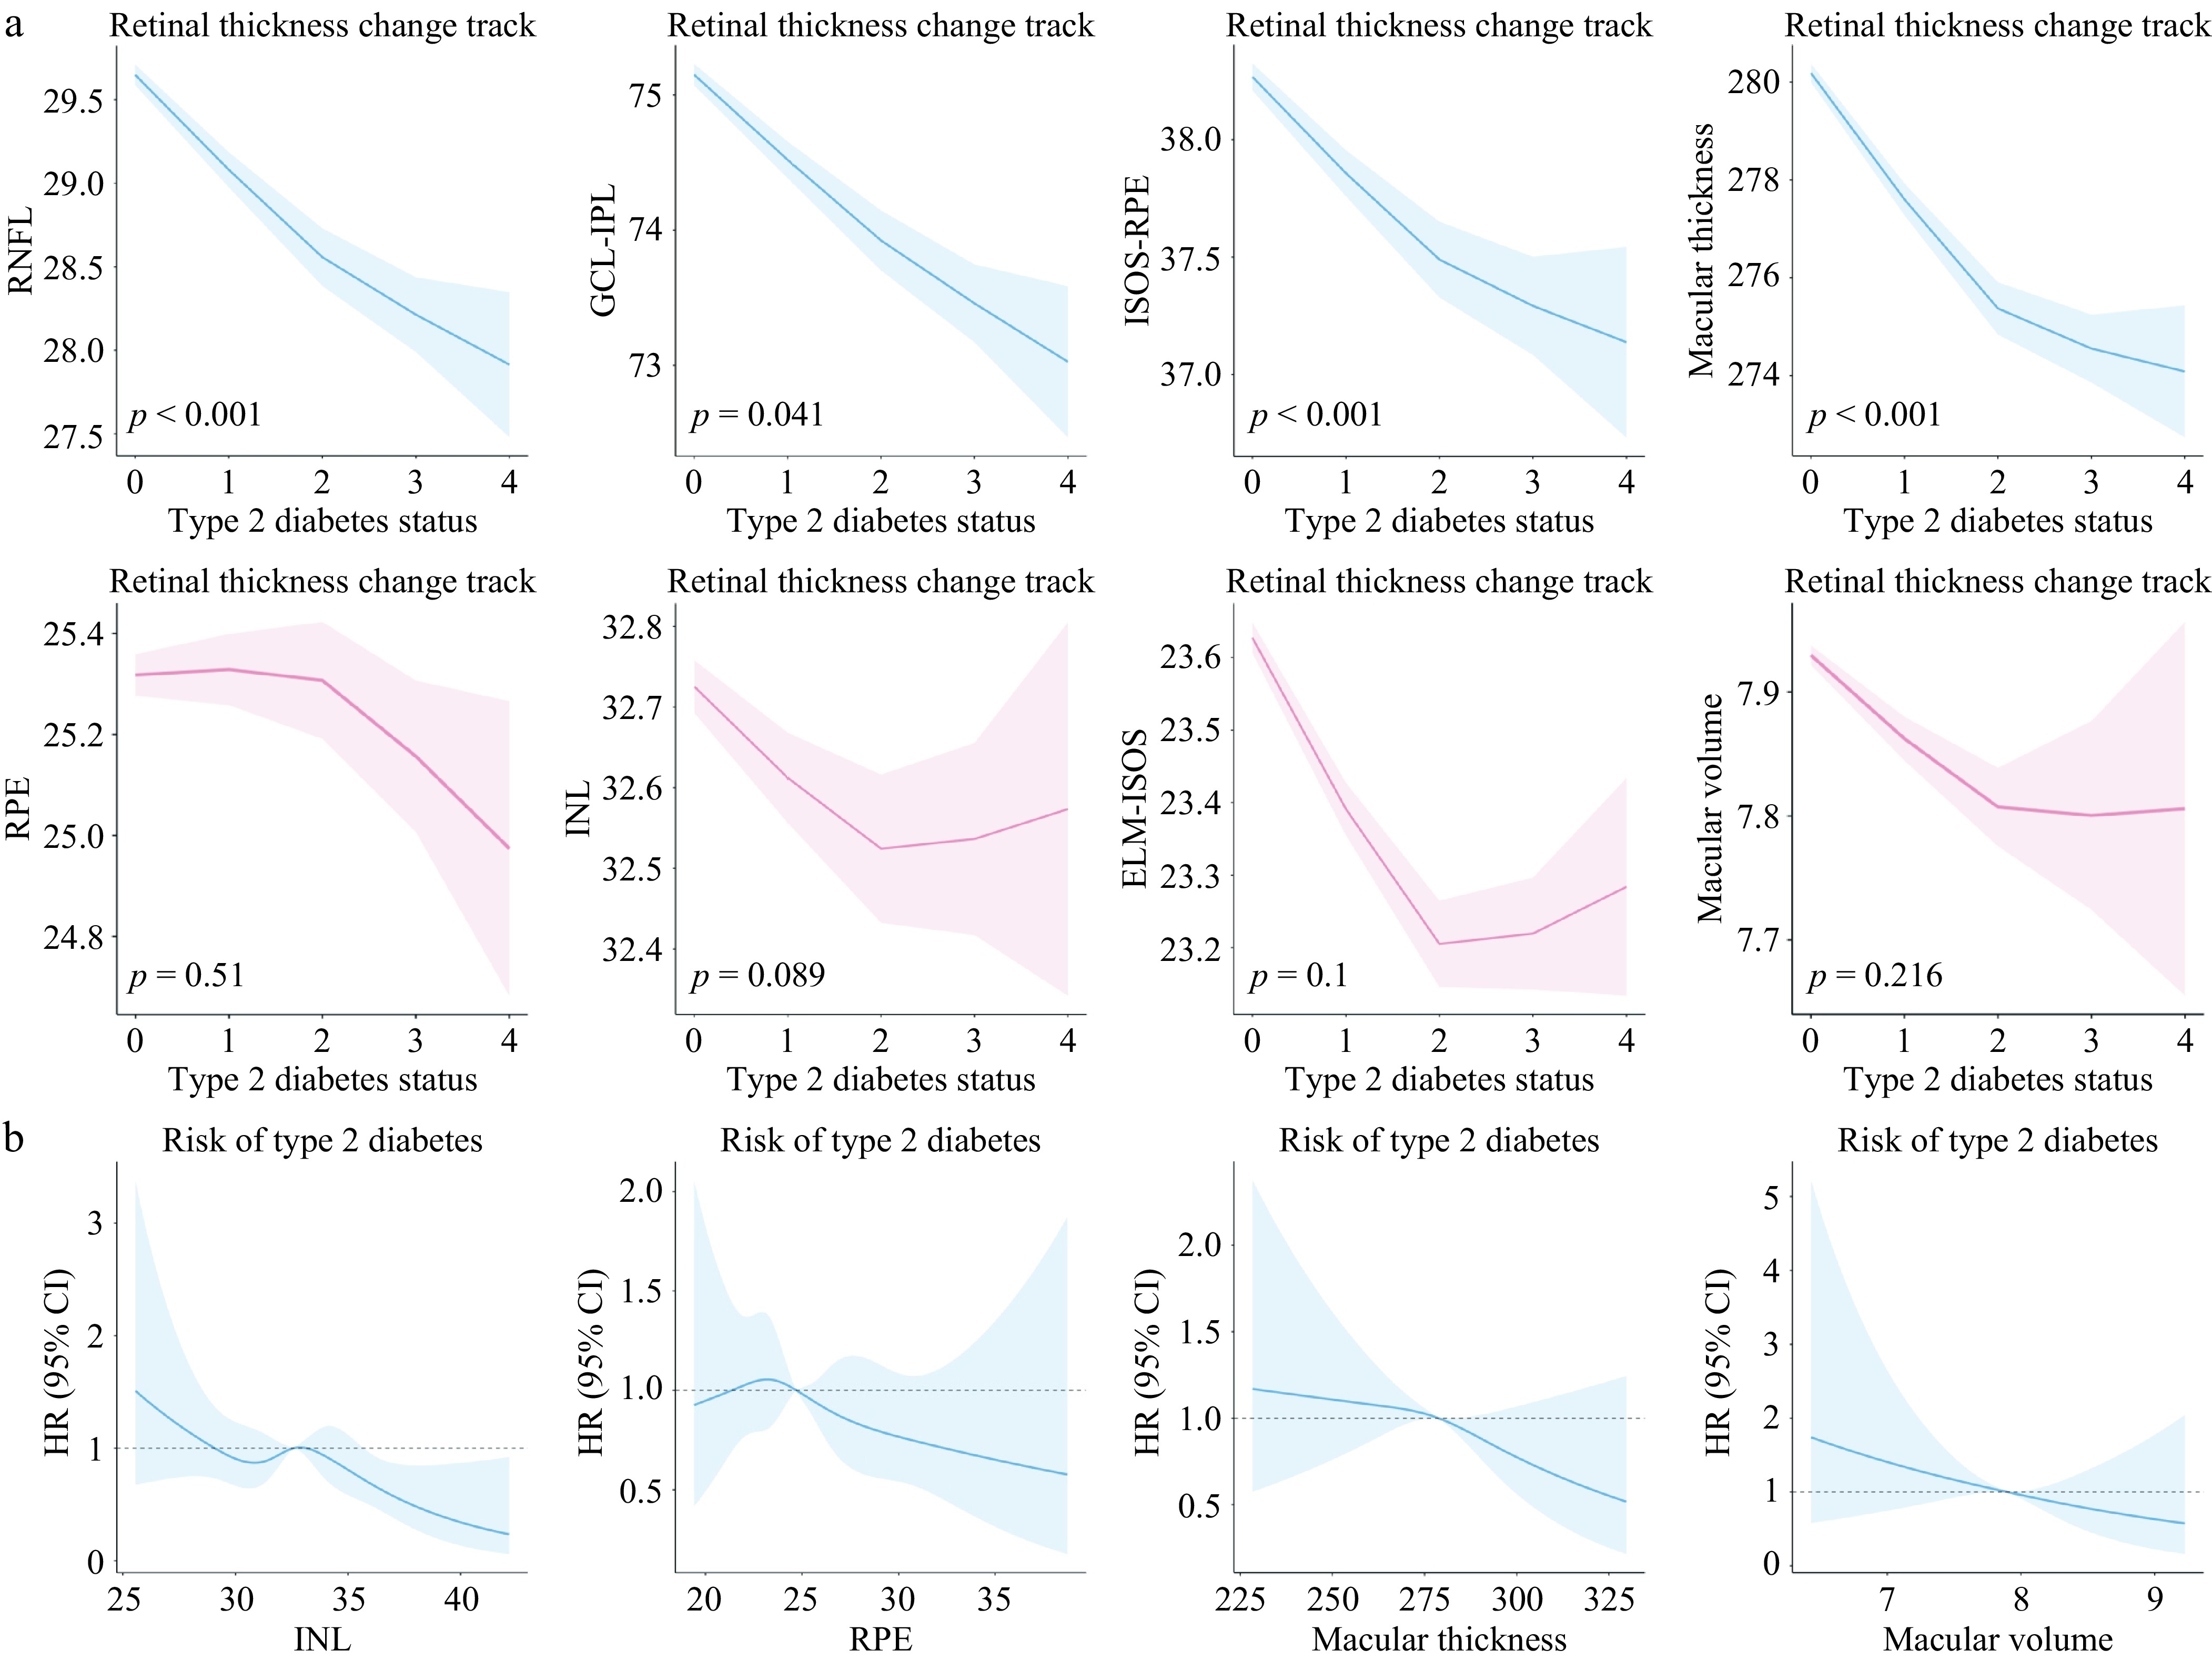
Figure 1.
Nonlinear curve of changes in retinal sublayer thickness with T2D progression and risk. (a) Changes in retinal sublayer thickness with the development of diabetic over time based on restricted cubic spline (RCS). (b) Risk of T2D along with the change in retinal thickness, based on the RCS curve.
-
Healthy Pre-T2D T2D without any complications T2D and microvascular complications T2D and macrovascular and microvascular
complicationsp-Value n = 18,019 n = 3,415 n = 1,043 n = 283 n = 302 Age 54.0 (47.0–61.0) 60.0 (54.0–64.0) 60.0 (54.0–64.0) 63.0 (56.0–66.0) 62.5 (58.2–66.0) < 0.001 Sex < 0.001 Female 9,968 (55.3%) 1,899 (55.6%) 444 (42.6%) 121 (42.8%) 75 (24.8%) Male 8,051 (44.7%) 1,516 (44.4%) 599 (57.4%) 162 (57.2%) 227 (75.2%) Education level < 0.001 College/university 7,047 (39.1%) 1,046 (30.6%) 296 (28.4%) 58 (20.5%) 60 (19.9%) Other 10,972 (60.9%) 2,369 (69.4%) 747 (71.6%) 225 (79.5%) 242 (80.1%) Race < 0.001 Other 1,233 (6.84%) 581 (17.0%) 196 (18.8%) 54 (19.1%) 51 (16.9%) White 16,786 (93.2%) 2,834 (83.0%) 847 (81.2%) 229 (80.9%) 251 (83.1%) Smoking status < 0.001 Never 10,419 (58.1%) 1,807 (53.4%) 507 (49.0%) 129 (46.4%) 100 (33.1%) Previous/current 7,502 (41.9%) 1,575 (46.6%) 527 (51.0%) 149 (53.6%) 202 (66.9%) Drinking status < 0.001 Never 664 (3.70%) 232 (6.84%) 73 (7.03%) 32 (11.4%) 33 (10.9%) Previous/current 17,293 (96.3%) 3,158 (93.2%) 966 (93.0%) 249 (88.6%) 269 (89.1%) Health status < 0.001 Worse 14,716 (82.1%) 2,390 (70.9%) 531 (51.4%) 105 (37.4%) 94 (31.1%) Better 3,209 (17.9%) 981 (29.1%) 503 (48.6%) 176 (62.6%) 208 (68.9%) Physical activity level < 0.001 High 6,663 (37.0%) 1,104 (32.3%) 281 (26.9%) 62 (21.9%) 85 (28.1%) Low 2,272 (12.6%) 520 (15.2%) 190 (18.2%) 66 (23.3%) 63 (20.9%) Moderate 6,160 (34.2%) 1,084 (31.7%) 361 (34.6%) 89 (31.4%) 90 (29.8%) Townsend index −1.80 (−3.41 to 0.71) −1.56 (−3.30 to 1.25) −1.04 (−3.23 to 1.80) −0.55 (−2.79 to 2.22) −1.08 (−3.16 to 2.37) < 0.001 BMI 25.8 (23.4–28.5) 28.0 (25.2–31.4) 29.6 (26.8–33.7) 31.4 (28.1–36.0) 30.4 (27.5–33.7) 0.000 Hypertension history < 0.001 No 6,634 (36.8%) 665 (19.5%) 123 (11.8%) 24 (8.48%) 39 (12.9%) Yes 11,385 (63.2%) 2,750 (80.5%) 920 (88.2%) 259 (91.5%) 263 (87.1%) Hyperlipidemia history < 0.001 No 12,107 (67.2%) 1,569 (45.9%) 351 (33.7%) 65 (23.0%) 25 (8.28%) Yes 5,912 (32.8%) 1,846 (54.1%) 692 (66.3%) 218 (77.0%) 277 (91.7%) Calcium 2.38 (2.33–2.44) 2.39 (2.33–2.45) 2.40 (2.34–2.46) 2.39 (2.34–2.48) 2.39 (2.33–2.46) < 0.001 Urate 289 (240–344) 317 (267–372) 322 (267–376) 351 (301–412) 331 (286–390) < 0.001 Data are the mean ± standard deviation, or numbers (%). Analysis of variance was used to test the difference of continuous variables across subgroups of T2D and χ2 for categorical variables. Table 1.
Baseline characteristics of participants according to the progression of T2D.
-
Model 1 Model 2 OR 95% CI p-Value FDR-adjusted p-Value OR 95% CI p-Value FDR-adjusted p-Value RNFL (μm) 0.967 0.960–0.974 < 0.001 0.001 0.982 0.973–0.992 < 0.001 0.003 GCL-IPL (μm) 0.986 0.980–0.991 < 0.001 0.001 0.992 0.985–1.000 0.041 0.082 INL (μm) 0.985 0.971–1.000 0.044 0.044 0.984 0.967–1.002 0.089 0.133 ISOS-RPE (μm) 0.960 0.952–0.968 < 0.001 0.001 0.980 0.969–0.990 < 0.001 0.003 ELM-ISOS (μm) 0.917 0.896–0.939 < 0.001 0.001 0.976 0.948–1.005 0.1 0.133 RPE (μm) 1.021 1.010–1.034 < 0.001 0.001 1.005 0.990–1.020 0.51 0.510 Overall macular thickness (μm) 0.983 0.981–0.986 < 0.001 0.001 0.992 0.989–0.995 < 0.001 0.003 Macular volume (mm3) 0.682 0.585–0.795 < 0.001 0.001 0.889 0.738–1.071 0.216 0.247 Model 1 was adjusted for age and gender. Model 2 was adjusted for age, gender, education level, ethnicity, smoking status, drinking status, health status, physical activity level, Townsend index, BMI, hypertension, hyperlipidemia, blood calcium, and blood uric acid. FDR-adjusted p-value: False discovery rate-adjusted p-value calculated using the Benjamini–Hochberg procedure. Bold values indicate statistical significance (p < 0.05). Table 2.
Changes in retinal sublayer thickness with T2D progression.
-
Model 1 Model 2 OR 95% CI p-Value FDR-adjusted p-Value OR 95% CI p-Value FDR-adjusted p-Value Healthy vs. Pre-T2D RNFL (μm) 0.980 0.997–0.990 < 0.001 0.001 0.990 0.980–0.998 0.045 0.120 GCL-IPL (μm) 0.996 0.990–1.003 0.266 0.266 1.001 0.993–1.010 0.782 0.791 INL (μm) 0.993 0.980–1.010 0.432 0.432 0.997 0.976–1.018 0.791 0.791 ISOS-RPE (μm) 0.970 0.966–0.983 < 0.001 0.001 0.991 0.979–1.003 0.134 0.268 ELM-ISOS (μm) 0.917 0.891–0.943 < 0.001 0.001 0.961 0.930–0.994 0.020 0.080 RPE (μm) 1.026 1.012–1.040 < 0.001 0.001 1.009 0.992–1.026 0.28 0.448 Overall macular thickness (μm) 0.989 0.986–0.992 < 0.001 0.001 0.996 0.992–0.999 0.016 0.080 Macular volume (mm3) 0.721 0.616–0.844 < 0.001 0.001 0.916 0.756–1.110 0.37 0.493 Pre-T2D vs. T2D without any complications RNFL (μm) 0.955 0.941–0.970 < 0.001 0.001 0.972 0.952–0.992 0.005 0.019 GCL-IPL (μm) 0.973 0.963–0.985 < 0.001 0.001 0.979 0.965–0.994 0.007 0.019 INL (μm) 0.970 0.944–0.998 0.036 0.048 0.955 0.920–0.991 0.015 0.024 ISOS-RPE (μm) 0.951 0.938–0.965 < 0.001 0.001 0.975 0.955–0.995 0.013 0.024 ELM-ISOS (μm) 0.918 0.875–0.962 < 0.001 0.001 0.960 0.906–1.018 0.173 0.198 RPE (μm) 1.024 1.001–1.048 0.038 0.048 1.008 0.978–1.039 0.588 0.588 Overall macular thickness (μm) 0.976 0.972–0.981 < 0.001 0.001 0.984 0.978–0.990 < 0.001 0.008 Macular volume (mm3) 0.358 0.197–0.651 0.001 0.002 0.451 0.219–0.931 0.031 0.041 T2D without any complications vs. T2D with microvascular complications RNFL (μm) 0.949 0.922–0.977 < 0.001 0.001 0.963 0.938–1.051 0.057 0.080 GCL-IPL (μm) 0.962 0.942–0.983 < 0.001 0.001 0.961 0.960–0.963 0.007 0.016 INL (μm) 0.969 0.919–1.022 0.255 0.340 0.992 0.928–1.137 0.031 0.054 ISOS-RPE (μm) 0.928 0.907–0.949 < 0.001 0.001 0.929 0.899–0.985 < 0.001 0.004 ELM-ISOS (μm) 0.915 0.837–0.999 0.048 0.096 1.004 0.799–1.085 0.936 0.936 RPE (μm) 1.012 0.968–1.058 0.599 0.599 0.997 0.868–1.038 0.919 0.936 Overall macular thickness (μm) 0.969 0.960–0.977 < 0.001 0.001 0.970 0.956–0.990 < 0.001 0.004 Macular volume (mm3) 0.145 0.021–1.025 0.053 0.096 NA – – – T2D with microvascular complications vs. T2D with microvascular and macrovascular complications RNFL (μm) 0.932 0.907–0.959 < 0.001 0.001 0.970 0.933–1.009 0.128 0.205 GCL-IPL (μm) 0.966 0.946–0.985 0.001 0.002 0.970 0.943–0.998 0.035 0.093 INL (μm) 0.982 0.933–1.034 0.480 0.48 0.943 0.878–1.012 0.104 0.205 ISOS-RPE (μm) 0.946 0.923–0.970 < 0.001 0.001 0.955 0.918–0.994 0.025 0.093 ELM-ISOS (μm) 0.901 0.826–0.982 0.017 0.023 0.976 0.872–1.093 0.676 0.676 RPE (μm) 0.969 0.926–1.013 0.19 0.217 0.982 0.922–1.047 0.585 0.669 overall macular thickness (μm) 0.973 0.965–0.982 < 0.001 0.001 0.982 0.970–0.995 0.005 0.040 Macular volume (mm3)l 0.592 0.179–1.953 0.389 0.389 0.654 0.150–2.841 0.571 0.669 Model 1 was adjusted for age and gender. Model 2 was adjusted for age, gender, education level, ethnicity, smoking status, drinking status, health status, physical activity level, townsend index, BMI, hypertension, hyperlipidemia, blood calcium, and blood uric acid. FDR-adjusted p-value: False discovery rate-adjusted p-value calculated using the Benjamini–Hochberg procedure. Bold values indicate statistical significance (p < 0.05). Table 3.
Comparison of retinal sublayer thickness results between different T2D stages.
-
Outcome cutoff
Stage thresholdModel 1 (baseline) Model 2 (+ glucose) Model 3 (+ glucose + retinal sublayer thickness metrics including RNFL, ISOS-RPE, and overall macular thickness) AUC (95% CI) AUC (95% CI) p-Value (vs. Model 1) AUC (95% CI) p-Value (vs. Model 2) Stage ≥ 1 0.739 (0.731–0.748) 0.771 (0.763–0.779) < 0.001 0.776 (0.768–0.784) < 0.001 Stage ≥ 2 0.783 (0.770–0.796) 0.853 (0.840–0.866) < 0.001 0.859 (0.847–0.871) < 0.001 Stage ≥ 3 0.831 (0.815–0.847) 0.866 (0.851–0.881) < 0.001 0.872 (0.858–0.887) 0.006 Stage ≥ 4 0.835 (0.814–0.856) 0.860 (0.840–0.880) < 0.001 0.864 (0.844–0.884) 0.105 Model 1 (baseline): Adjusted for age, sex, and BMI. Model 2 (clinical): Model 1 + blood glucose levels. Model 3 (combined): Model 2 + OCT-derived retinal sublayer thickness metrics (RNFL, ISOS-RPE, and overall macular thickness) Outcome definitions: The outcome cutoffs represent binary classification tasks at progressively severe thresholds: Stage ≥ 1 distinguishes individuals with any glucose abnormality (Stages 1–4) from healthy controls (Stage 0). Stage ≥ 2 distinguishes individuals with diagnosed T2D (Stages 2–4) from nondiabetic individuals (Stages 0–1). Stage ≥ 3 distinguishes T2D patients with complications (Stages 3–4) from those without complications or diabetes (Stages 0–2). Stage ≥ 4 distinguishes T2D patients with macrovascular events (Stage 4) from all other groups (Stages 0–3). p-values compare the predictive performance between models using the DeLong test for correlated ROC curves. p-values (vs. Model 1) indicate the improvement achieved by adding glucose to the base model; p-values (vs. Model 2) indicates the incremental value of adding OCT metrics to the clinical model. Bold values indicate statistical significance (p < 0.05). Table 4.
Incremental predictive value of retinal sublayer thickness added to clinical models for discriminating the progression of T2D stages.
Figures
(1)
Tables
(4)