-
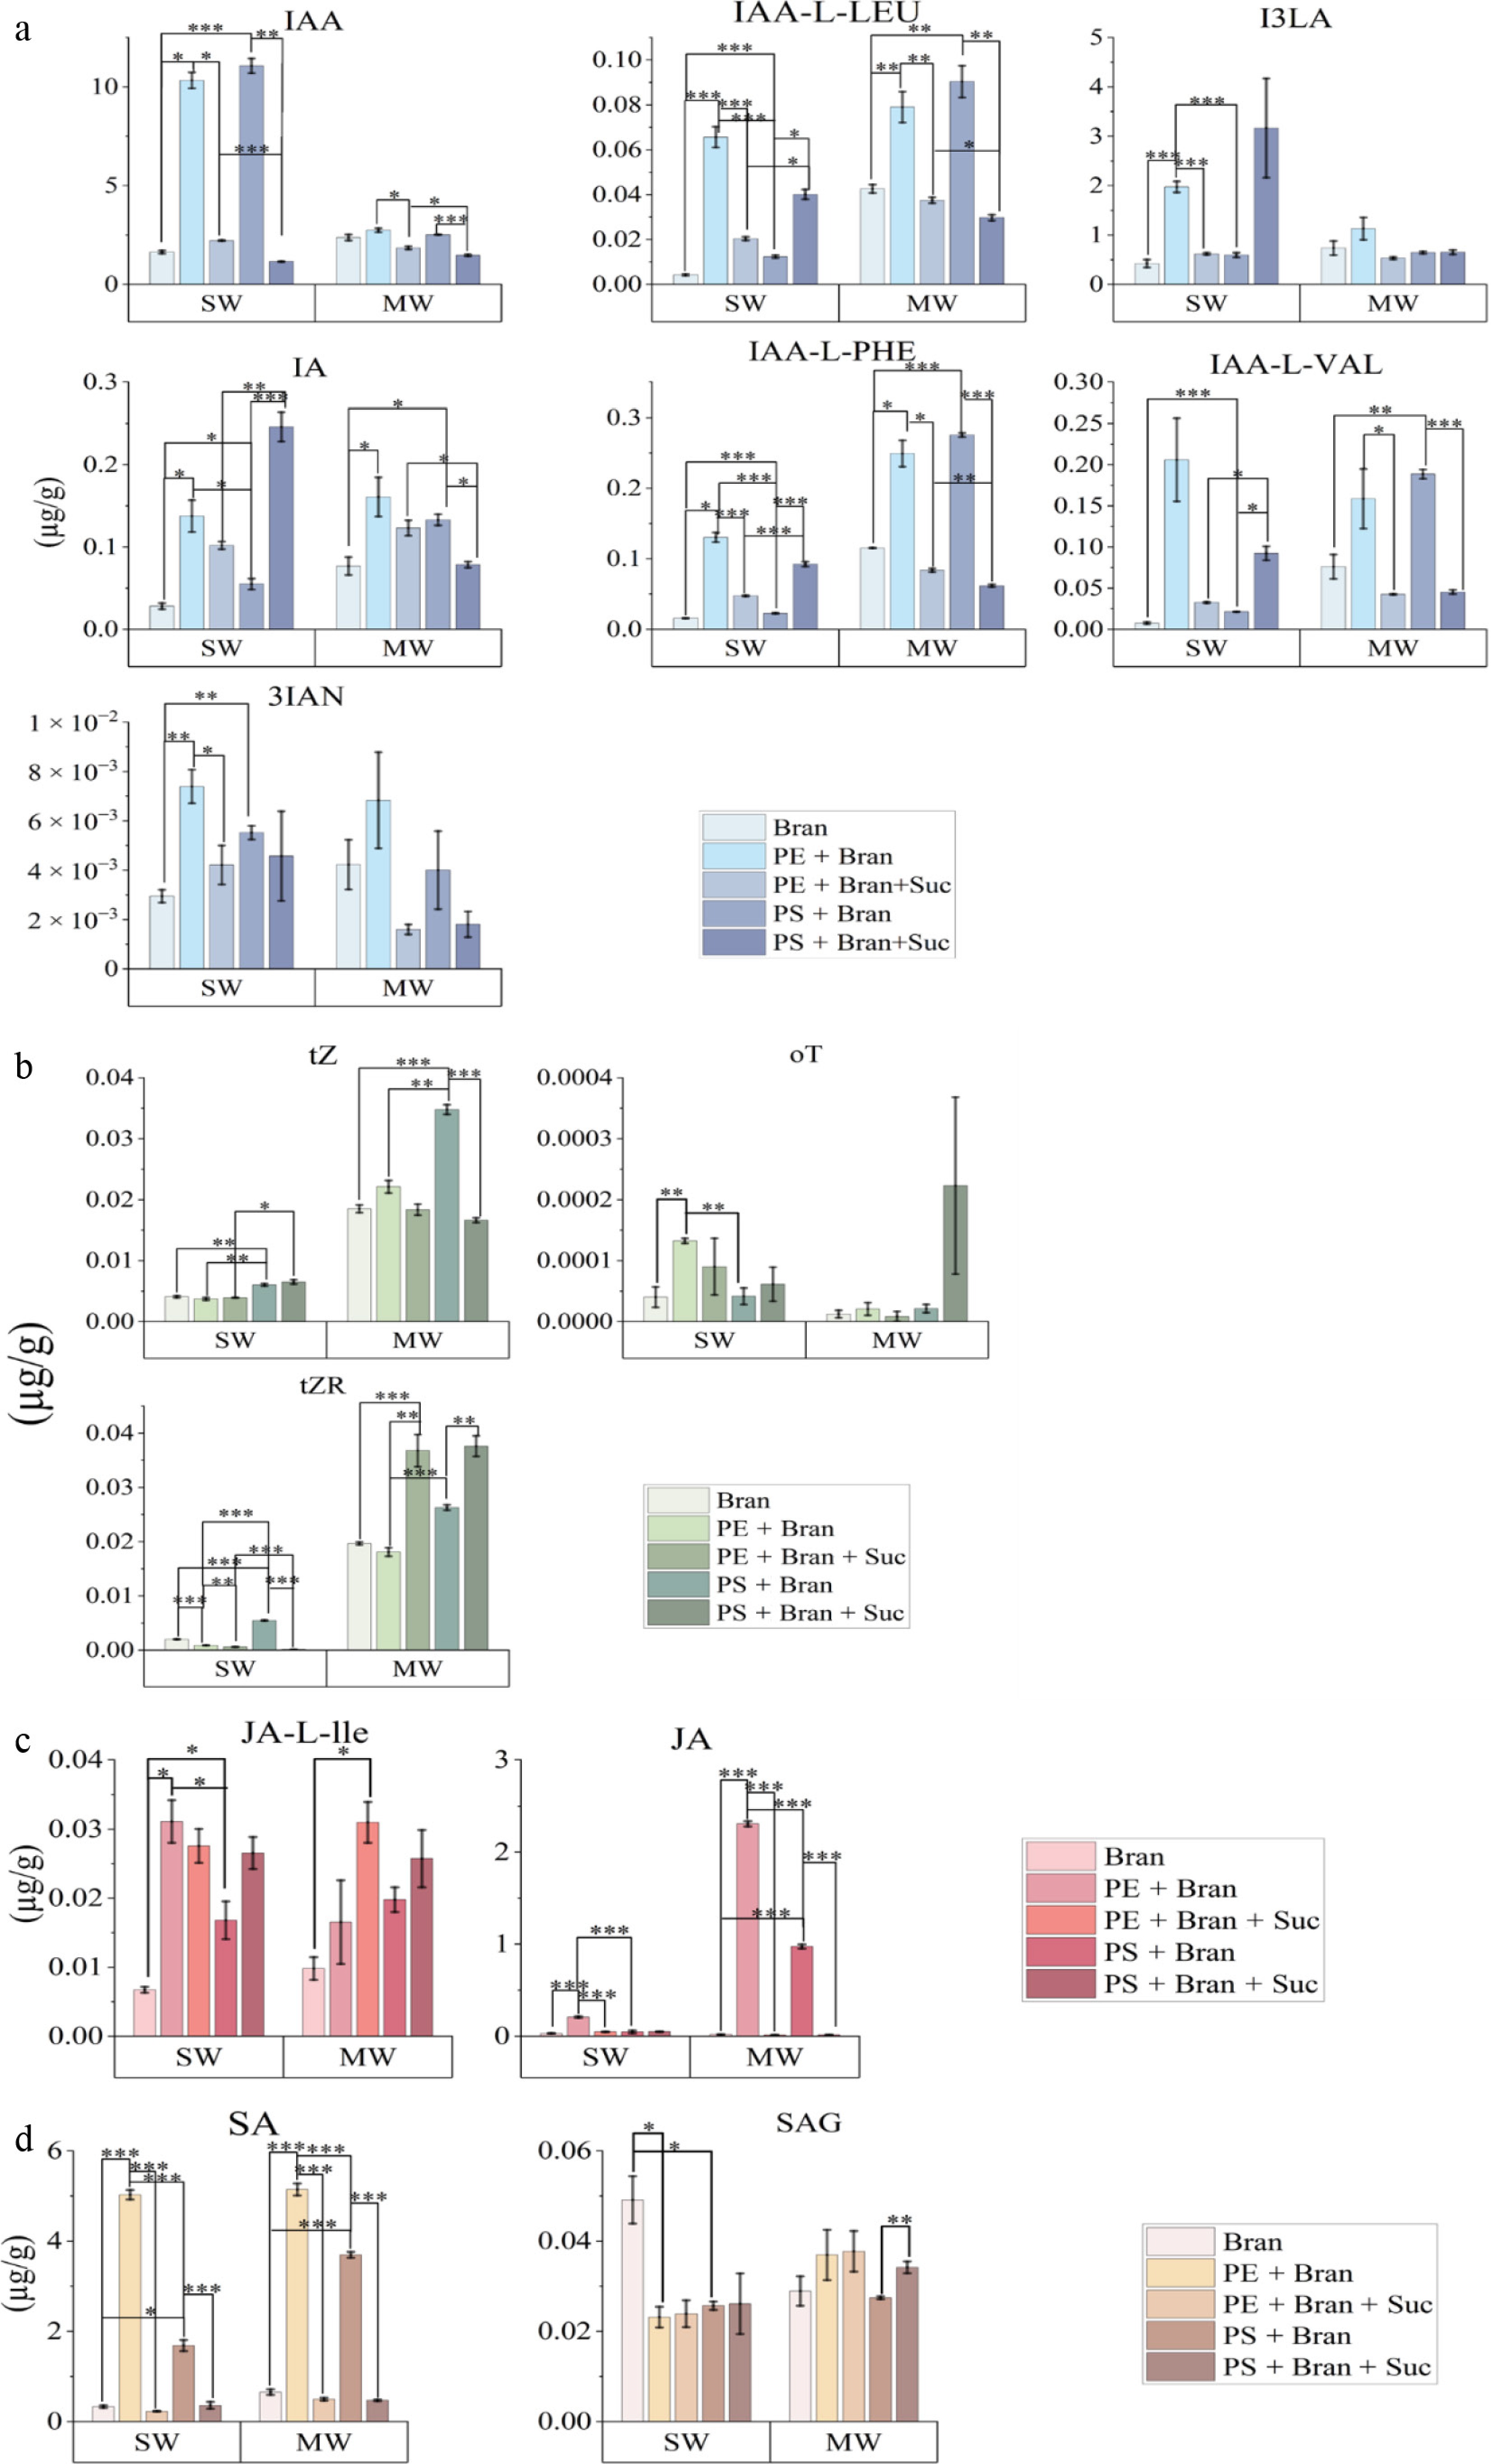
Figure 1.
Phytohormone (auxins and cytokinins) and defense-related jasmonate and salicylate levels in insect frass. (a) Auxins in superworm (SW) and mealworm (MW) frass under five diet treatments: Bran (control), PE + bran (polyethylene + bran), PE + bran + Suc (polyethylene + bran + sucrose), PS + bran (polystyrene + bran), and PS + bran + Suc (polystyrene + bran + sucrose). From left to right: Indole-3-acetic acid (IAA), IAA–L-leucine (IAA-L-LEU), indole-3-lactic acid (I3LA), 3-indoleacrylic acid (IA), IAA–L-phenylalanine (IAA-L-PHE), IAA–L-valine (IAA-L-VAL), and 3-indoleacetonitrile (3IAN). Frass from plastic-fed superworms had higher IAA compounds than bran-fed controls (note the prominent peaks in the blue bars for the PE and PS diets), whereas mealworm frass auxin levels remained similar. Sucrose added to the plastic diet (bars) attenuated the auxin levels in superworms. (b) Cytokinins in the same frass samples: Trans-zeatin (tZ), ortho-topolin (oT), and trans-zeatin riboside (tZR). Cytokinins are lower than auxins (note the y-axis in μg/g). Mealworm frass had more cytokinins than superworms frass in general (green bars). All cytokinin levels were in the ng/g range or below. (c) Jasmonate levels in superworm (left) and mealworm (right) frass across diets. Jasmonic acid (JA) and jasmonoyl-L-isoleucine (JA-Ile) are shown. Plastic-fed mealworm frass (especially the PE + Bran. treatment, dark pink bar) had elevated JA (~2 to 3 µg/g) compared with bran-fed mealworms. Superworm frass showed a smaller increase in JA under plastic diets (o). JA-Ile exhibited parallel trends at lower concentrations (tens of μg/g). Sucrose addition in mealworm diets enhanced JA-Ile accumulation (compare solid vs. pink bars), whereas in superworms, sucrose had a minimal effect. (d) Salicylate levels in frass: Salicylic acid (SA) and its glucose conjugate, salicylic acid 2-O-β-glucoside (SAG). Plastic feeding increased SA levels in superworms and mealworm generally.. SAG was present at much lower levels (≤ 0.05 µg/g). For the full panel of phytohormones and chemicals tested, see the Supplementary Table S5. Note that the data in the Supplementary Table S5 are shown in nmol/g, but we used µg/g here for better comparisons. Data shown here are averaged from the replicates. All values represent the mean ± standard deviation (SD) of biological replicates; the significance of differences relative to the bran controls is indicated by * = p < 0.05, ** = p < 0.01, and *** = p < 0.001.
Figures
(1)
Tables
(0)