-
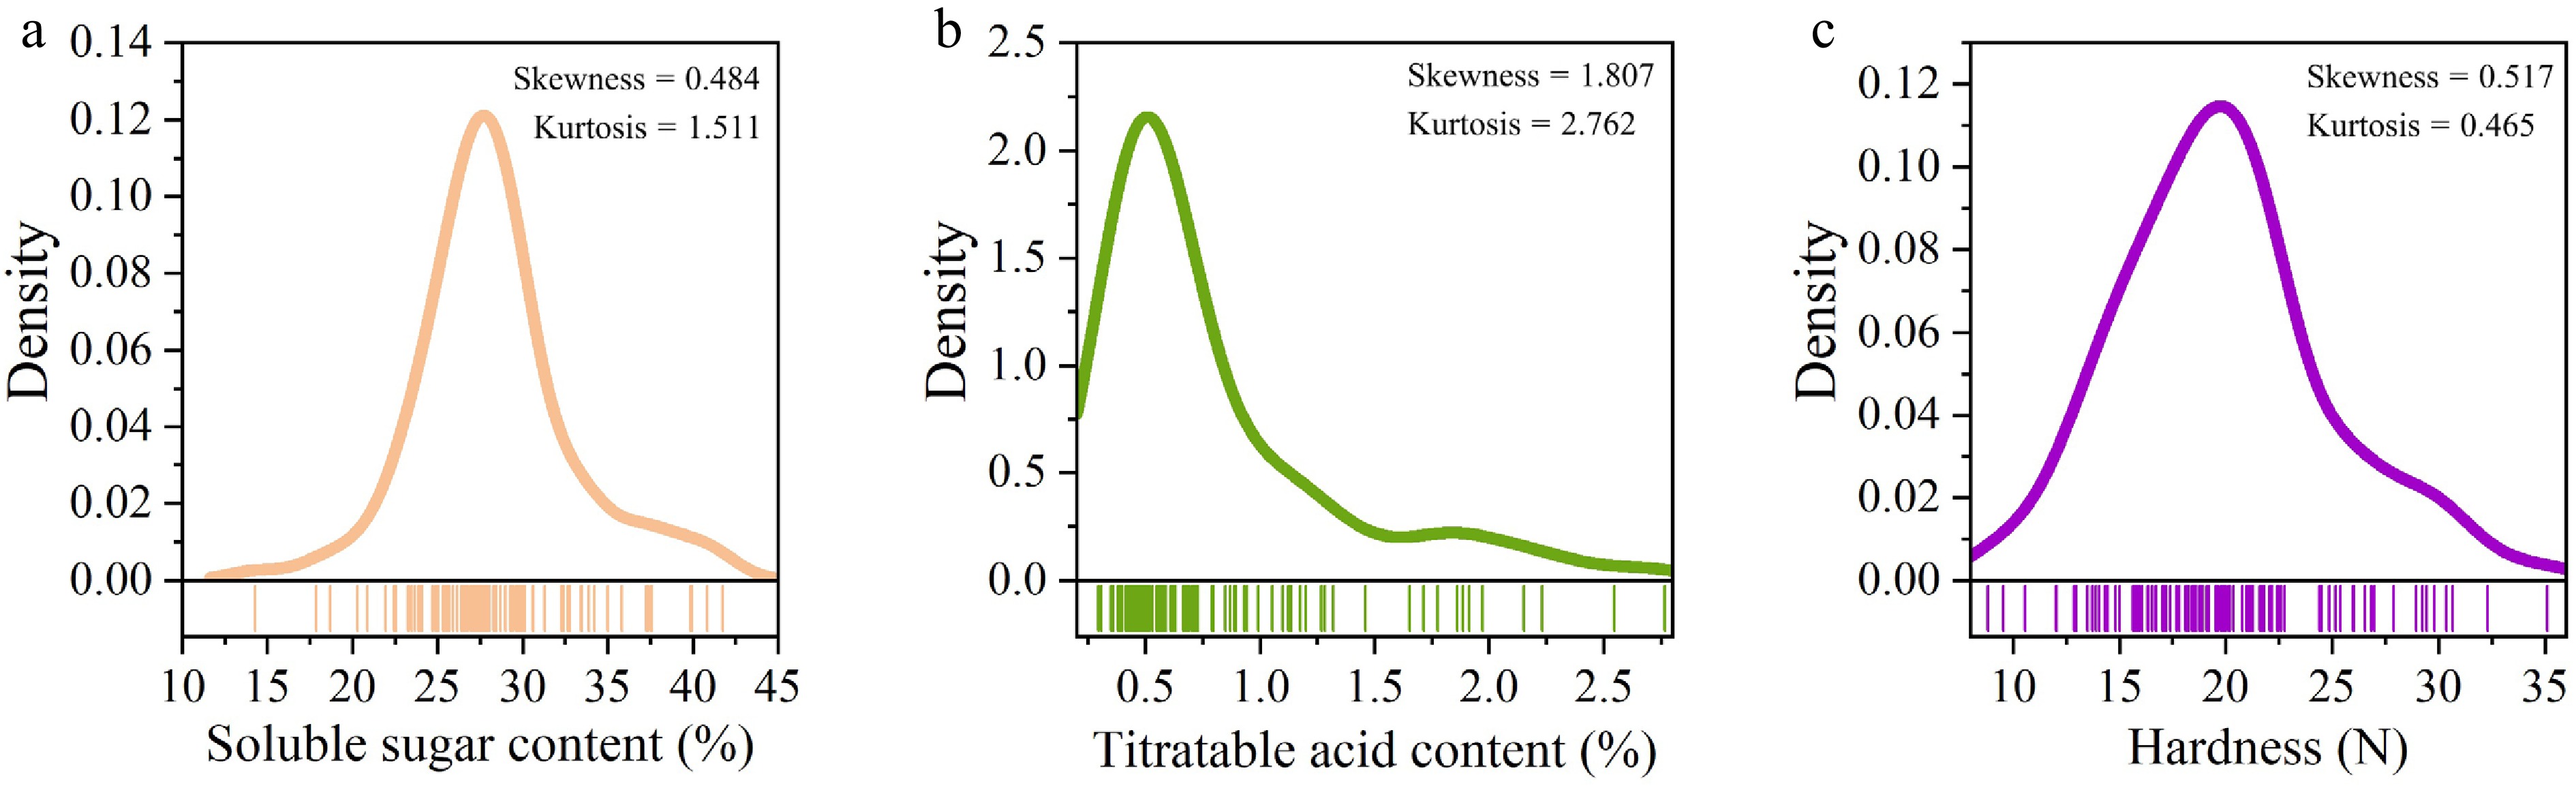
Figure 1.
Distribution map of the soluble sugar content, titratable acid content, and hardness of 109 jujube germplasms. (a) Soluble sugar content; (b) titratable acid content; (c) hardness.
-
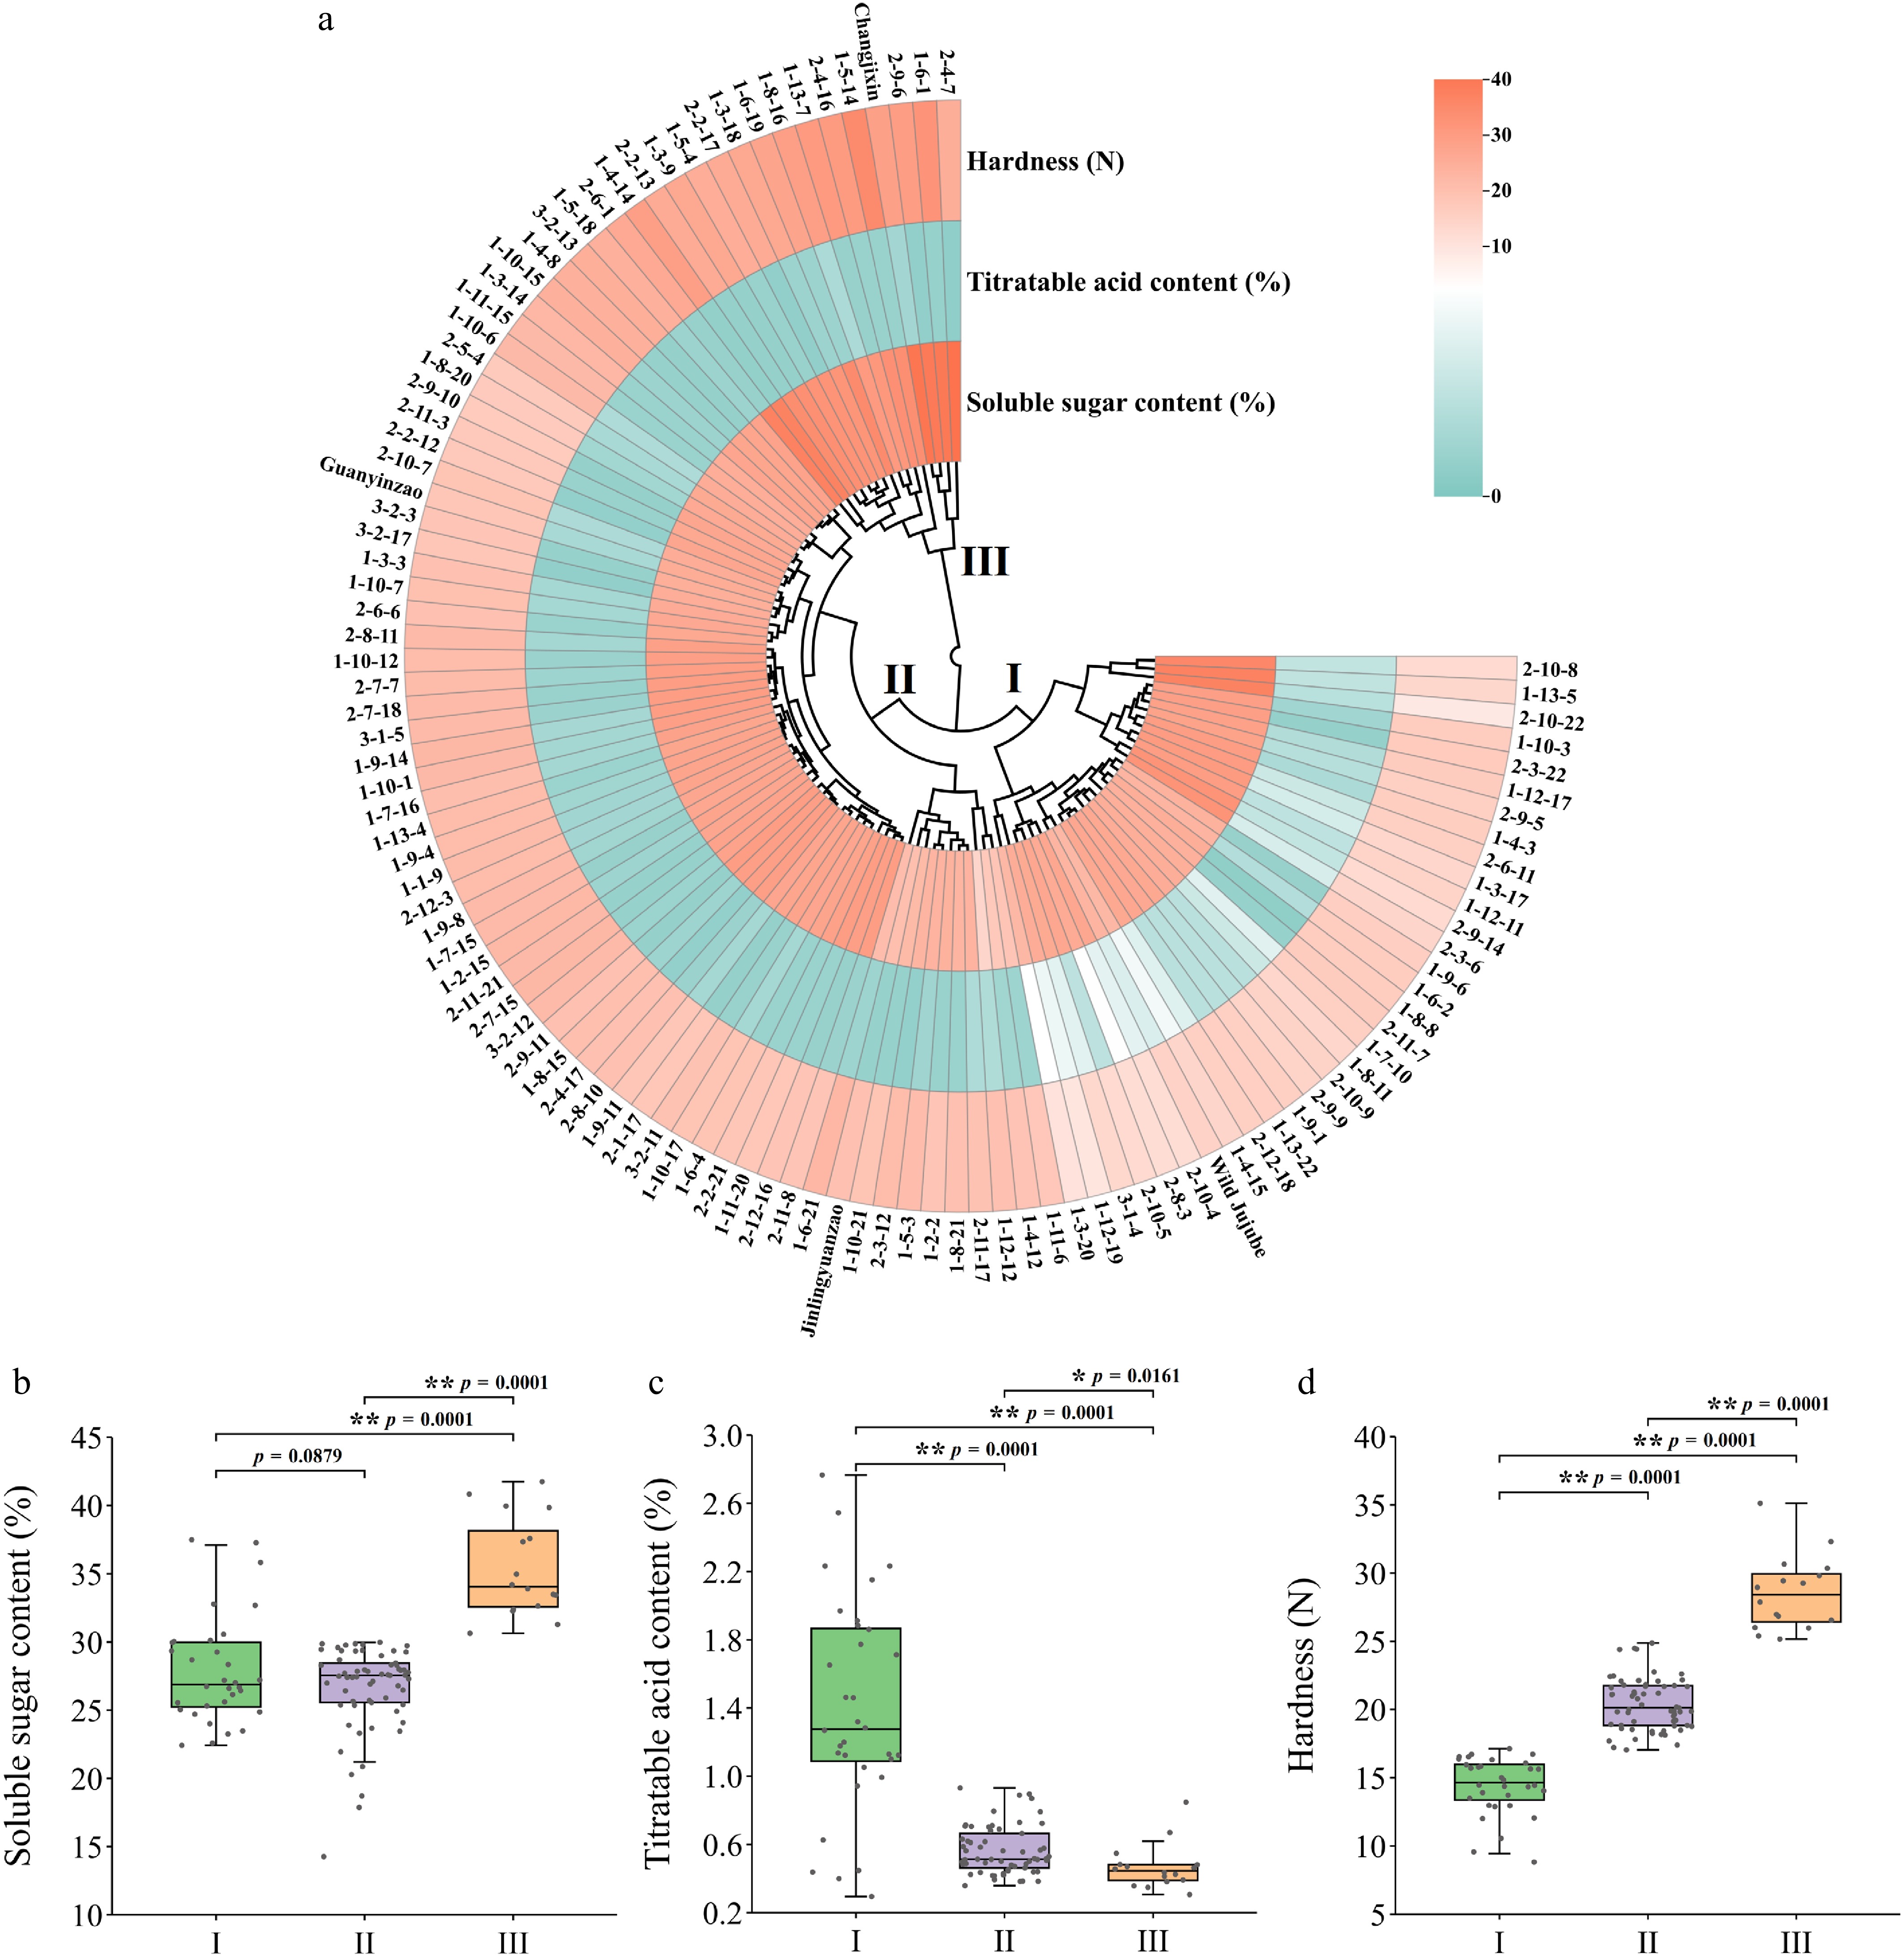
Figure 2.
Analysis of 109 jujube germplasm resources based on soluble sugar content, titratable acid content, and hardness. (a) Cluster analysis. (b) Soluble sugar content; (c) titratable acid content; (d) hardness. Statistical significance is indicated by * (p < 0.05) and ** (p < 0.01). Each point (dot) in the figure corresponds to the mean measurement for a single germplasm accession within its respective group.
-
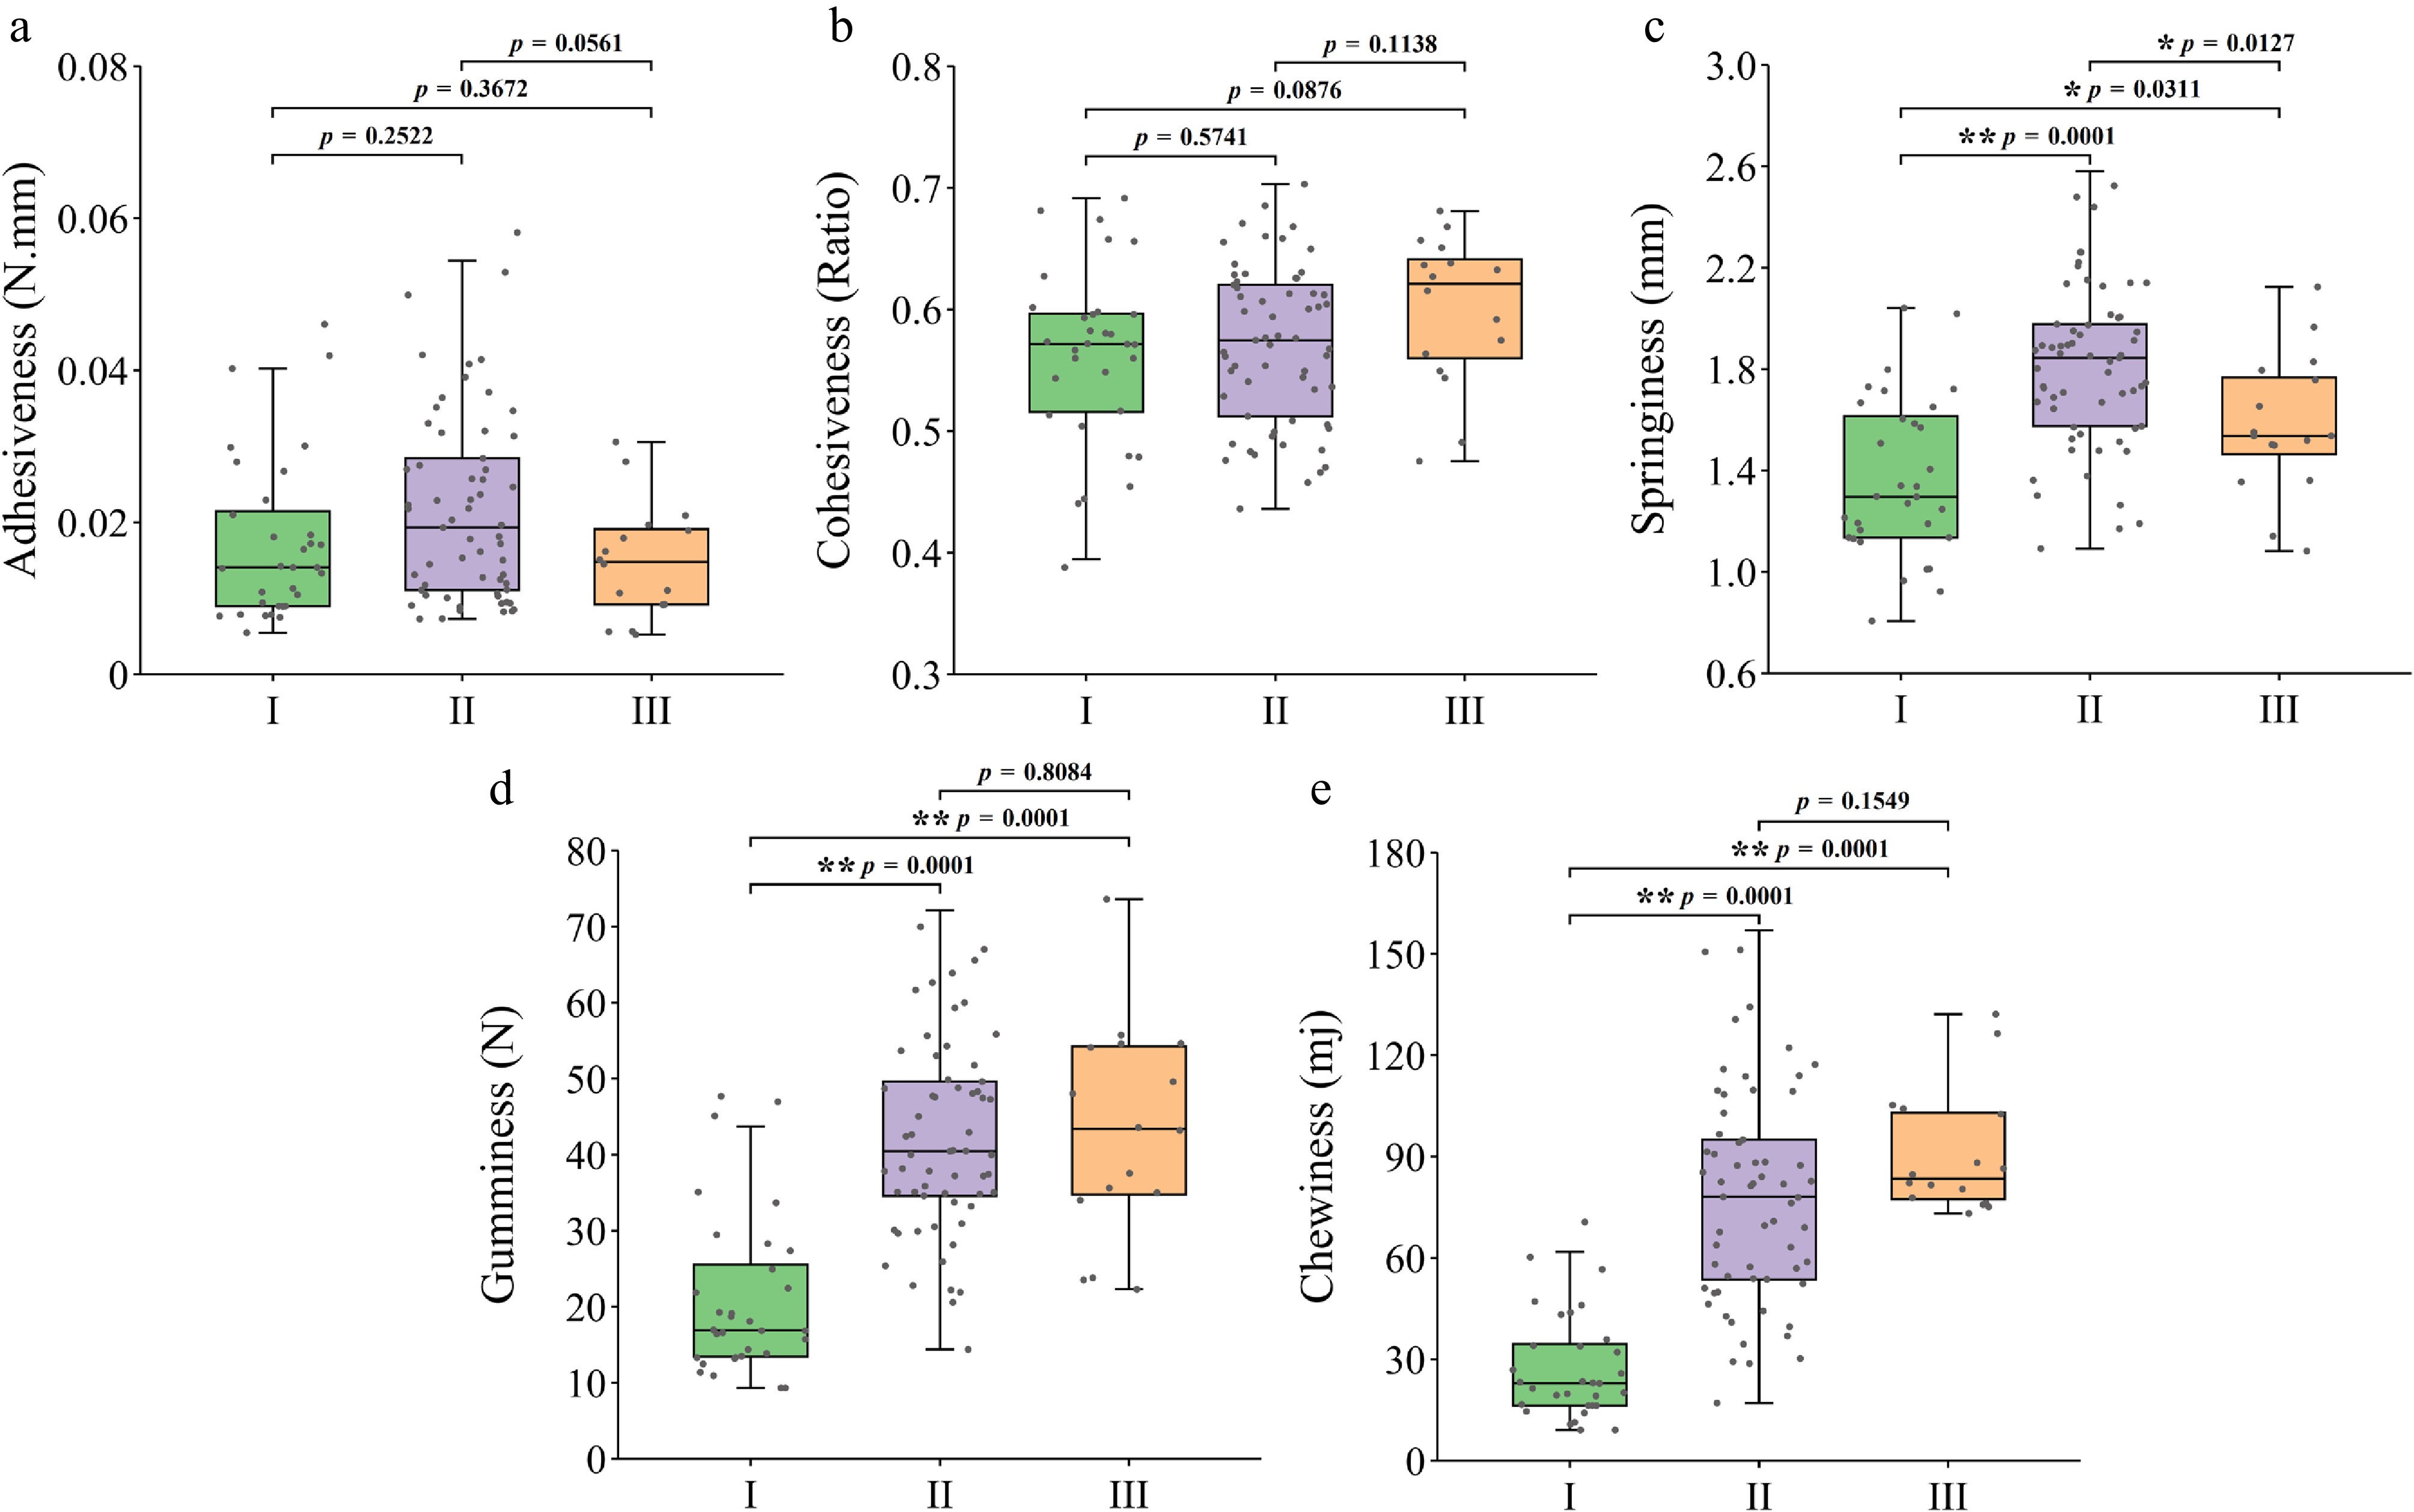
Figure 3.
Textural characteristics of jujube fruits from three groups. (a) Adhesiveness; (b) cohesiveness; (c) springiness; (d) gumminess; (e) chewiness.
-
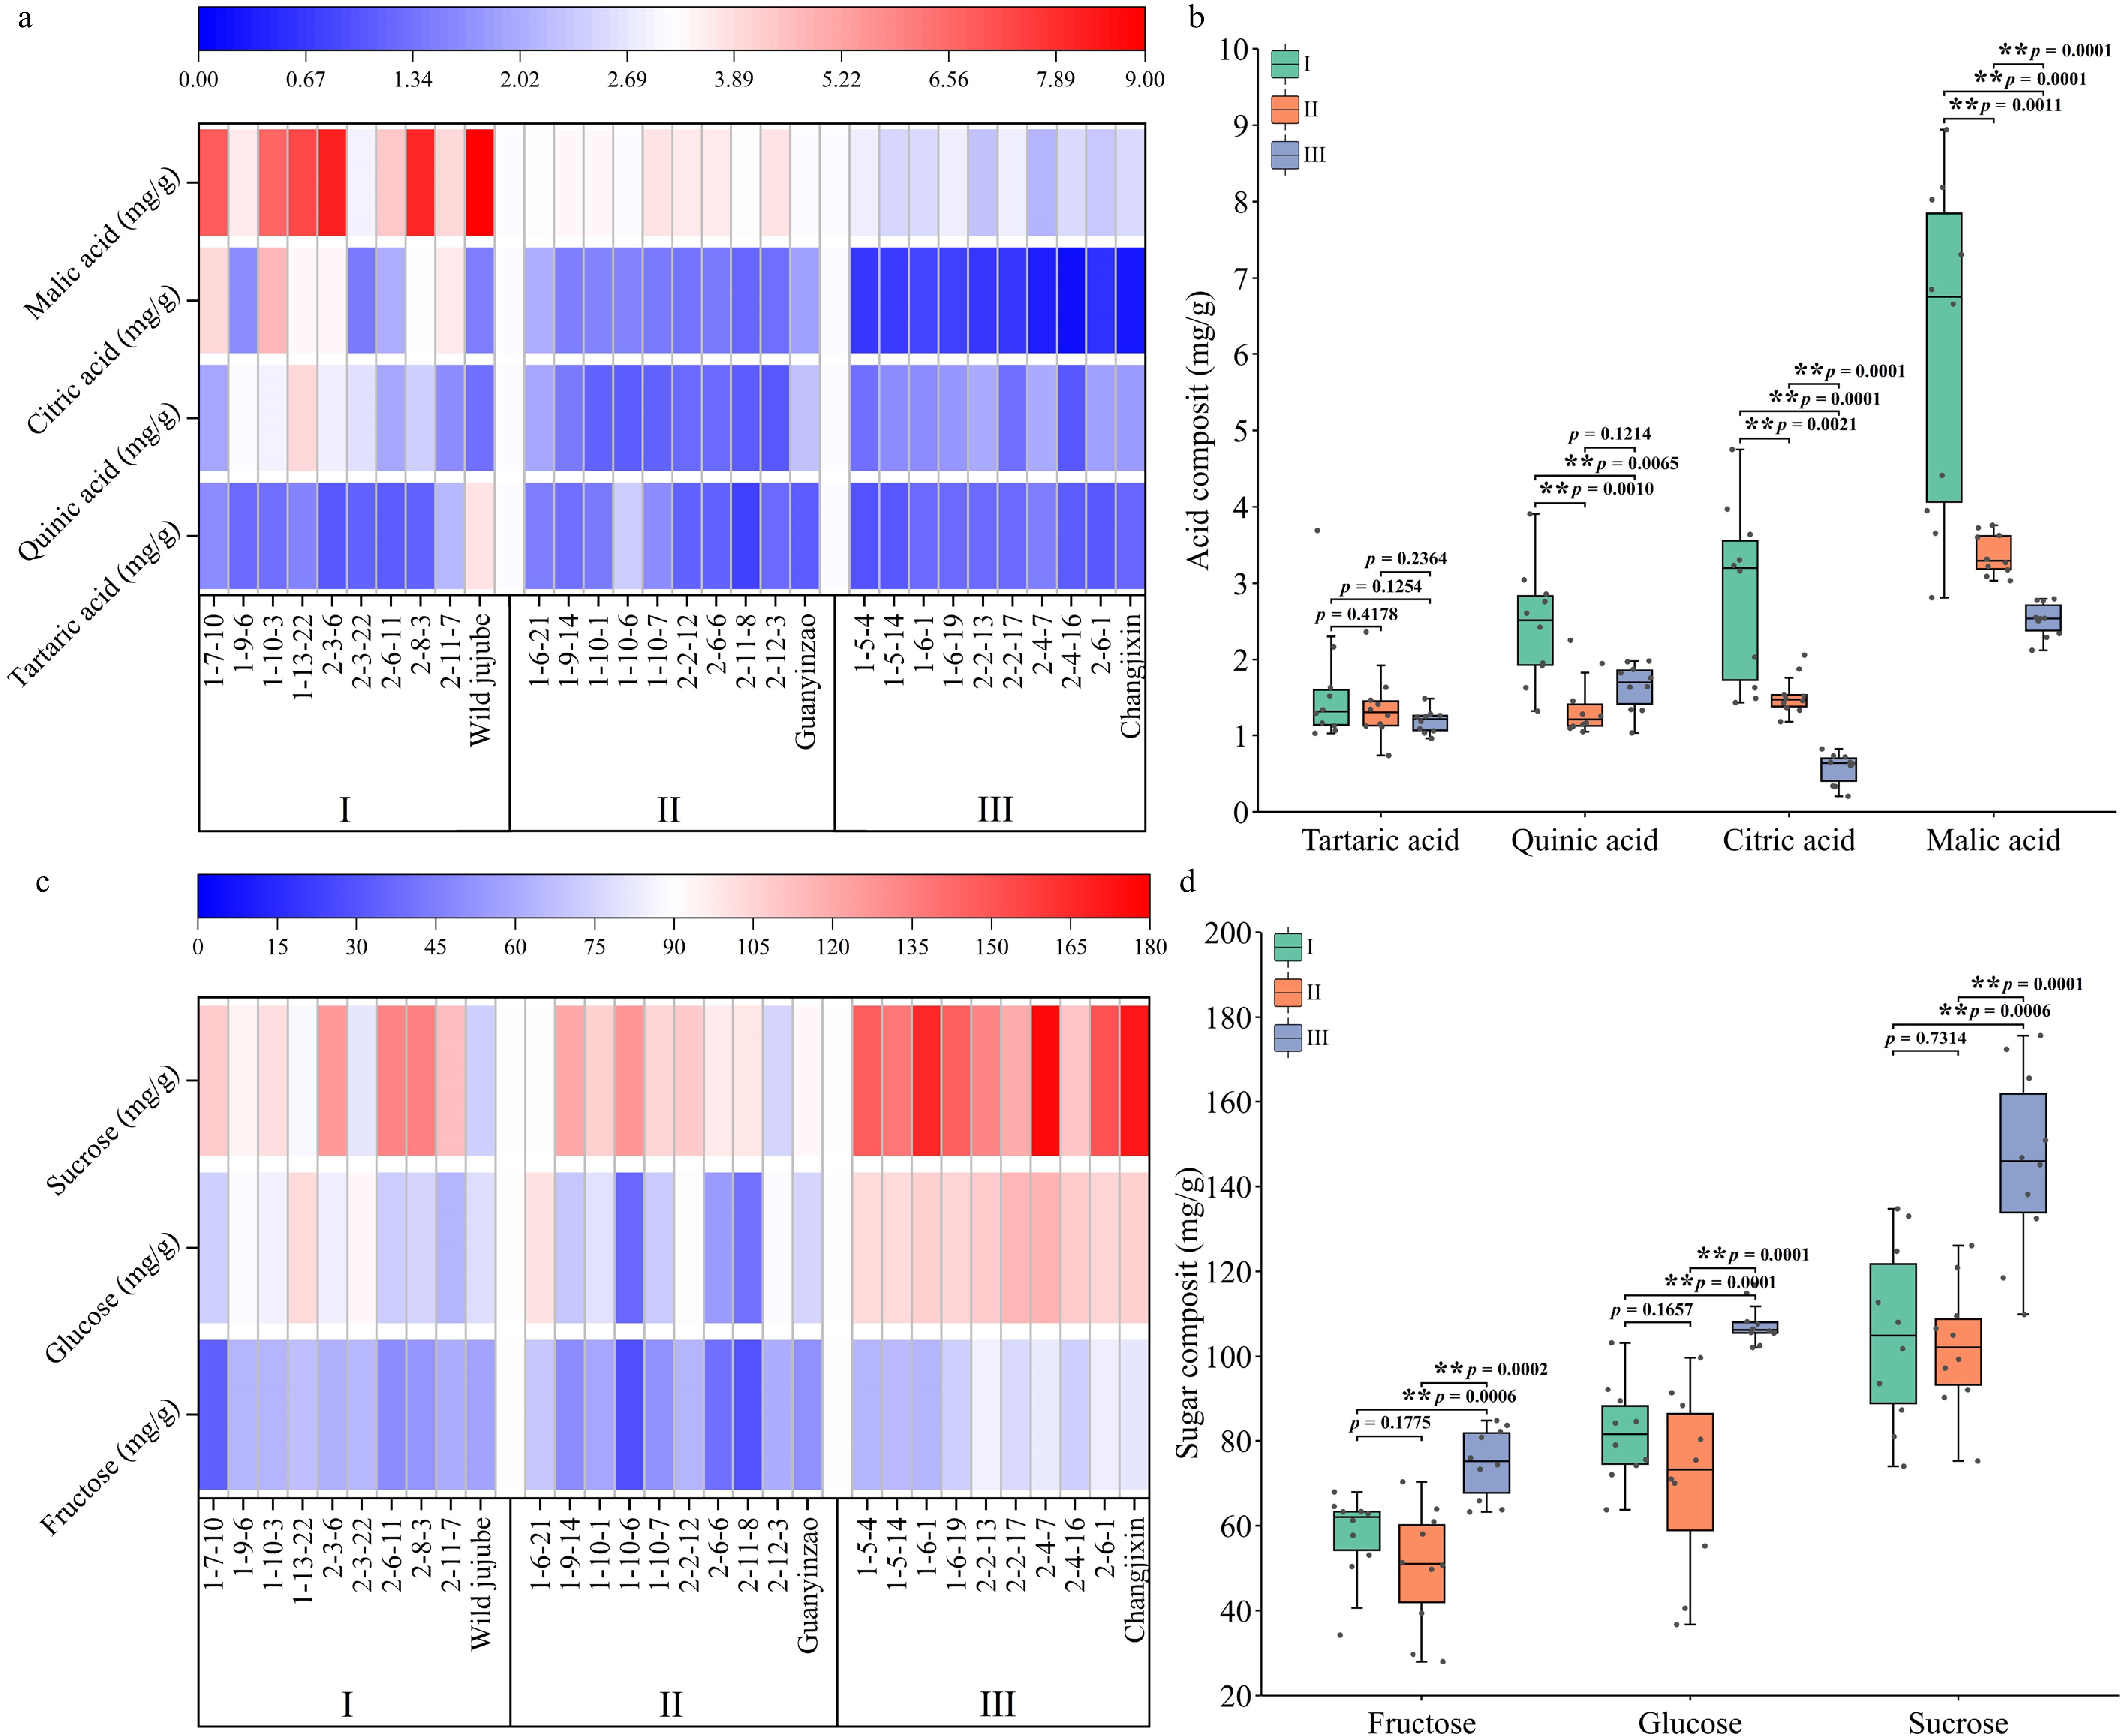
Figure 4.
Analysis of differences in sugar and organic acid components among three groups of jujube germplasm resources. (a) Heat map of organic acid components' content; (b) comparison chart of organic acid components' content; (c) heat map of sugar components' content; (d) comparison chart of sugar components' content.
-
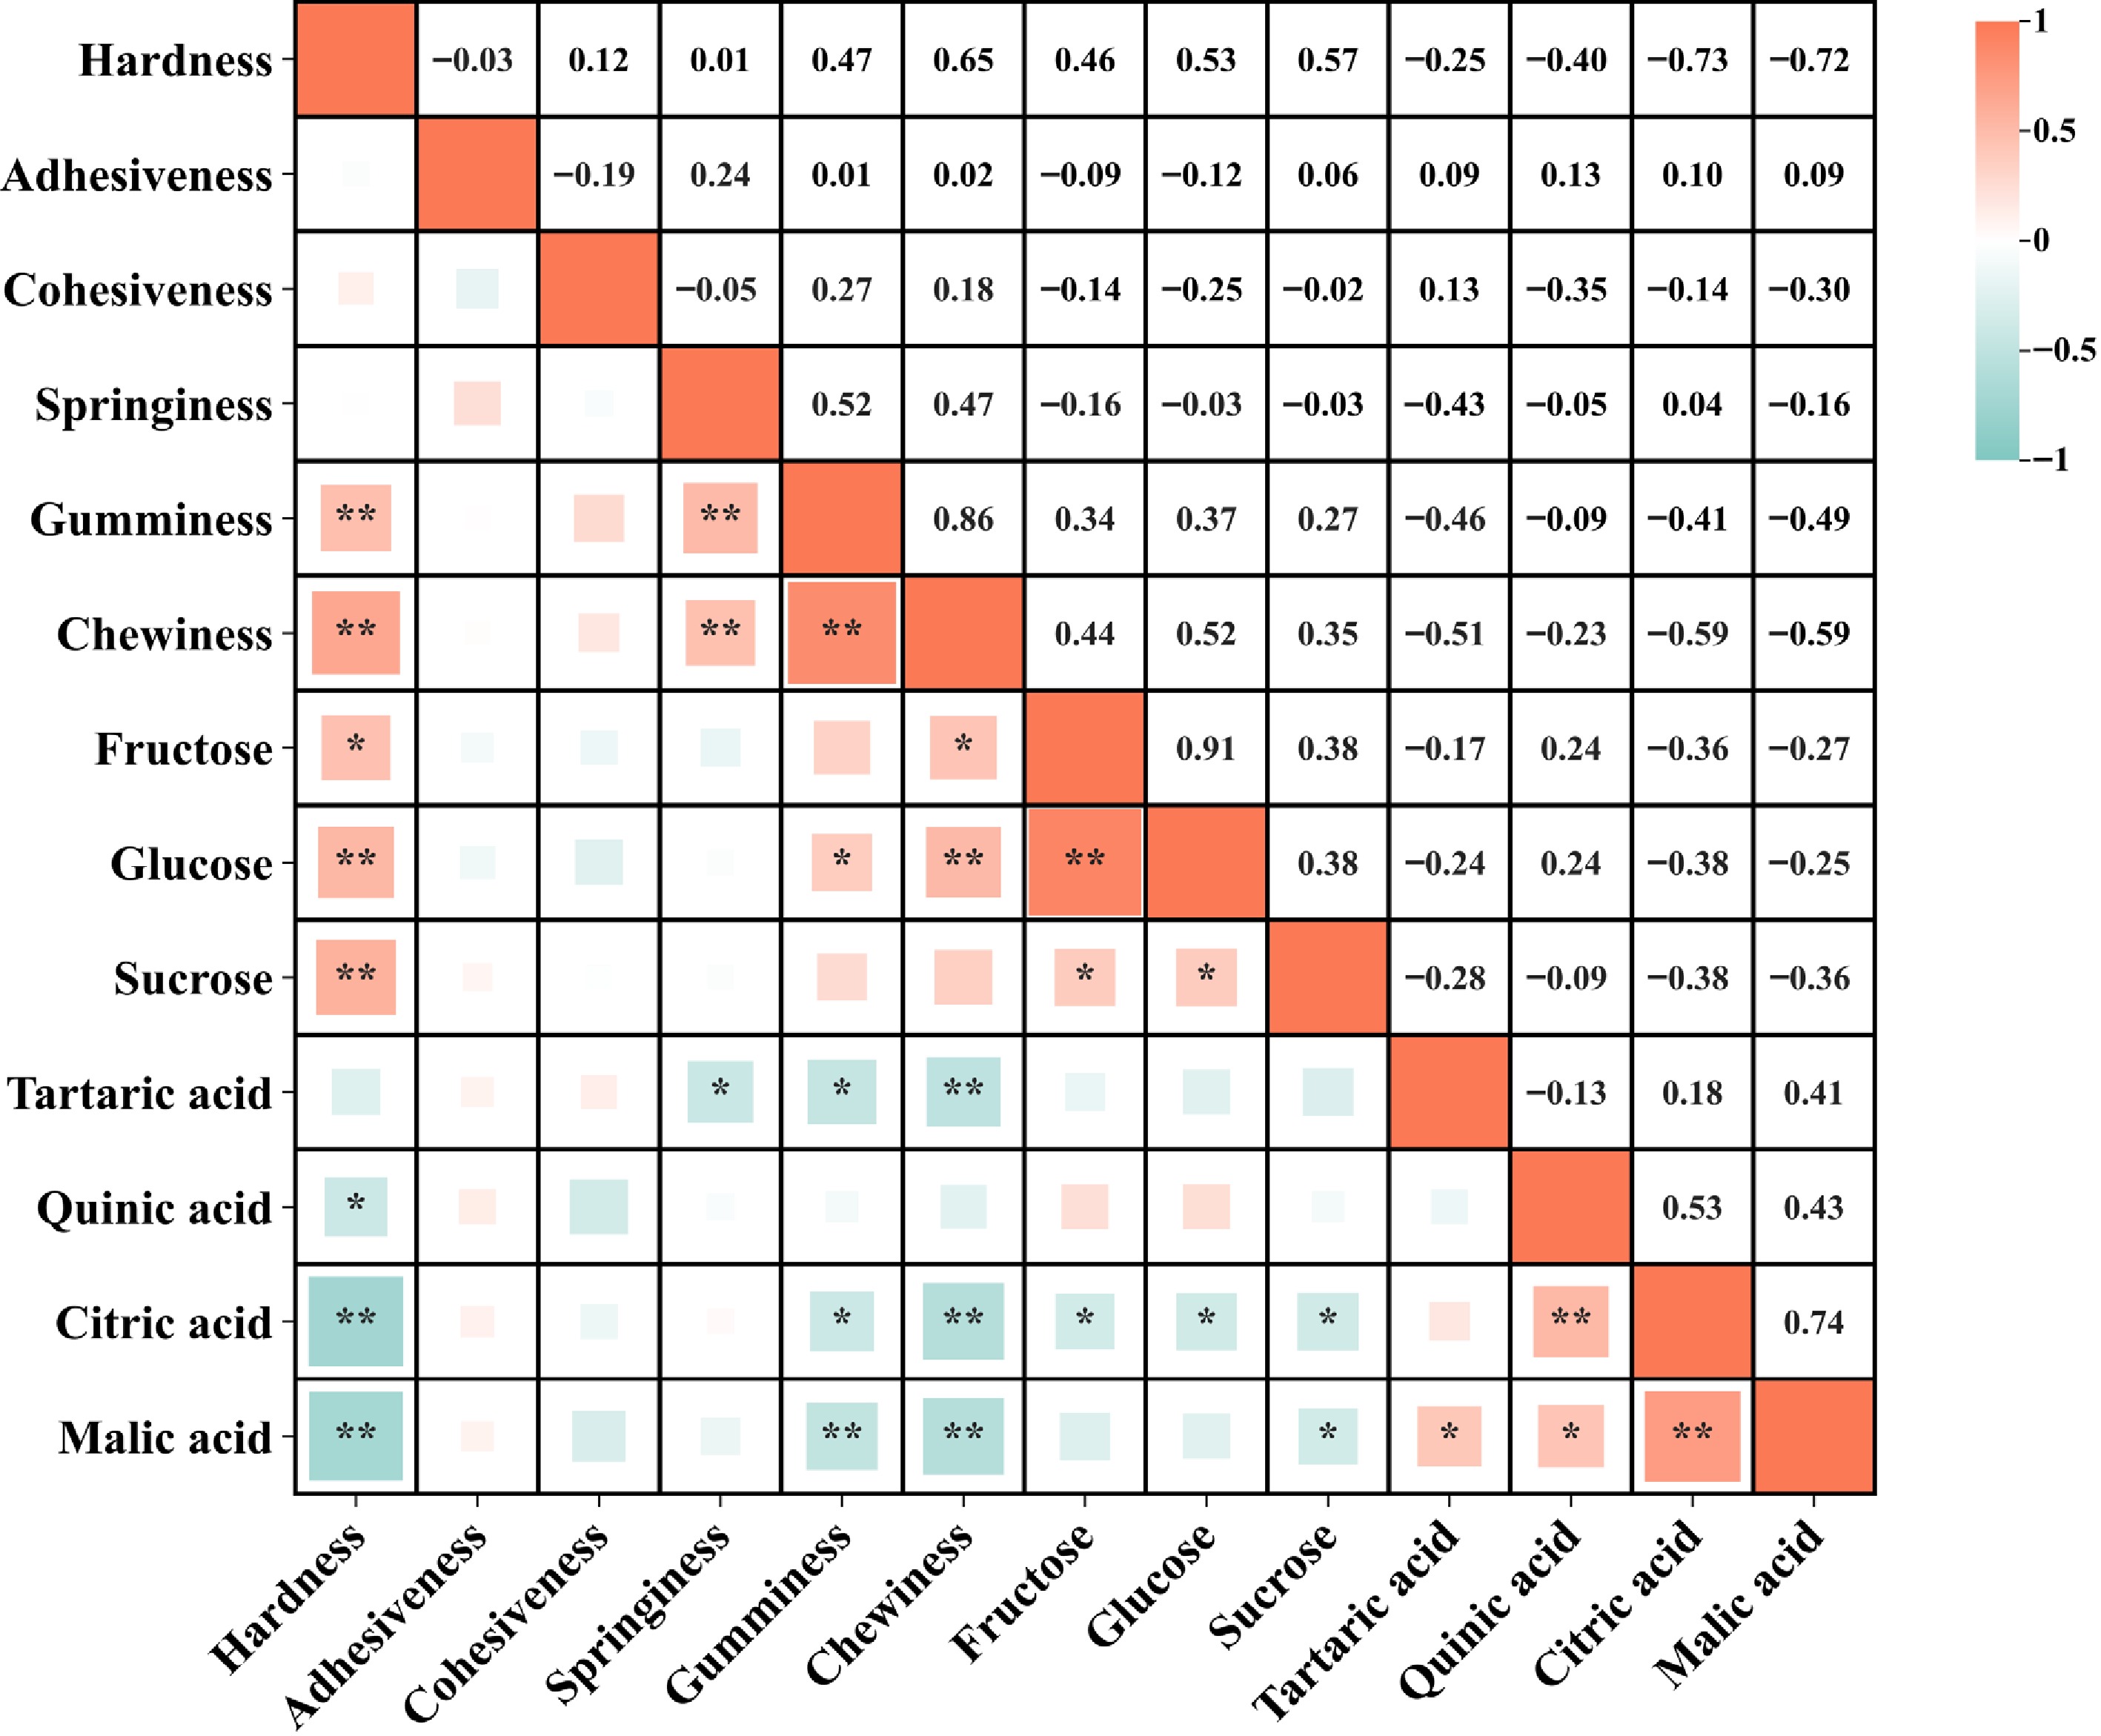
Figure 5.
Correlation analysis of sugar components, organic acid components, and textural characteristics in jujube fruits.
-
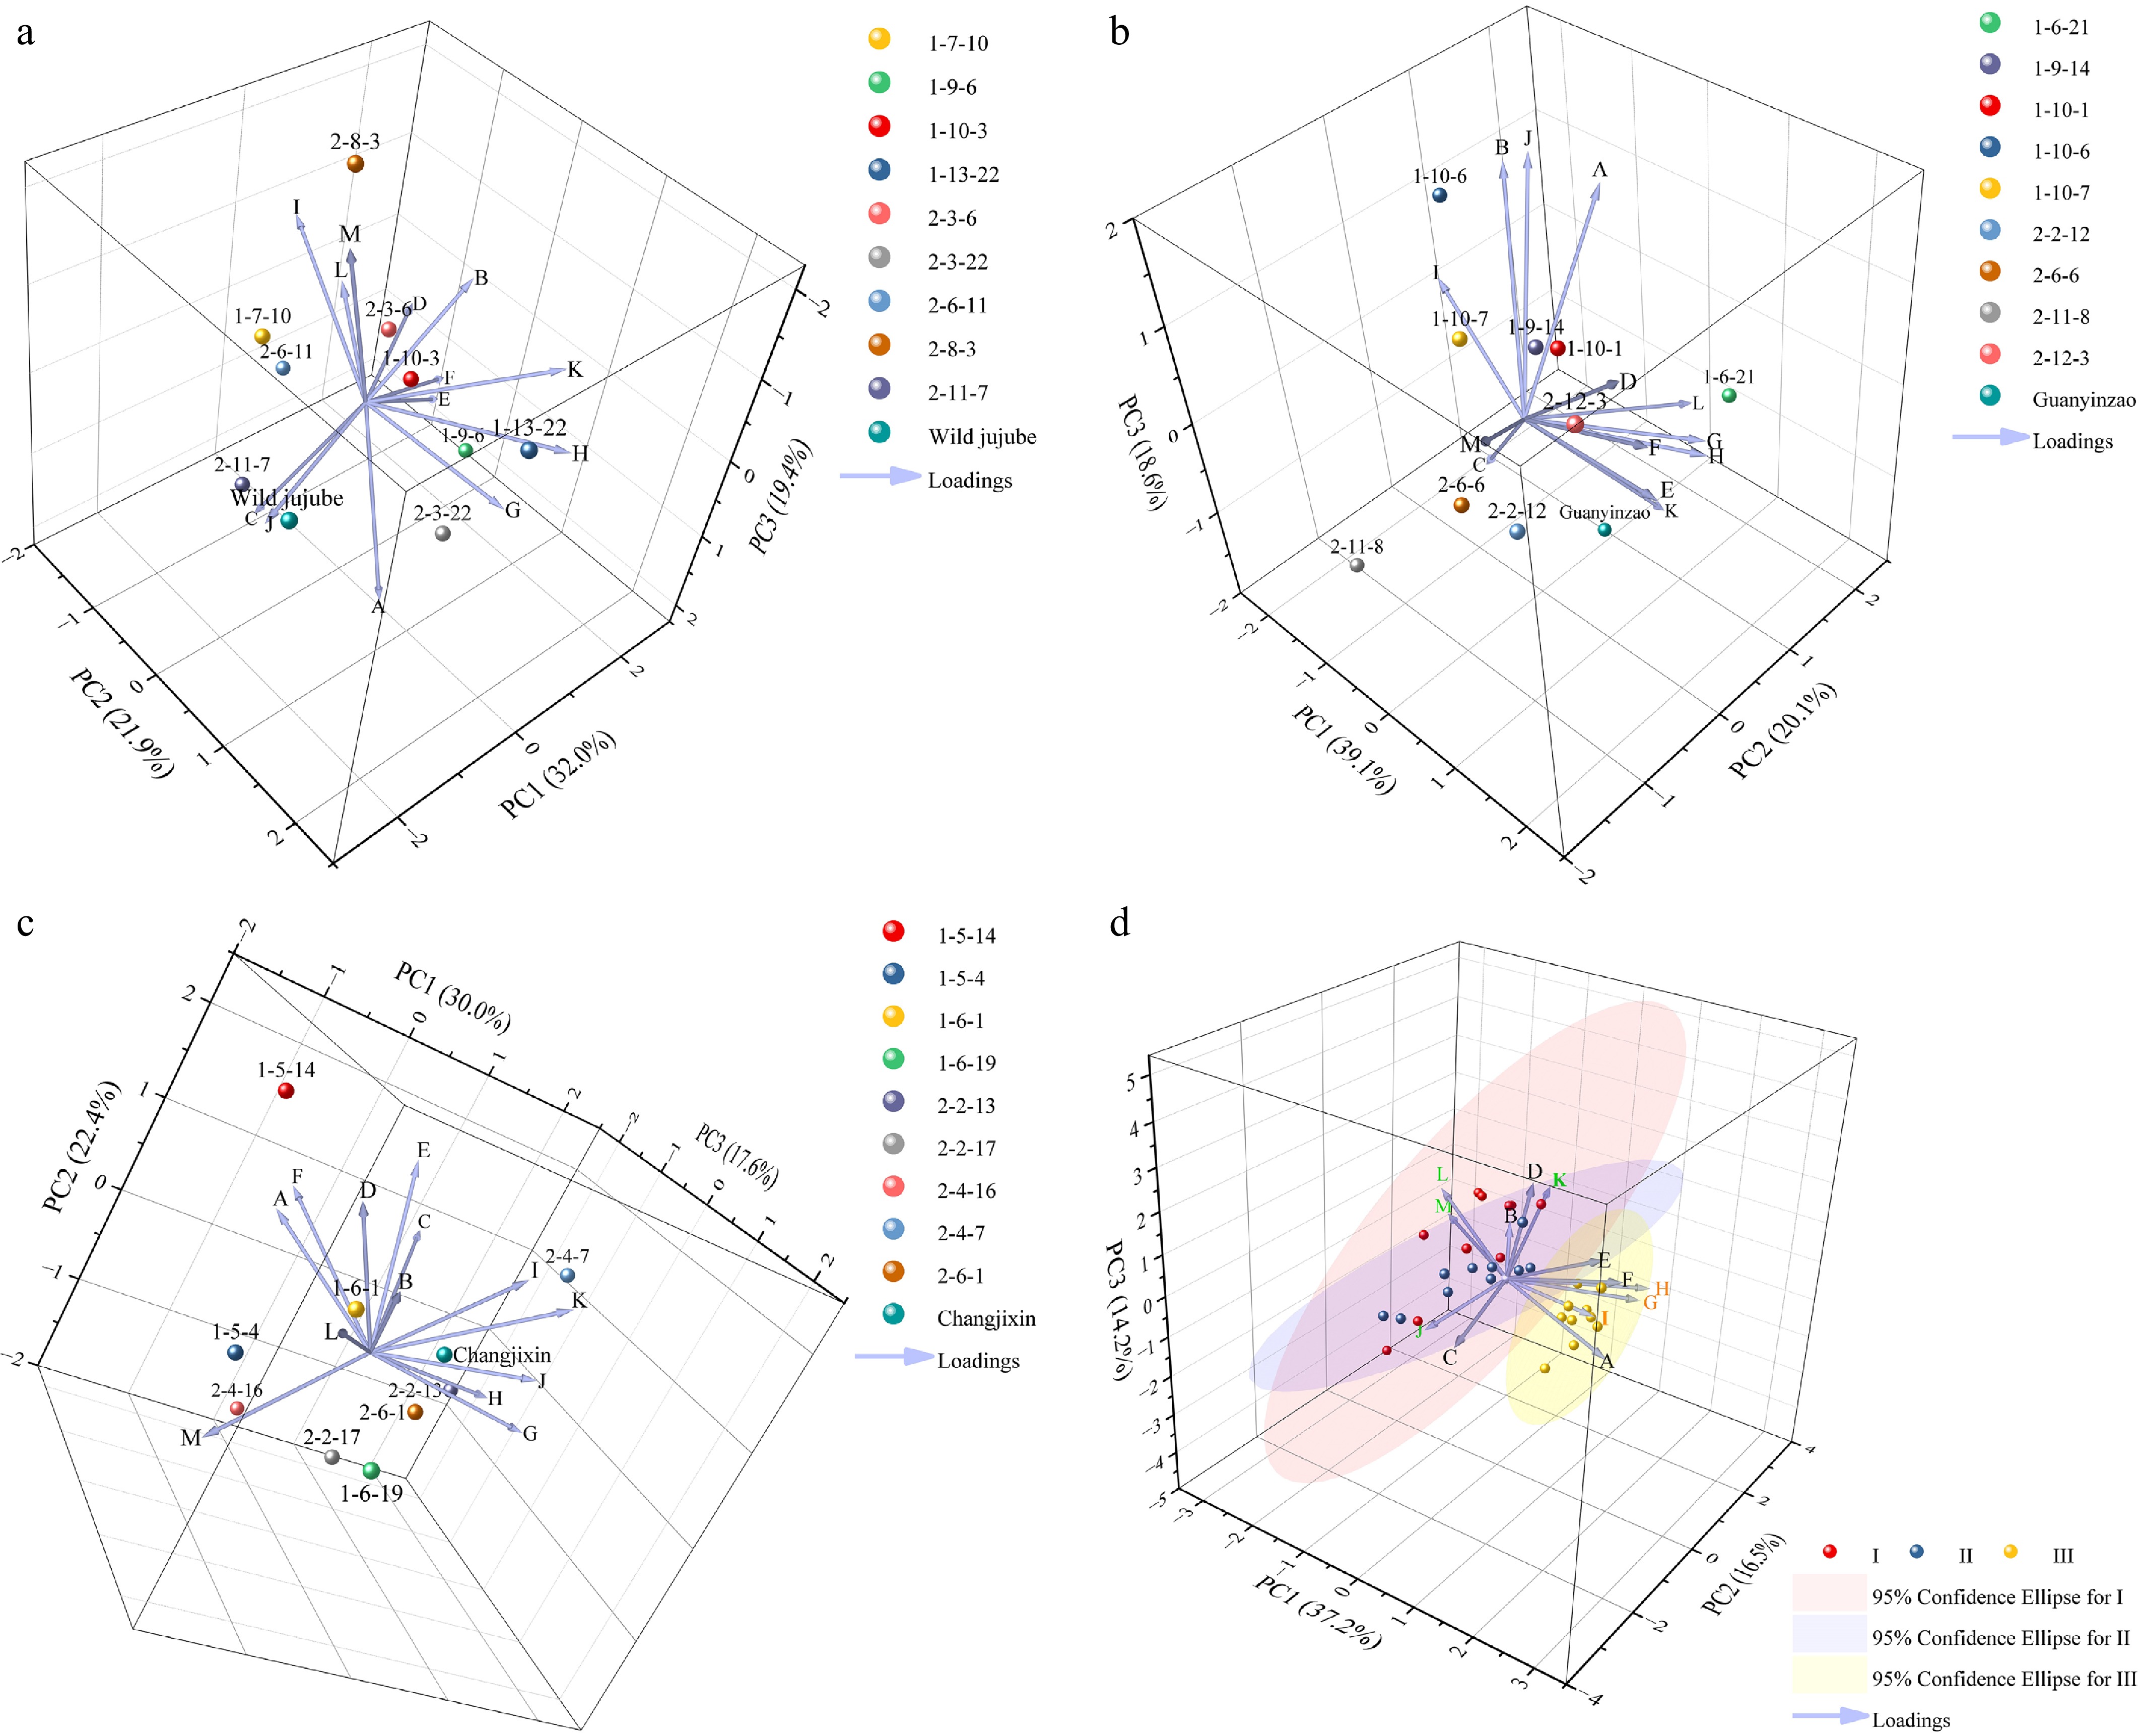
Figure 6.
Principal component analysis of the three groups of jujube fruit. A = hardness; B = adhesiveness; C = cohesiveness; D = springiness; E = gumminess; F = chewiness; G = fructose; H = glucose; I = sucrose; J = tartaric acid; K = quinic acid; L = citric acid; M = malic acid. (a) PCA of Group I; (b) PCA of Group II; (c) PCA of Group III; (d) PCA of all jujube germplasms.
-
Indicator Maximum Minimum Average
valueRange Standard
deviationCoefficient of
variation (%)Soluble sugar content (%) 41.74 14.27 28.28 27.48 4.59 16.22 Titratable acid content (%) 2.77 0.29 0.79 2.47 0.53 66.53 Hardness (N) 35.12 8.82 19.84 26.30 4.94 24.92 Table 1.
Statistical analysis and coefficients of variation for sugar, acid, and hardness in 109 jujube germplasm accessions.
Figures
(6)
Tables
(1)