-
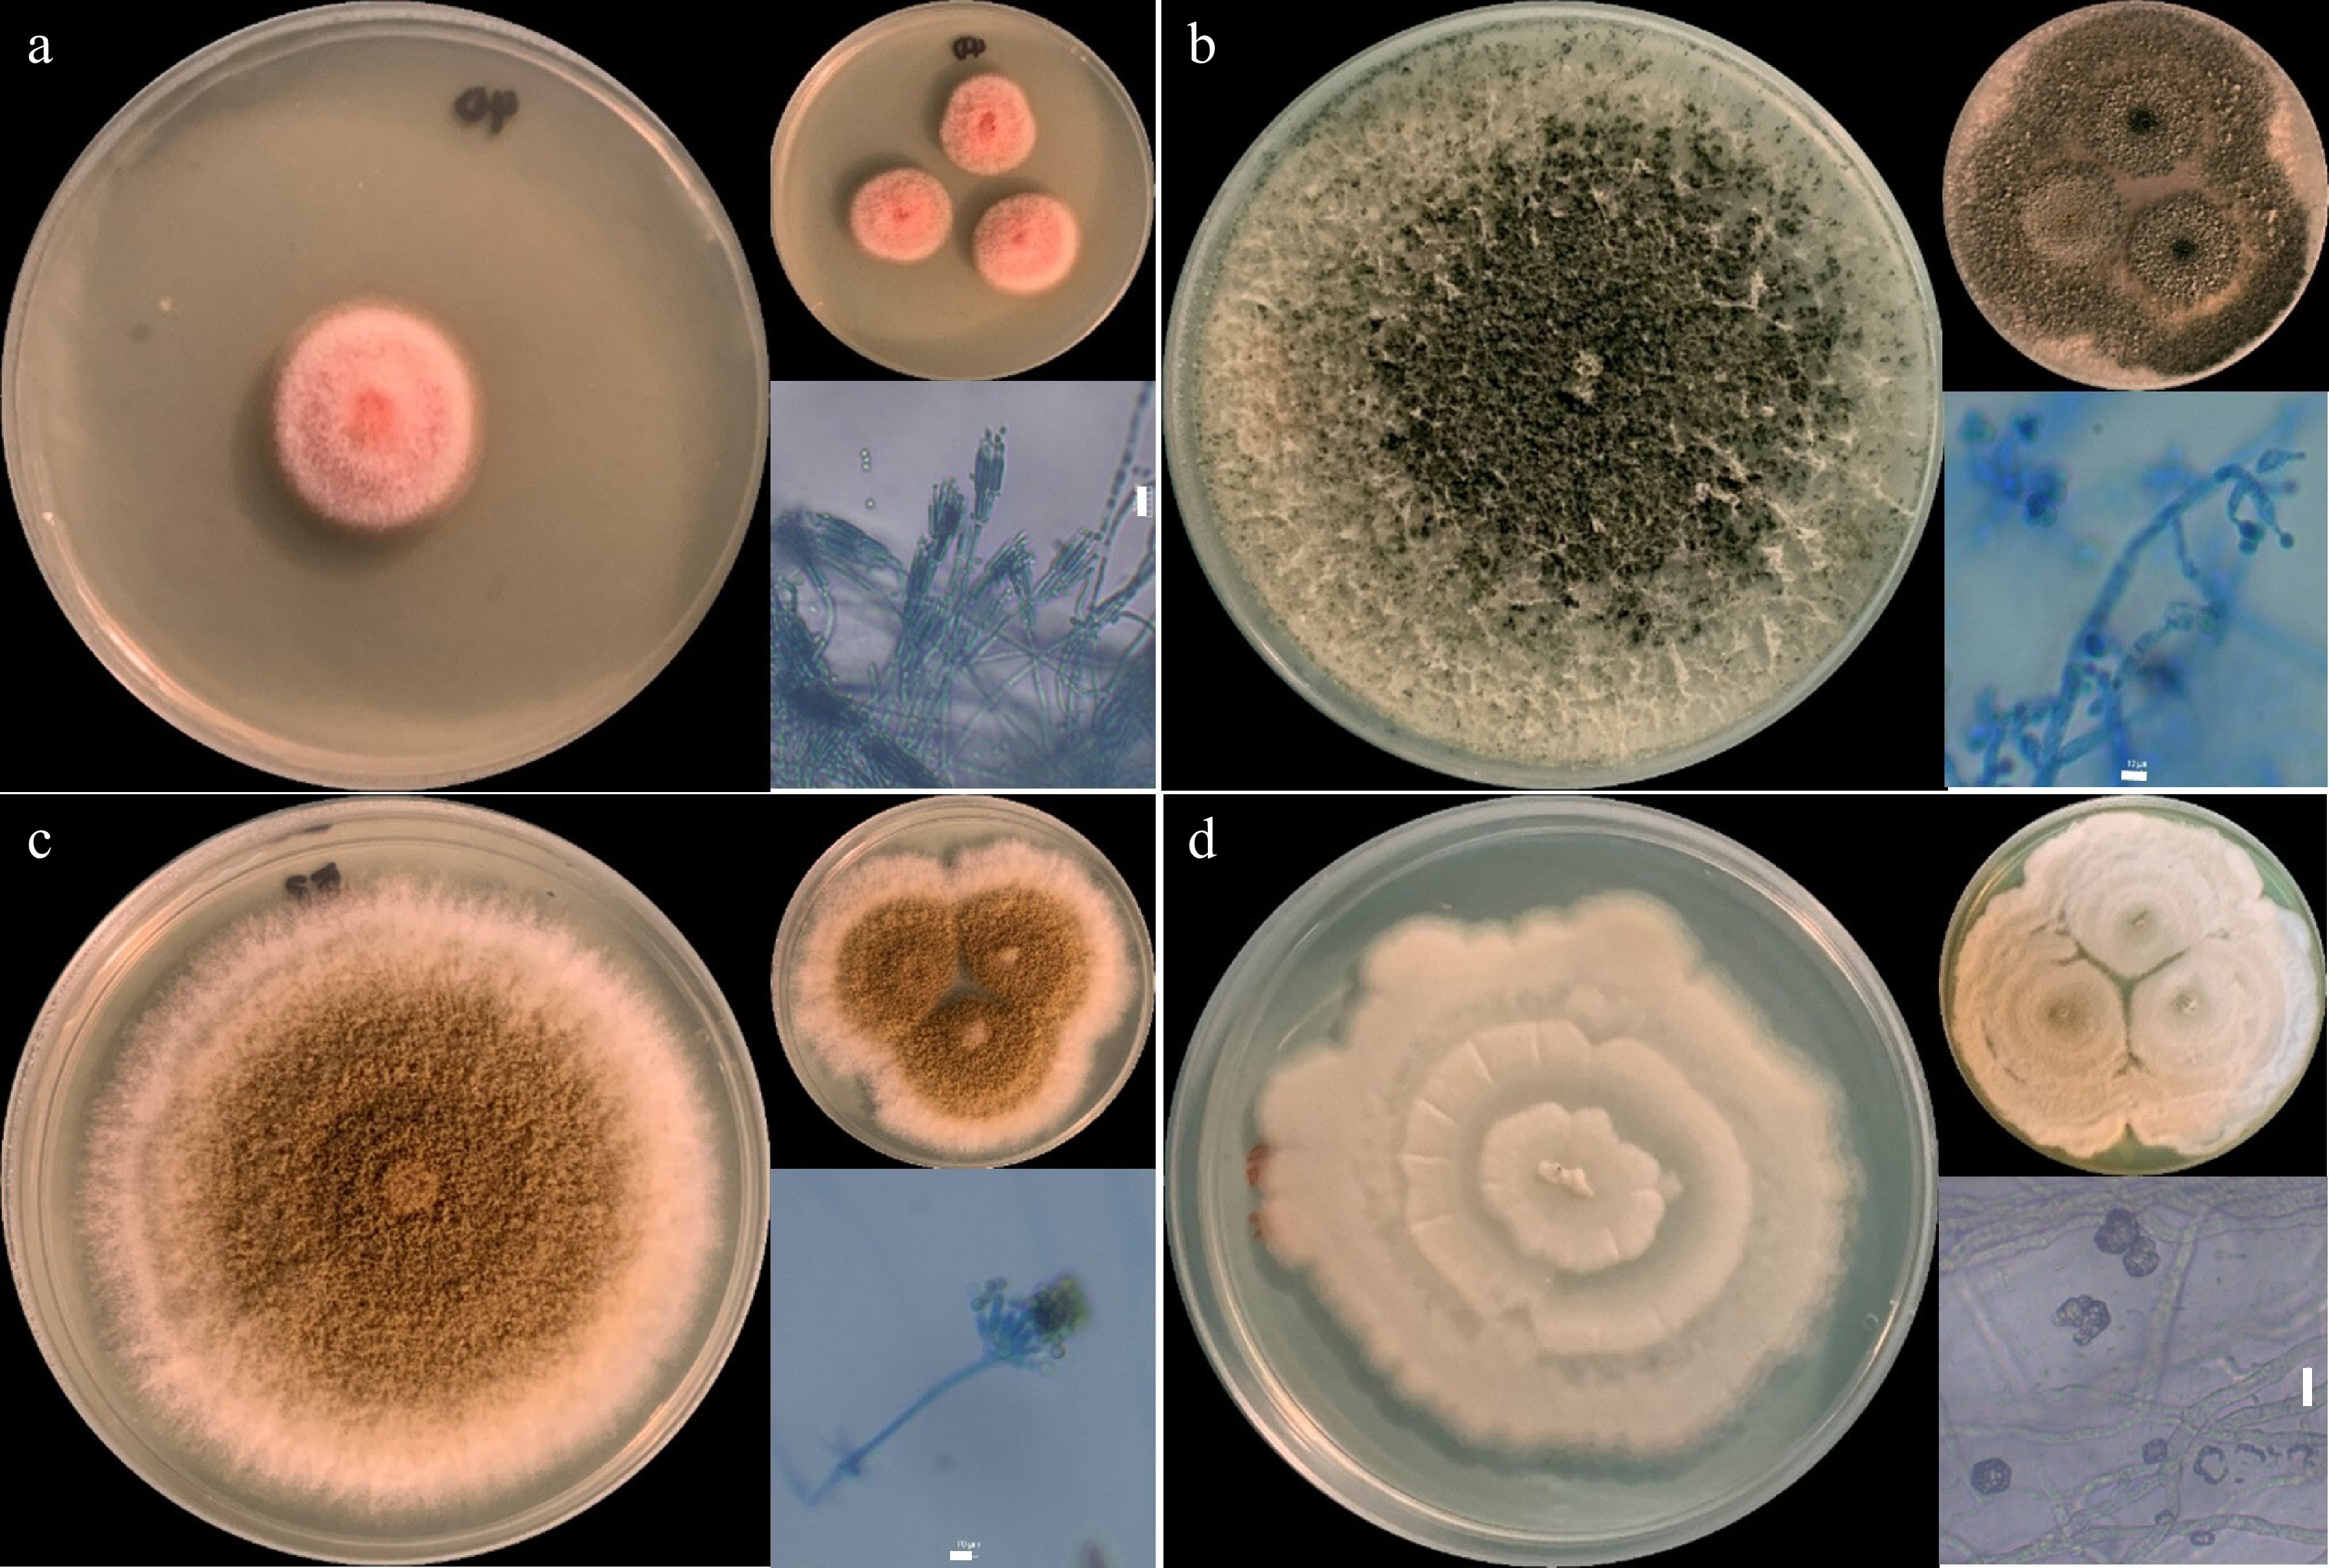
Figure 1.
Fungal isolates. (a) Talaromyces sp., (b) Trichoderma sp., (c) Aspergillus sp., and (d) Actinomortierella sp., showing one-point and three-point cultures in PDA after 7 d of incubation. Microscopic asexual fruiting structures are also shown. Scale bar = 10 µm.
-
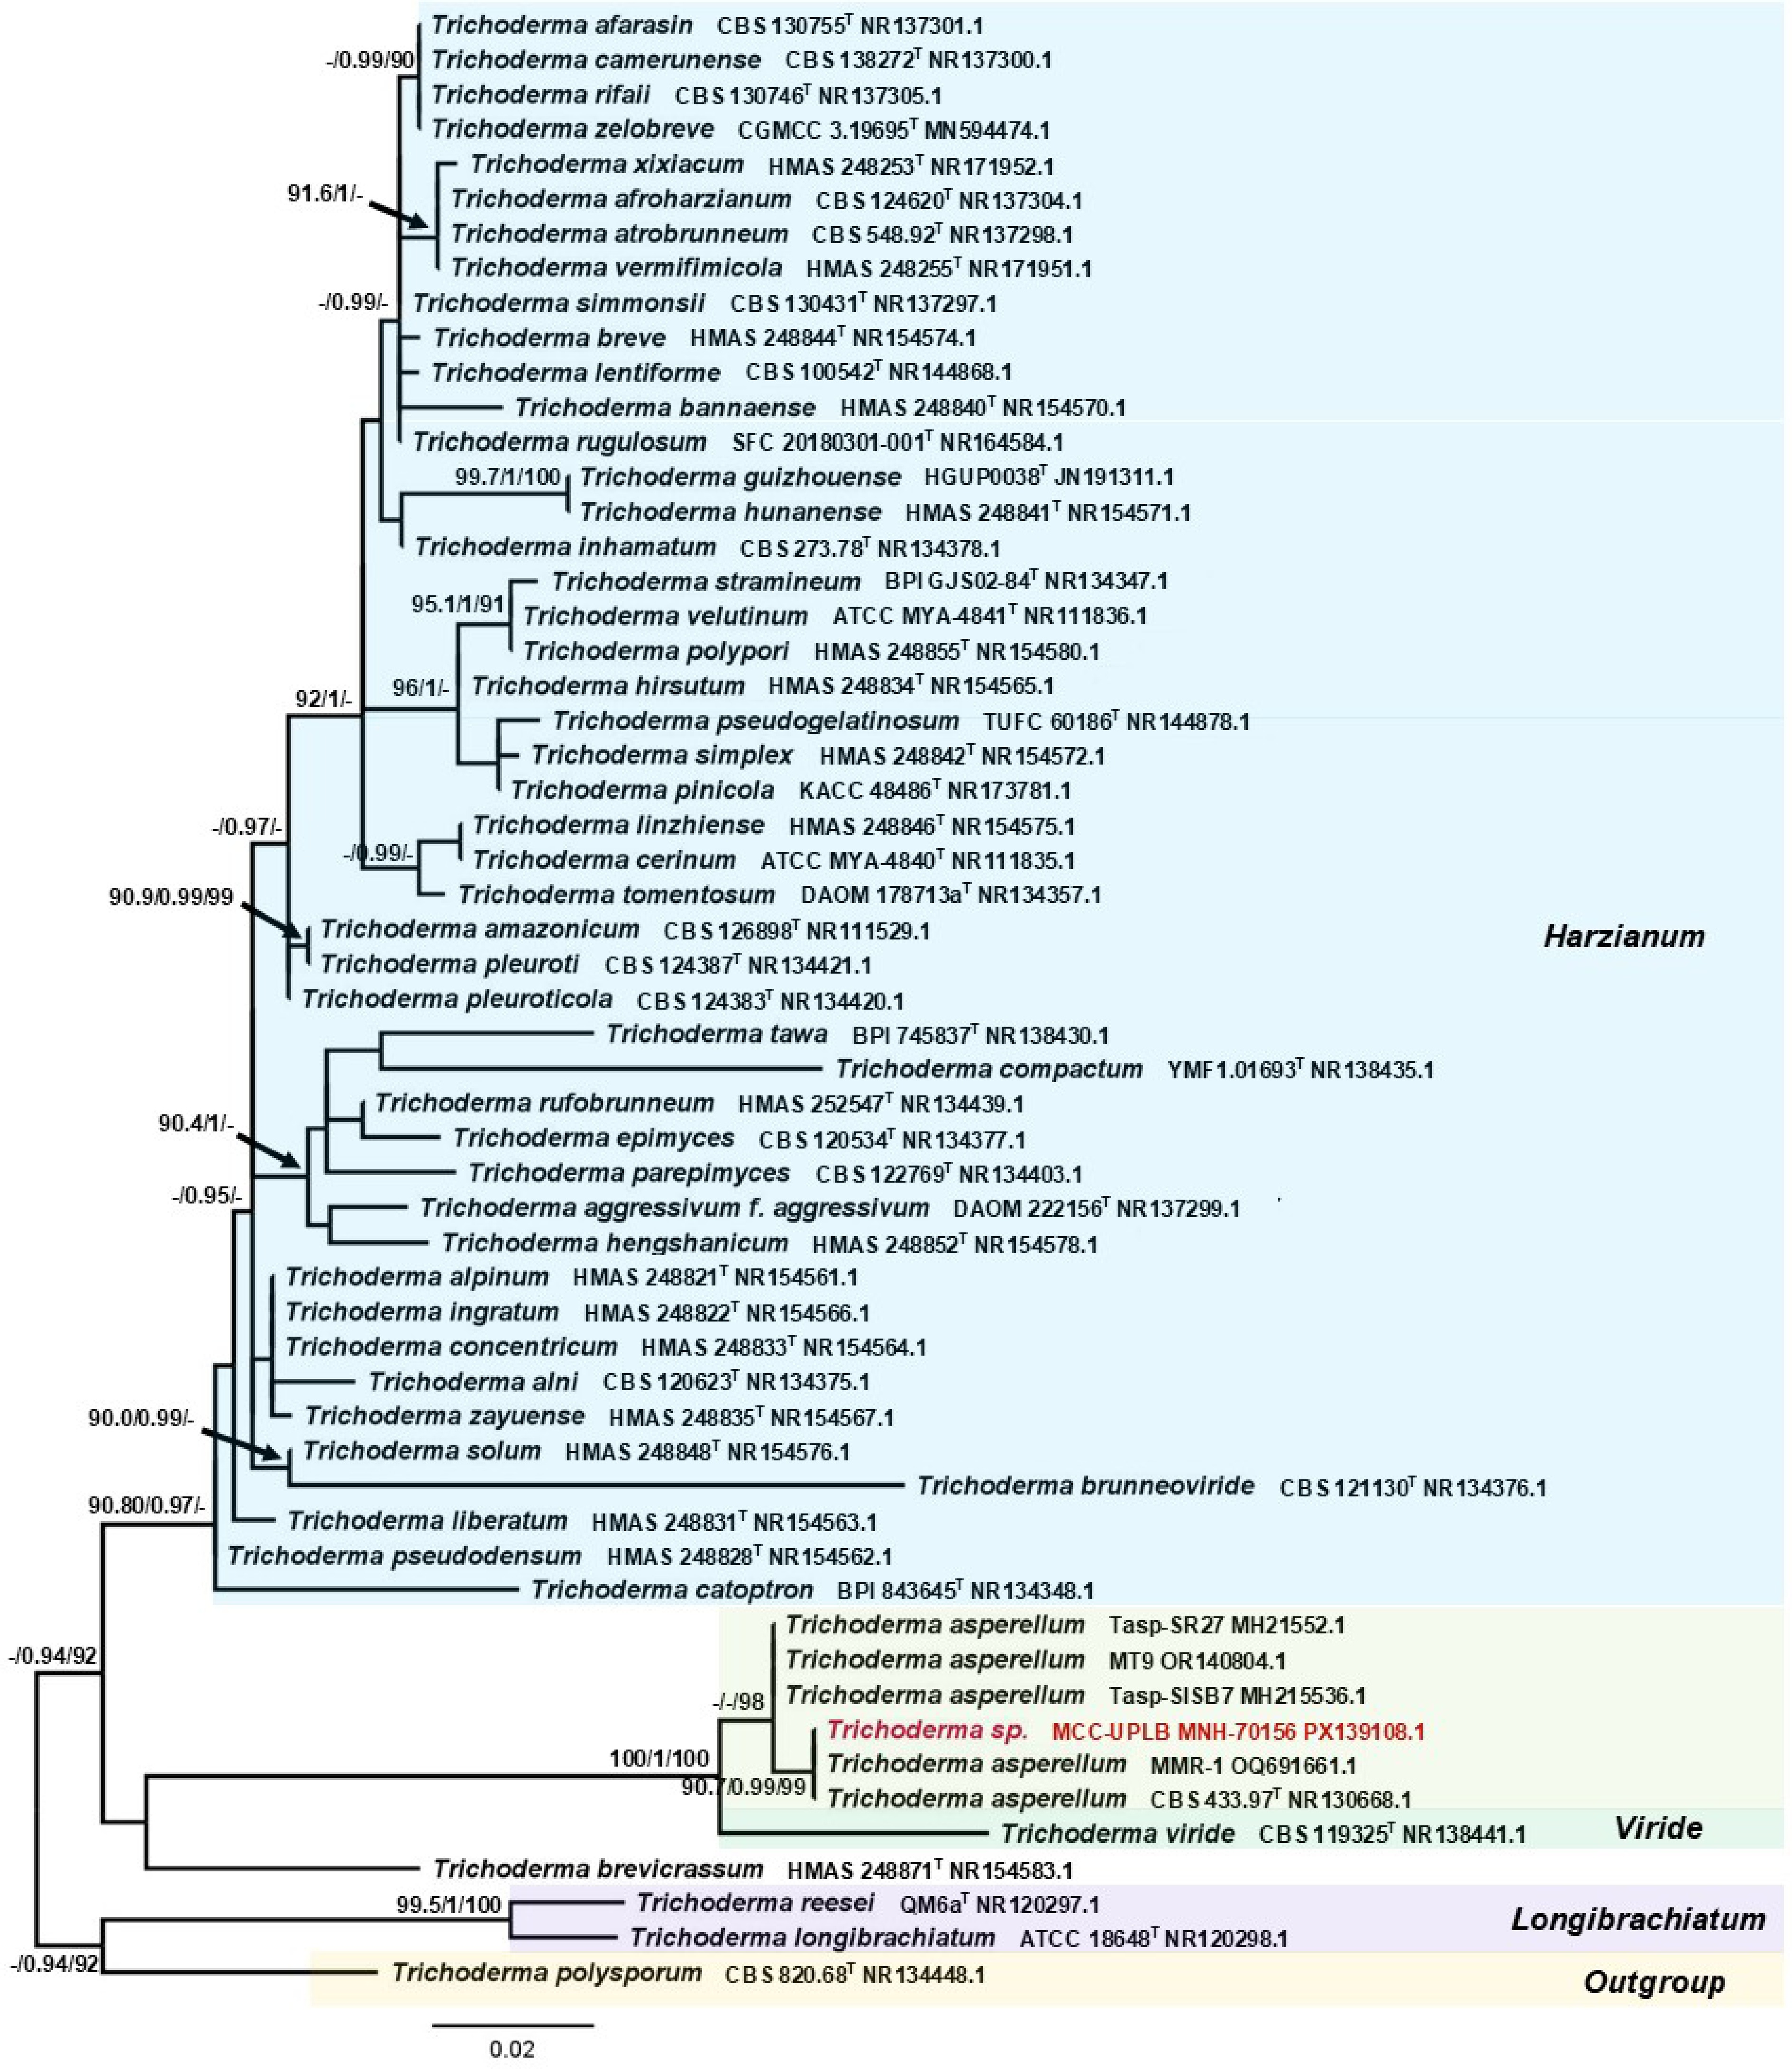
Figure 2.
Phylogenetic tree inferred using the ITS1-5.8S-ITS2 sequence showing the relationships of Trichoderma sp. MCC-UPLB MNH-70156 with representative reference strains (type strains are denoted byT) under the genus Trichoderma. Support in nodes is provided by SH-aLRT, aBayes, and UFBoot, where values ≥ 90%, ≥ 0.90, and ≥ 90%, respectively, are shown (a dashed line indicates lower values). Tip labels are scientific names followed by strain, then Accession number. The bar indicates the number of substitutions per site.
-
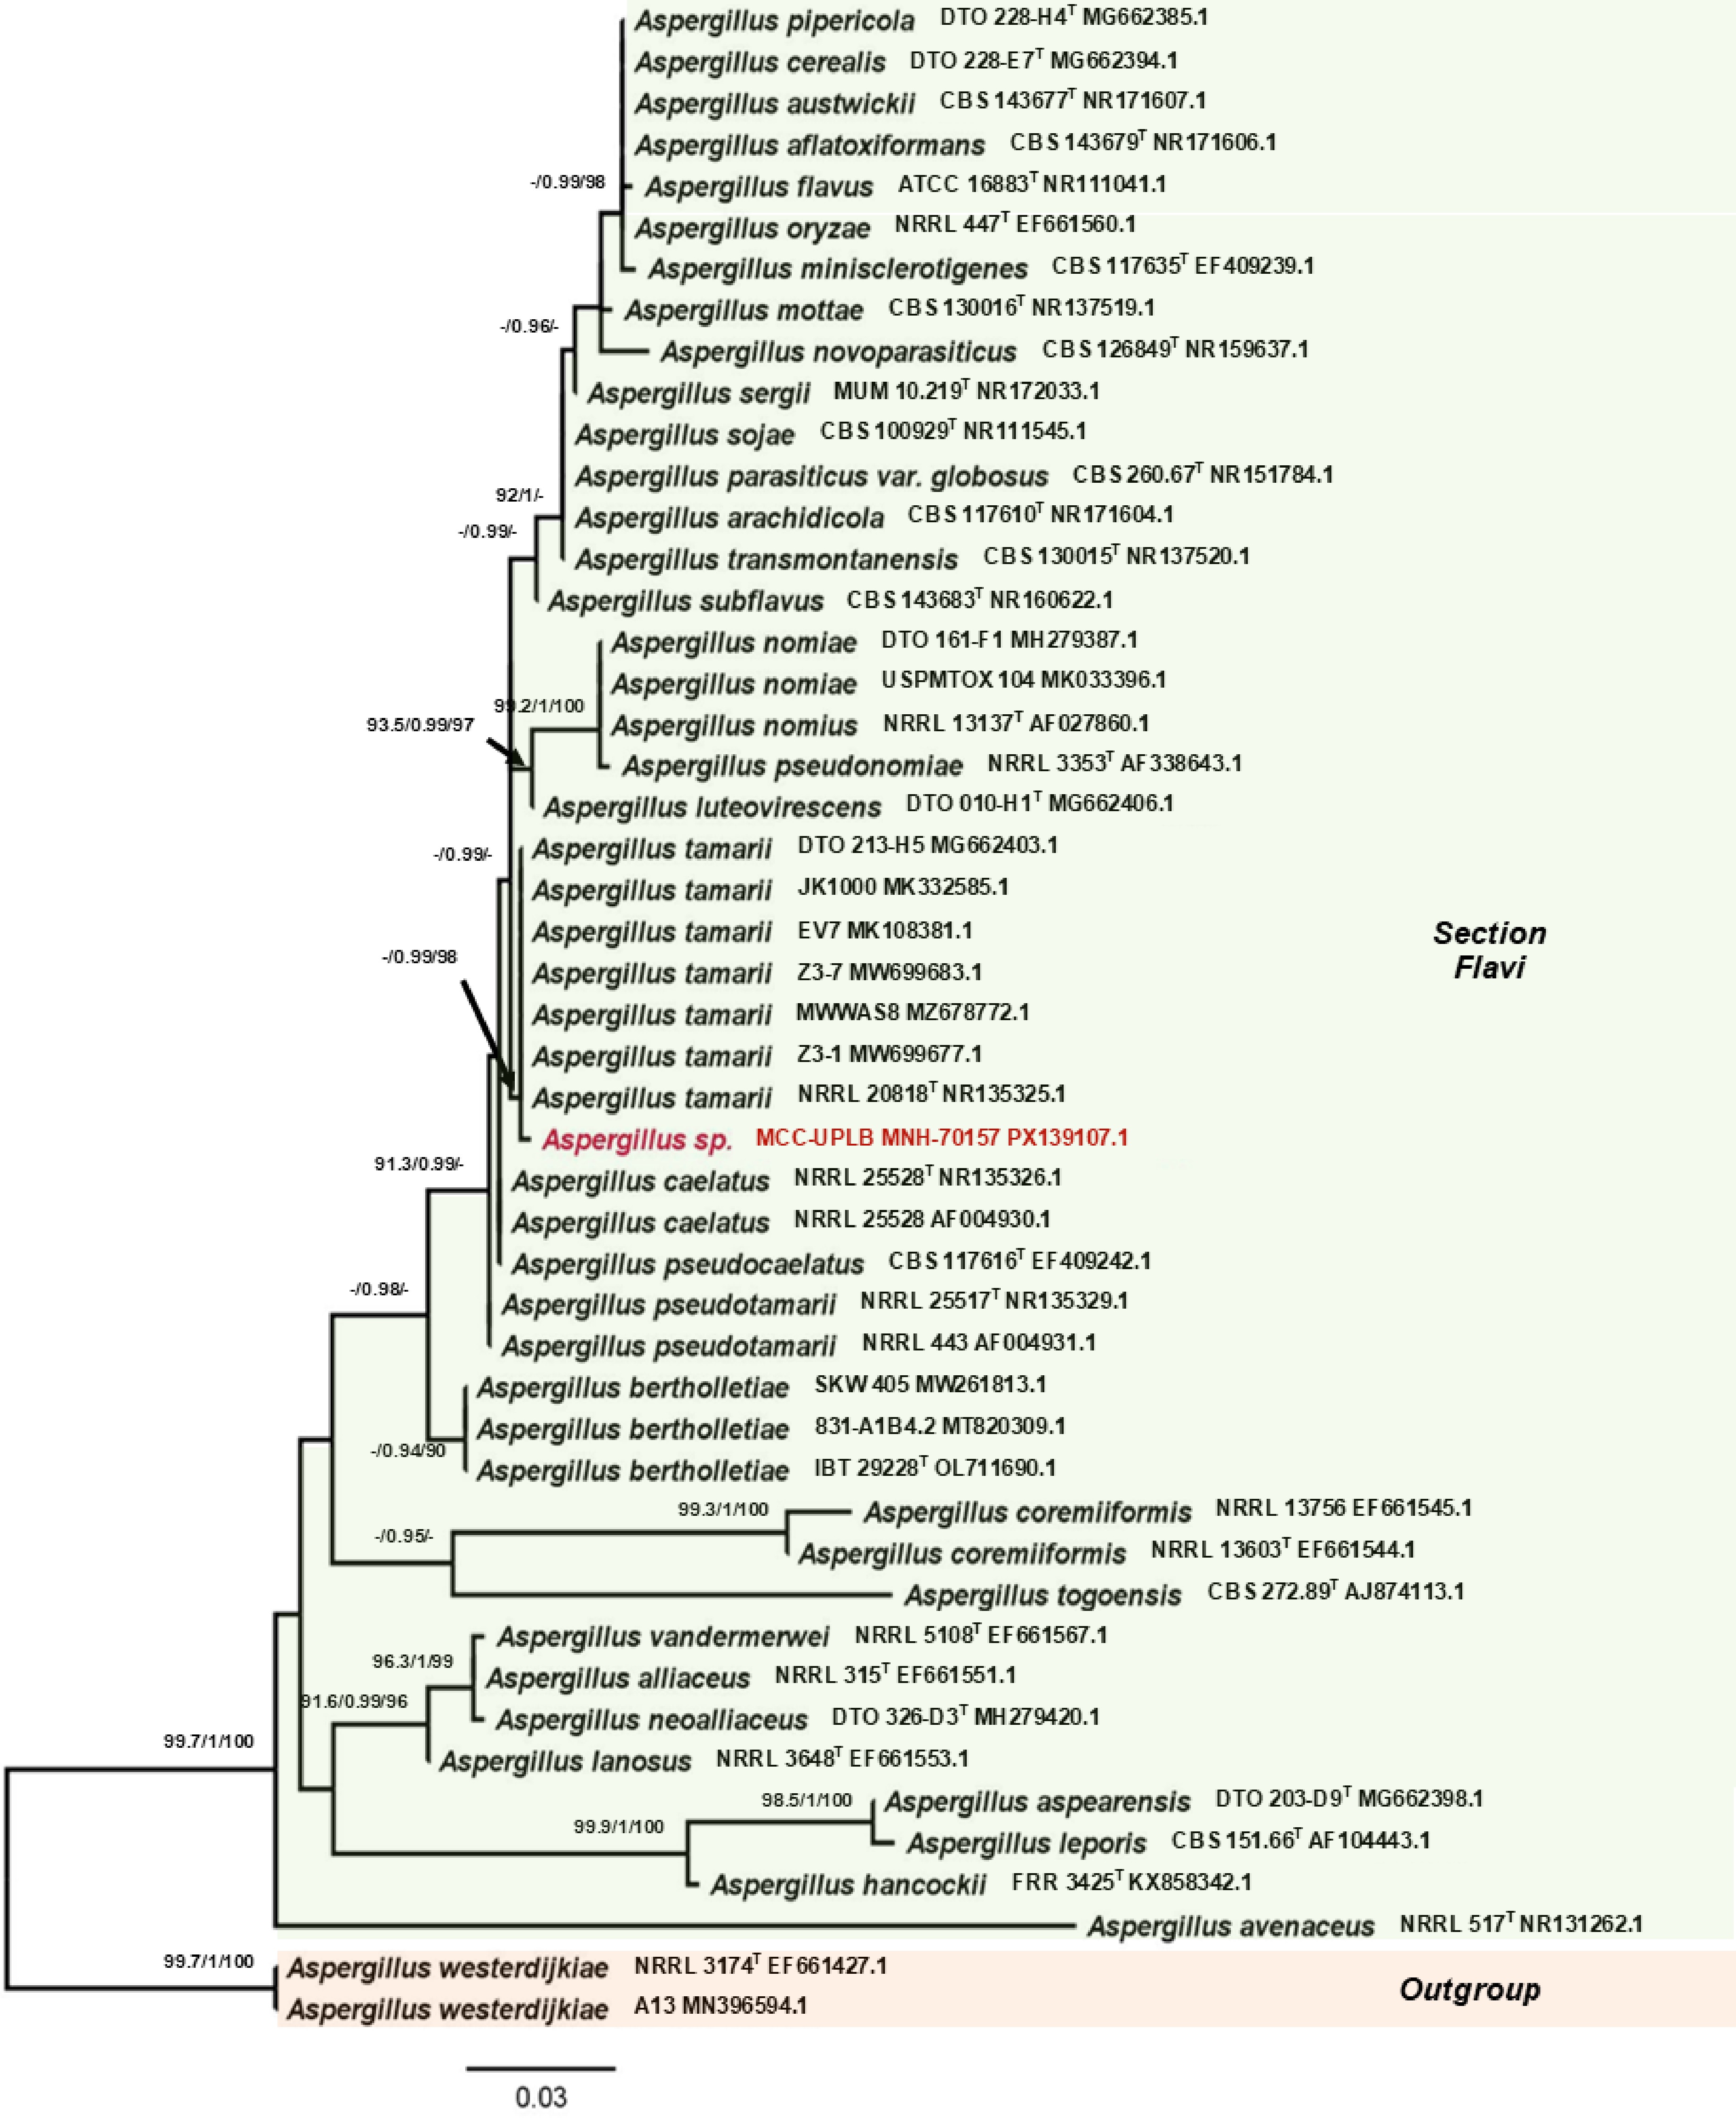
Figure 3.
Phylogenetic tree inferred using the ITS1-5.8S-ITS2 sequence showing the relationships of Aspergillus sp. MCC-UPLB MNH-70157 with representative reference strains (type strains are denoted byT) under the genus Aspergillus section Flavi. Support in nodes is provided by SH-aLRT, aBayes, and UFBoot, where values ≥ 90%, ≥ 0.90, and ≥ 90%, respectively, are shown (a dashed line indicates lower values). Tip labels are scientific names followed by strain, then Accession number. The bar indicates the number of substitutions per site.
-
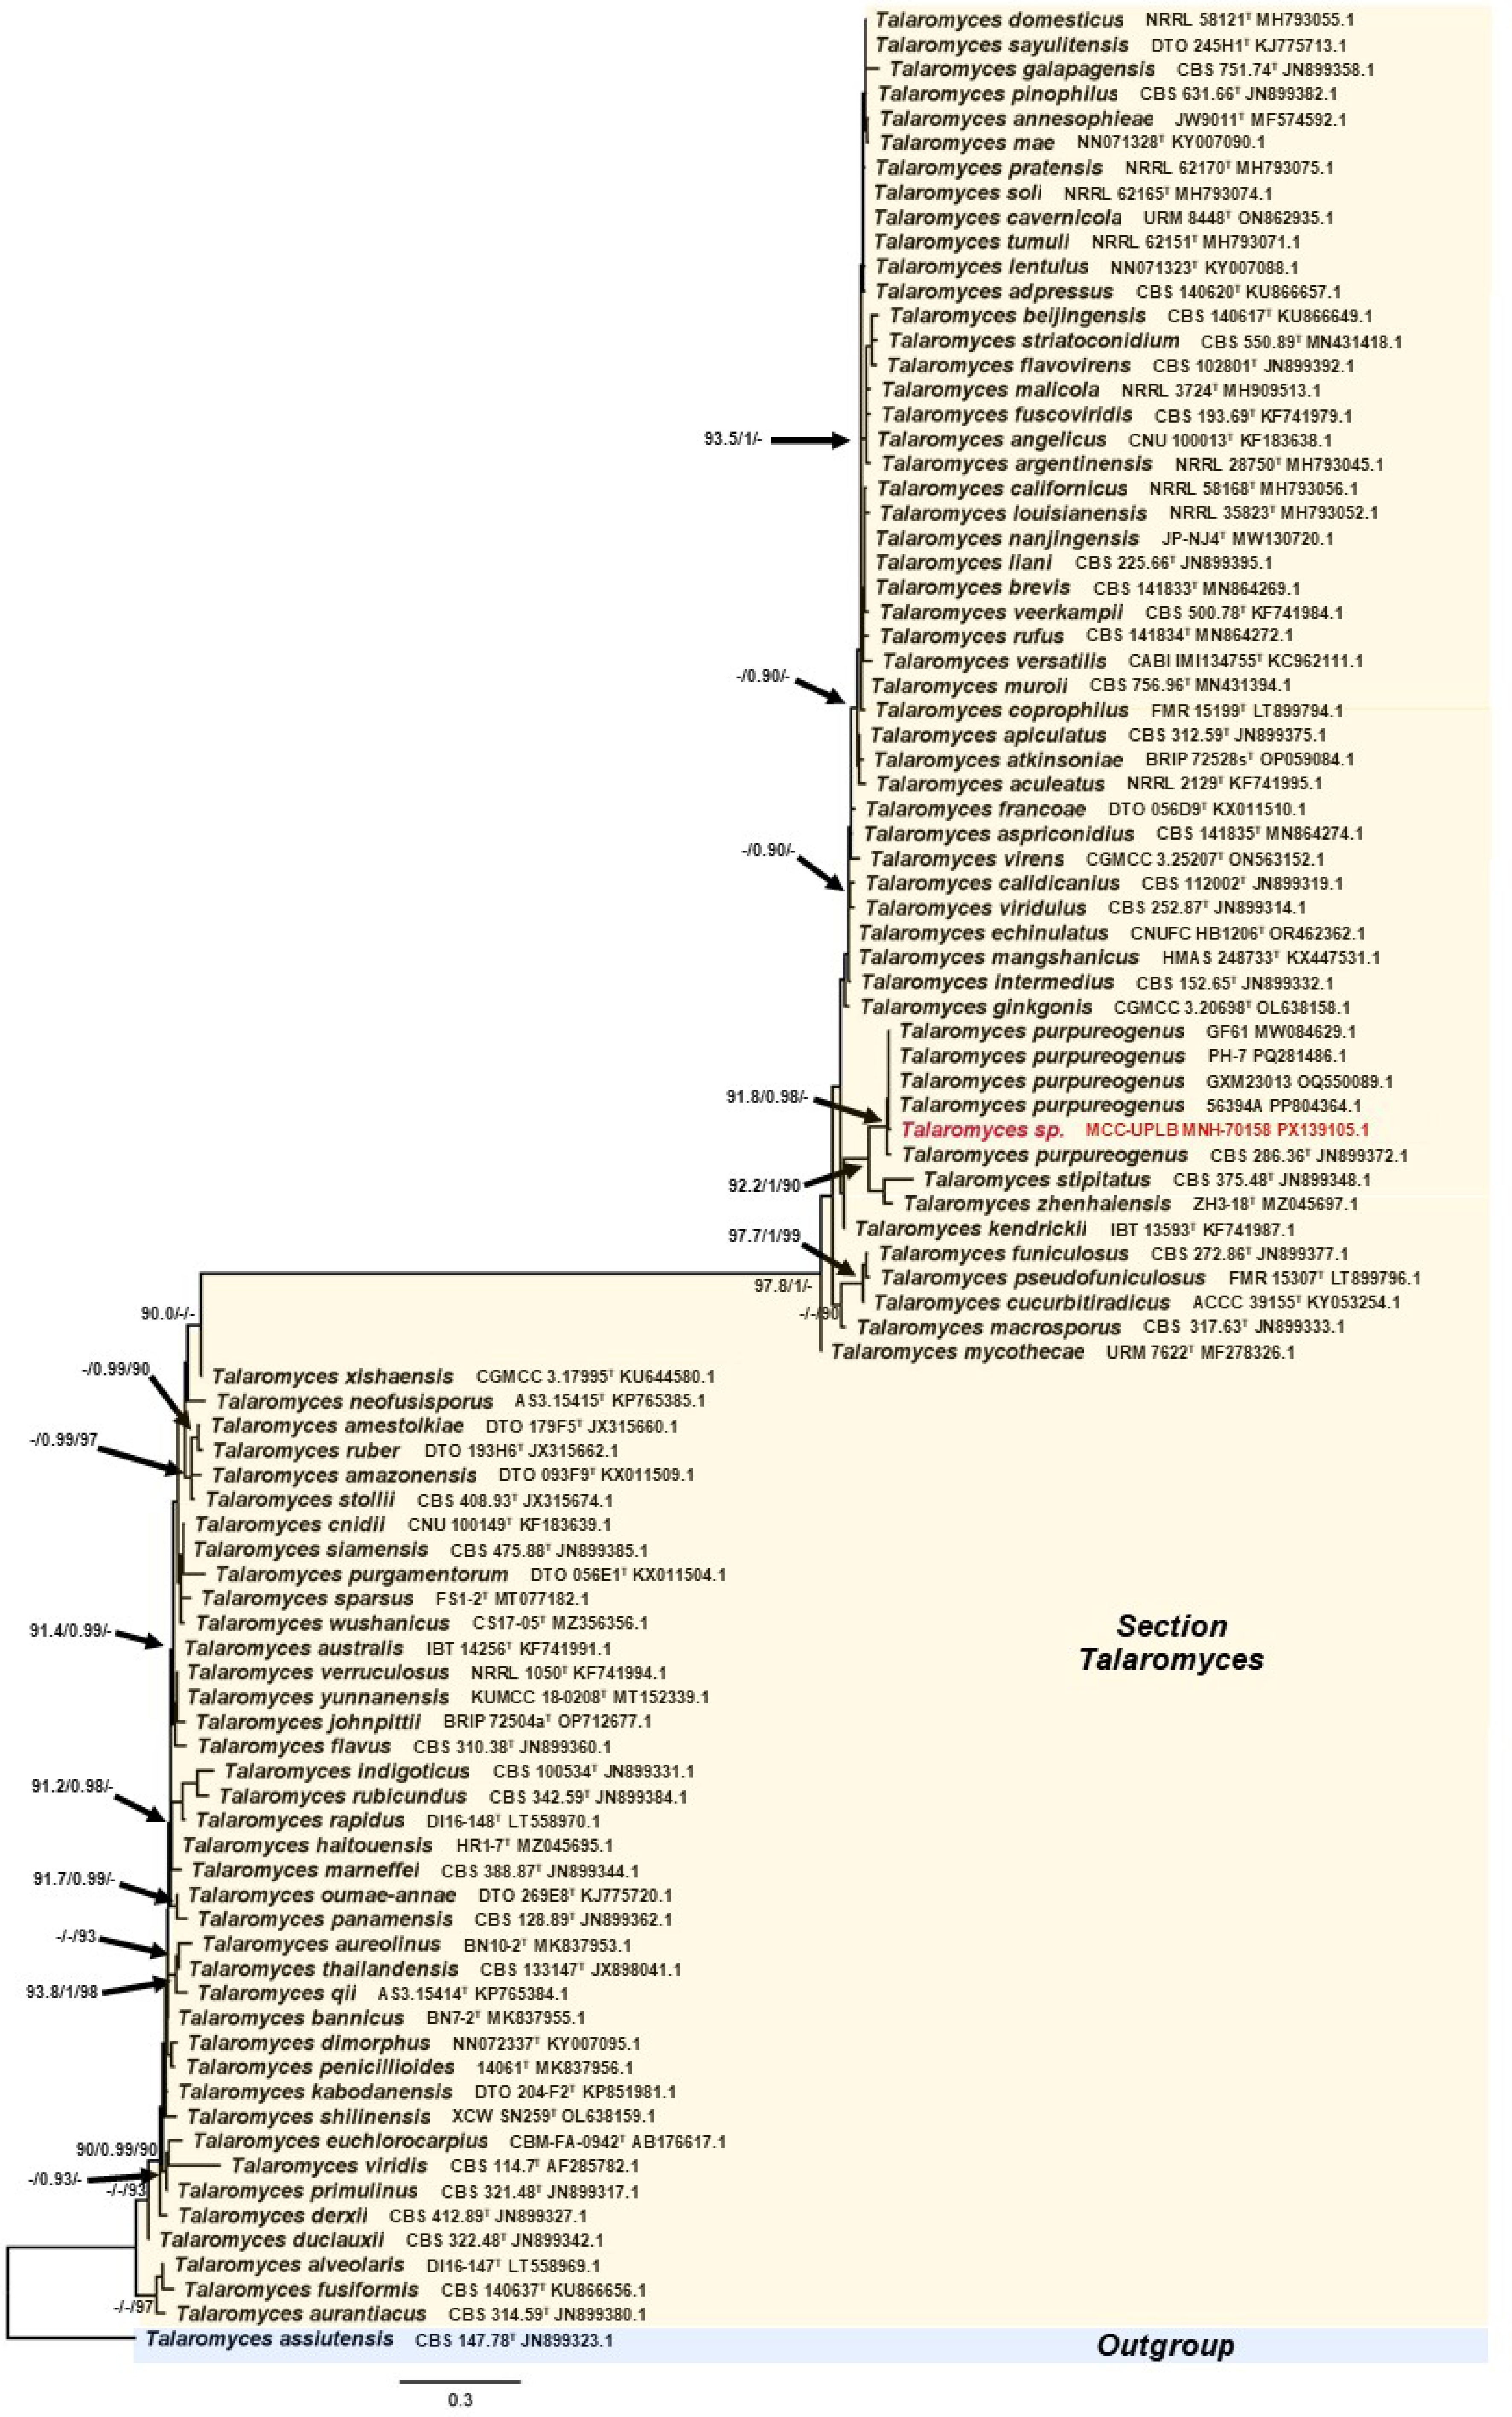
Figure 4.
Phylogenetic tree inferred using the ITS1-5.8S-ITS2 sequence showing the relationships of Talaromyces sp. MCC-UPLB MNH-70158 with reference strains (type strains are denoted byT) under the genus Talaromyces. Support in nodes is provided by SH-aLRT, aBayes, and UFBoot, where values ≥ 90%, ≥ 0.90, and ≥ 90%, respectively, are shown (a dashed line indicates lower values). Tip labels are scientific names followed by strain, then Accession number. The bar indicates the number of substitutions per site.
-
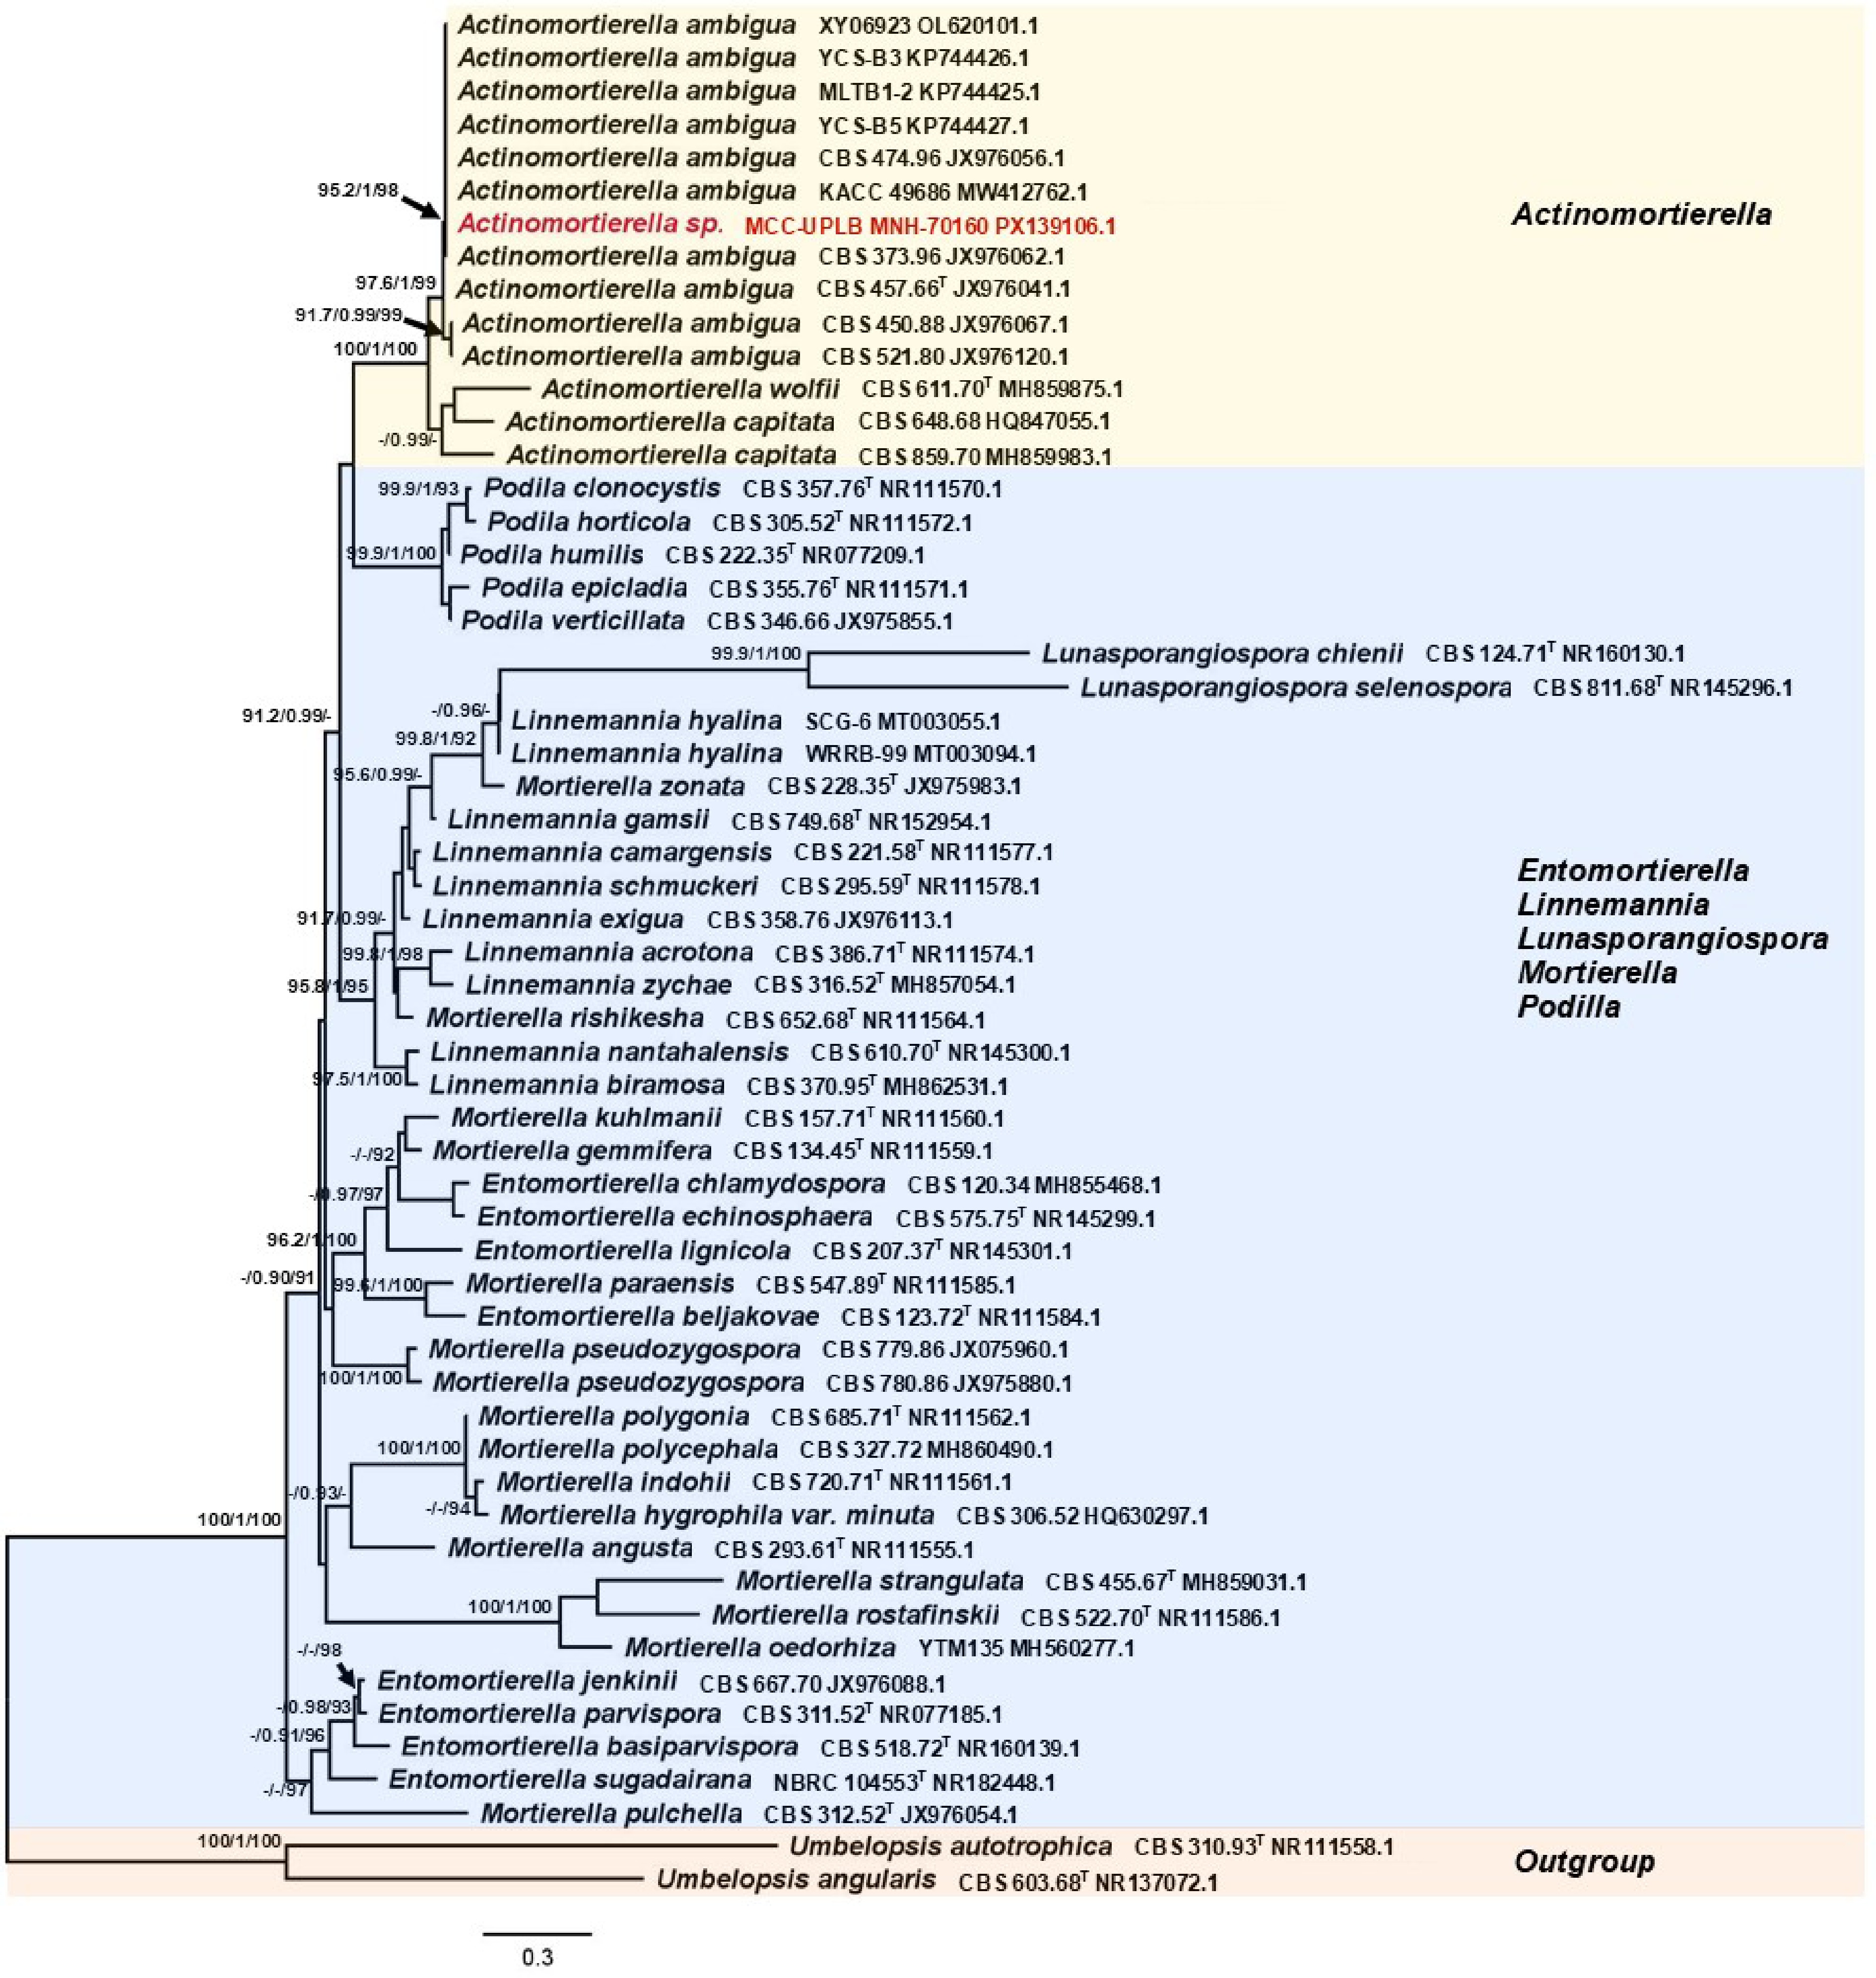
Figure 5.
Phylogenetic tree inferred using the ITS1-5.8S-ITS2 sequence showing the relationships of Actinomortierella sp. MCC-UPLB MNH-70160 with representative reference strains (type strains are denoted byT) under the genus Actinomortierella and closely related genera. Support in nodes is provided by SH-aLRT, aBayes, and UFBoot, where values ≥ 90%, ≥ 0.90, and ≥ 90%, respectively, are shown (a dashed line indicates lower values). Tip labels are scientific names followed by strain, then Accession number. The bar indicates the number of substitutions per site.
-
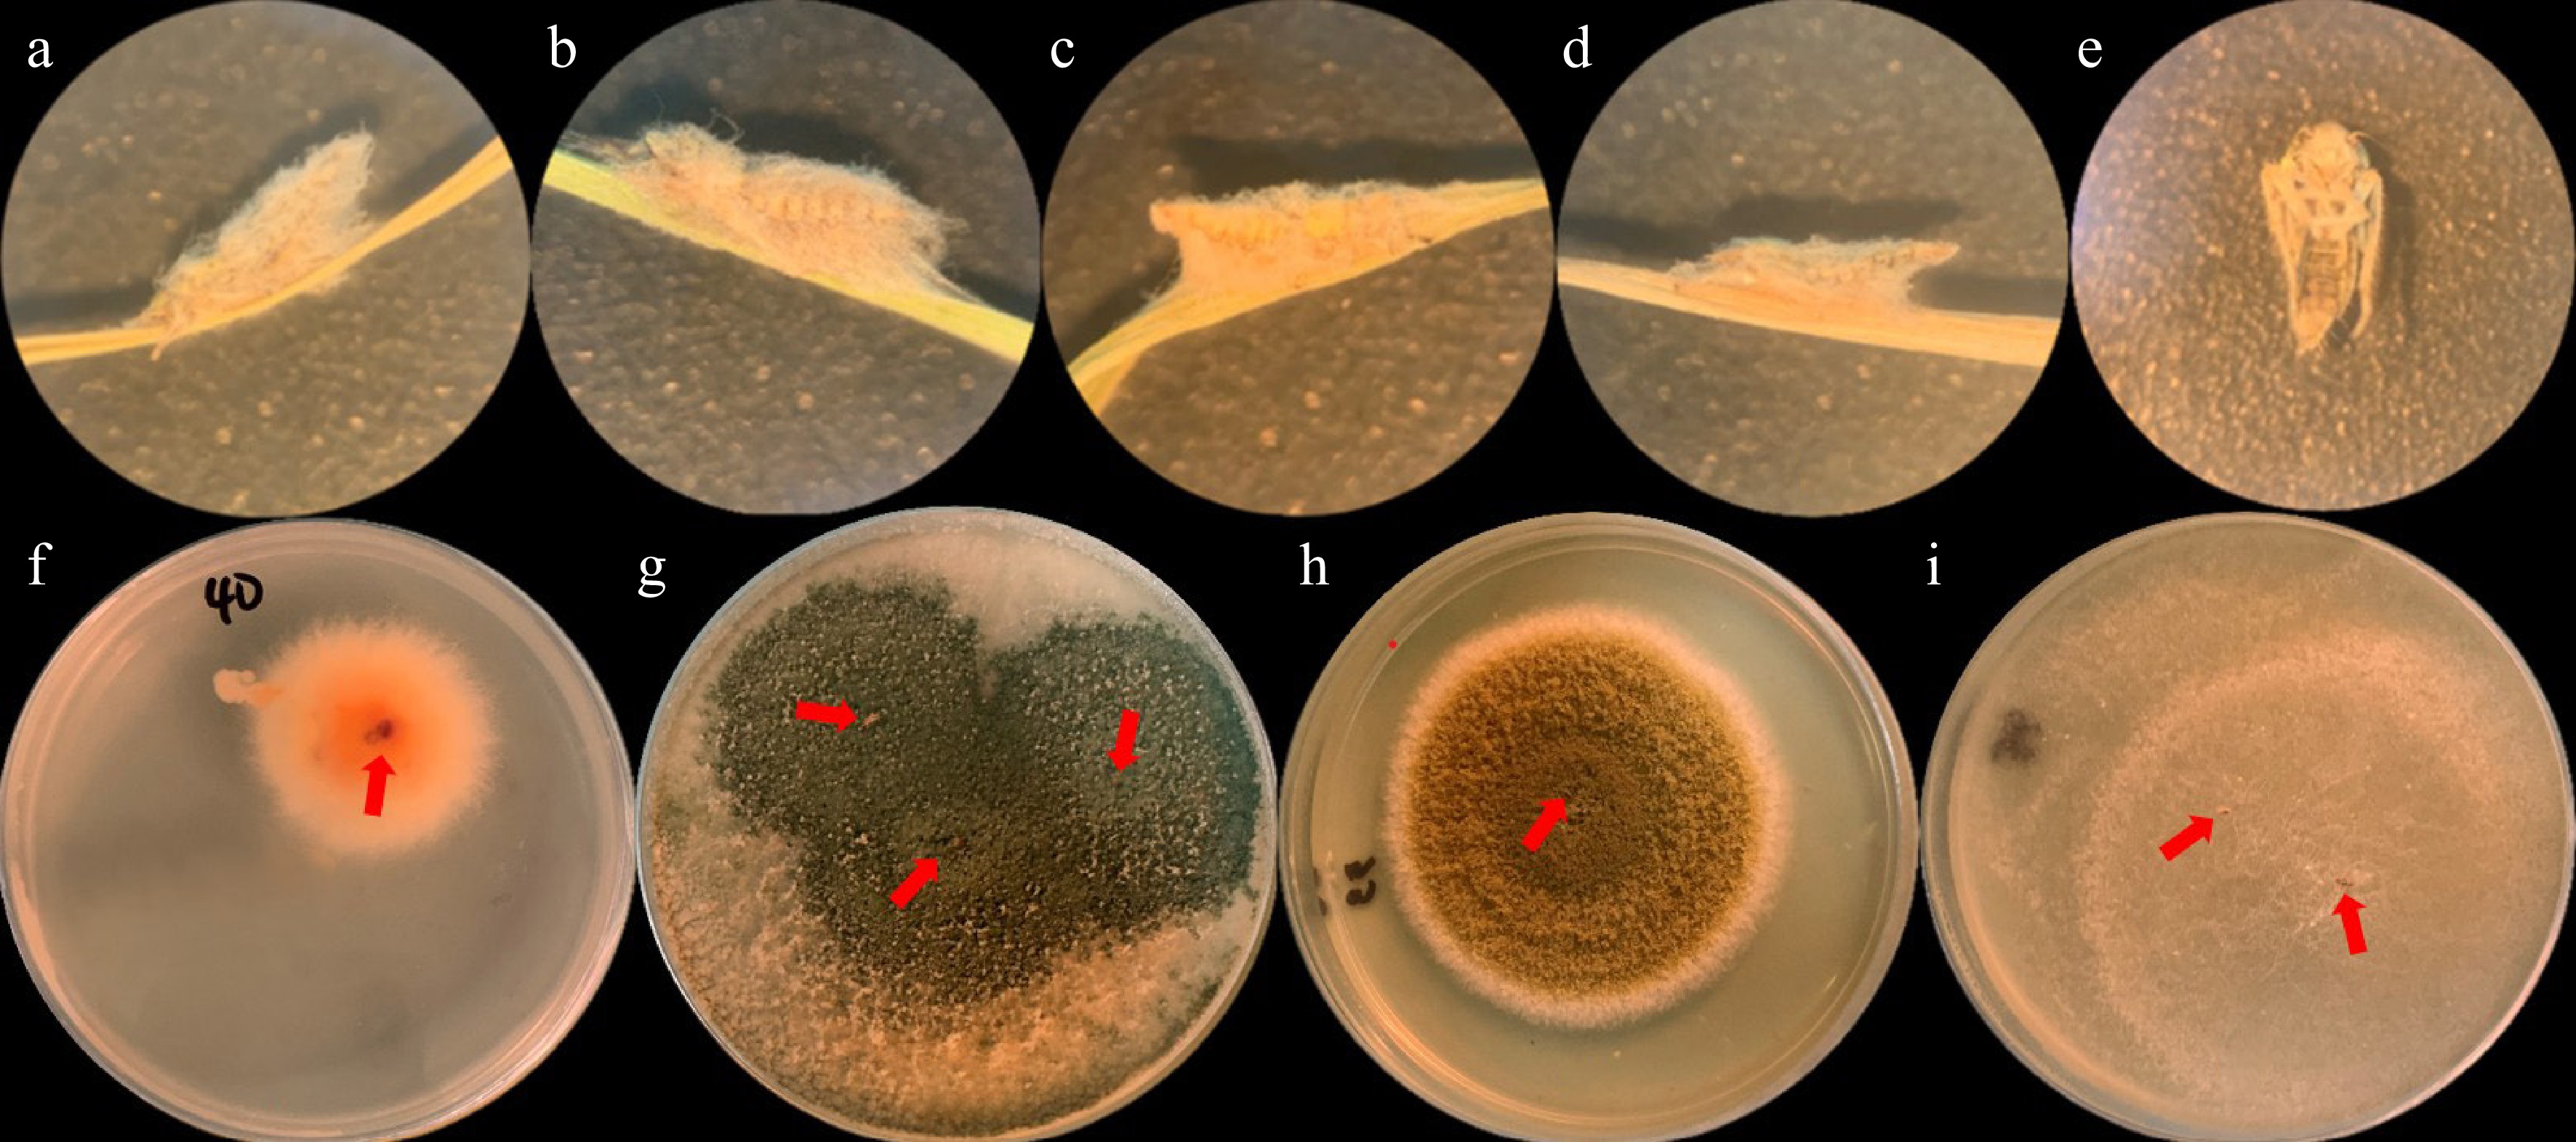
Figure 6.
Microscopic observation of dead N. nigropictus larvae treated with (a) Talaromyces sp., (b) Trichoderma sp., (c) Aspergillus sp., (d) Actinomortierella sp., and (e) Negative control (distilled H2O) using a dissecting microscope (400x magnification). Note the mycelia growing in fungi-treated larvae. Results of Koch postulate analysis of the dead mycelial-infected N. nigropictus (pointed by red arrows): (f) Talaromyces sp., (g) Trichoderma sp., (h) Aspergillus sp., and (i) Actinomortierella sp. after 7 d of incubation at room temperature.
-
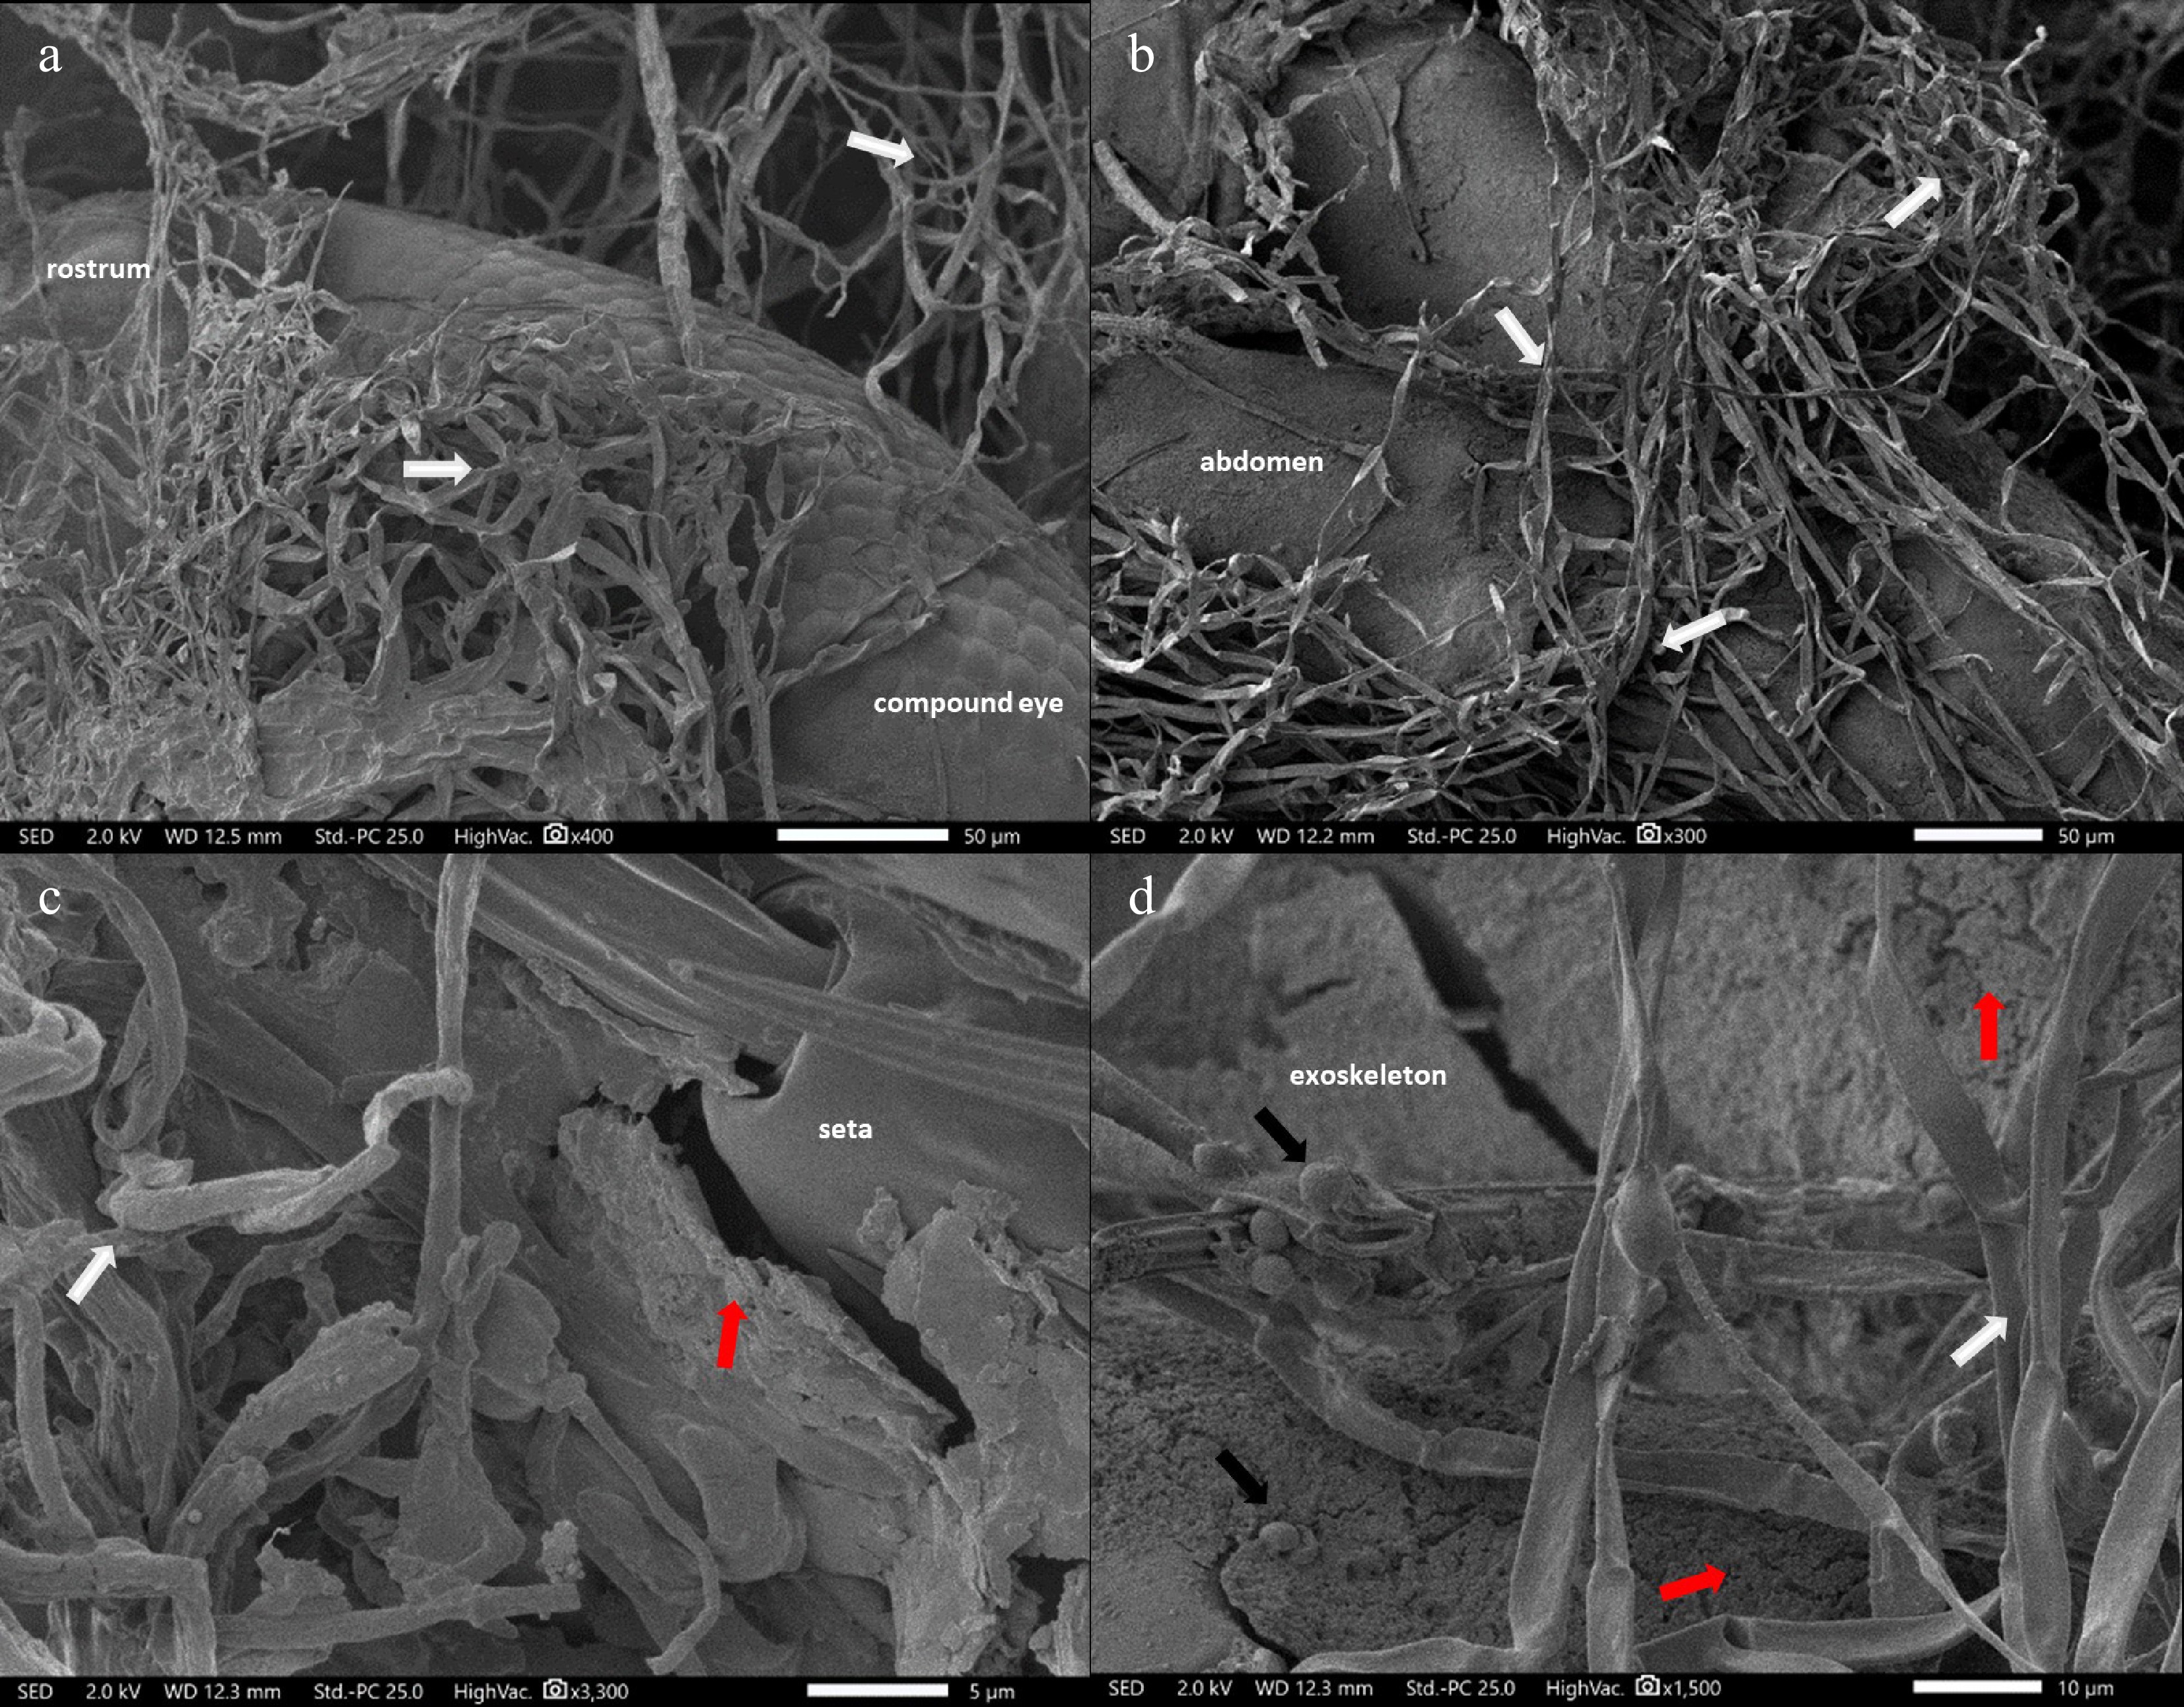
Figure 7.
SEM micrograph of mycelia-infected (indicated by white arrows) N. nigropictus showing: (a) Actinomortierella sp. mycelia-colonized ventral head region. (b) Talaromyces sp. mycelia-colonized ventral abdomen, (c) Aspergillus sp. mycelia-colonized seta, (d) Trichoderma sp. mycelia-colonized exoskeleton with fissures/slits (red arrows). Trichoderma conidia (black arrows). Scale bar: (a), (b) 50 μm, (c) 5 μm, (d) 10 μm.
-
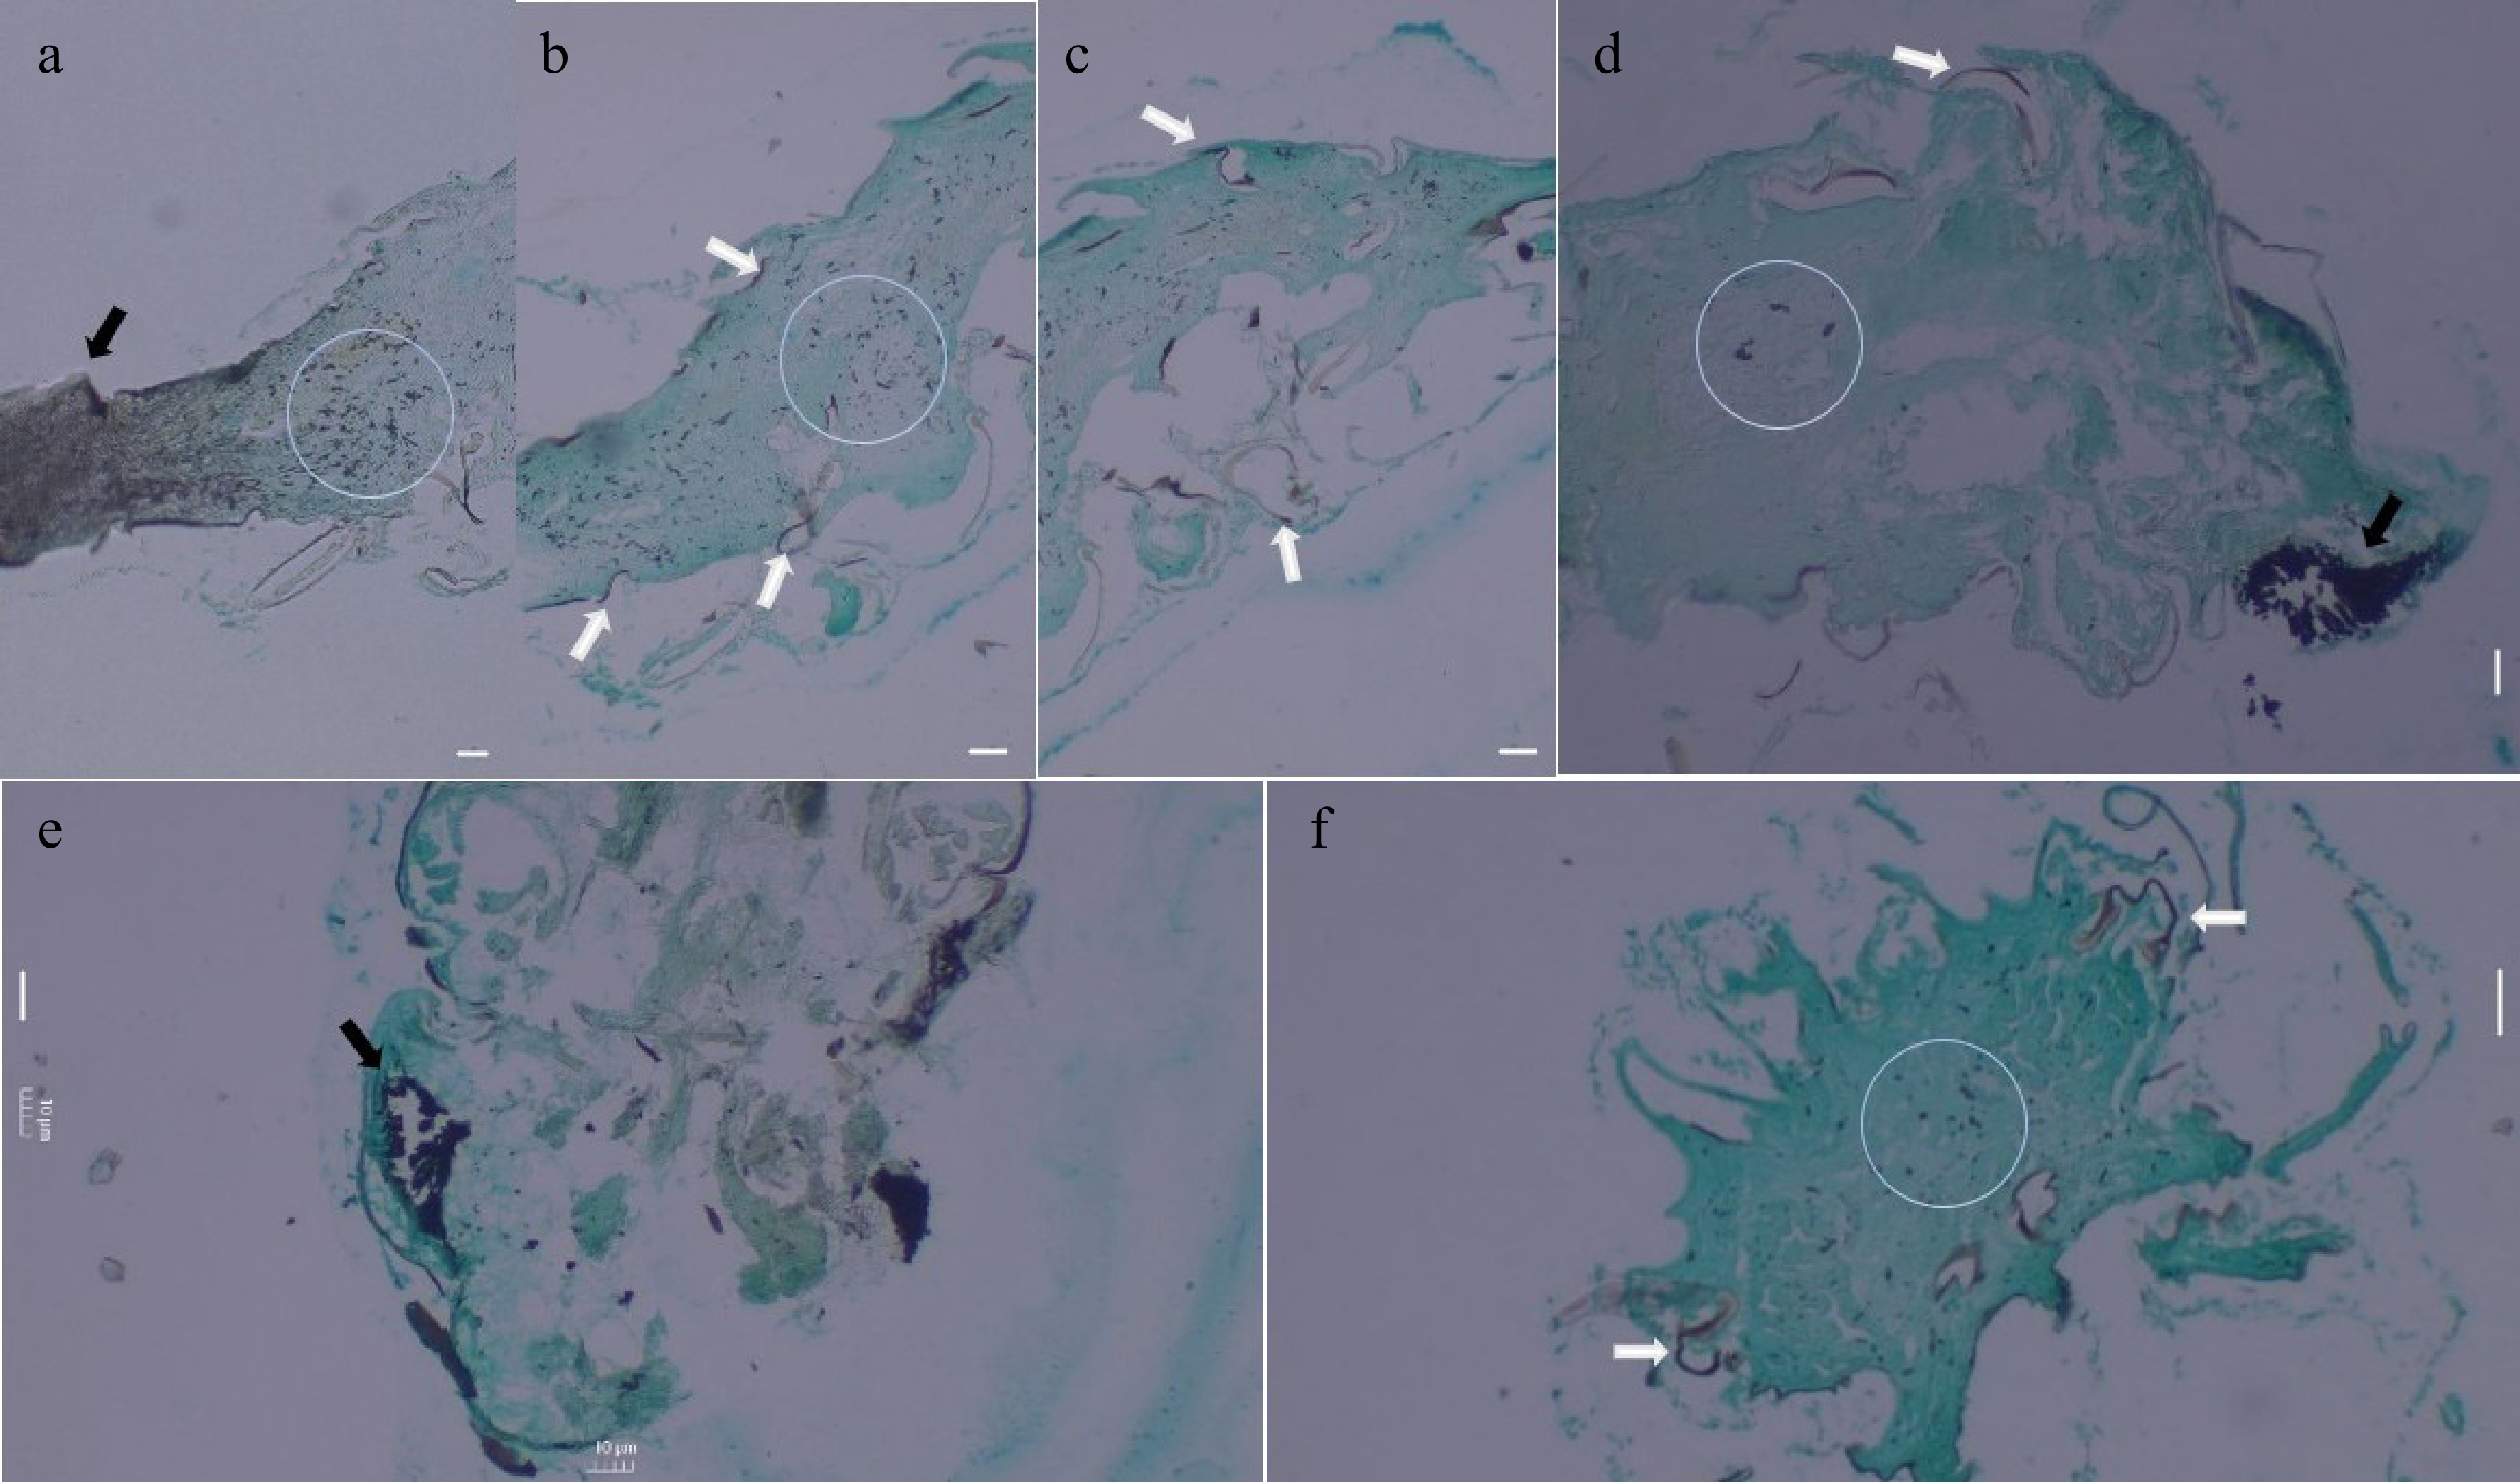
Figure 8.
Results of histopathological analysis of mycelial-infected N. nigropictus third instar larvae (fungal tissues appear black over green insect tissue). (a) Sagittal section showing the densely infected ovipositor region (indicated by black arrow) and portions of the abdomen, (b) Sagittal section showing the abdomen. (c) Sagittal section showing the thorax region. (d) Sagittal section of the head with a densely infected compound eye (indicated by black arrow). Coronal section of the (e) head, and (f) the thorax. (a) Trichoderma sp., (b), (c) Aspergillus sp., (d) Talaromyces sp., and (e), (f) Actinomortierella sp. White arrows indicate penetrating fungal mycelial tissue in between tergites and sternites, while fungal mycelial tissues colonizing the insect's internal tissues are encircled. Scale bar = 10 μm.
-
Culture collection code GenBank Accession no. Cultural/morphological
featuresSequence length (bp) GenBank Accession no. of the closest match Closest match Identity (%) MCC-UPLB MNH-70156 PX139108 Cottony aerial, scattered powdery green (obverse), creamy white (reverse), conidiophores present 502 NR_130668.1 Trichoderma asperellum (Samuels, Lieckf. & Nirenberg) 98.07 MCC-UPLB MNH-70157 PX139107 Powdery, yellow-green (obverse), yellow (reverse), conidiophores present 540 NR_135325.1 Aspergillus tamarii (Kita) 99.43 MCC-UPLB MNH-70158 PX139105 Cottony, pinkish-white (obverse), cream-orange (reverse), conidiophores present 540 NR_121529.1 Talaromyces purpureogenus ([Stoll] Samson, N. Yilmaz, Frisvad & Seifert) 98.49 MCC-UPLB MNH-70160 PX139106 Compact velvety, white (obverse-reverse), sporangiophores present 625 MW412762.1 Actinomortierella ambigua ([B.S. Mehrotra] Vandepol & Bonito) 99.00 Table 1.
Preliminary identification of fungal isolates based on classical characterization and ITS nucleotide BLAST searches in GenBank.
-
Culture collection code Putative fungal isolates/control Mean percent mortality of N. nigropictus MCC-UPLB MNH-70158 Talaromyces sp. 43.33 (± 2.89)A MCC-UPLB MNH-70156 Trichoderma sp. 38.33 (± 7.64)AB MCC-UPLB MNH-70157 Aspergillus sp. 26.67 (± 2.89)BC MCC-UPLB MNH-70160 Actinomortierella sp. 18.33 (± 5.77)C Negative Control 1.67 (± 2.89)D *Means (± SD) that do not share a letter are significantly different. ANOVA (Shapiro–Wilk normality); Tukey's Comparison of Means, p < 0.05. Average temperature: am (30.47 °C), noon (33.15 °C), pm (31.72 °C), and humidity: am (72.33%), noon (58.33%), pm (65.17%) of the setup. Table 2.
Mean percent mortality of N. nigropictus third instar larvae 5 d after exposure to spores (~106) of the selected fungal isolates.
Figures
(8)
Tables
(2)