-
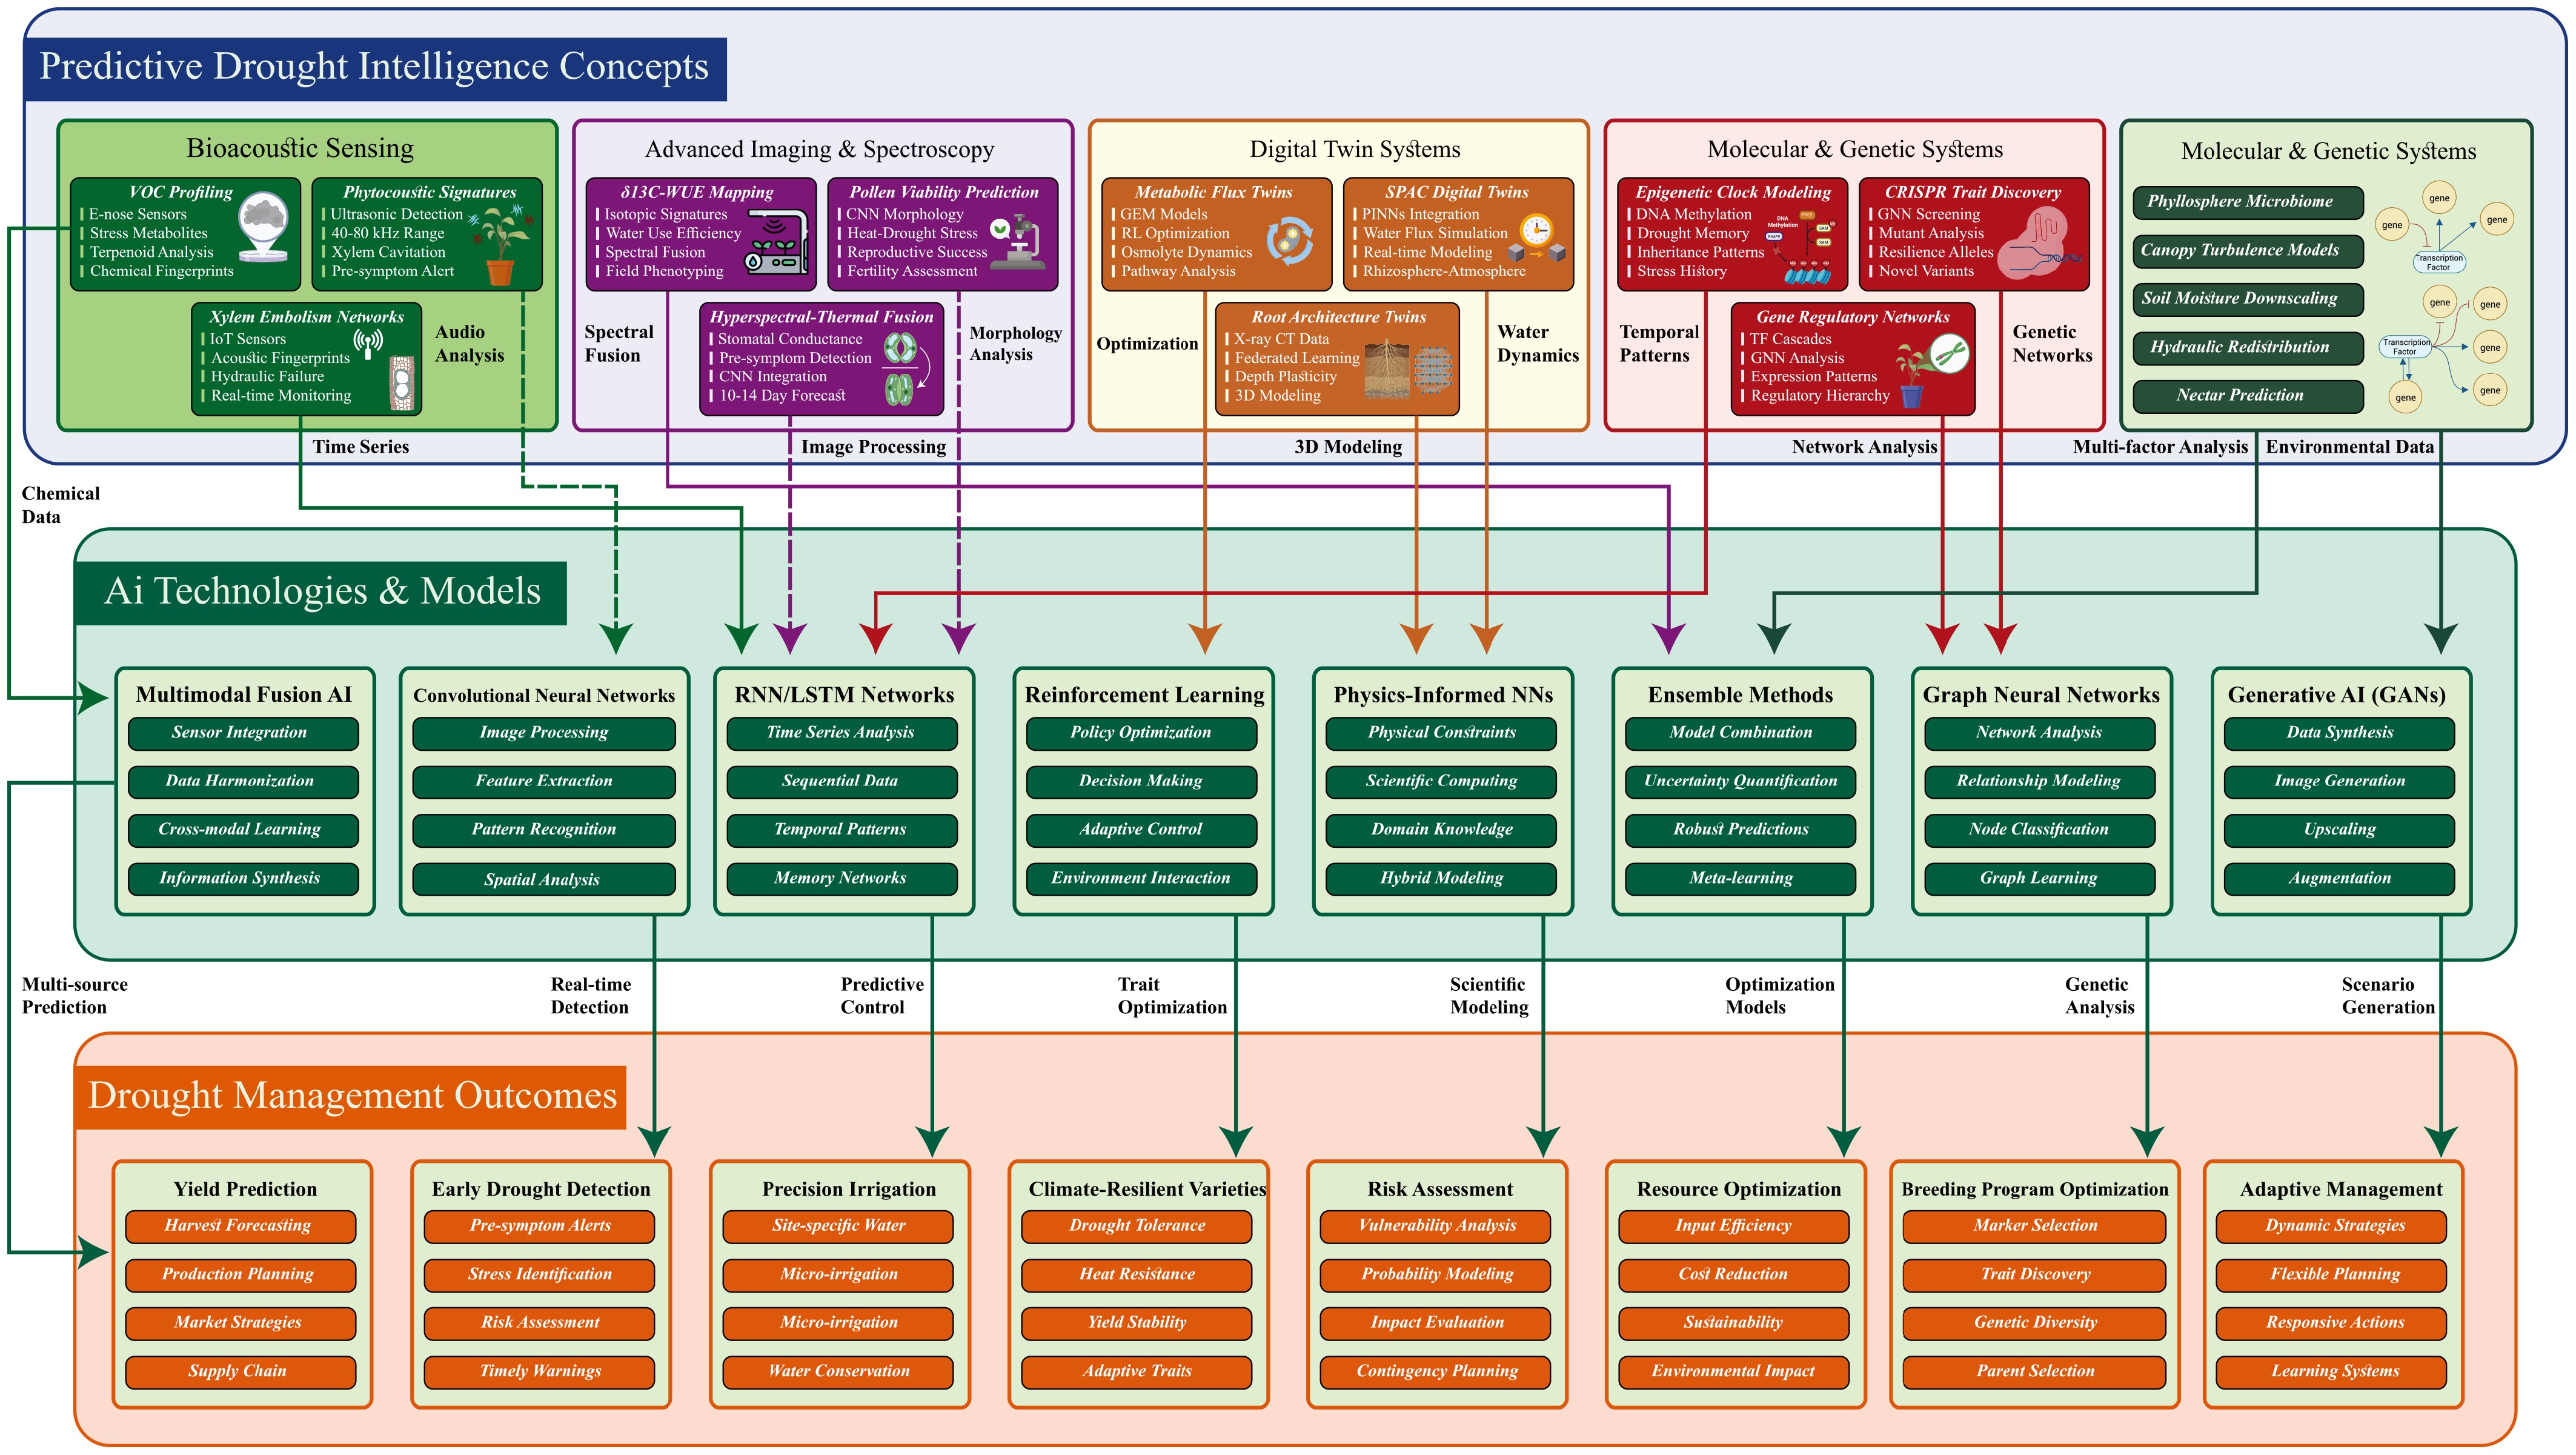
Figure 1.
AI-driven predictive drought-intelligence ecosystem for crops. The schematic organizes the system into three levels: Predictive concepts (top; what is sensed/modeled), AI technologies and models (middle; how information is analyzed), and drought-management outcomes (bottom; decision outputs). Color-coded connectors illustrate data flow between specific inputs, analytical approaches, and actionable results.
-
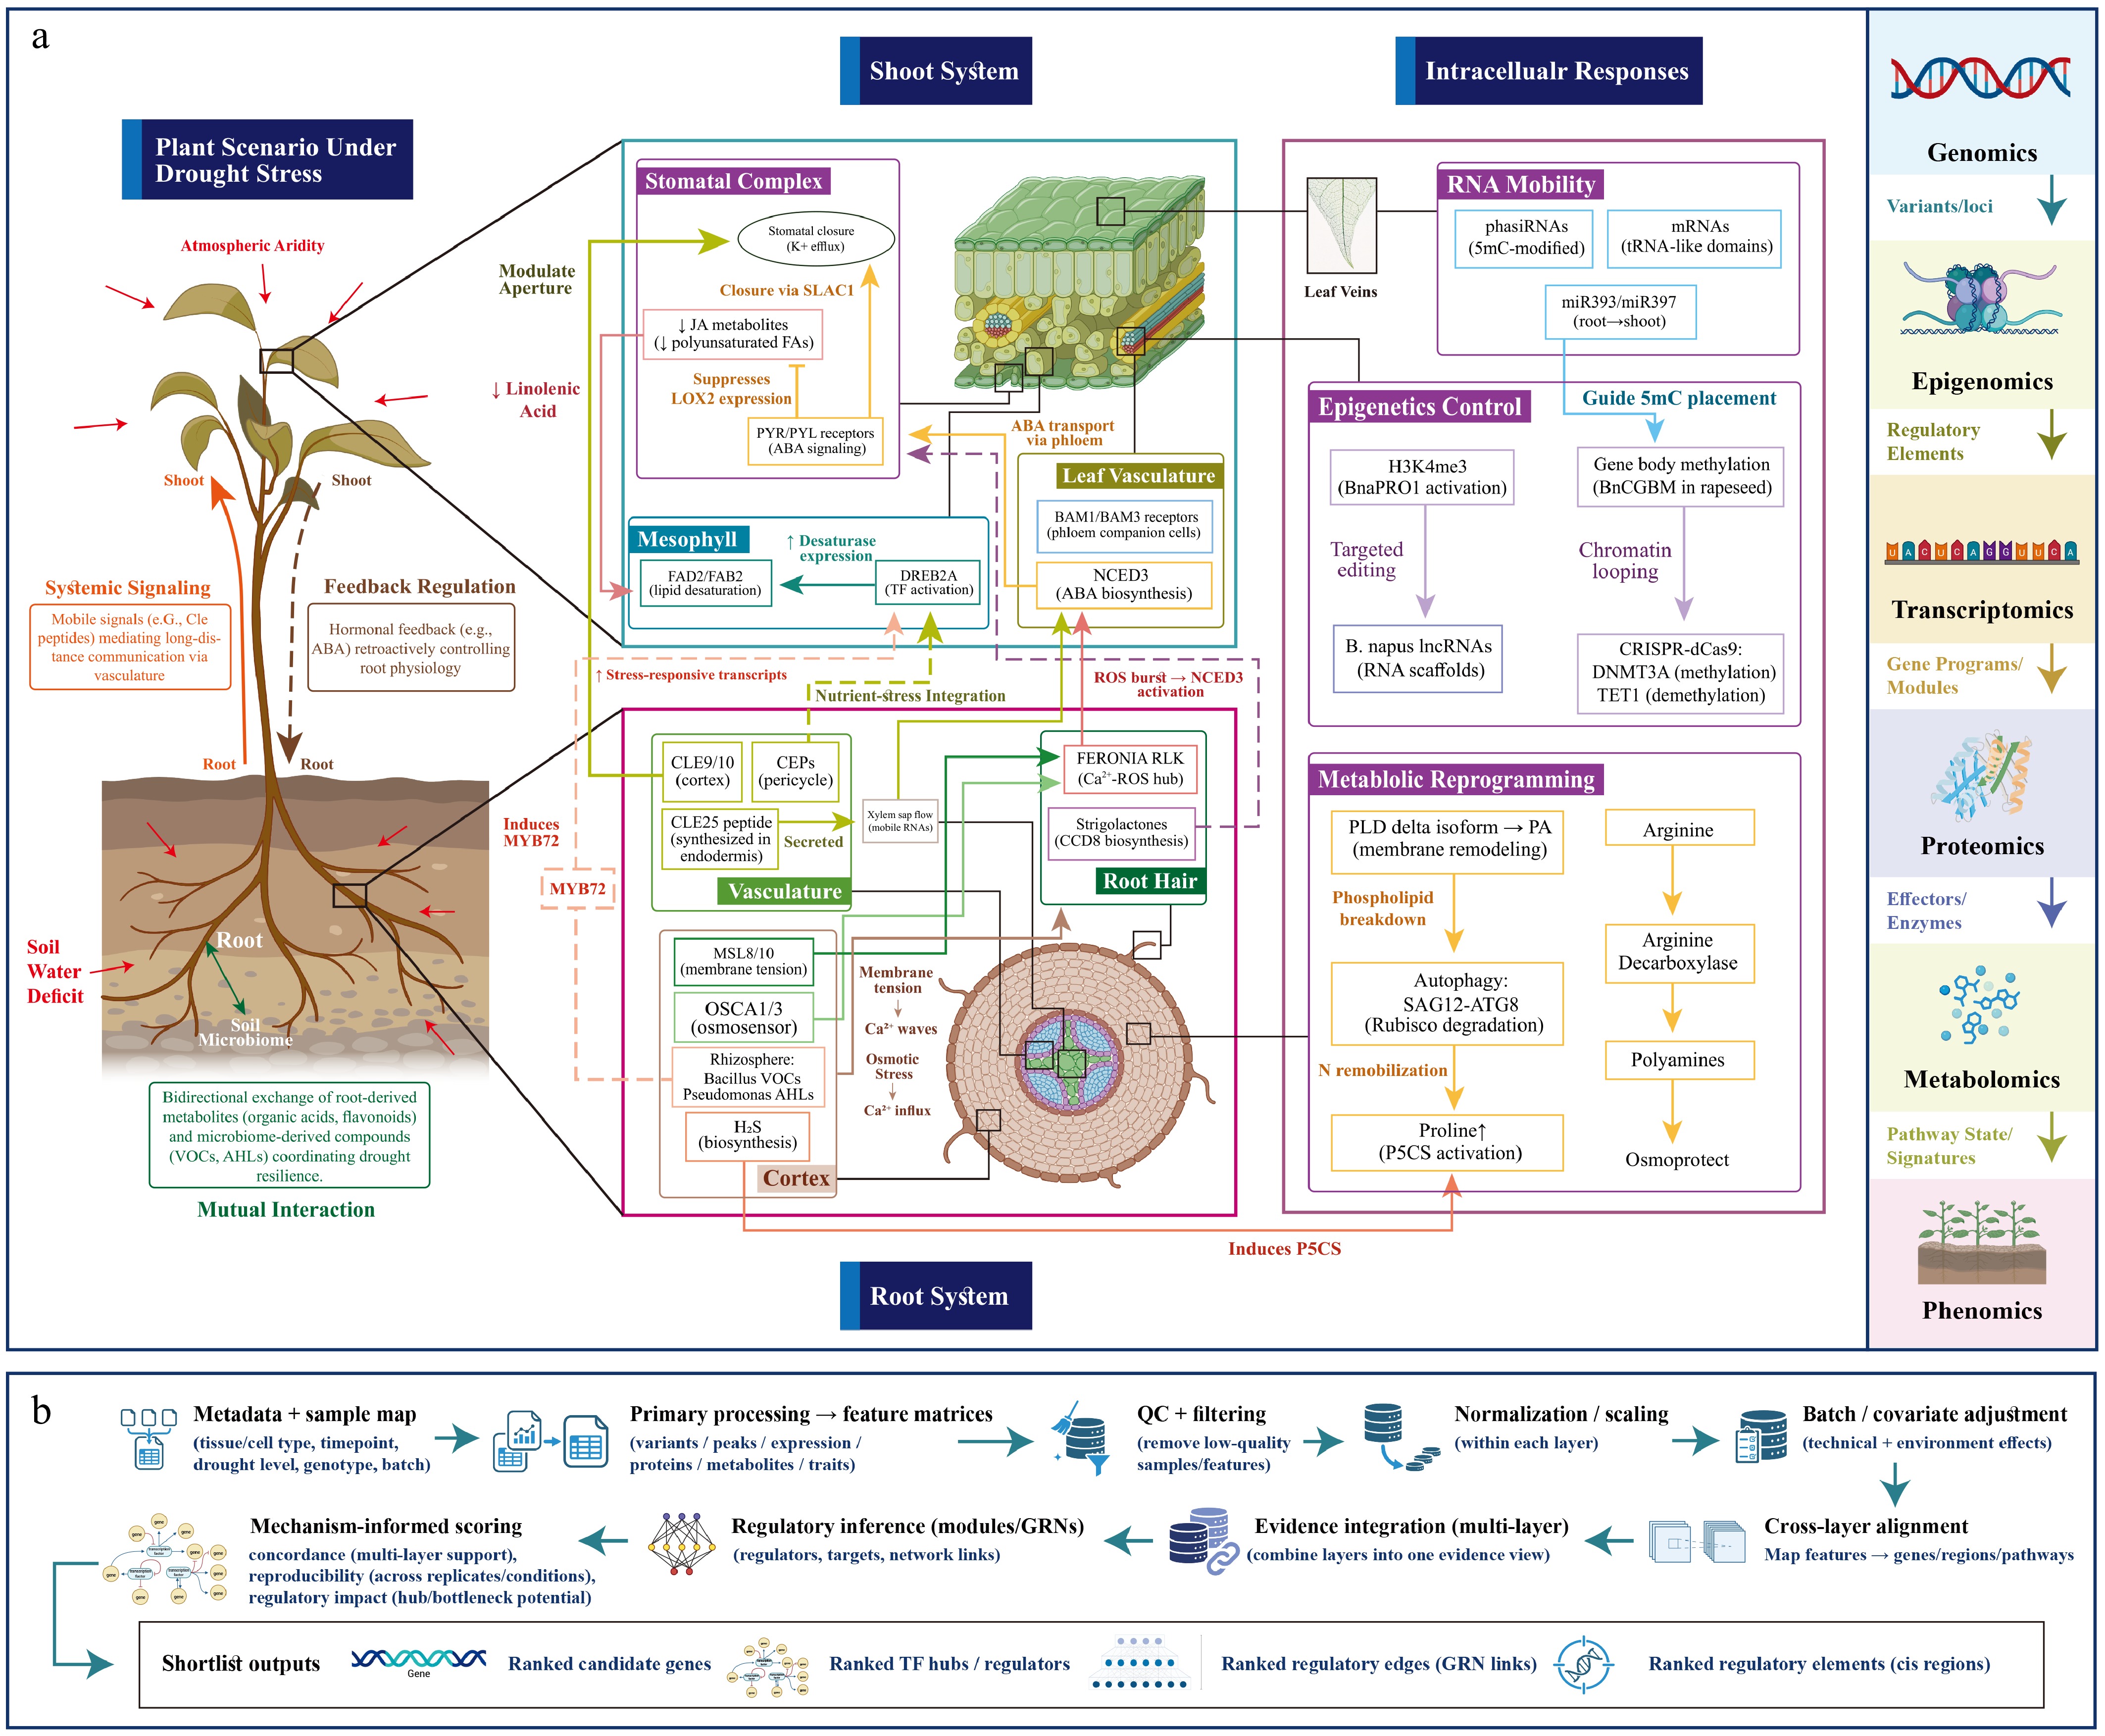
Figure 2.
Integrated molecular and systemic drought responses in crops. (a) Multi-scale drought response mechanisms. The schematic illustrates organ-level signaling and intracellular regulation under drought stress. Roots (left) show early osmosensing (OSCA1/3, MSL8/10), systemic signaling (CLE25, CEP peptides), and rhizosphere interactions (microbial VOCs/AHLs). Shoots (center) detail stomatal regulation (ABA, SLAC1), leaf vasculature signaling (BAM1/BAM3, NCED3), and metabolic reprogramming (lipid desaturation, osmoprotectants). Intracellular layers (right) include RNA mobility, epigenetic control (H3K4me3, targeted editing), and autophagy. The right margin summarizes mechanism-linked omics evidence layers: genomics, epigenomics, transcriptomics, proteomics, metabolomics, and phenomics. (b) AI-guided workflow from omics data to ranked candidates. This panel outlines the analysis pipeline: metadata and sample mapping → primary processing and feature matrices → QC, normalization, and batch correction → cross-layer alignment and evidence integration → regulatory network inference → mechanism-informed candidate scoring (based on multi-layer concordance, reproducibility, and regulatory impact). Outputs are shortlisted ranked candidates: genes, TF hubs, regulatory edges (GRN links), and cis-regulatory elements.
-
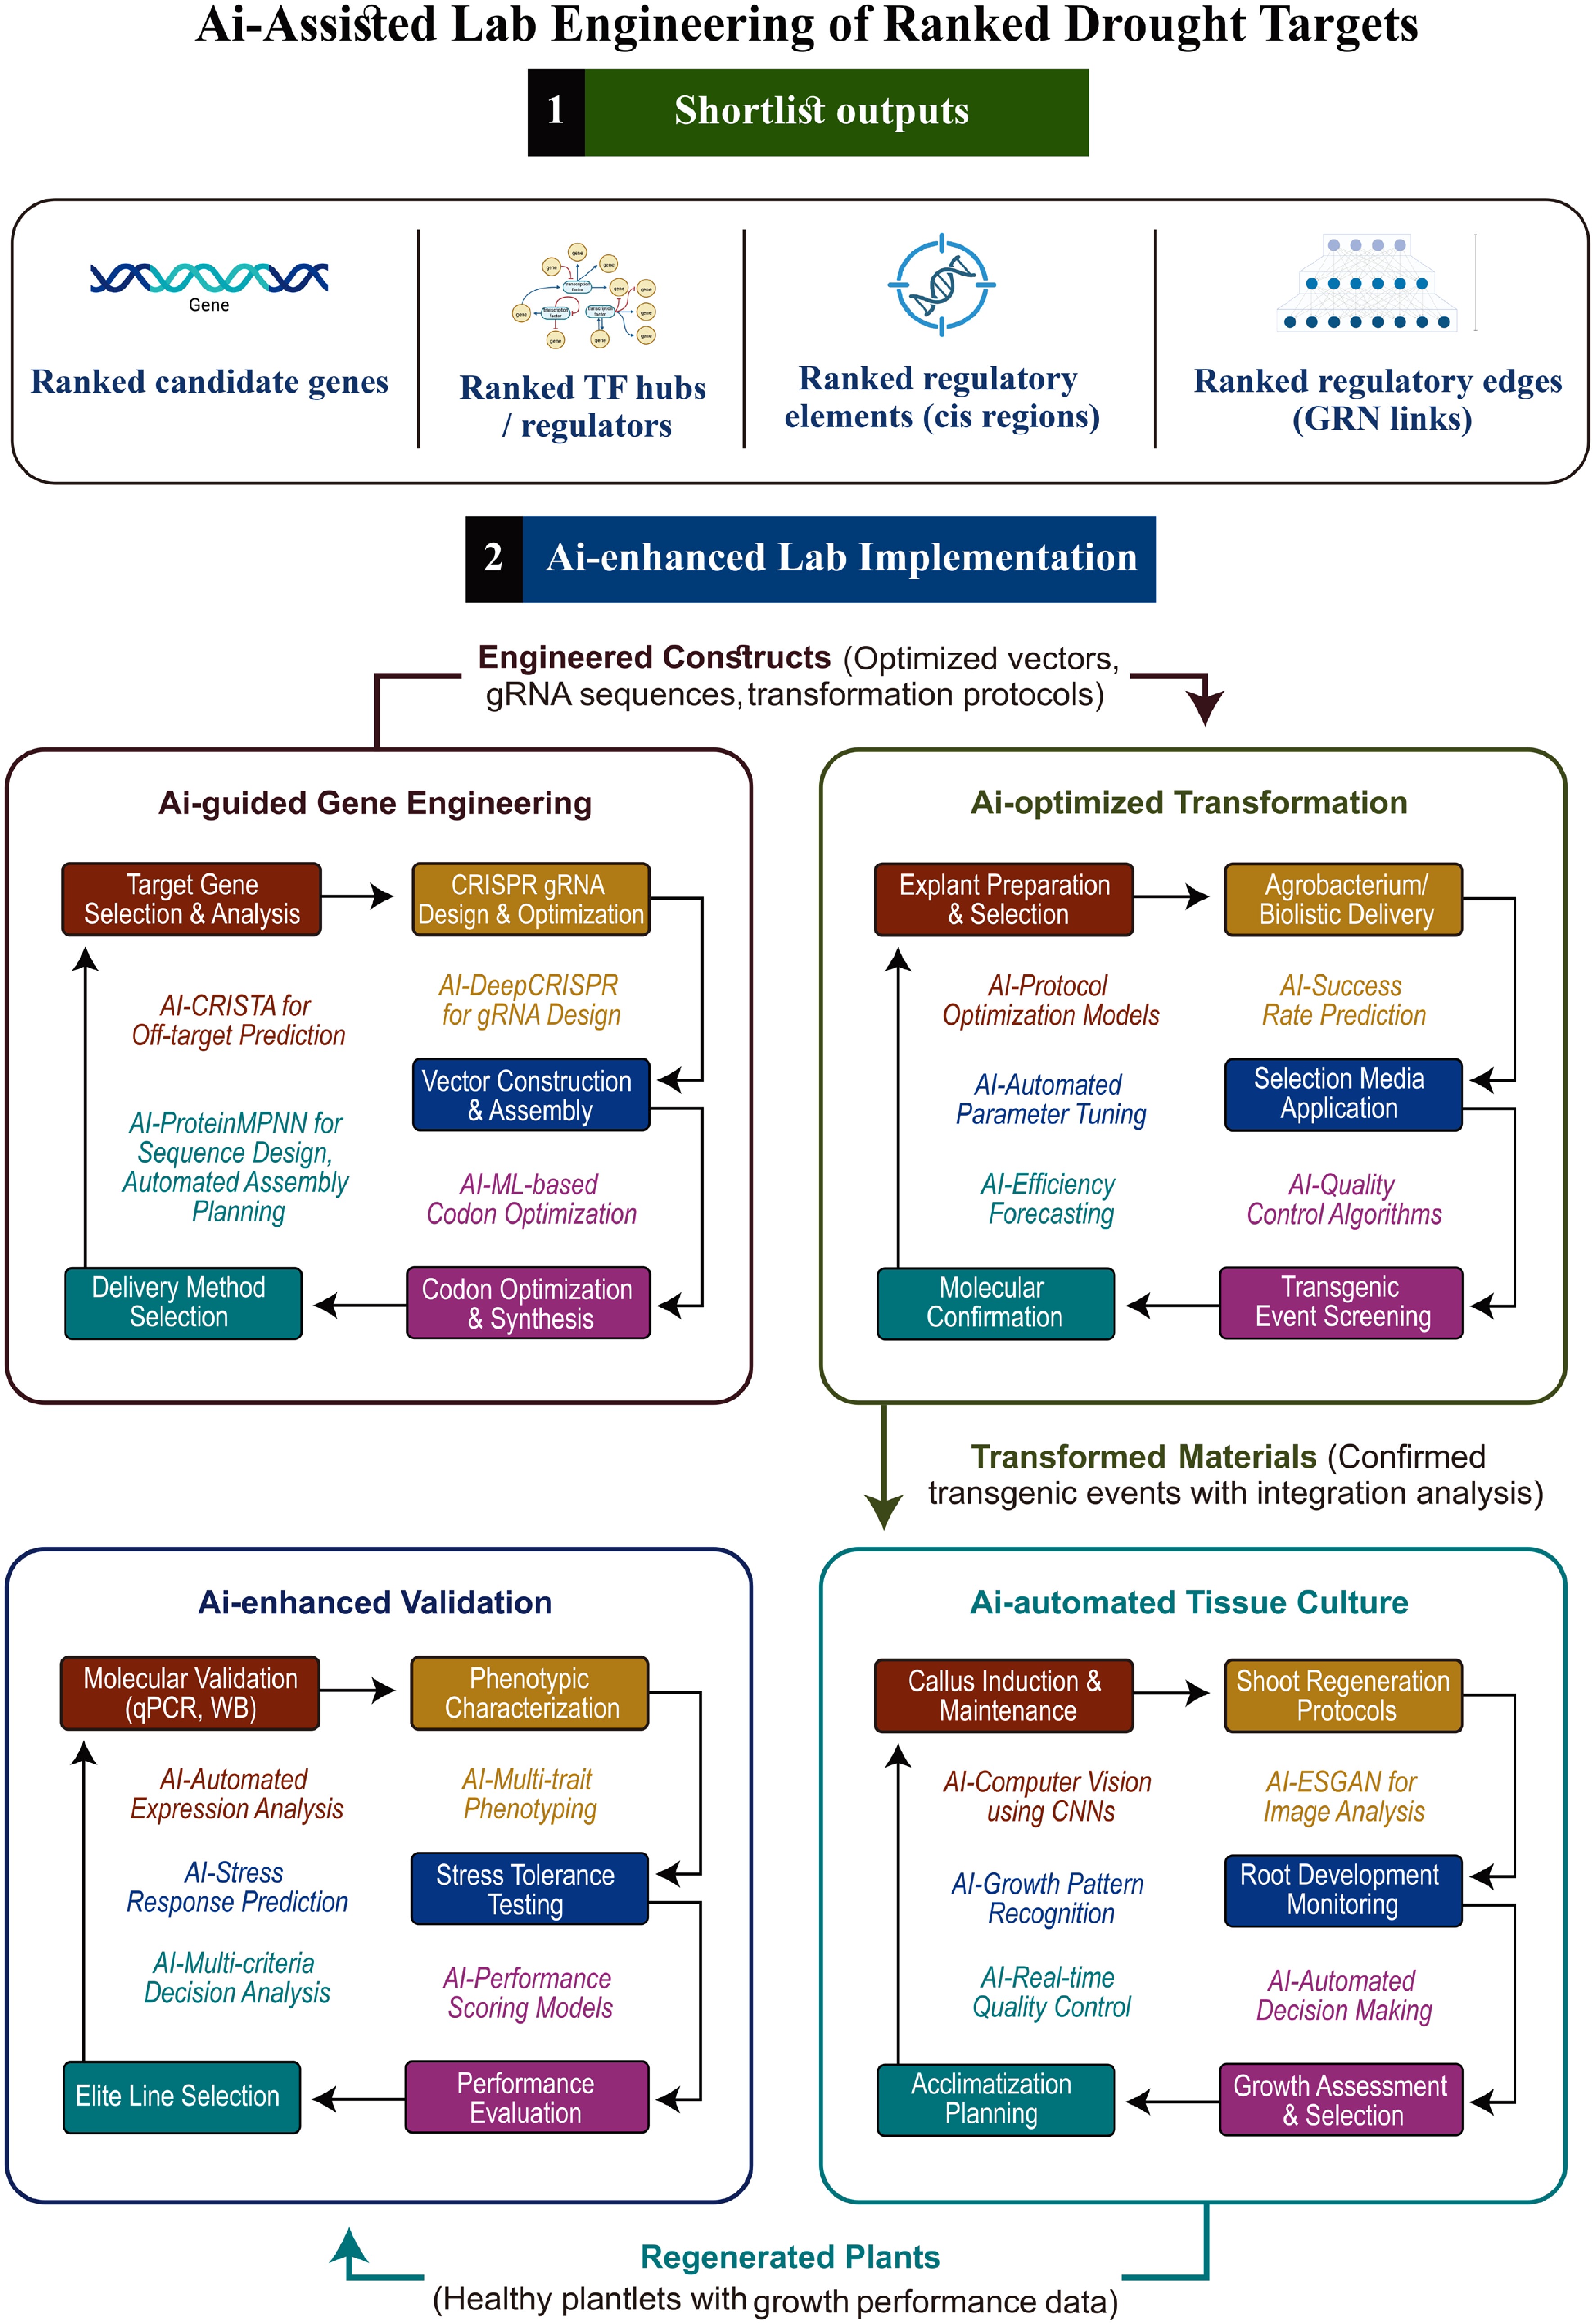
Figure 3.
AI-assisted lab engineering of ranked drought targets. Ranked candidate genes, regulators, and regulatory elements are engineered into constructs. AI-guided gene engineering optimizes CRISPR gRNA design (A-CRISTA, DeepCRISPR), vector assembly (ProteinMPNN), codon optimization, and delivery methods. AI-optimized transformation uses predictive models to guide explant preparation, delivery (Agrobacterium/biolistic), selection, and molecular confirmation. Confirmed transgenic events proceed through AI-automated tissue culture (callus induction, regeneration, rooting) and AI-enhanced validation (molecular, phenotypic, and stress-tolerance testing). The pipeline culminates in regenerated plants with validated growth performance.
-
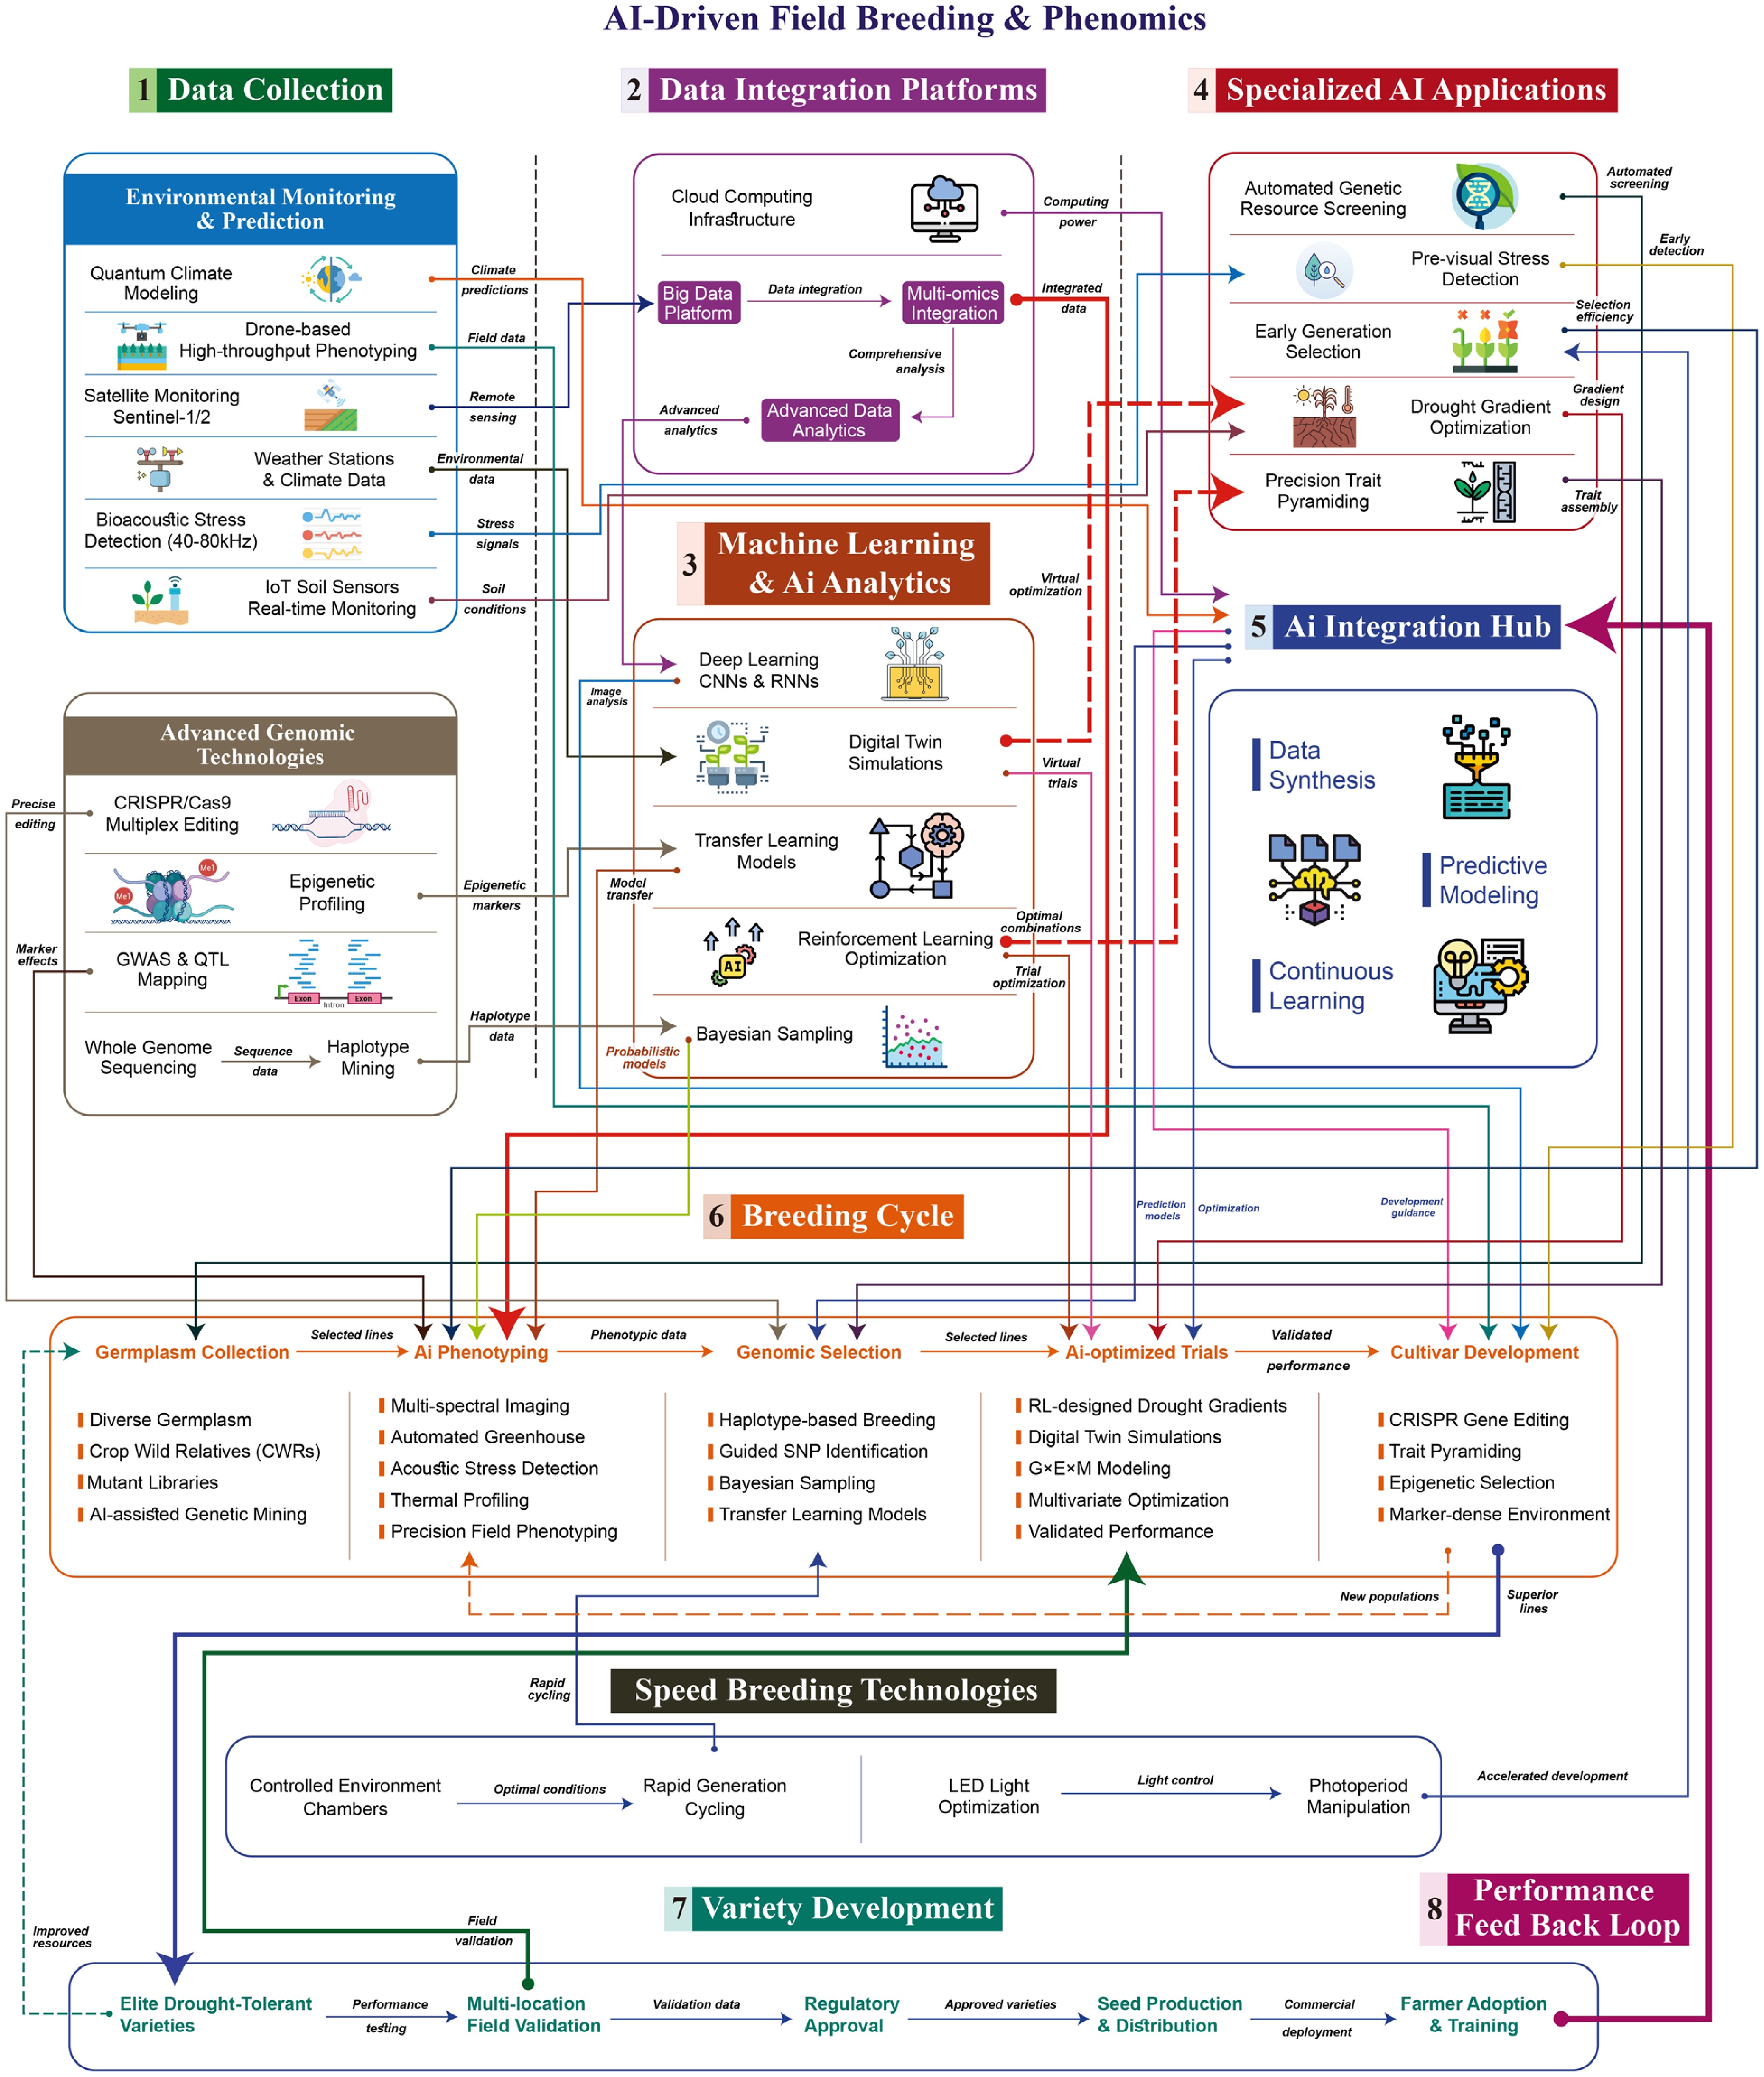
Figure 4.
AI-driven field breeding and phenomics pipeline for drought-resilient crops. The closed-loop workflow integrates field data and genomics to accelerate cultivar development. (1) Data collection: Environmental monitoring (satellites/UAVs, IoT sensors, plant bioacoustics) and genomic inputs (sequencing, GWAS, CRISPR). (2) Data integration: Cloud-based platforms harmonize multi-source data. (3) AI analytics: Deep learning, transfer learning, Bayesian sampling, reinforcement learning, and digital-twin simulations. (4) AI applications: Automated genetic screening, pre-visual stress detection, early-generation selection, drought-gradient optimization, and precision trait pyramiding. (5) AI hub: Synthesizes data, runs predictive models, and enables continuous learning. (6) Breeding cycle: Germplasm collection → AI phenotyping → genomic selection → AI-optimized trials → cultivar development (CRISPR, trait pyramiding). (7) Variety development: Speed breeding accelerates generation turnover; elite lines undergo multi-location validation, regulatory approval, and seed distribution. (8) Feedback loop: Field performance data retrain models and refine selection strategies, closing the iterative cycle.
-
No. Task Algorithm Data/sensor Crop/system Key outcome (reported) Scale Ref. 1 Yield mapping Random Forest; functional linear regression Sentinel-2 time series Canola (B. napus) Yield error 12%–16% Producer field datasets [51] 2 Early crop mapping (seasonal windows) InceptionTime (DL); Random Forest Sentinel-1 SAR time series Rapeseed F1 ≈ 95% (same year full season); early season F1 77%–89% Dept.-scale regions (FR) [52] 3 Flowering phenotyping → yield proxy Thresholded NDYI; linear models UAV multispectral Canola Flower count R2 up to 0.95; yield R2 up to 0.42 Five site years [53] 4 Yield prediction in breeding pipeline XGBoost; Random Forest UAV remote sensing + breeding data Peanut Best models R2 up to 0.93 Breeding program [54] 5 Root zone soil moisture estimation RF, SVM, BPNN, ELM Plot hyperspectral (incl. red-edge) Rapeseed RF model: R2 0.944 (0–20 cm), RMSE 0.005 Field plots [55] 6 Genomic prediction (trait prediction) XGBoost; Random Forest vs DL Genome-wide markers Soybean ML > DL in 13/14 prediction tasks Multi trait dataset (n ≈ 1,110) [56] 7 Web deployable DL for GP Deep neural nets (SoyDNGP) Genotypes + historical phenotypes Soybean End-to-end DL framework (GP service) Germplasm scale [57] 8 Compact GP under G × E RF (50 SNP subset) vs full models Multi env. breeding data Soybean Small RF ≈ full models' ability Multi env. scenarios [58] 9 Drought gene discovery Multi locus GWAS + RNA seq Field trials + omics Sunflower Candidate drought tolerance loci identified Panel n = 226 [59] 10 Image based tissue metrics Deep CNN device for leaf area Non destructive leaf area Rapeseed DL device quantified leaf area in situ Device/controlled [60] 11 Callus developmental roadmap Time series RNA seq + network mining Callus induction time course Soybean Key callus regulators mapped for culture optimization Lab time series [61] 12 Functional genomics atlas Review + case syntheses Multi omic targets in stress Rapeseed Stress tolerance targets summarized for editing _ [62] 13 PAM-less CRISPR toolkit SpRY (engineered Cas9); broad target design and scoring gRNA design; PAM expansion Soybean Greatly expanded editable sites; validated in planta _ [63] 14 Early drought impact detection & nowcasting Random Forest; decomposition of physiological vs structural signals Satellite SIF + optical/thermal archives Multi-crop landscapes Physiological changes explained 60%–97% of functional response; anomalies detectable ~1 month before drought peak in drier regions Global [64] 15 Sub-seasonal soil-moisture drought forecasting RISE-UNet deep learning (physics-aware) Reanalysis + in-situ soil moisture Multi-crop regions Skillful forecasts at 1 to 4 weeks lead times for soil-moisture drought Global hindcasts [36] 16 Field digital twins for management and quality Digital-twin ML framework Multisensor orchard data (weather, soil, imagery) Citrus (mandarin) Intra-orchard analysis explained more variation in quality than inter-orchard; demonstrated operational twin Commercial orchards [65] 17 Wheat disease phenotyping from UAV imagery ML pipeline on spectral features UAV multispectral/hyperspectral Wheat Demonstrated aerial disease detection and mapping (leaf rust/other) Field plots [66] 18 Sub-canopy crop–soil discrimination Spectral unmixing (linear, bilinear, sparse) Drone hyperspectral + ground HSI Vegetables (field setting) 99%–100% crop–soil discrimination depending on height and endmember source Field trial [67] 19 Global UAV trait dataset (N status and yield) Meta-analysis dataset enabling ML UAV RGB/multispectral/hyperspectral (compiled) 11 major crops 11,189 observations across 41 studies; VI–trait relationships by stage 13 countries [68] 20 Regional wheat yield prediction 1D-CNN vs ML baselines Weather, soil, phenology Wheat CNN outperformed traditional models for county-level yield 271 counties (Germany) [69] 21 Genomics-informed prebreeding Genomic prediction + phenotyping Genome-wide markers + multi-site trials Wheat Prebreeding framework unlocked diversity; advanced progenies out-yielded contemporaries across sites Multi-environment trials [70] 22 Root system adaptation and drought Dynamic genetics + MRI phenotyping MRI of roots + GWAS Maize Allelic variation (e.g., ZmHb77) linked to hydraulic conductance and root architecture under water deficit Seedling to field links [71] 23 Genomic selection platform (production use) AutoGP (integrated ML/DL stack) Genotypes + breeding phenotypes (web platform) Maize End-to-end, breeder-facing GS platform integrating modern ML/DL models; emphasizes reproducibility and deployment Program scale [72] 24 GP with enviromics (G × E) ML models with engineered environment features Markers + climate/soil covariates Multiple crops (breeding datasets) Shows that adding environmental features to ML-based GP efficiently captures G × E Multi-environment [73] 25 Methods guidance for AI-enabled GP Review of statistical ML + software Genomic + phenomic pipelines General crops Practical blueprint for democratizing ML-driven GP; factors that improve accuracy and gains _ [74] 26 Structure-aware editing & complex design AlphaFold 3 (diffusion architecture) Sequence → 3D complexes (protein–DNA/RNA, ligands, ions) General (incl. plant targets) Predicts joint structures and interactions with substantially improved accuracy vs prior methods; enables editor & TF design decisions Foundation model [75] 27 Protein engineering for stress pathways/editors ProteinMPNN (graph NN for sequence design) Target backbones (incl. designed editors, chaperones) General High sequence recovery (~52%) and robust experimental validation; practical for designing enzymes/regulators used in crops Multi-system [21] 28 CRISPR guide design (RNA targeting) DeepCas13/ML models Large CRISPR-Cas13d screens General Deep learning predicts on-target activity and characterizes off-target viability effects for Cas13d Large-scale screens [76] 29 Generative gRNA design BADGERS (model-directed Cas13a guide generation) Population-scale genomes General Model-generated guides improved nucleic-acid detection sensitivity and variant discrimination vs conventional designs Multi-virus datasets [77] 30 Cell-specific GRN inference (target nomination) scMultiomeGRN (cross-modal attention + GNN) Single-cell multiome (RNA + ATAC) General DL framework outperforms prior GRN inference; supports identifying cell-type-specific regulators for editing Multi-dataset [78] 31 Microscopy automation for lab phenotyping LVACR (deep-learning 3D segmentation/aggregation) Light-sheet & X-ray imaging Plant tissues Fully automated 3D cell reconstruction; enables atlas-level quantitation for regeneration and culture optimization Multi-tissue atlas [79] 32 Organelle/structure segmentation OrgSegNet/Plantorganelle Hunter (DL segmentation) Confocal/light microscopy Plant cells State-of-the-art organelle segmentation across species; supports quantitative lab pipelines Cross-species [80] 33 Cell-type-agnostic regulatory prediction Multi-modal Transformer (masked-accessibility pre-training) DNA sequence + chromatin accessibility General Learns regulatory representations to predict expression and nominate causal motifs/links—useful for promoter/circuit design Multi-modal [81] Table 1.
AI-driven field phenotyping and lab-to-field genomic approaches in crops.
-
No. Component in drought-intelligence pipeline Evidence maturity What is still missing for field reliability Example evidence 1 CNN/vision models on UAV/field imagery Multiple field phenotyping studies + growing open datasets Standardized splits (site/year-held-out), label harmonization, calibration reporting [7] 2 Bioacoustic drought sensing Controlled chamber/greenhouse feasibility with ML classification Multi-site field trials, sensor standardization, confound controls (wind/insects/machinery) [28] 3 Network/GRN inference to prioritize targets Experimental validation exists in model plants Translation rate to crops, causal verification under drought field conditions [39] 4 G × E-aware genomic prediction (envirotyping + ML/transformers) Tested in realistic breeding scenarios incl. untested environments Consensus on evaluation protocols + integration with breeder decision rules [88] 5 ML combining genetic + environmental features in MET Demonstrated gains over classical baselines in MET settings Portability across regions, transparent envirotyping standards [73] 6 Digital twins for crop systems Working agricultural DT demonstration in a subtropical perennial crop Wider drought-focused validation, integration with intervention policies [65] 7 Multisensor benchmarks (EO) Benchmark datasets exist in adjacent domains Plant-stress specific benchmarks spanning sensors + physiology ground truth [94] Table 2.
AI model evidence maturity/readiness.
Figures
(4)
Tables
(2)