-
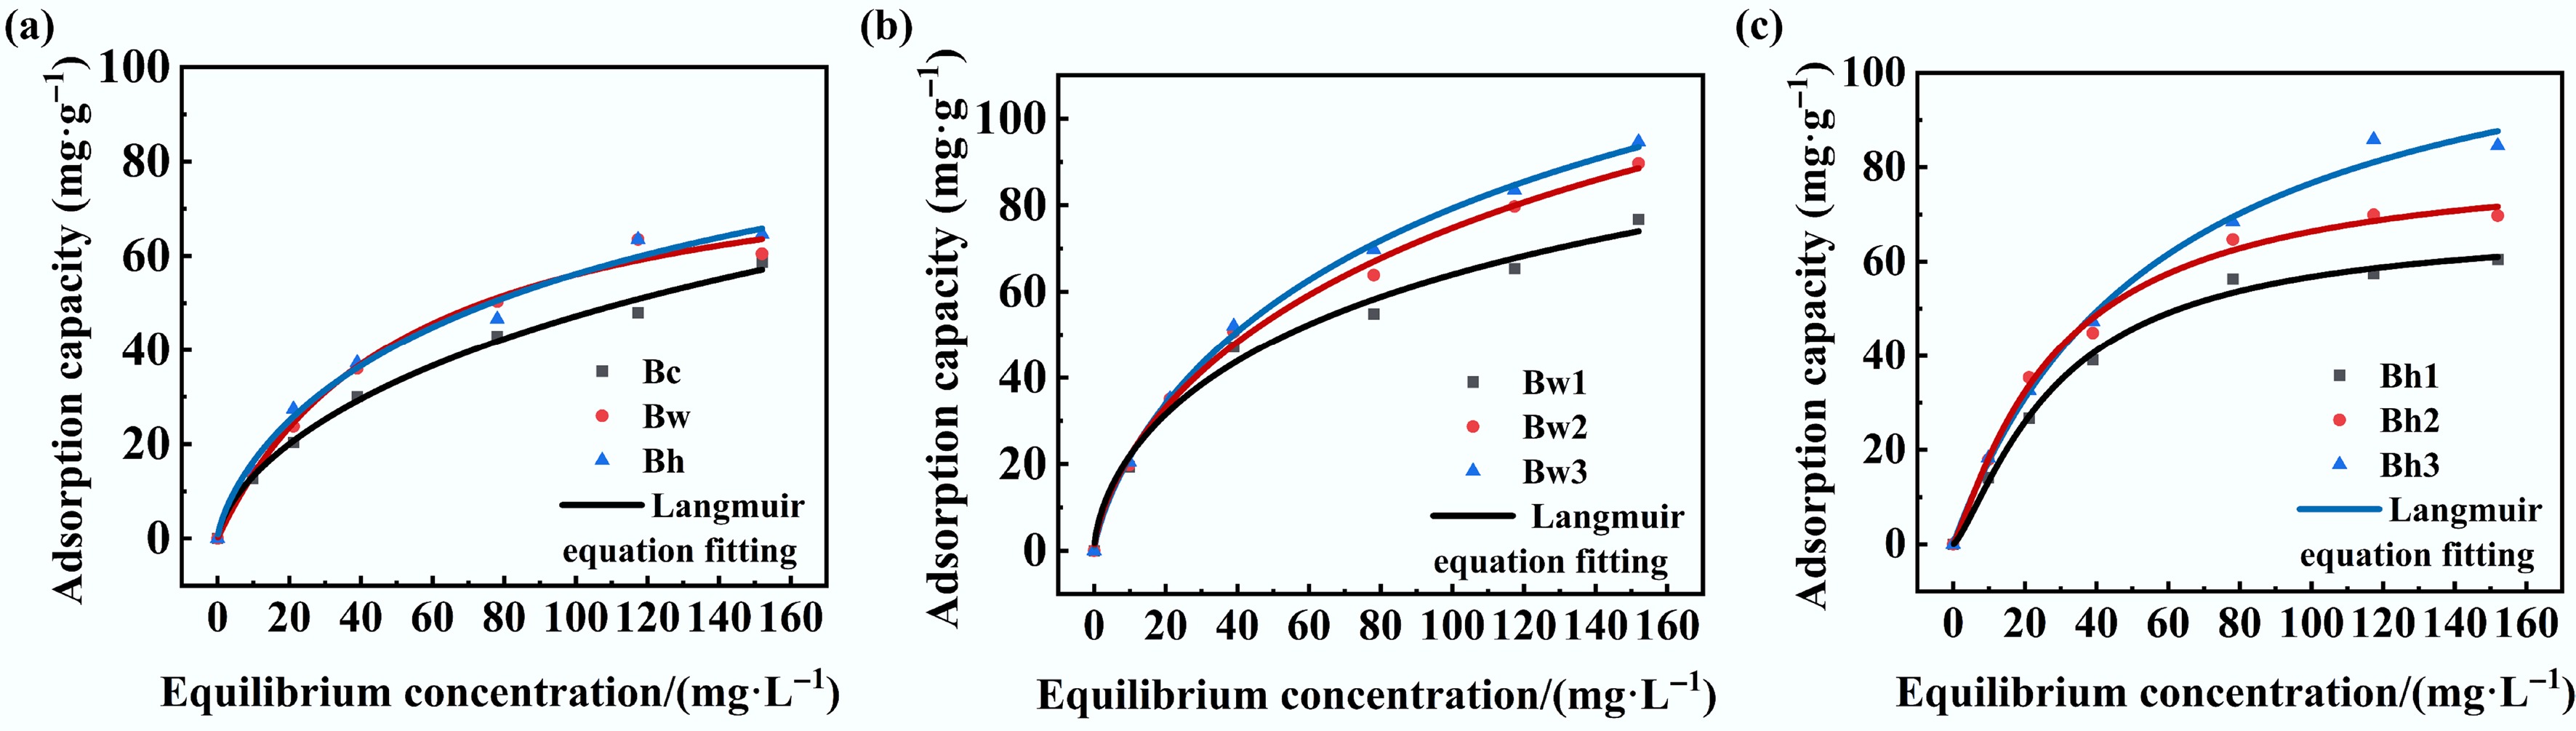
Figure 1.
Isothermal adsorption equations of Cd2+ by different modified biochar-DOM composites; (a) represents the Freundlich equation fitting of Cd adsorption by biochar alone; (b) represents the Freundlich equation fitting of Cd adsorption by water-washed biochar combined with DOM; and (c) represents the Freundlich equation fitting of Cd adsorption by acid washed-biochar combined with DOM.
-
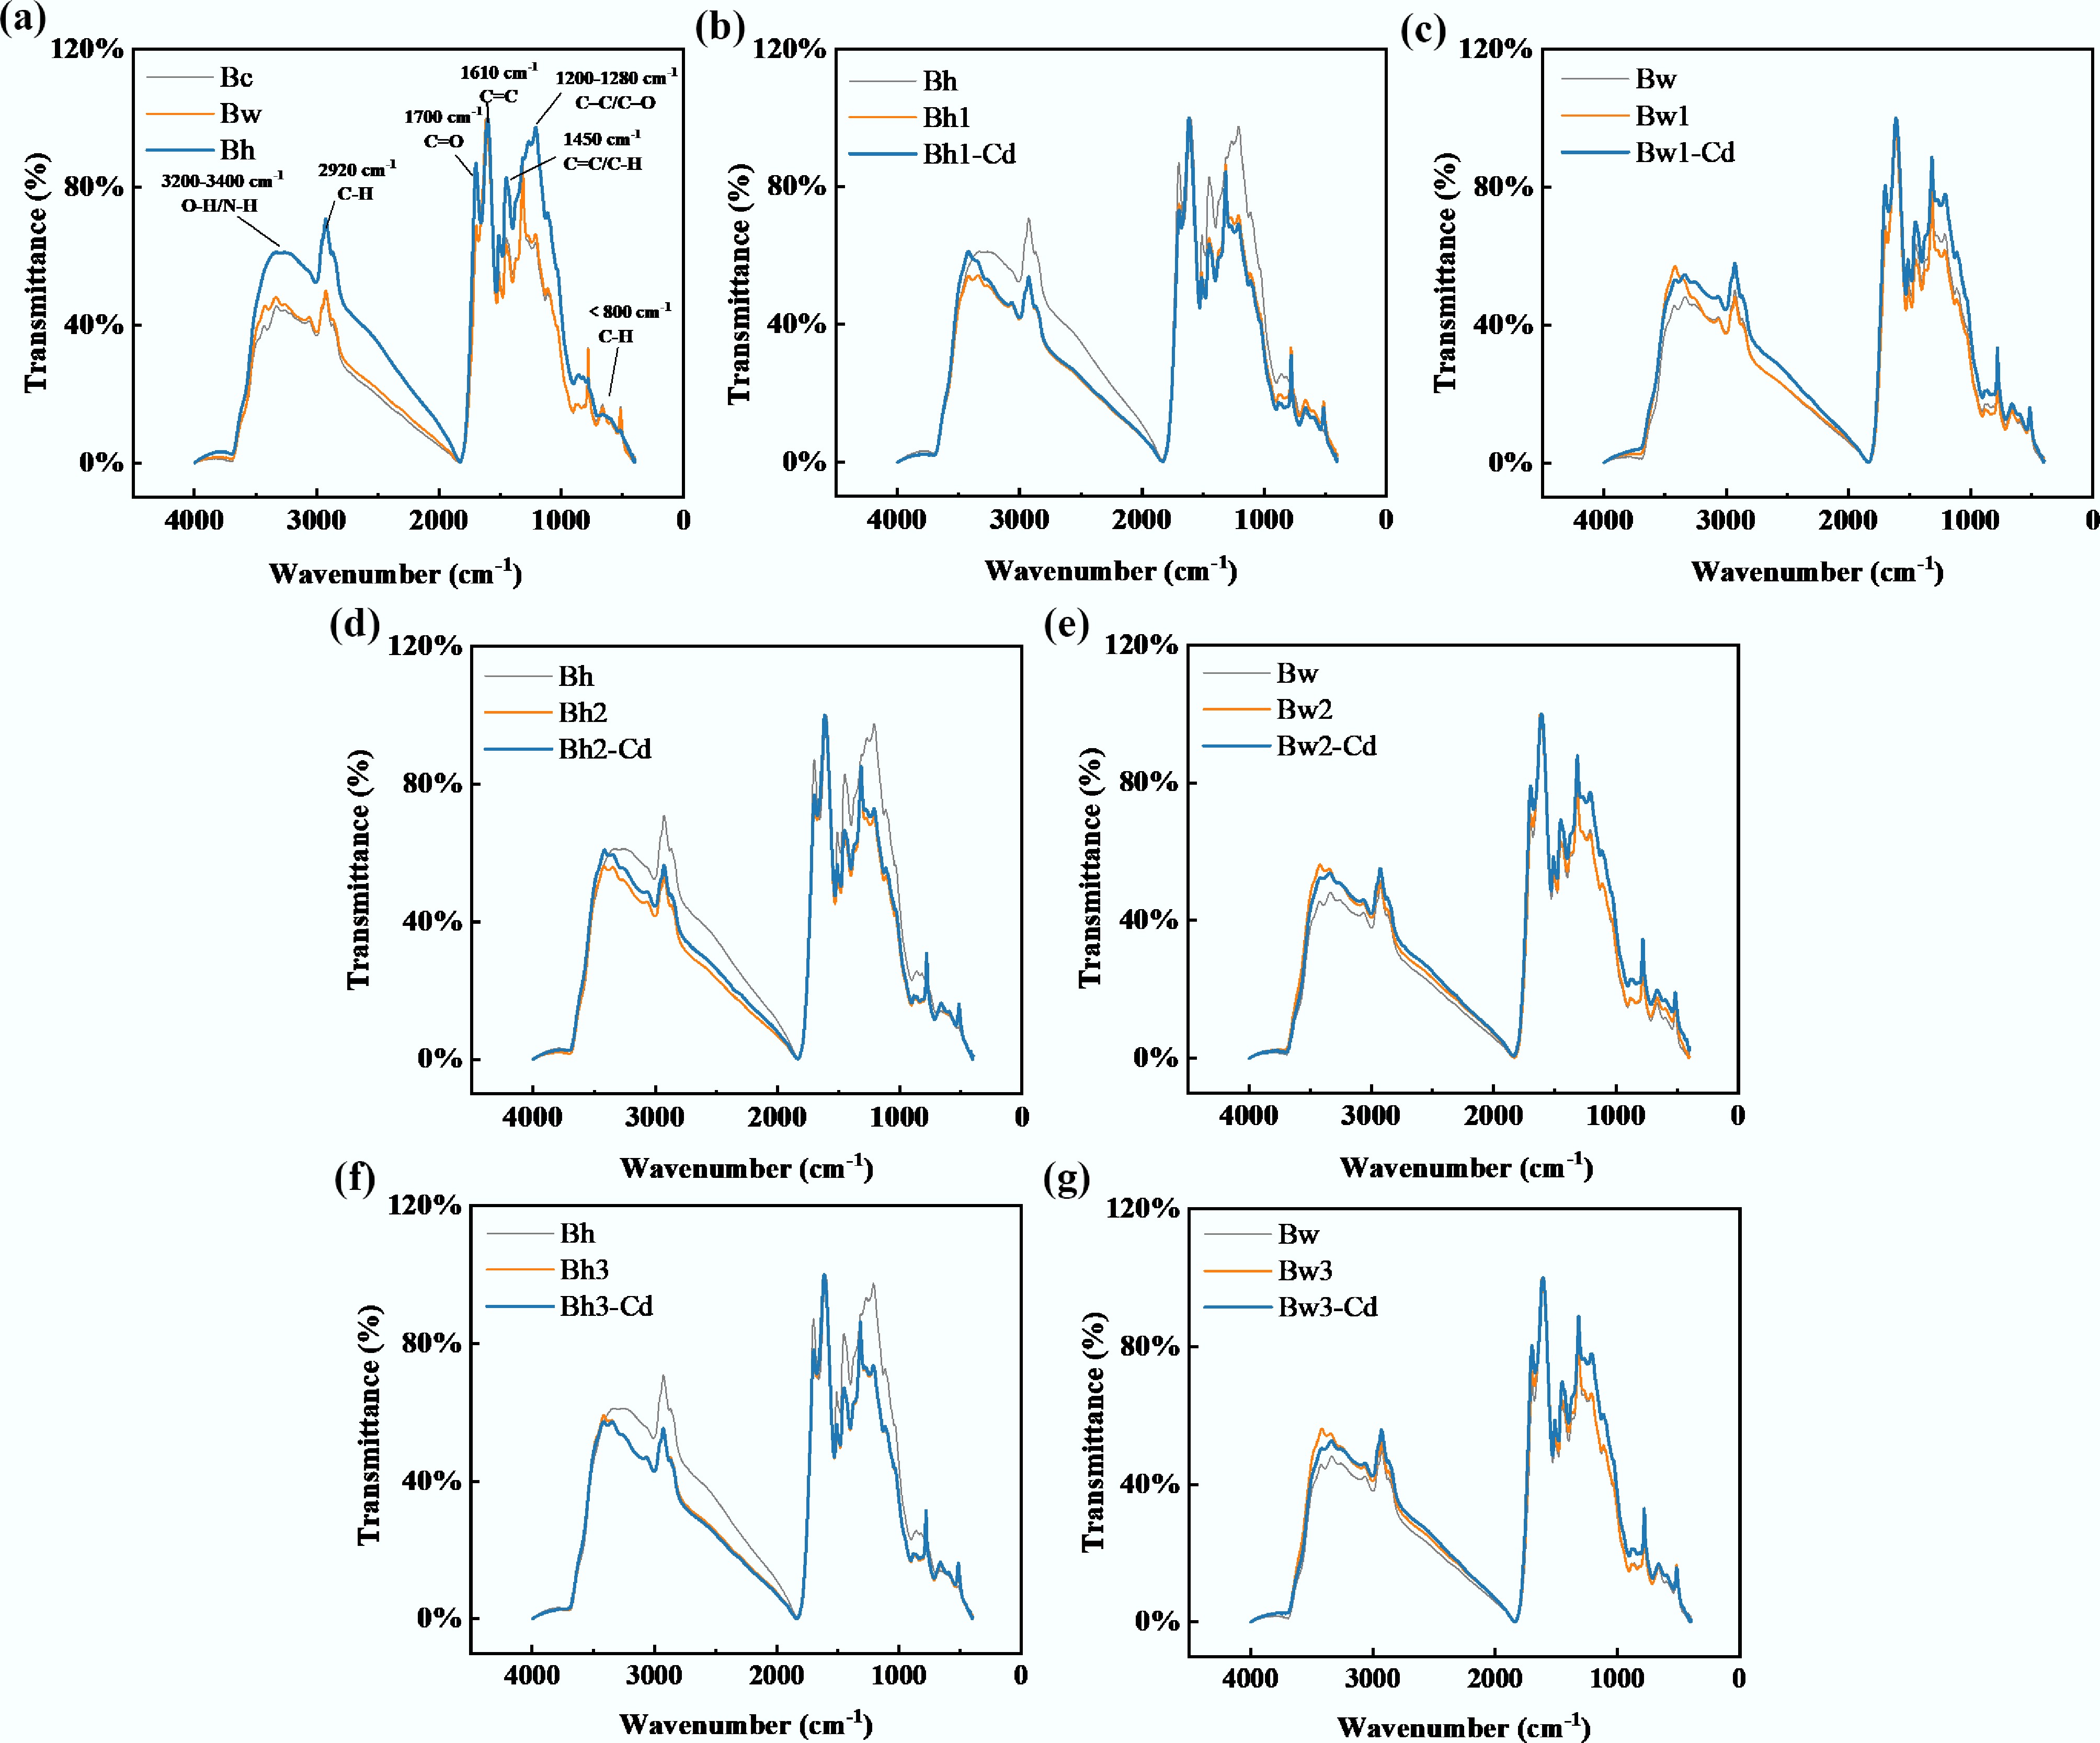
Figure 2.
FTIR spectra of the different modified biochar-DOM composites before and after Cd2+ adsorption; (a) represents the FTIR spectra of original biochar (Bc), acid-washed biochar (Bw), and water-washed biochar (Bh); (b) represents the spectra of Bh, Bh1, and Bh1-Cd; (c) represents the spectra of Bw, Bw1, and Bw1-Cd; (d) represents the spectra of Bh, Bh2, and Bh2-Cd; (e) represents the spectra of Bw, Bw2, and Bw2-Cd; (f) represents the spectra of Bh, Bh3, and Bh3-Cd; (g) represents the spectra of Bw, Bw3 and Bw3-Cd). The combination of Bw and DOM<3k is denoted as Bw1; Bw1 combines with Cd to form Bw1-Cd; the combination of Bw and DOM3k–10k is denoted as Bw2; Bw2 combines with Cd to form Bw2-Cd; the combination of Bw and DOM>10k is denoted as Bw3; Bw3 binds to Cd to form Bw3-Cd; the combination of Bh and DOM<3k is denoted as Bh1; Bh1 binds to Cd to form Bh1-Cd; the combination of Bh and DOM3k–10k is denoted as Bh2; Bh2 combines with Cd to form Bh2-Cd; the combination of Bh and DOM>10k is denoted as Bh3; Bh3 combines with Cd to form Bh3-Cd.
-
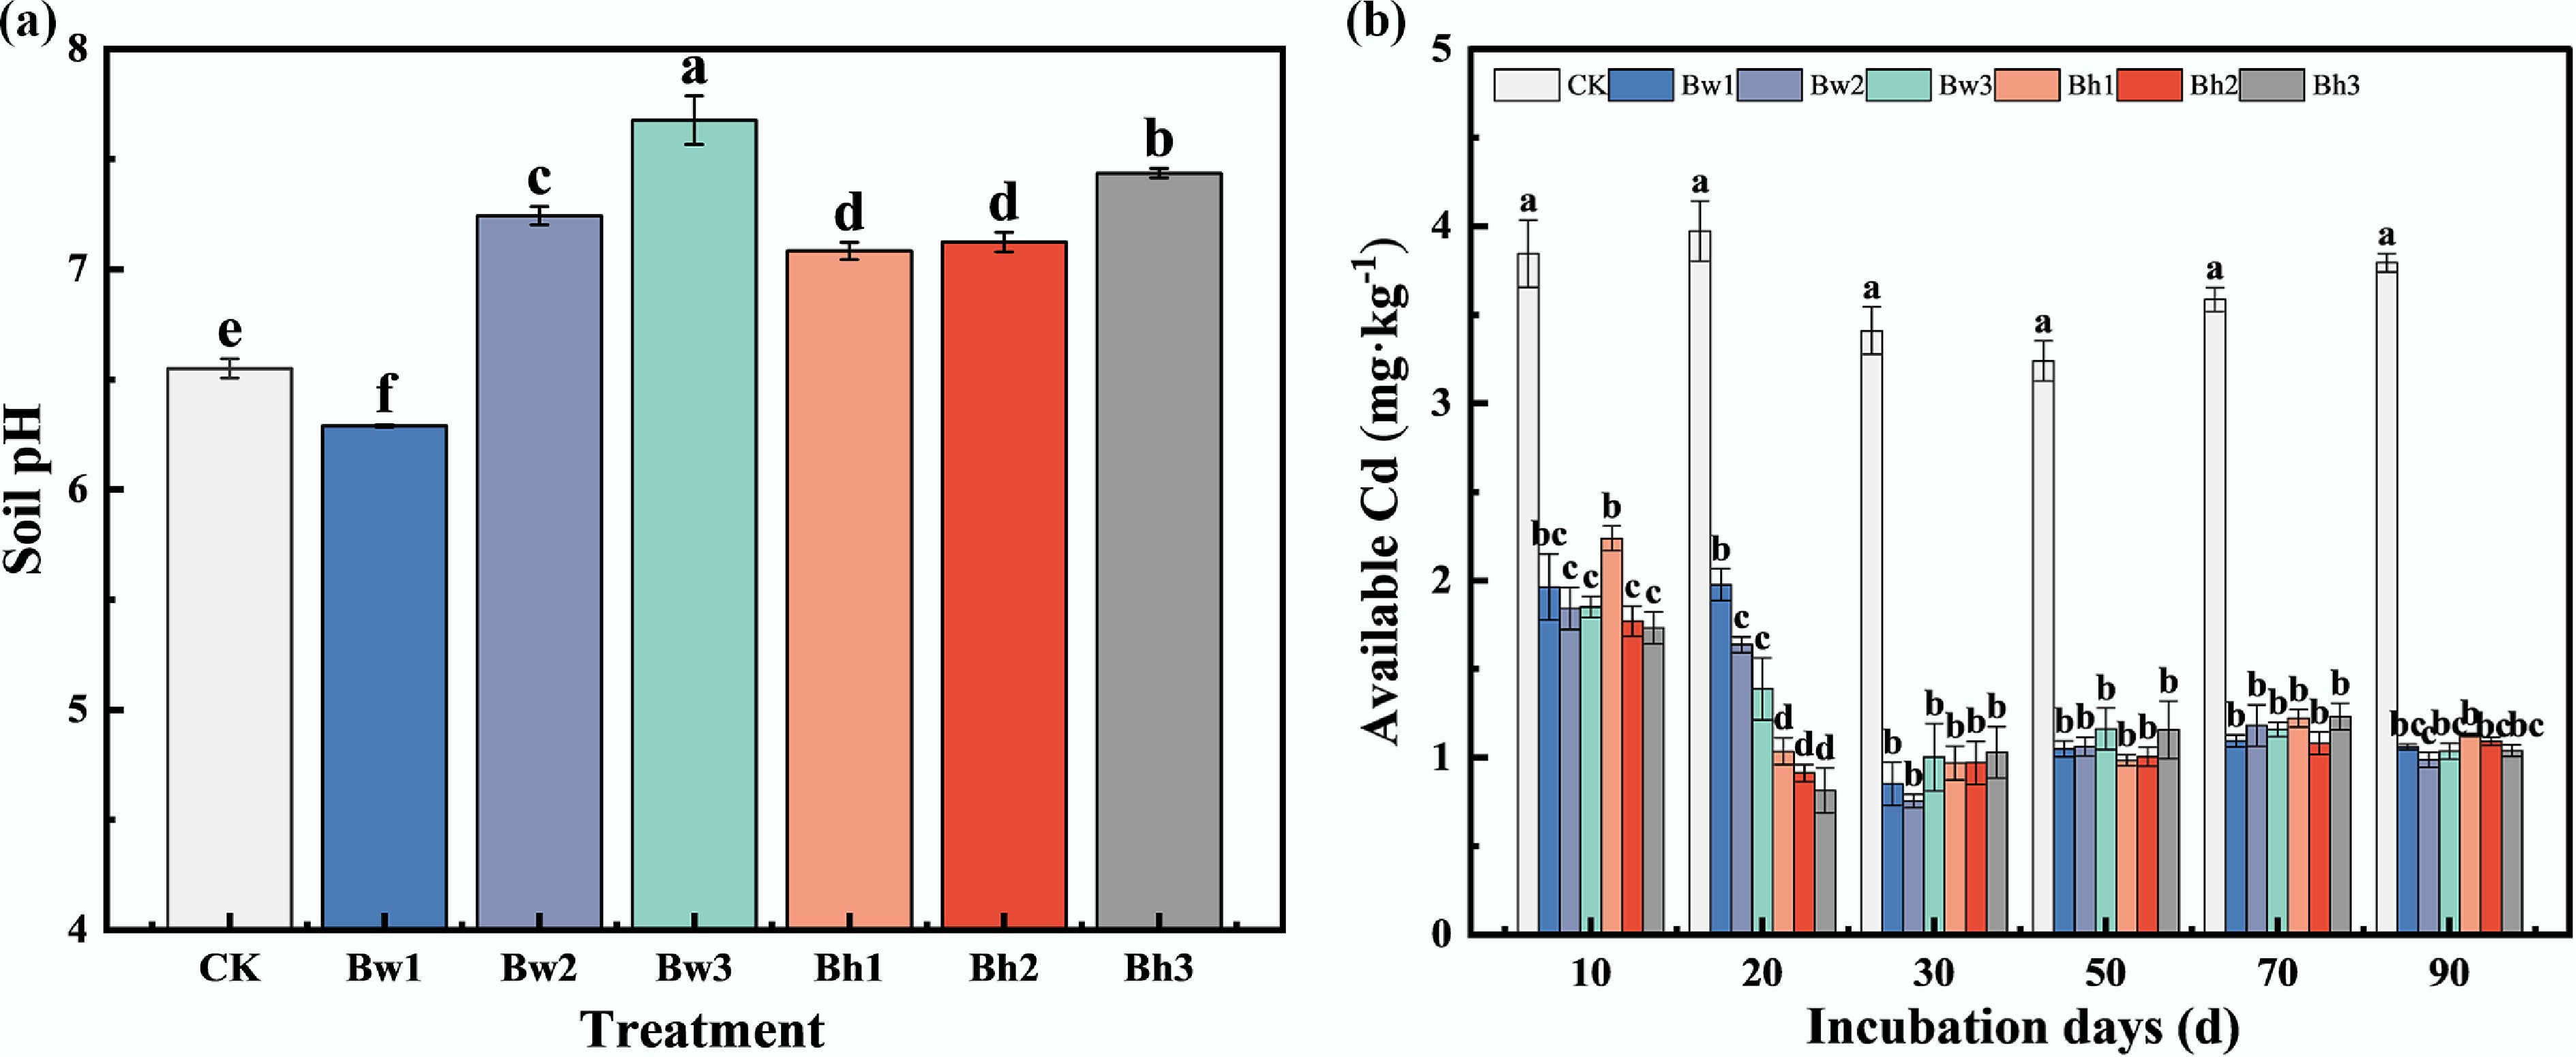
Figure 3.
Effects of different biochar-DOM complexes on (a) soil pH, and (b) available Cd content. CK: control treatment; Bc: biochar; Bw: biochar washed with deionized water; Bw1: Bw + DOM<3k; Bw2: Bw + DOM3k–10k; Bw3: Bw + DOM>10k; Bh: biochar washed with dilute hydrochloric acid; Bh1: Bh + DOM<3k; Bh2: Bh + DOM3k–10k; Bh3: Bh + DOM>10k. Values in the figure are presented as means (n = 3), and different letters indicate significant differences among treatments (p < 0.05). The same applies below.
-
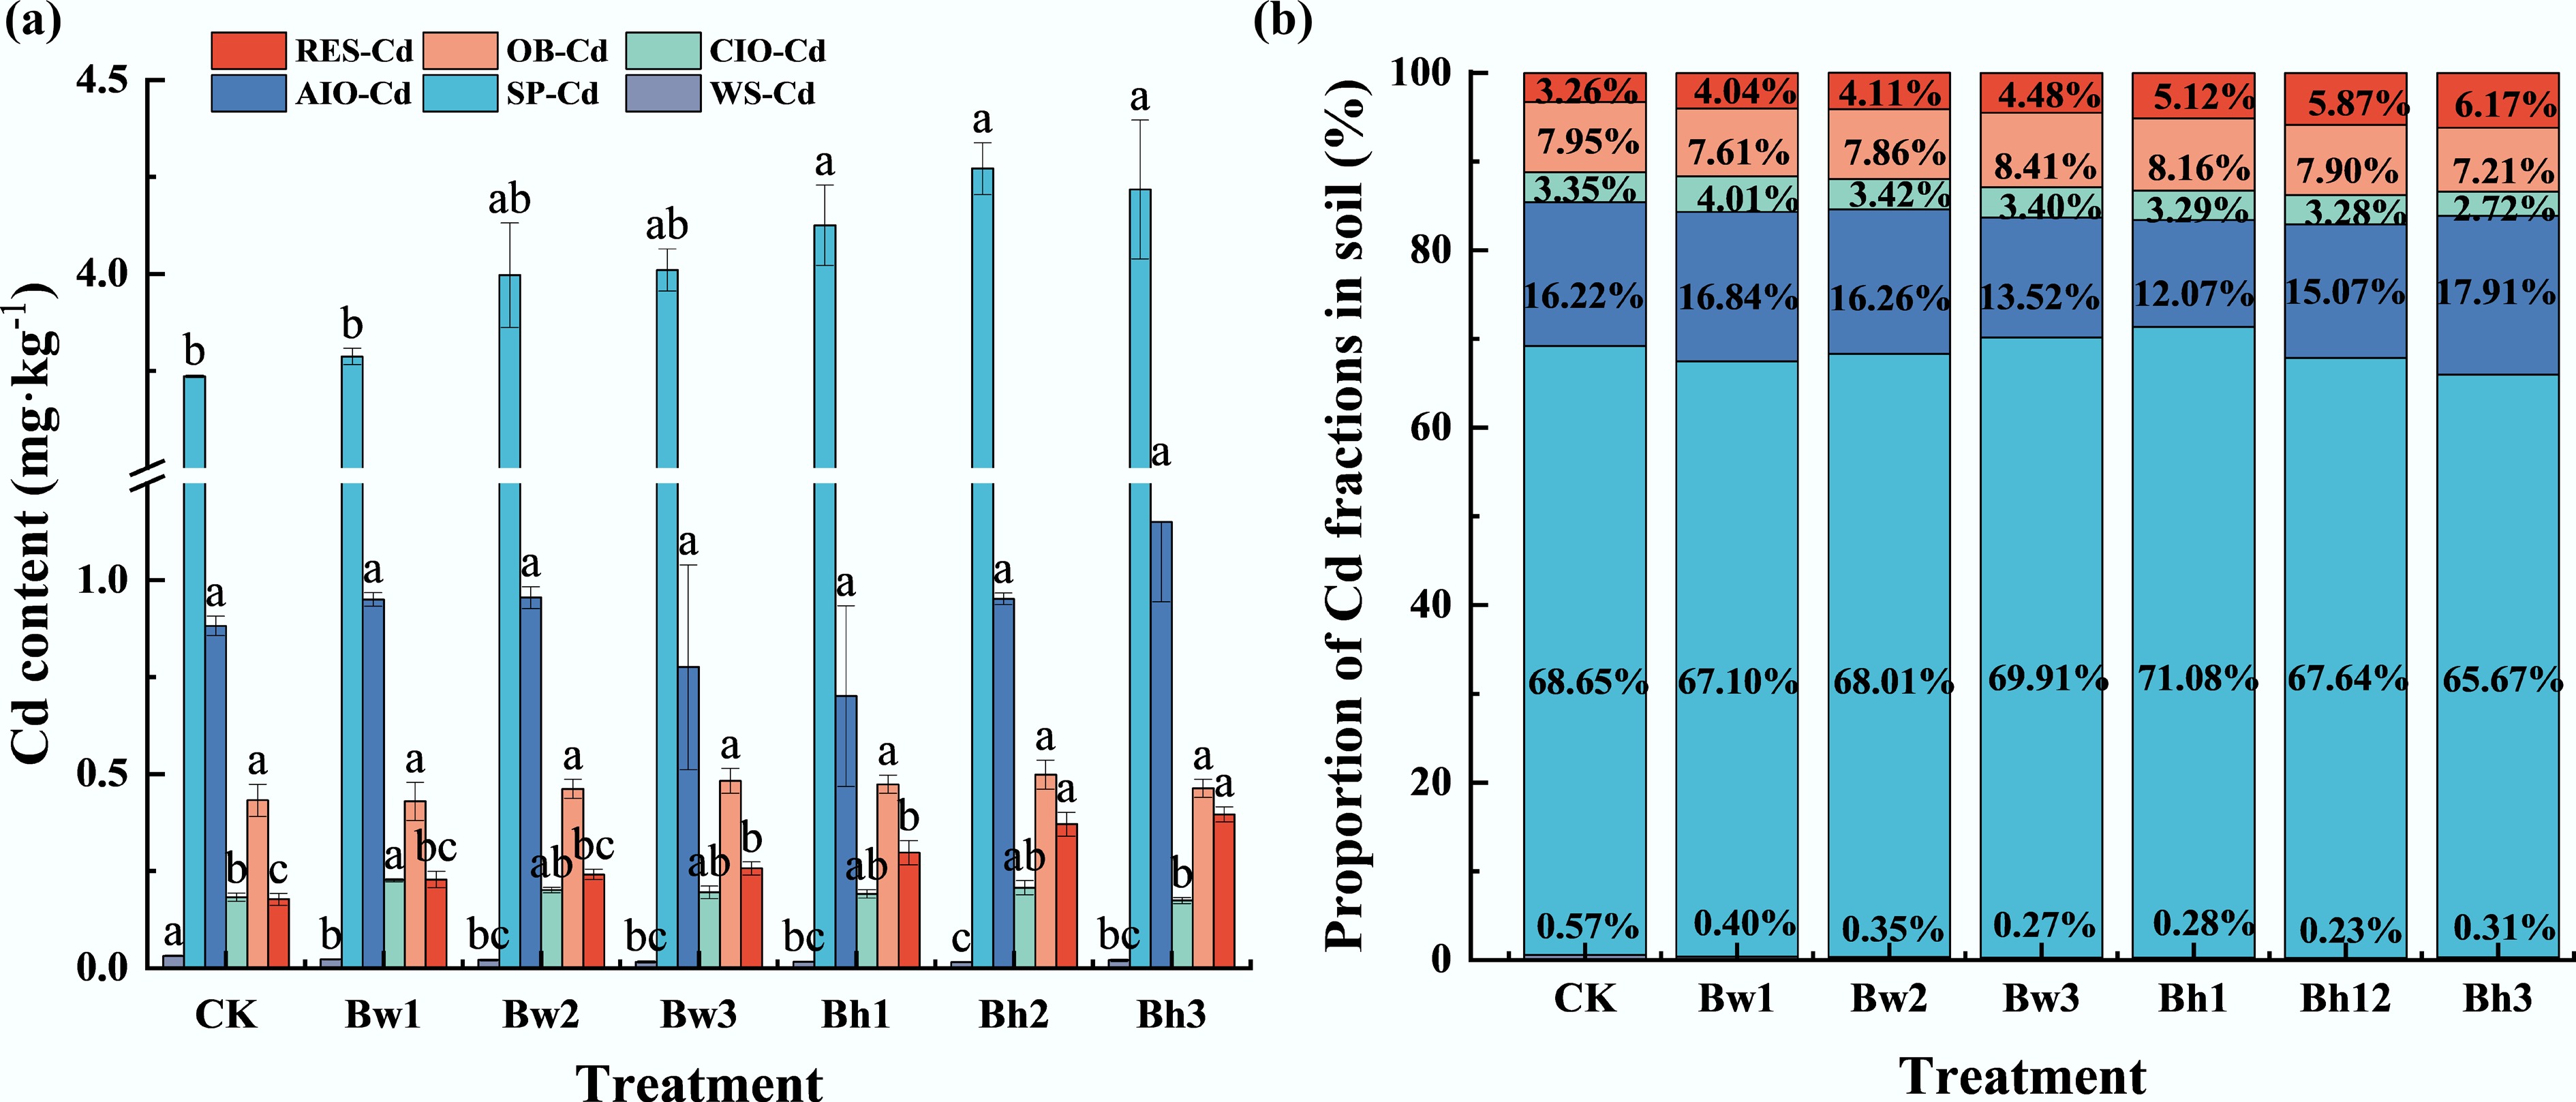
Figure 4.
Effects of different biochar-DOM composites with varying molecular weight ranges on soil Cd fractions. (a) represents the concentration of different forms of Cd in soil under different molecular weight biochar-DOM composites; (b) represents proportion of Cd fractions in soil under different molecular weight biochar-DOM composites.
-
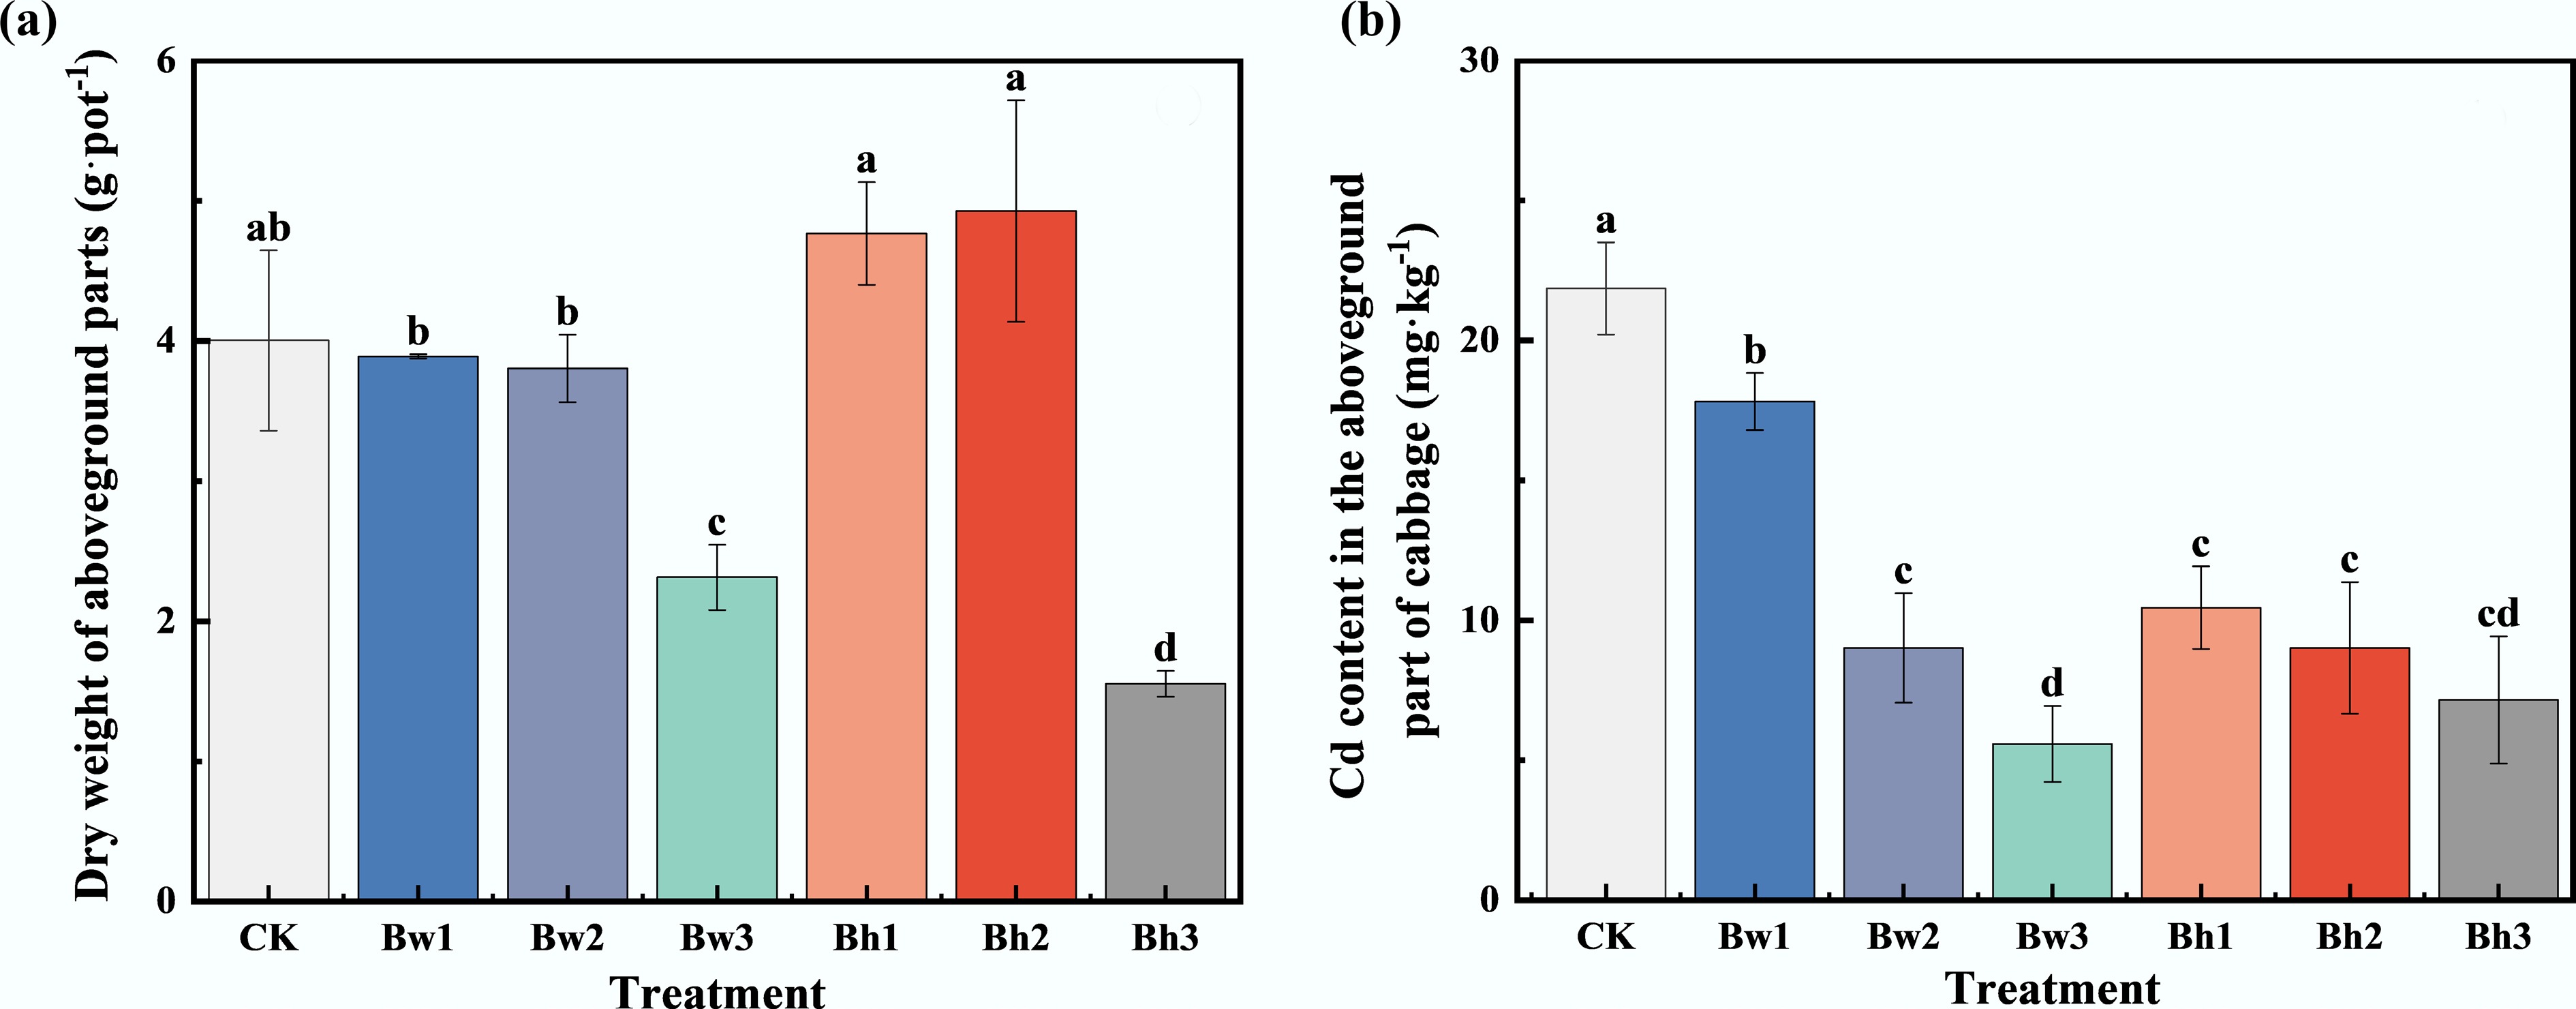
Figure 5.
Differences in (a) cabbage yield, and (b) Cd content with the addition of different biochar-DOM composites.
-
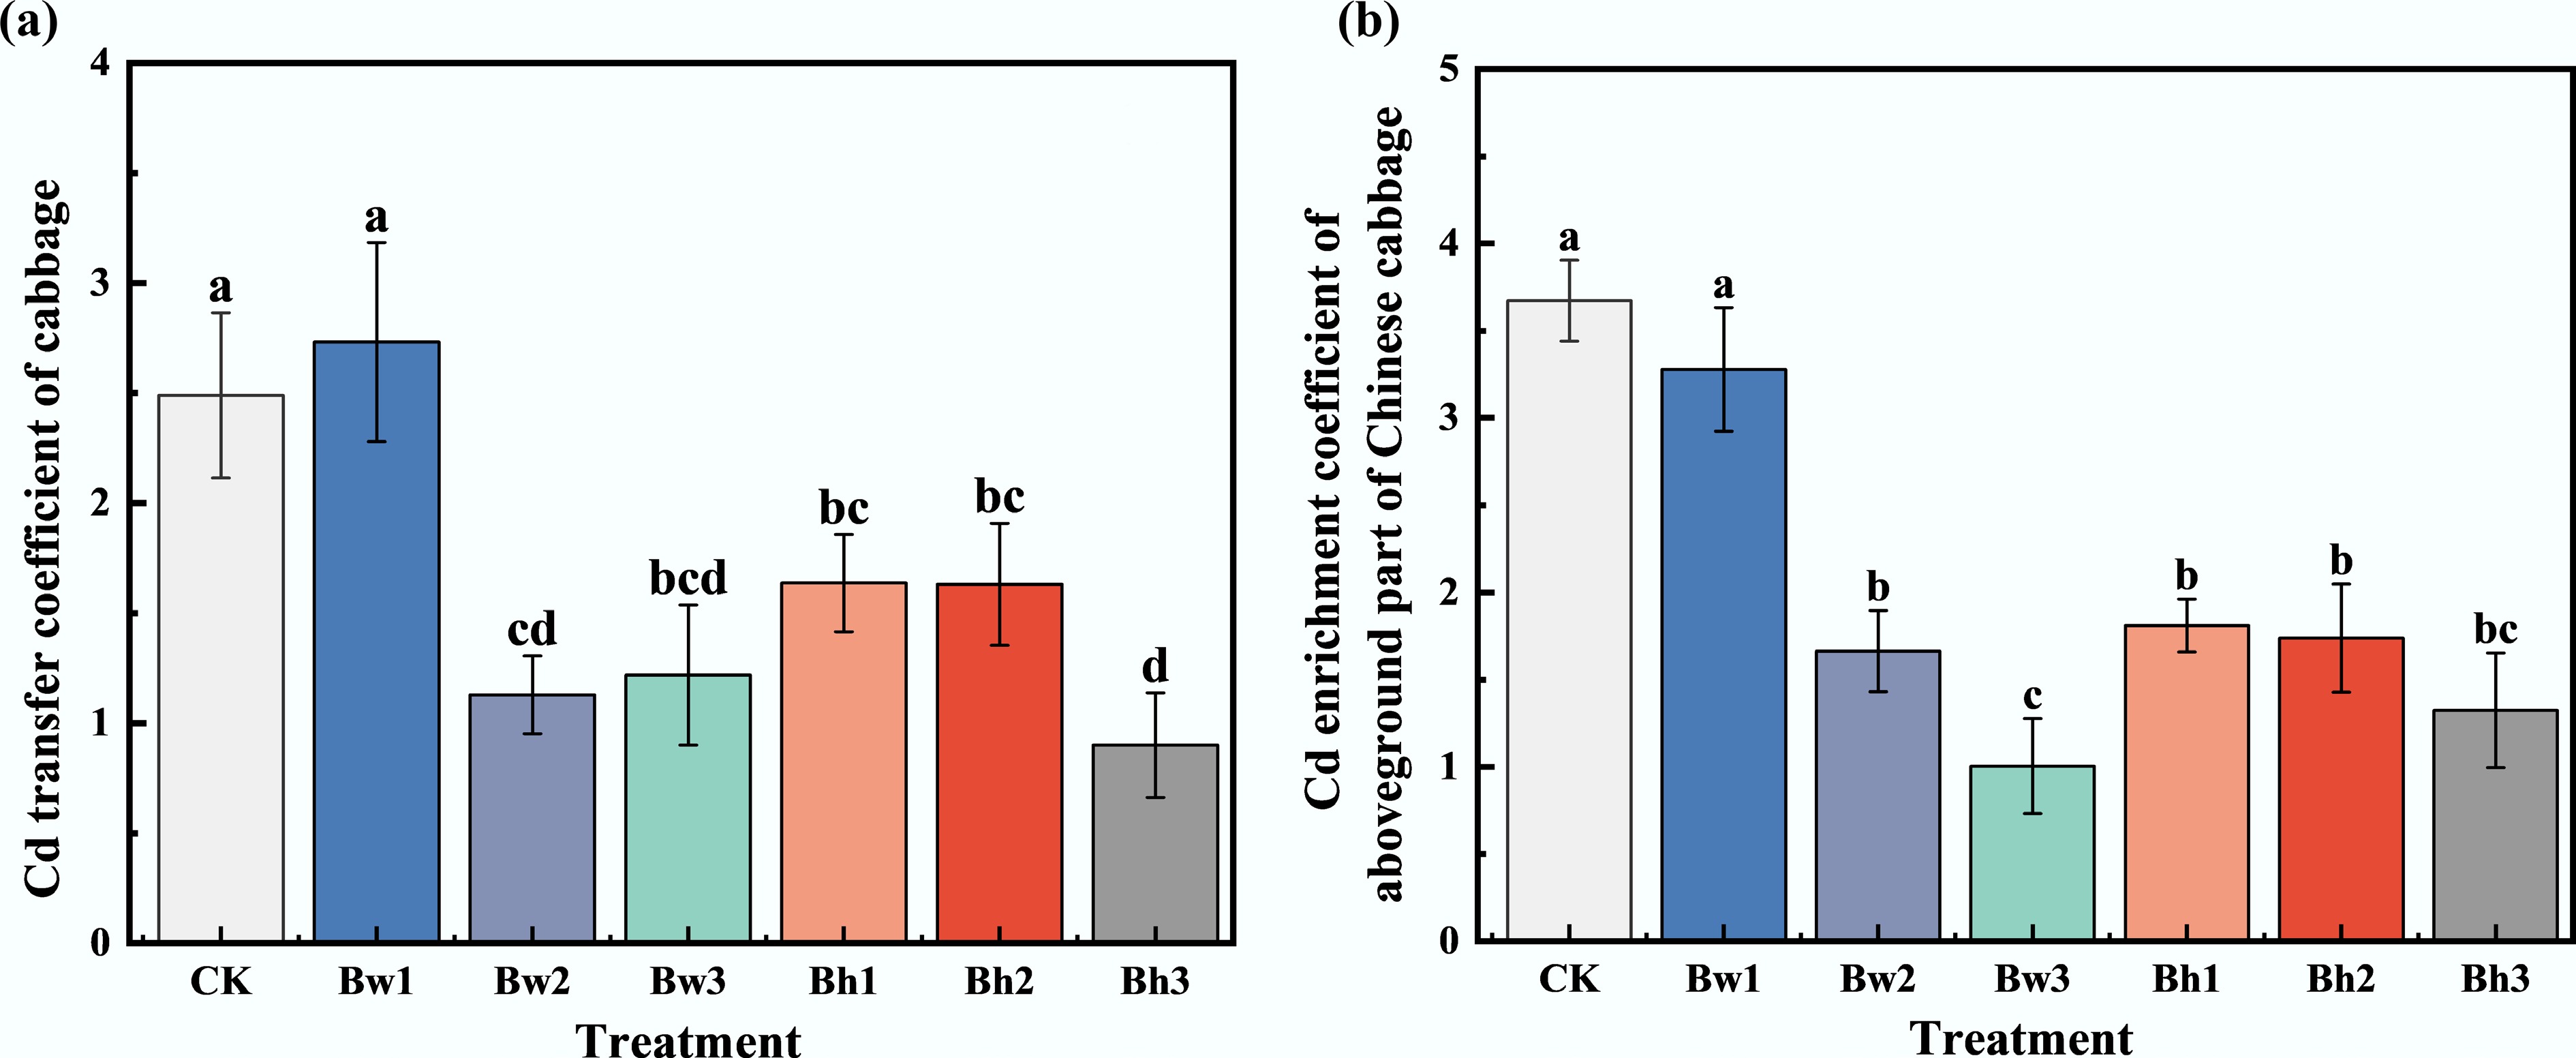
Figure 6.
Differences in (a) Cd transfer coefficient, and (b) enrichment coefficient of Chinese cabbage with different biochar-DOM composites.
-
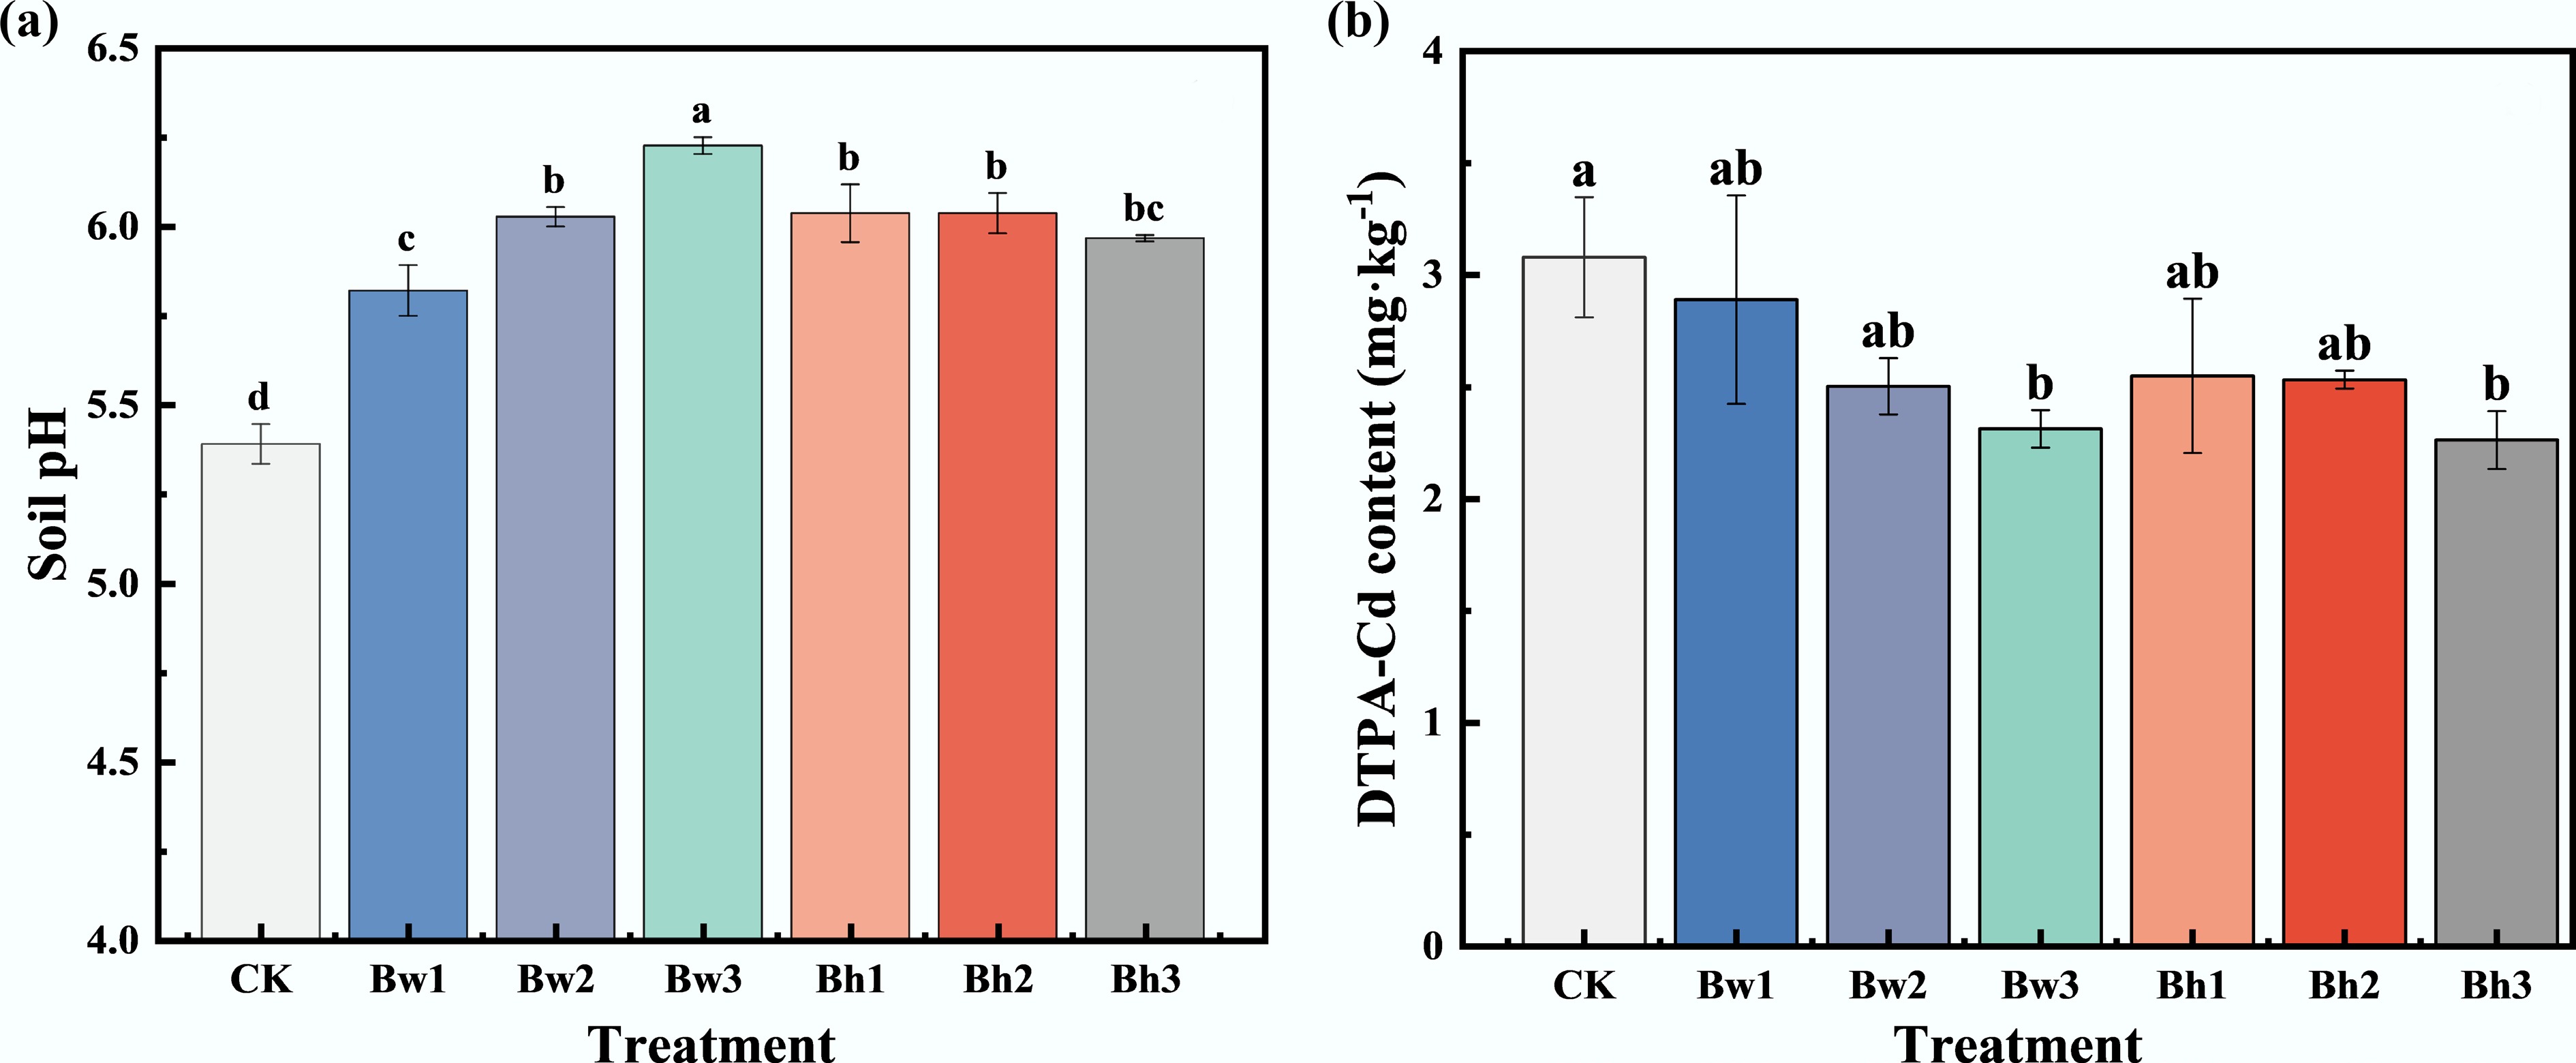
Figure 7.
Effects of different biochar-DOM composites on (a) soil pH, and (b) available Cd content in the pot experiment.
-
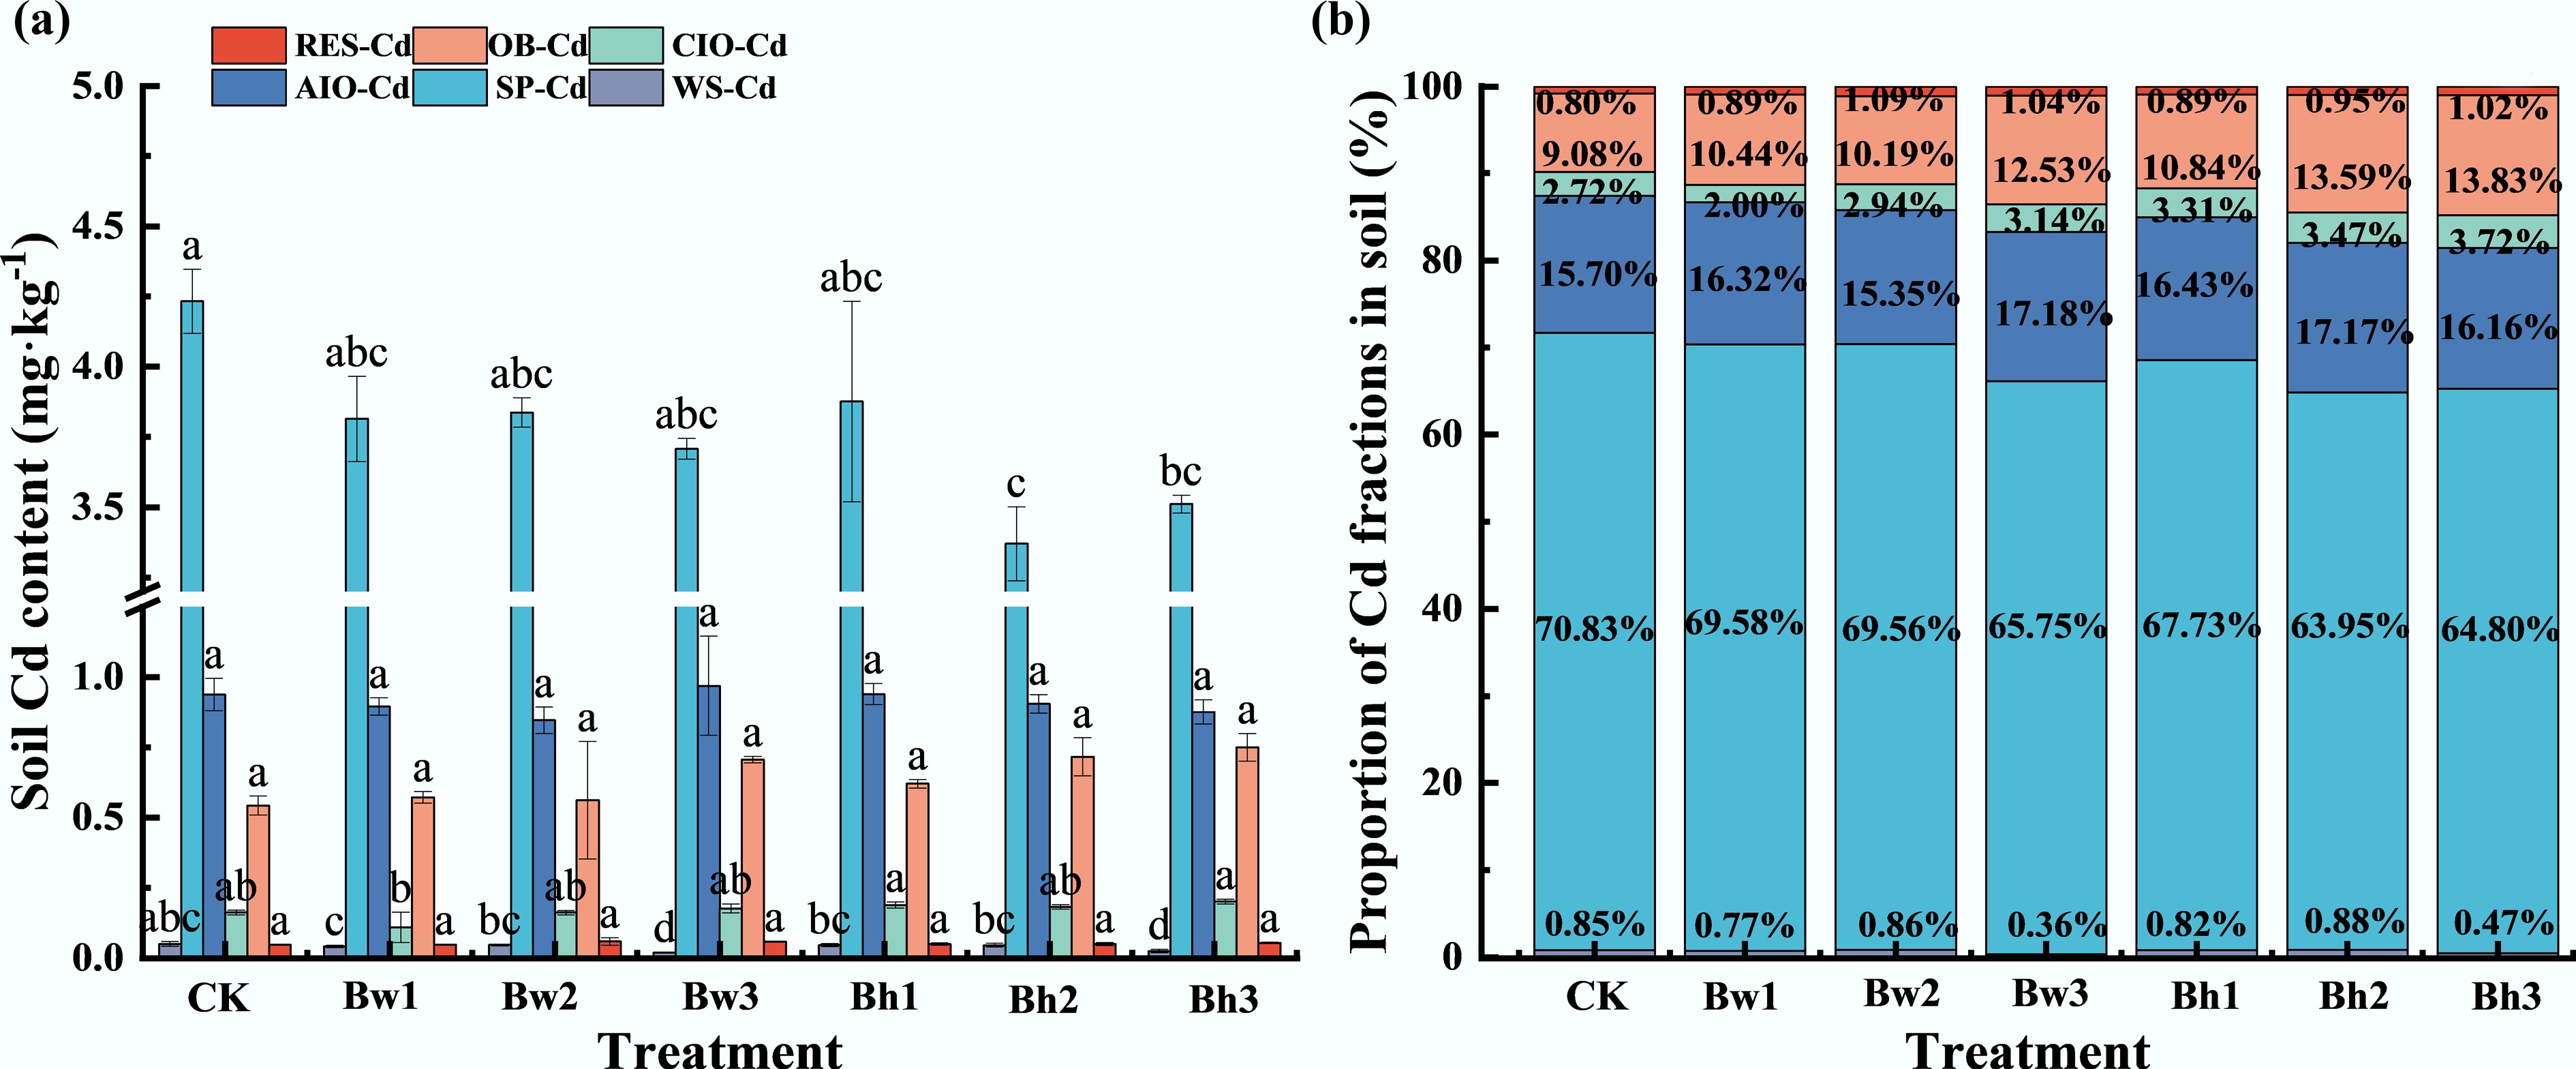
Figure 8.
Effects of different biochar-DOM composites on soil Cd fractions in the pot experiment. (a) represents the concentration of different forms of Cd in pot soil under different molecular weight biochar-DOM composites; (b) represents proportion of Cd fractions in pot soil under different molecular weight biochar-DOM composites.
-
Model Parameter Bc Bw Bh Bw1 Bw2 Bw3 Bh1 Bh2 Bh3 Langmuir qmax (mg·g–1) 54.53 64.94 66.71 67.98 79.30 81.04 71.84 76.80 84.25 KL (L·mg–1) 0.05 0.05 0.06 0.11 0.10 0.11 0.05 0.08 0.07 RL 0.33 0.33 0.31 0.18 0.20 0.19 0.35 0.24 0.26 R2 0.97 0.98 0.99 0.97 0.97 0.96 1.00 0.99 0.98 Freundlich 1/n 0.47 0.47 0.44 0.35 0.98 2.50 0.44 0.38 0.45 kf 5.78 6.99 8.19 13.88 1.60 0.00 8.07 1.00 10.82 R2 0.99 0.97 0.96 0.98 0.98 0.99 0.93 0.92 0.98 Temkin BT (J·mol–1) 14.07 15.88 15.36 14.61 18.65 19.85 14.92 15.39 20.55 KT (L·mg–1) 0.35 0.40 0.48 1.03 0.75 0.74 0.52 0.91 0.54 R2 0.96 0.97 0.96 0.96 0.97 0.97 0.98 0.97 0.97 The combination of Bw and DOM<3k is denoted as Bw1; the combination of Bw and DOM3k–10k is denoted as Bw2; the combination of Bw and DOM>10k is denoted as Bw3; the combination of Bh and DOM<3k is denoted as Bh1; the combination of Bh and DOM3k–10k is denoted as Bh2; and the combination of Bh and DOM>10k is denoted as Bh3. The same below. Table 1.
Correlation parameters for isothermal adsorption equations of Cd2+ by different biochar and modified biochar-DOM composites
-
Treatment SABET
(m2·g–1)Pore volume
(cm3·g–1)Average pore
size (nm)Bc 2.69 0.013 12.62 Bw 3.89 0.013 11.12 Bh 4.44 0.018 10.96 Bw1 2.77 0.011 11.35 Bw2 3.26 0.015 11.46 Bw3 3.74 0.016 10.96 Bh1 3.77 0.018 11.91 Bh2 4.14 0.020 10.05 Bh3 4.65 0.025 9.92 Table 2.
BET surface area, pore volume, and average pore size by different biochar and modified biochar-DOM composites
Figures
(8)
Tables
(2)