-
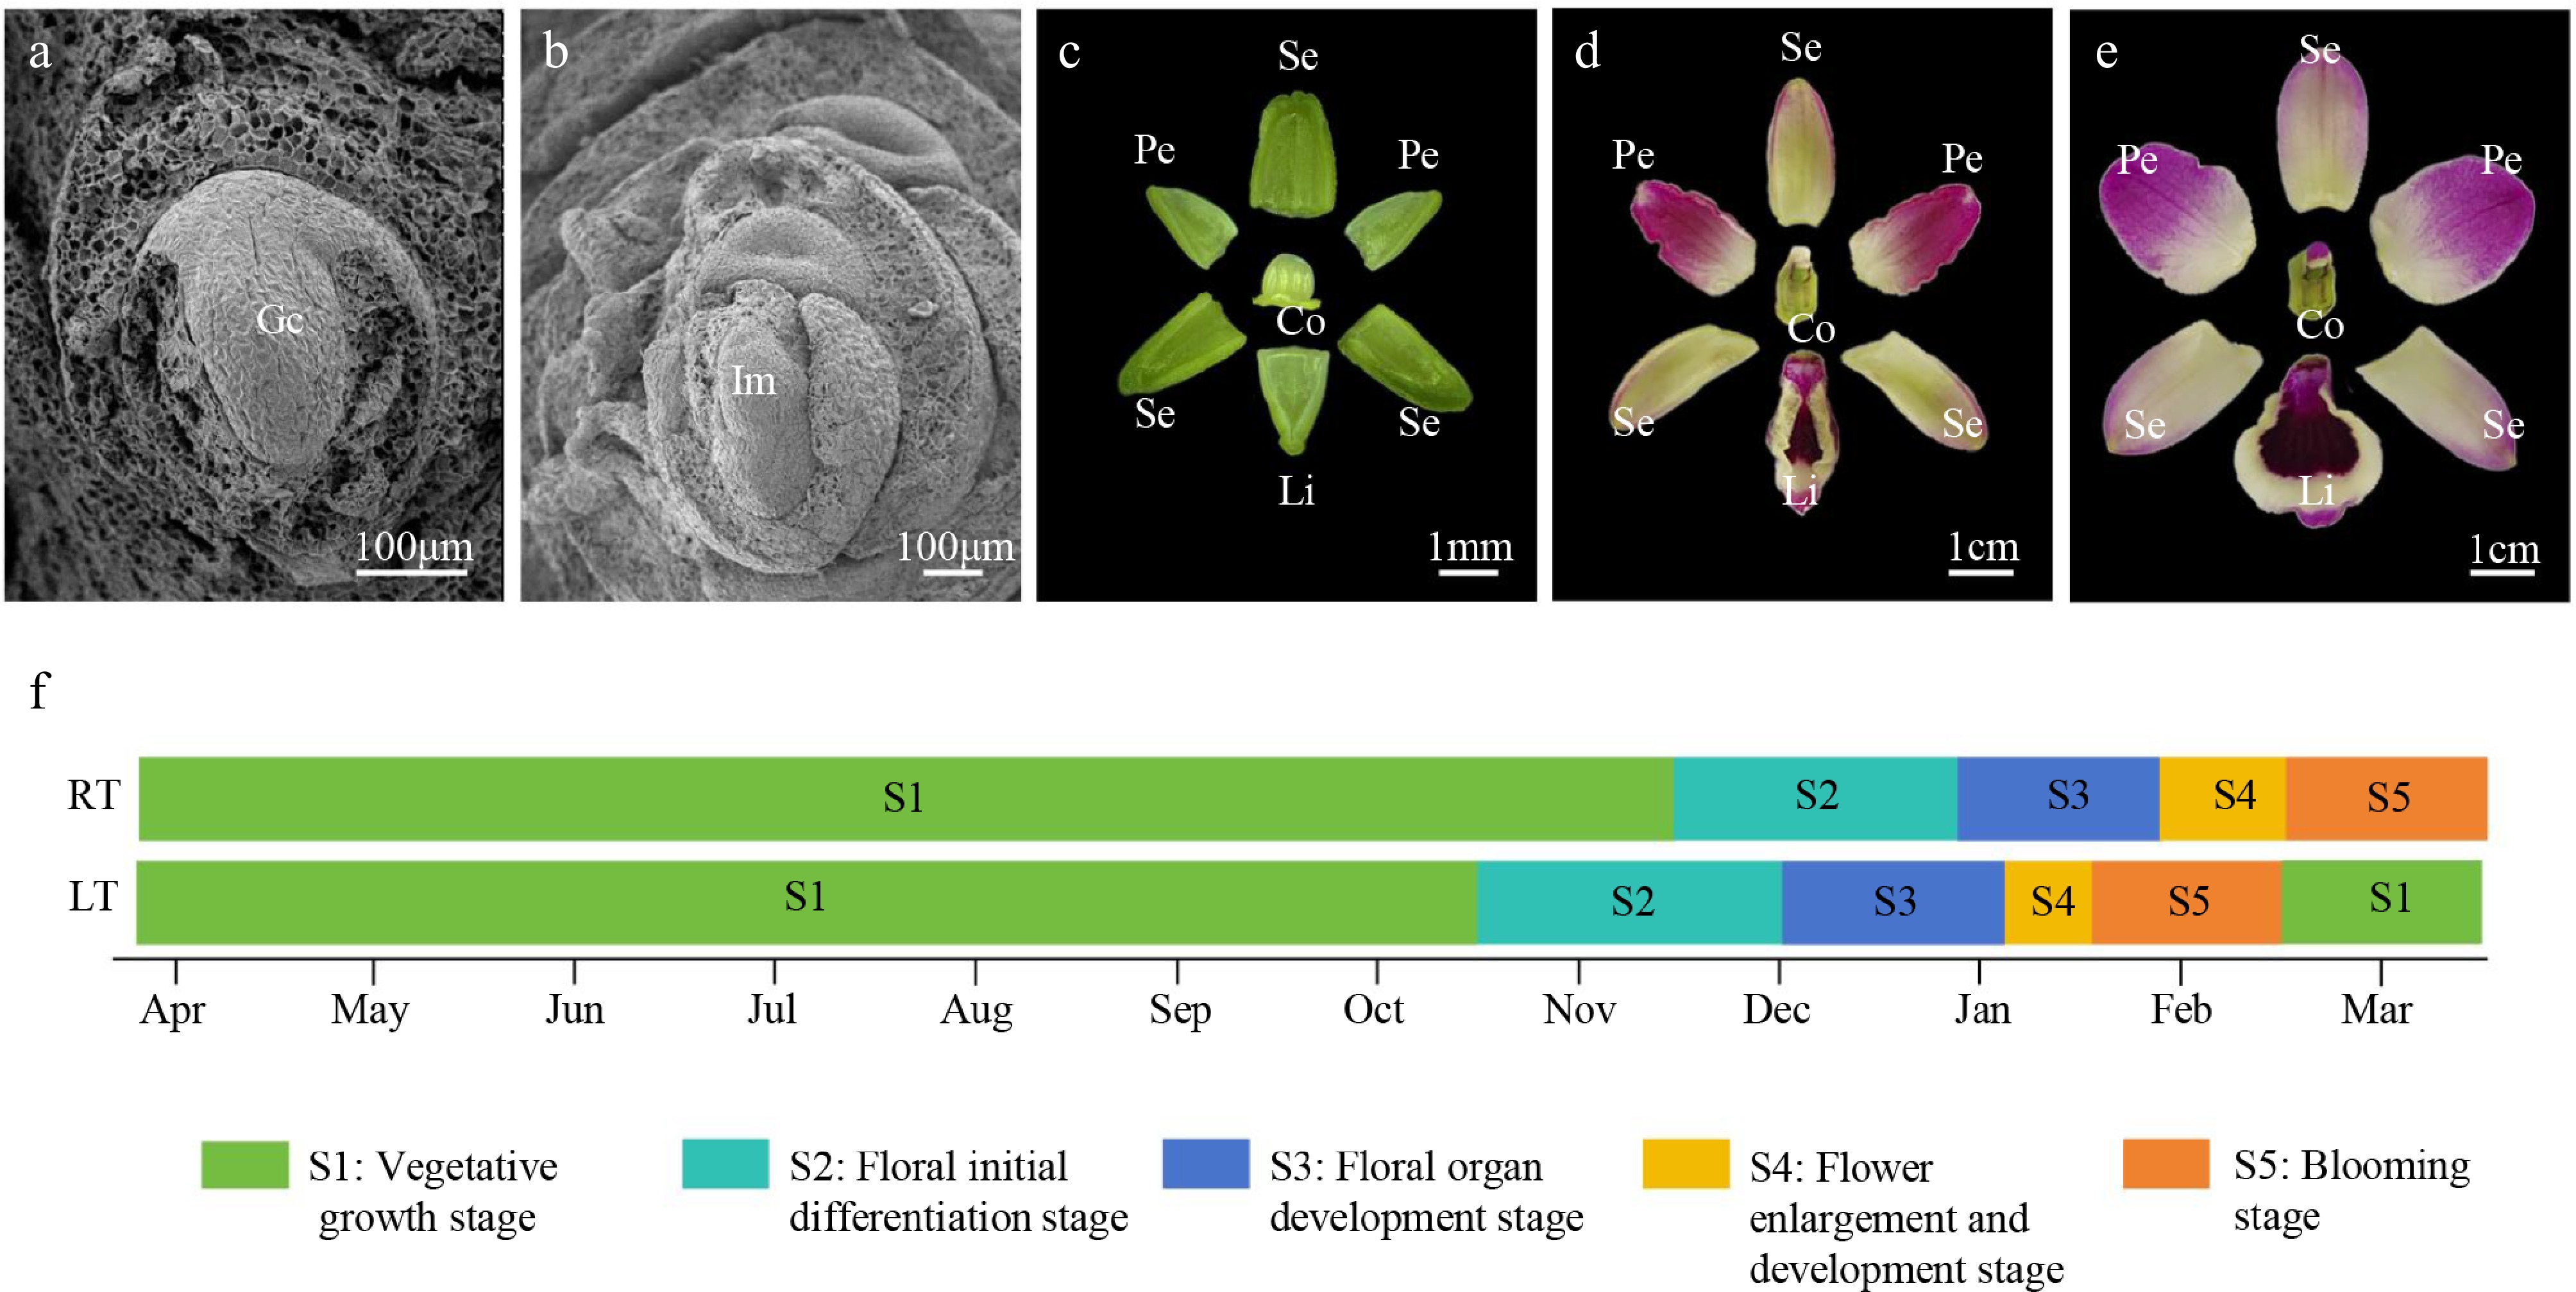
Figure 1.
A comprehensive morphological and cytological analysis of the floral developmental process in Dendrobium. (a) S1: vegetative growth stage. (b) S2: floral initial differentiation stage. (c) S3: floral organ development stage. (d) S4: flower enlargement and development stage. (e) S5: blooming stage. (f) Comparison of floral development timing between RT (natural condition) and LT (artificial chilling condition) treatments. Gc, growth cone; Im, inflorescence meristem; Se, sepal; Pe, petal; Li, lip; Co, column.
-
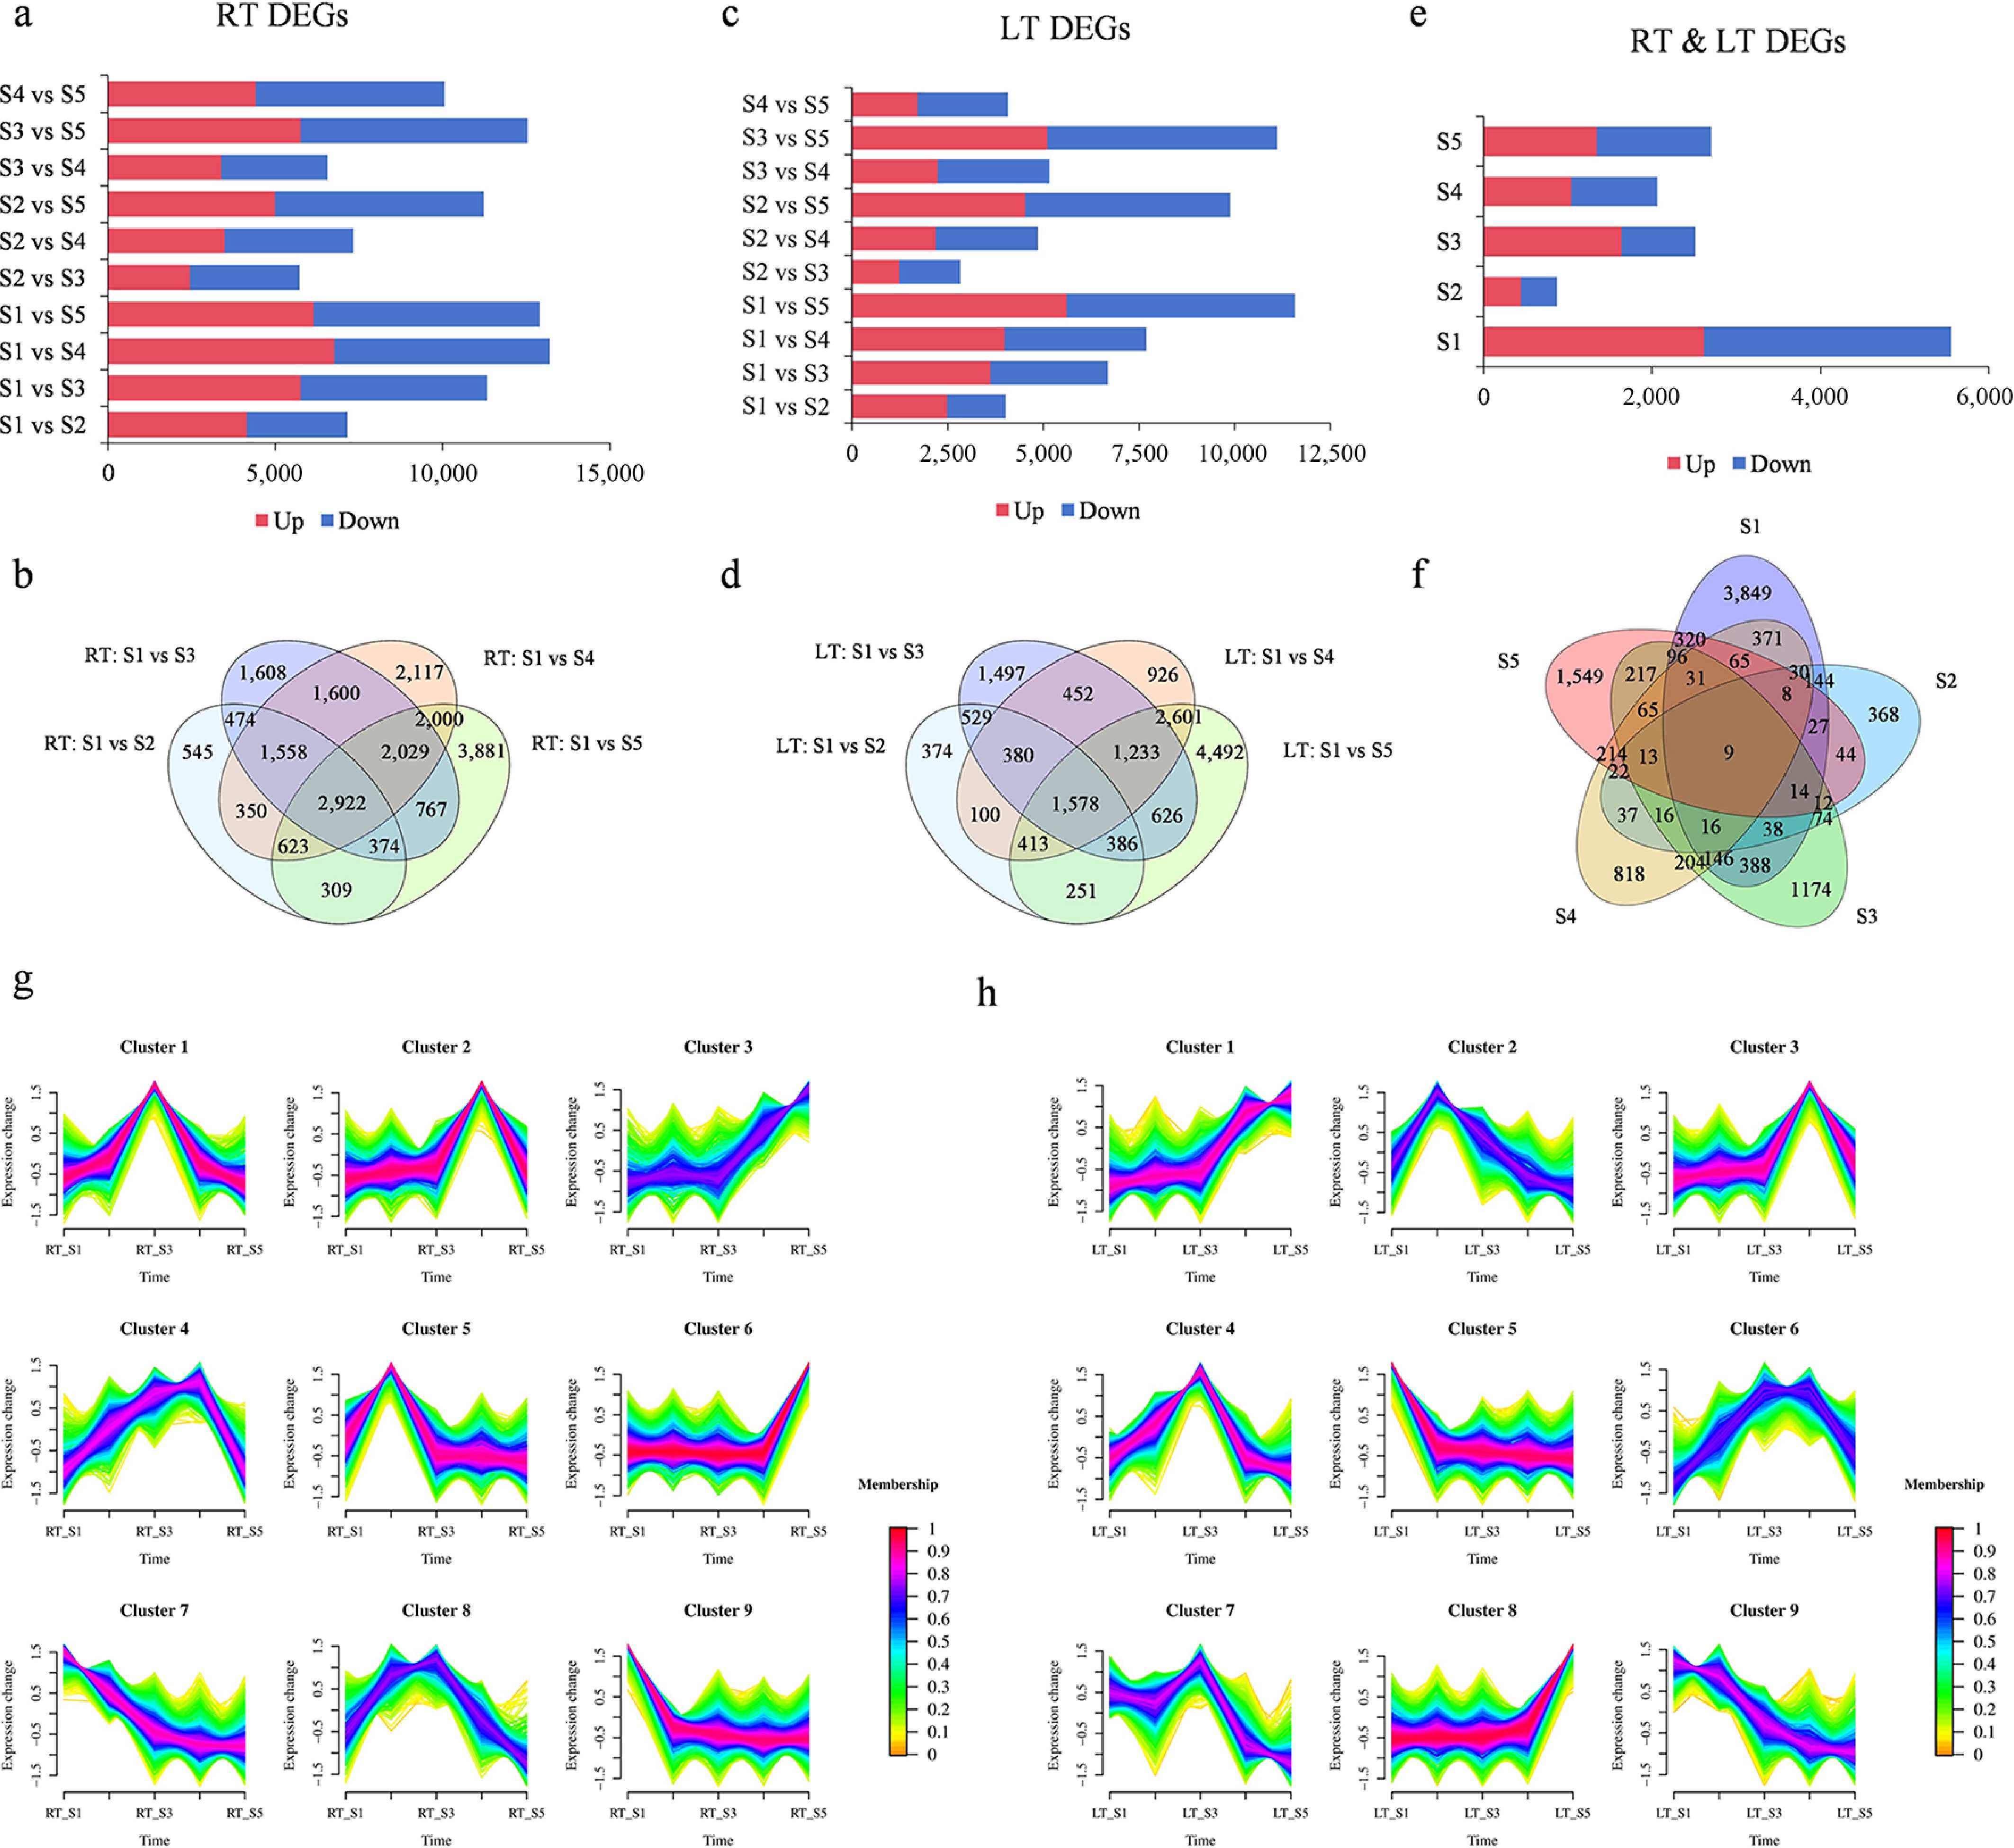
Figure 2.
Transcriptome analysis of Dendrobium under RT vs LT conditions. (a) The number of up-/downregulated DEGs in Dendrobium under RT conditions. (b) The Venn map indicating the number of coregulated and specifically regulated DEGs during Dendrobium development under RT conditions. (c) The number of up-/downregulated DEGs in Dendrobium under LT conditions. (d) The Venn map indicating the number of coregulated and specifically regulated DEGs during Dendrobium development under LT conditions. (e) The number of up-/downregulated DEGs in the two treatment comparison groups. (f) Venn diagram of all DEGs in the comparison between the two treatments. (g) Clustering analysis of time-course RNA-seq data revealing DEGs changes during Dendrobium development under RT conditions. (h) Clustering analysis of time-course RNA-seq data revealing DEGs changes during Dendrobium development under LT conditions.
-
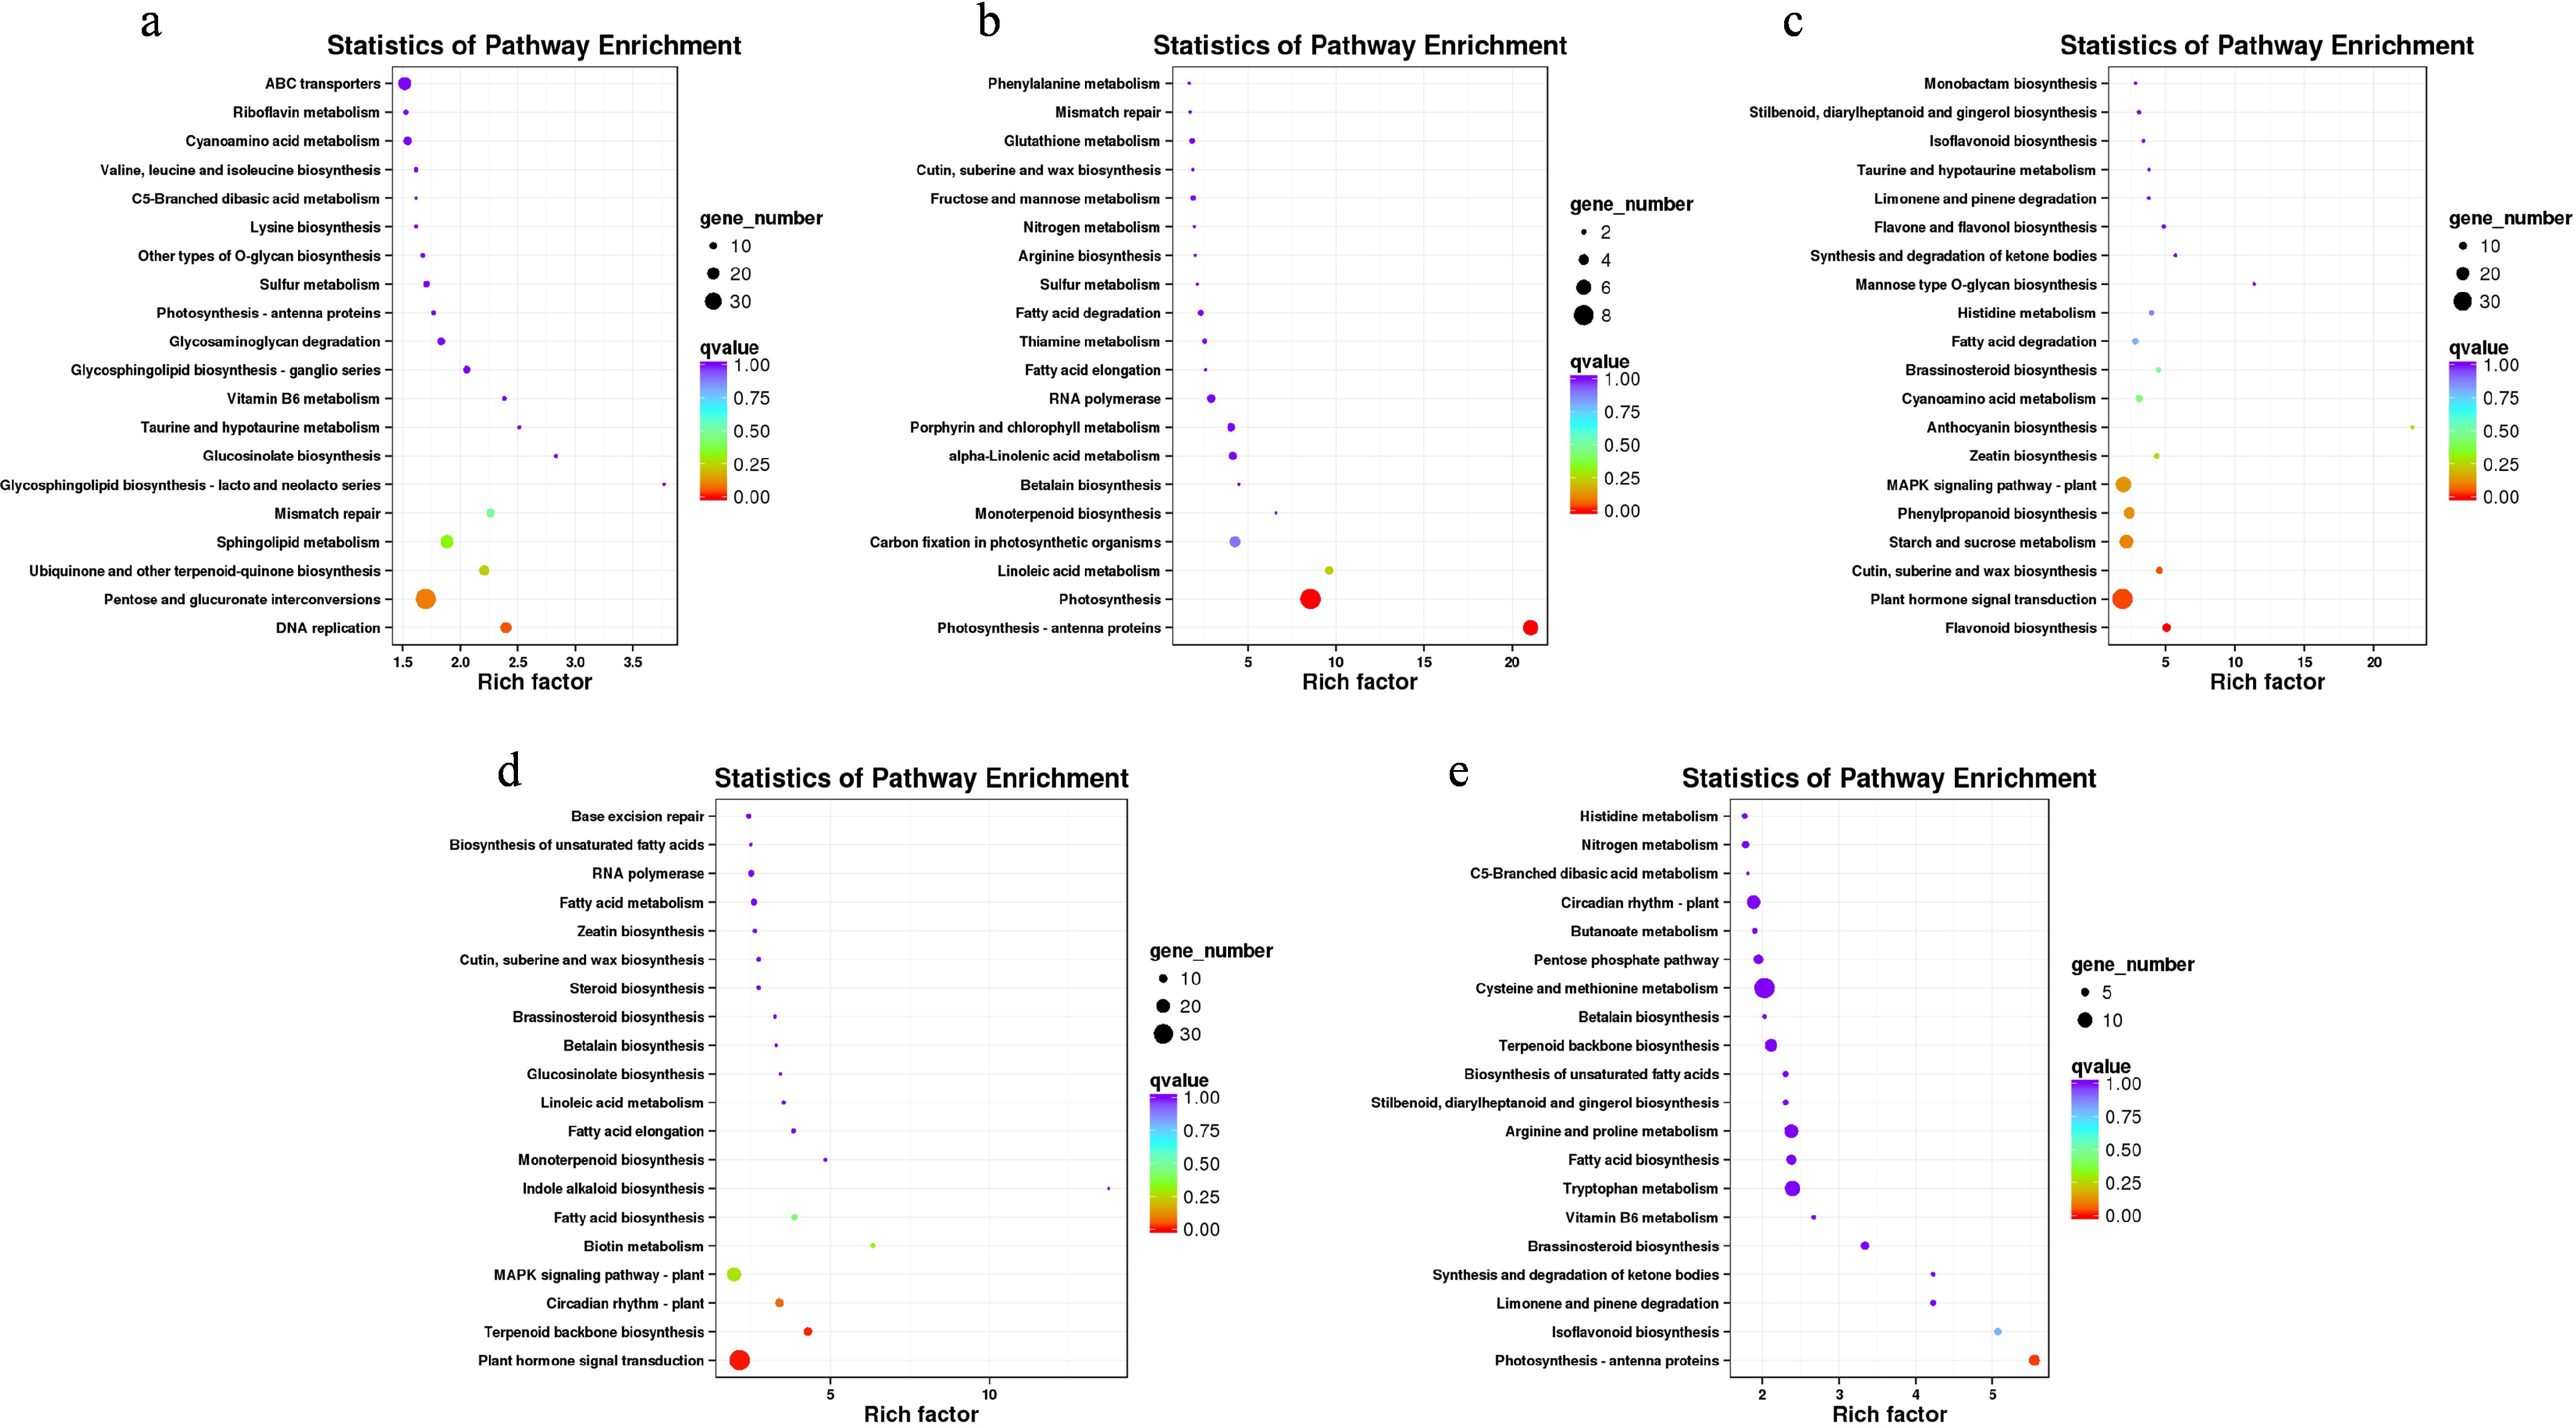
Figure 3.
Functional characterization of DEGs derived from five distinct pairwise comparisons under two experimental conditions in Dendrobium. (a) KEGG pathway enrichment profiling for DEGs identified in the S1 comparative analysis. (b) KEGG pathway enrichment profiling for DEGs identified in the S2 comparative analysis. (c) KEGG pathway enrichment profiling for DEGs identified in the S3 comparative analysis. (d) KEGG pathway enrichment profiling for DEGs identified in the S4 comparative analysis. (e) KEGG pathway enrichment profiling for DEGs identified in the S5 comparative analysis.
-
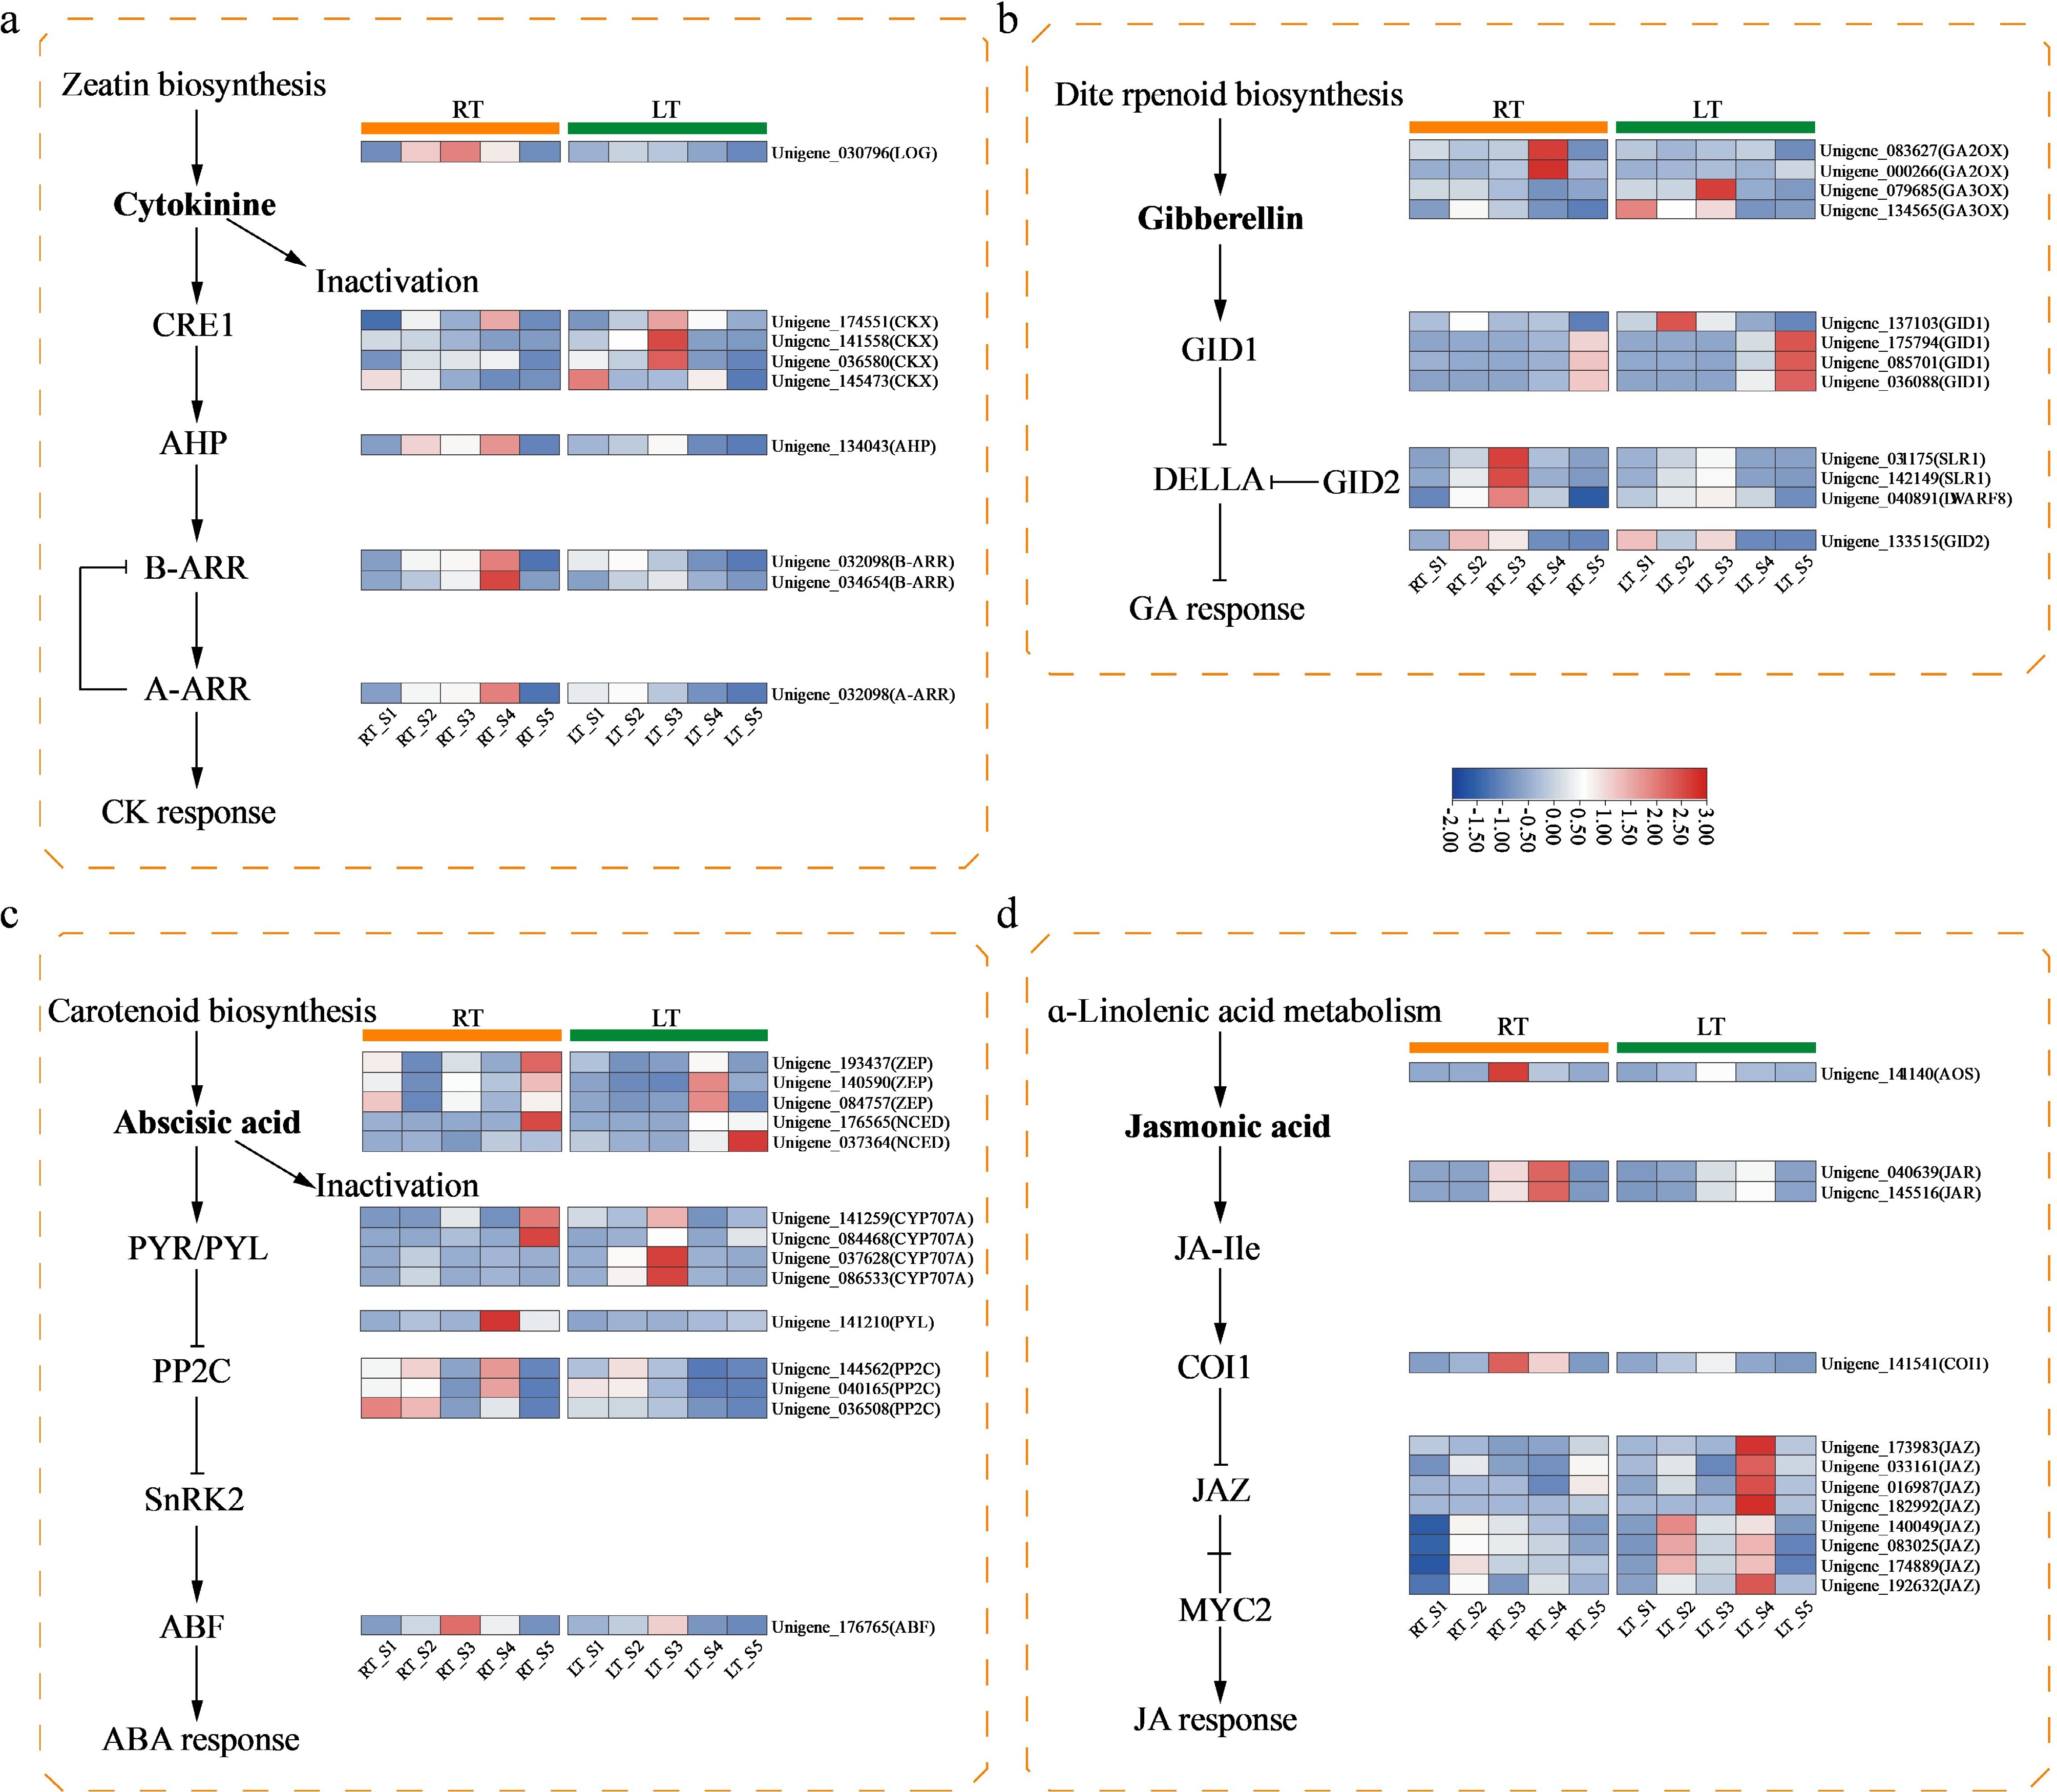
Figure 4.
Heatmap displaying DEGs associated with the biosynthesis and signal transduction pathways of plant hormones under two treatment conditions in Dendrobium. (a) DEGs involved in CK biosynthesis and signaling; (b) DEGs involved in GA biosynthesis and signaling; (c) DEGs involved in ABA biosynthesis and signaling; (d) DEGs involved in JA biosynthesis and signaling. Expression levels of DEGs were normalized to log2 counts based on FPKM values.
-
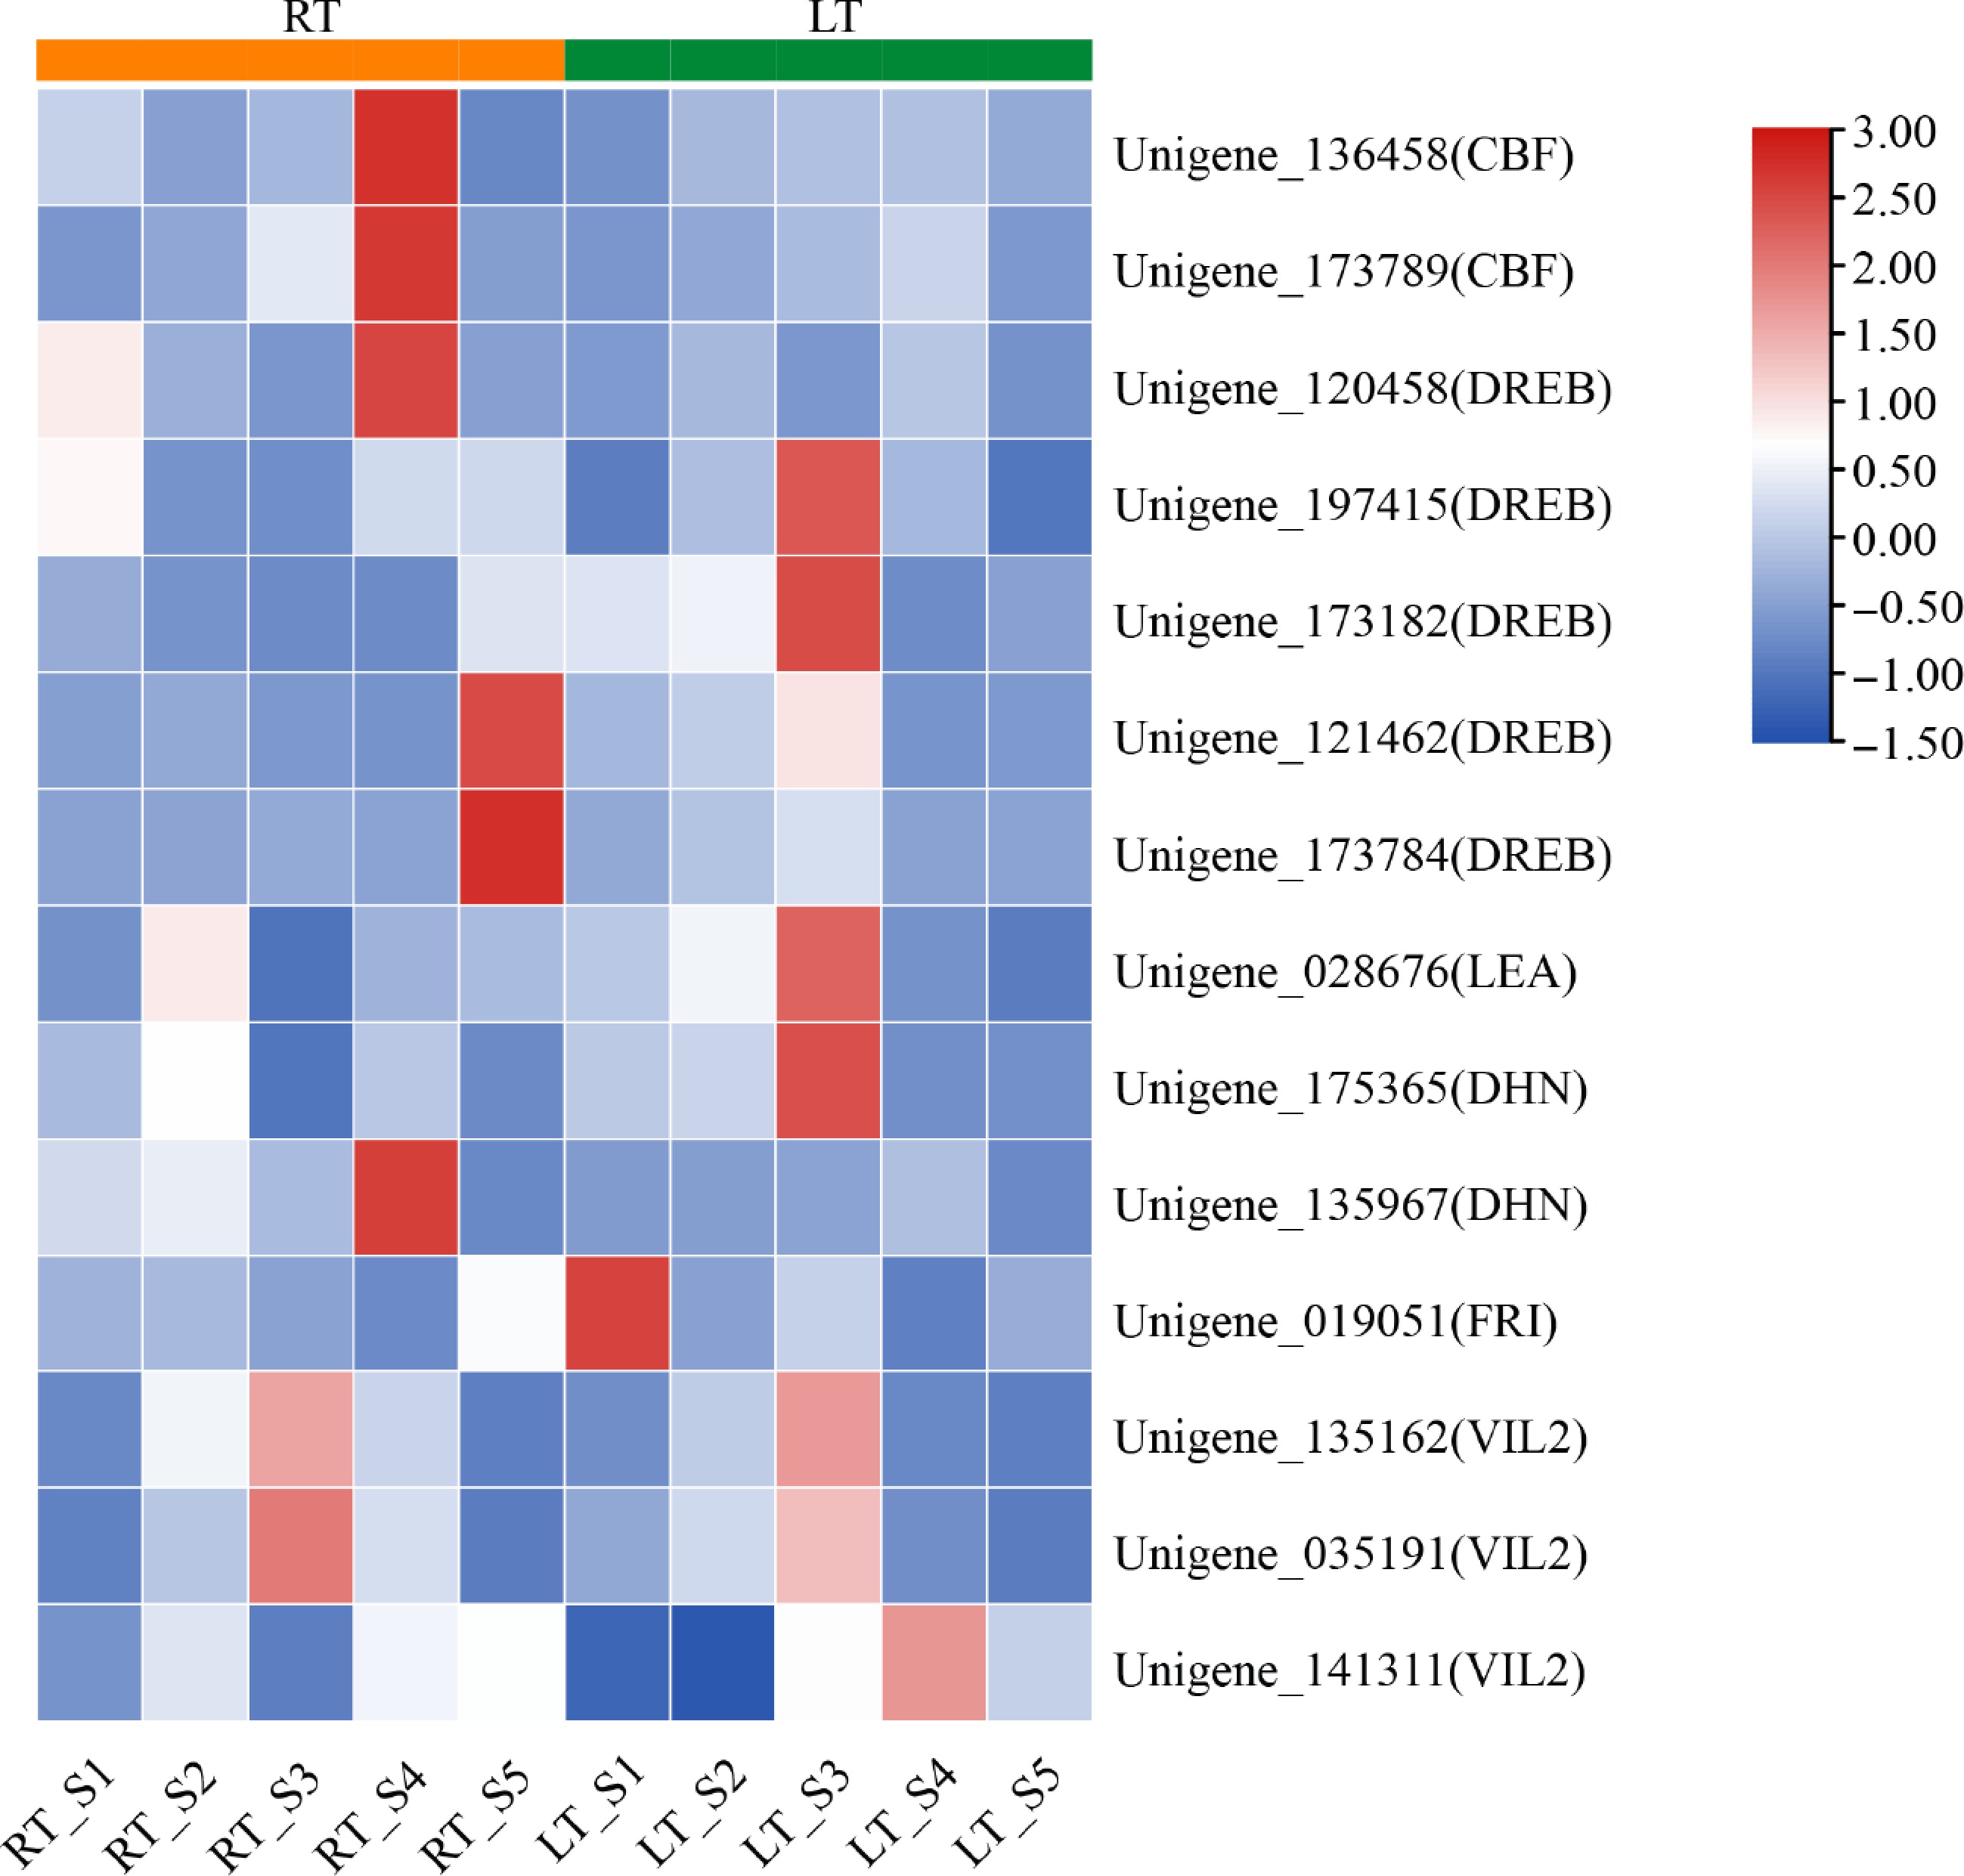
Figure 5.
Heatmap of DEGs associated with cold and vernalization responsive genes in Dendrobium. Expression levels were normalized to log2 counts based on FPKM values and visualized using a color gradient.
-
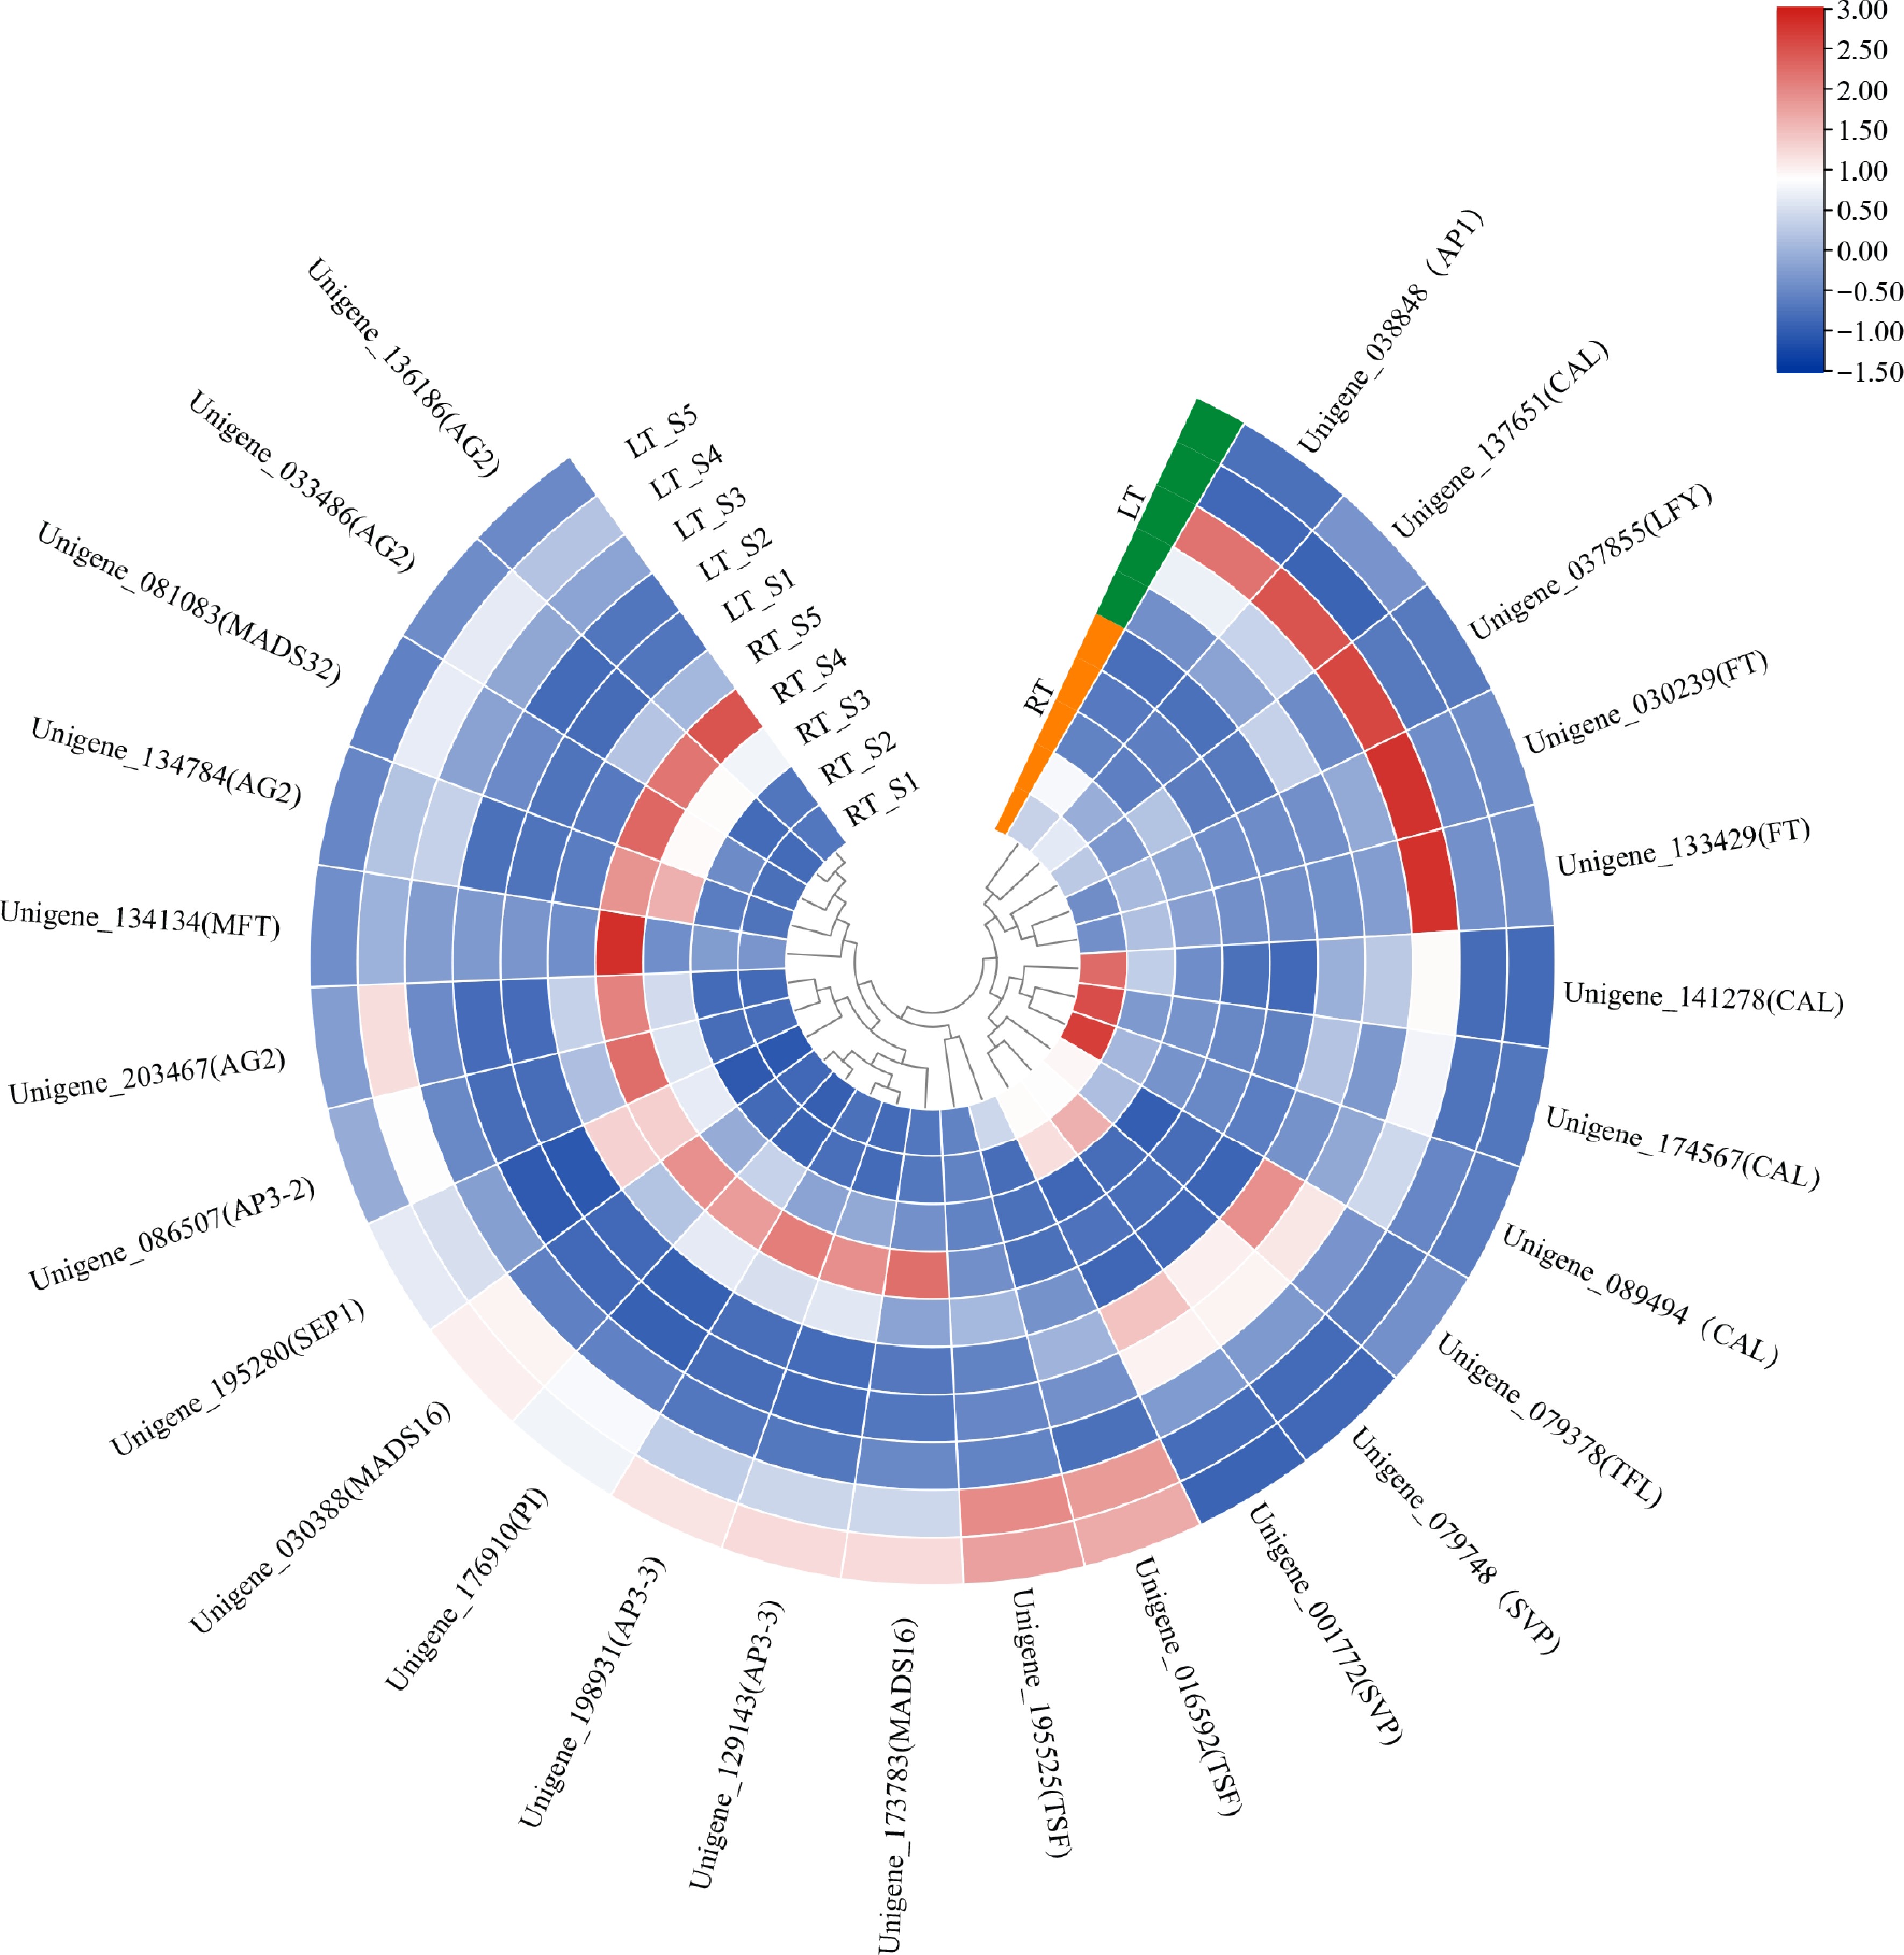
Figure 6.
Expression heatmap of a selected set of DEGs associated with flowering in Dendrobium. Expression levels were normalized to log2 counts based on FPKM values and visualized using a color gradient.
-
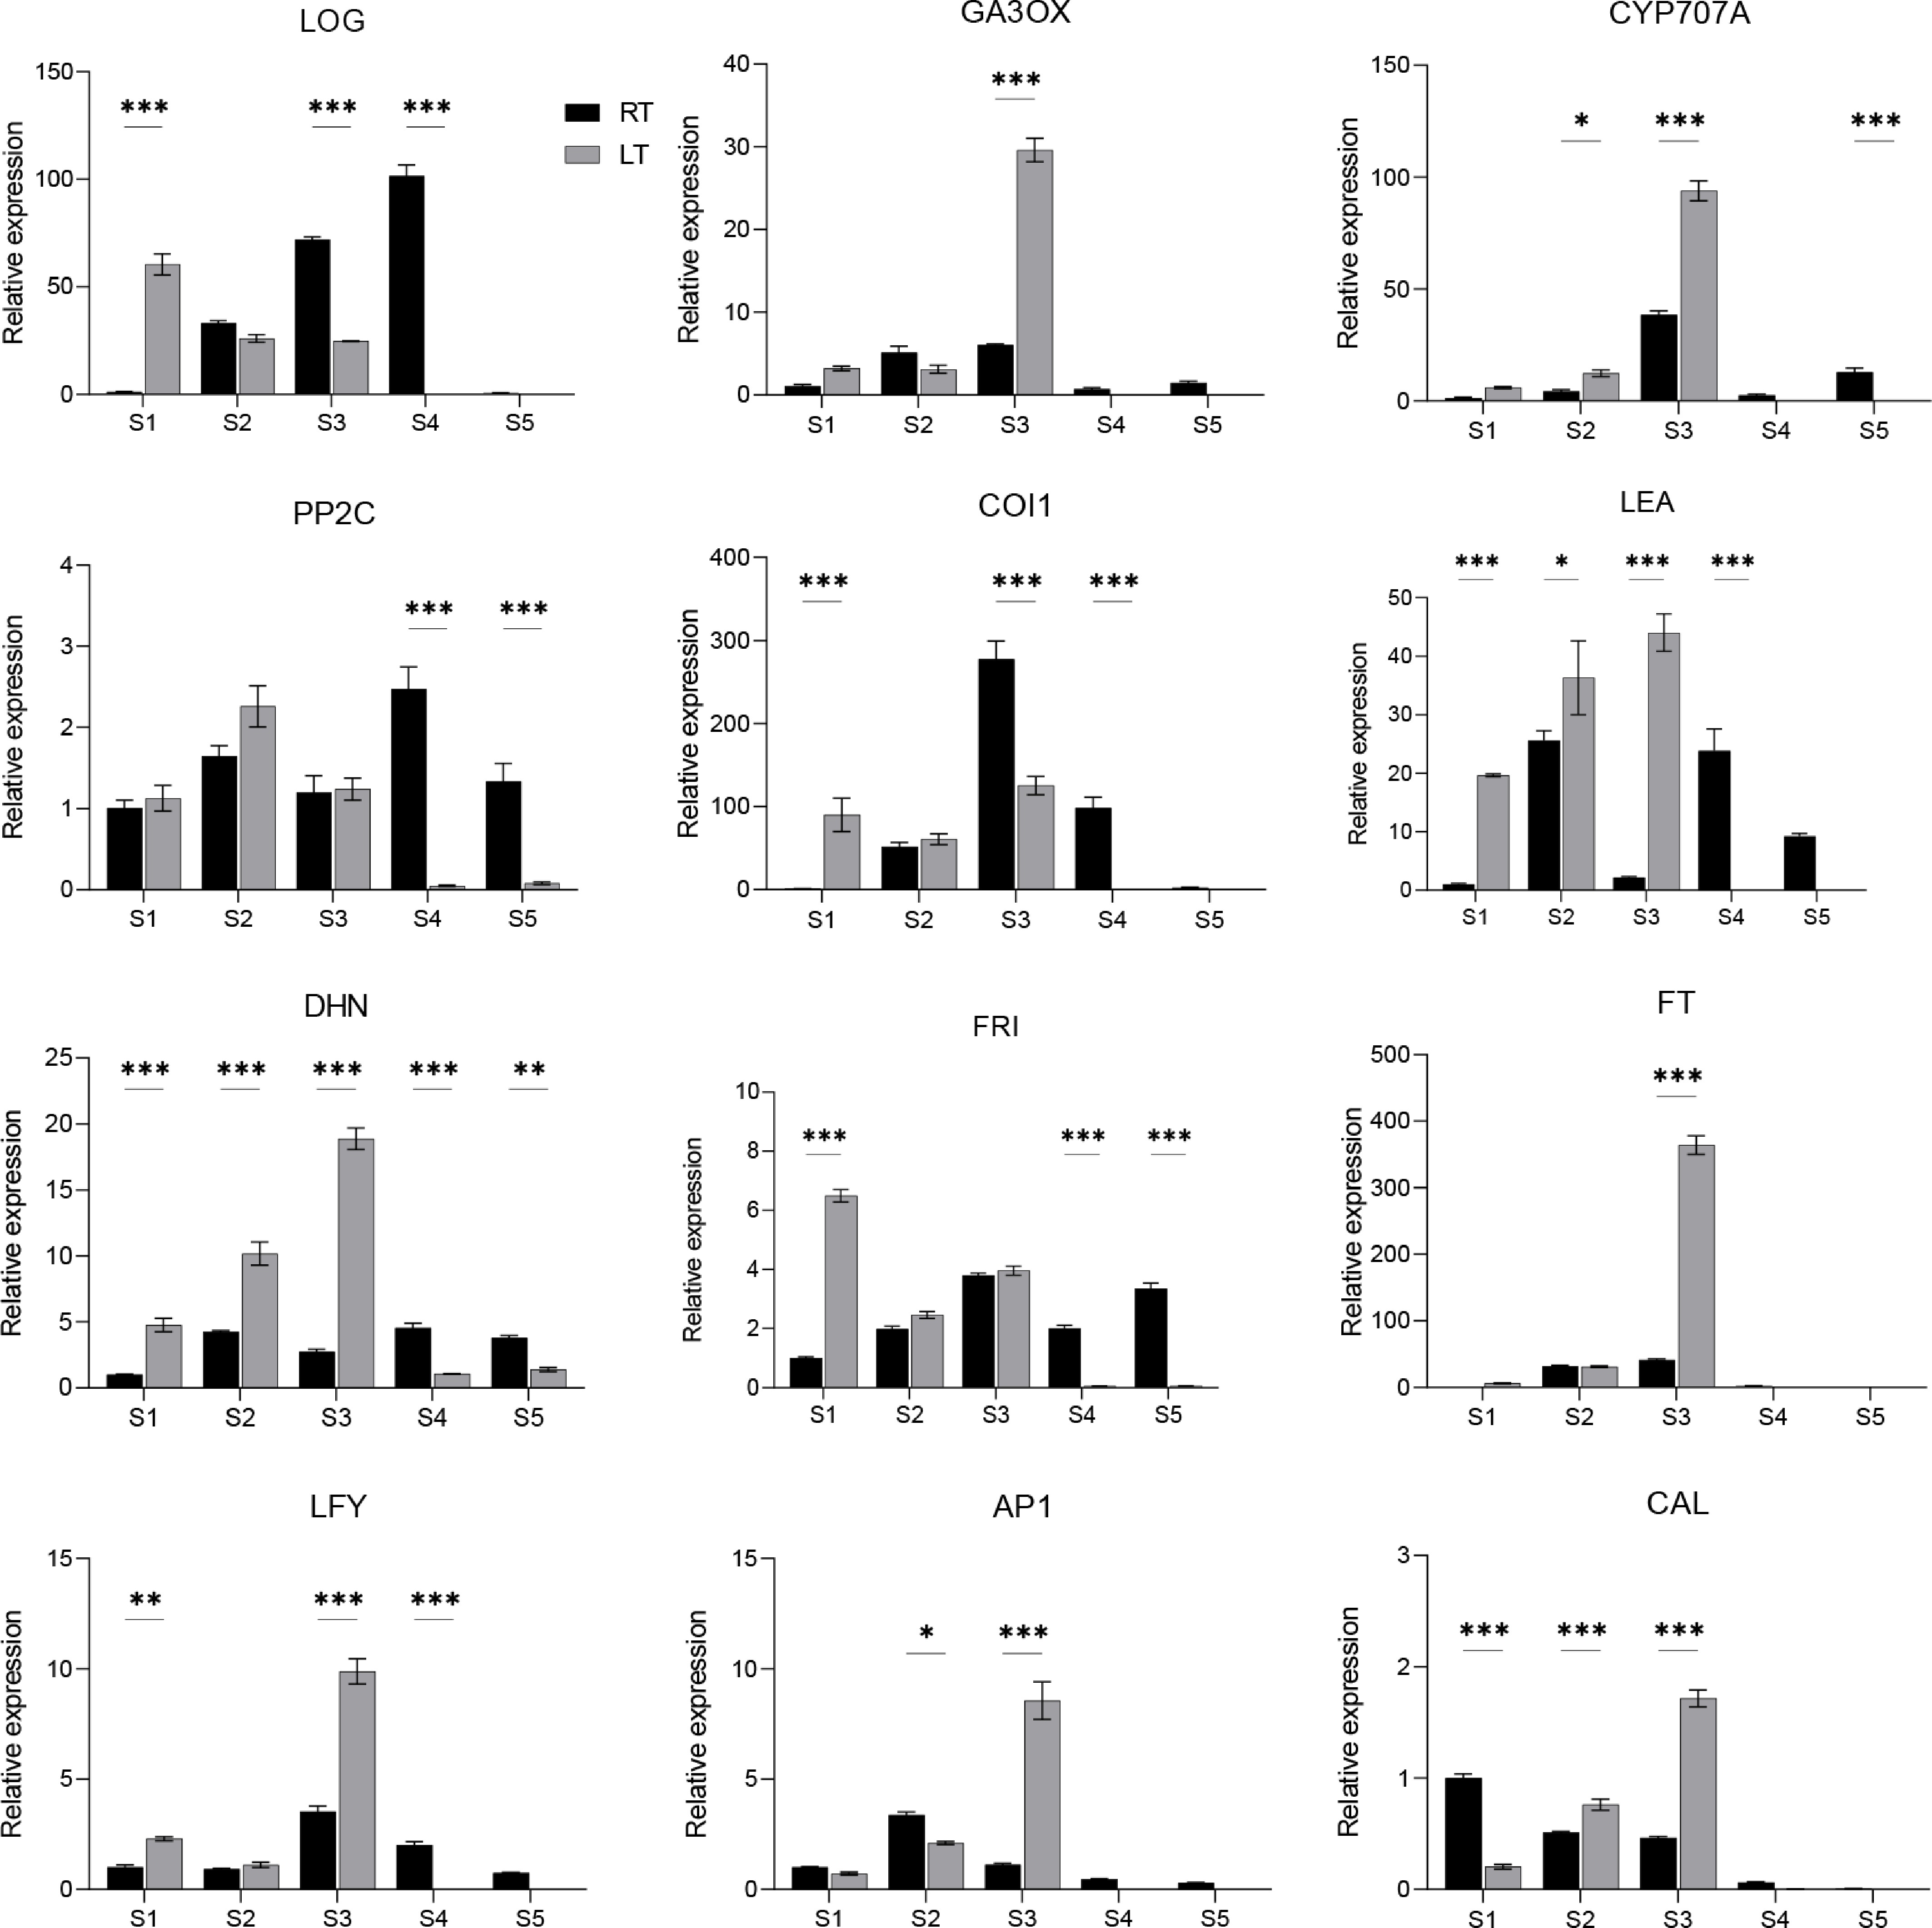
Figure 7.
RT-qPCR validation of selected candidate genes associated with flowering under RT vs LT conditions in Dendrobium. Data is shown as mean ± SD from three biological replicates. Asterisks indicate statistically significant differences relative to the RT group (* p < 0.05; ** p < 0.01; *** p < 0.001).
-
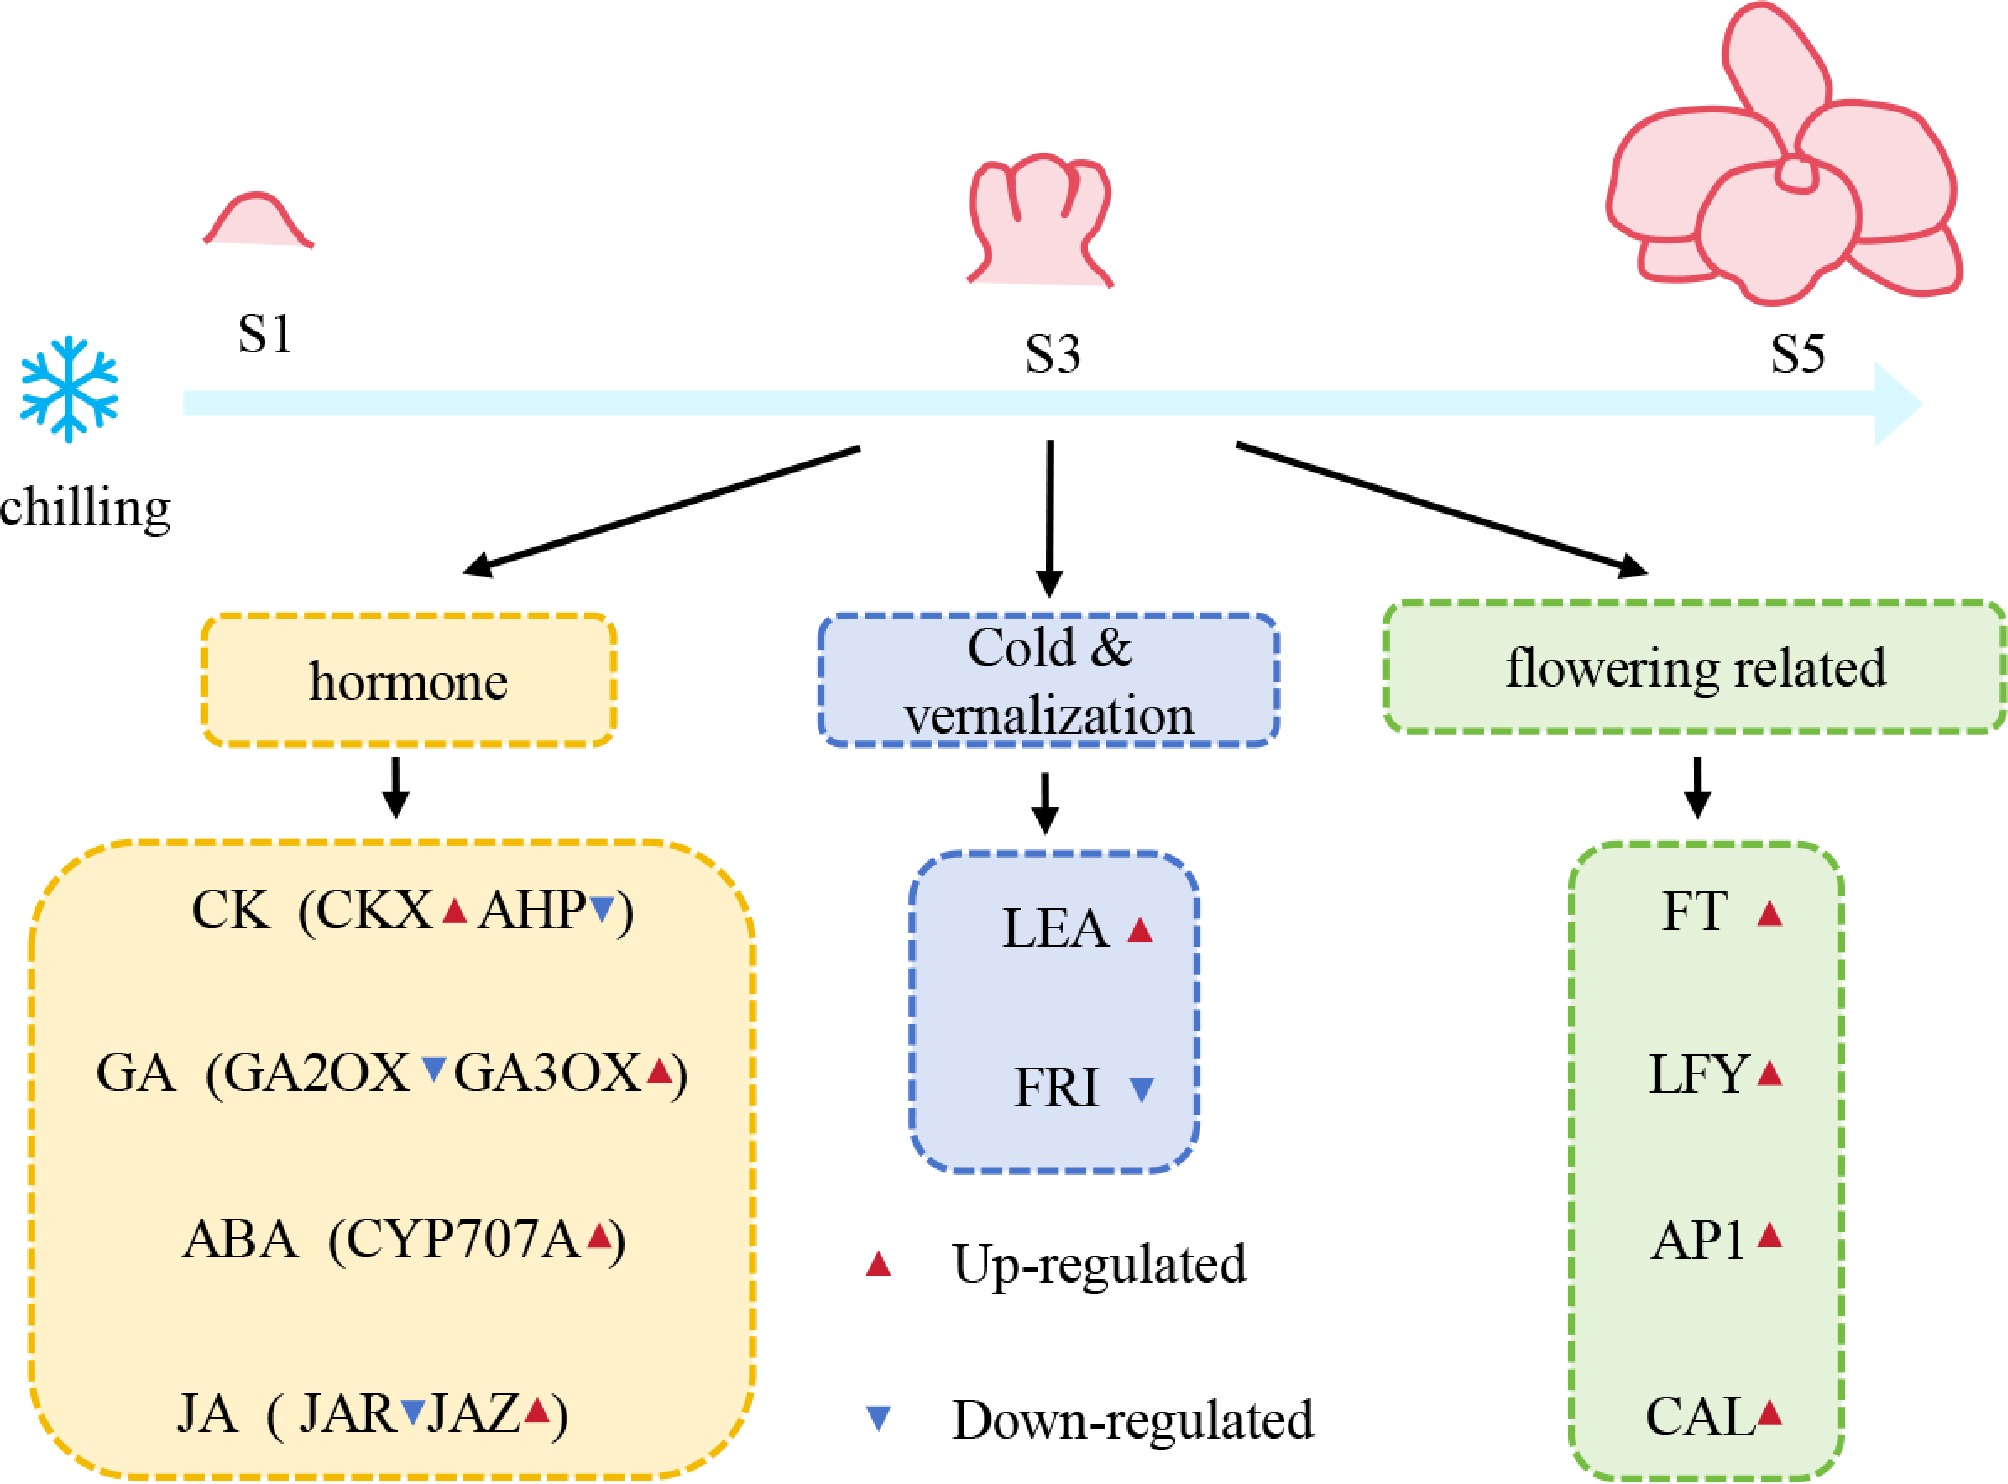
Figure 8.
Schematic model for the gene regulatory network of chilling-mediated flowering in Dendrobium.
Figures
(8)
Tables
(0)