-
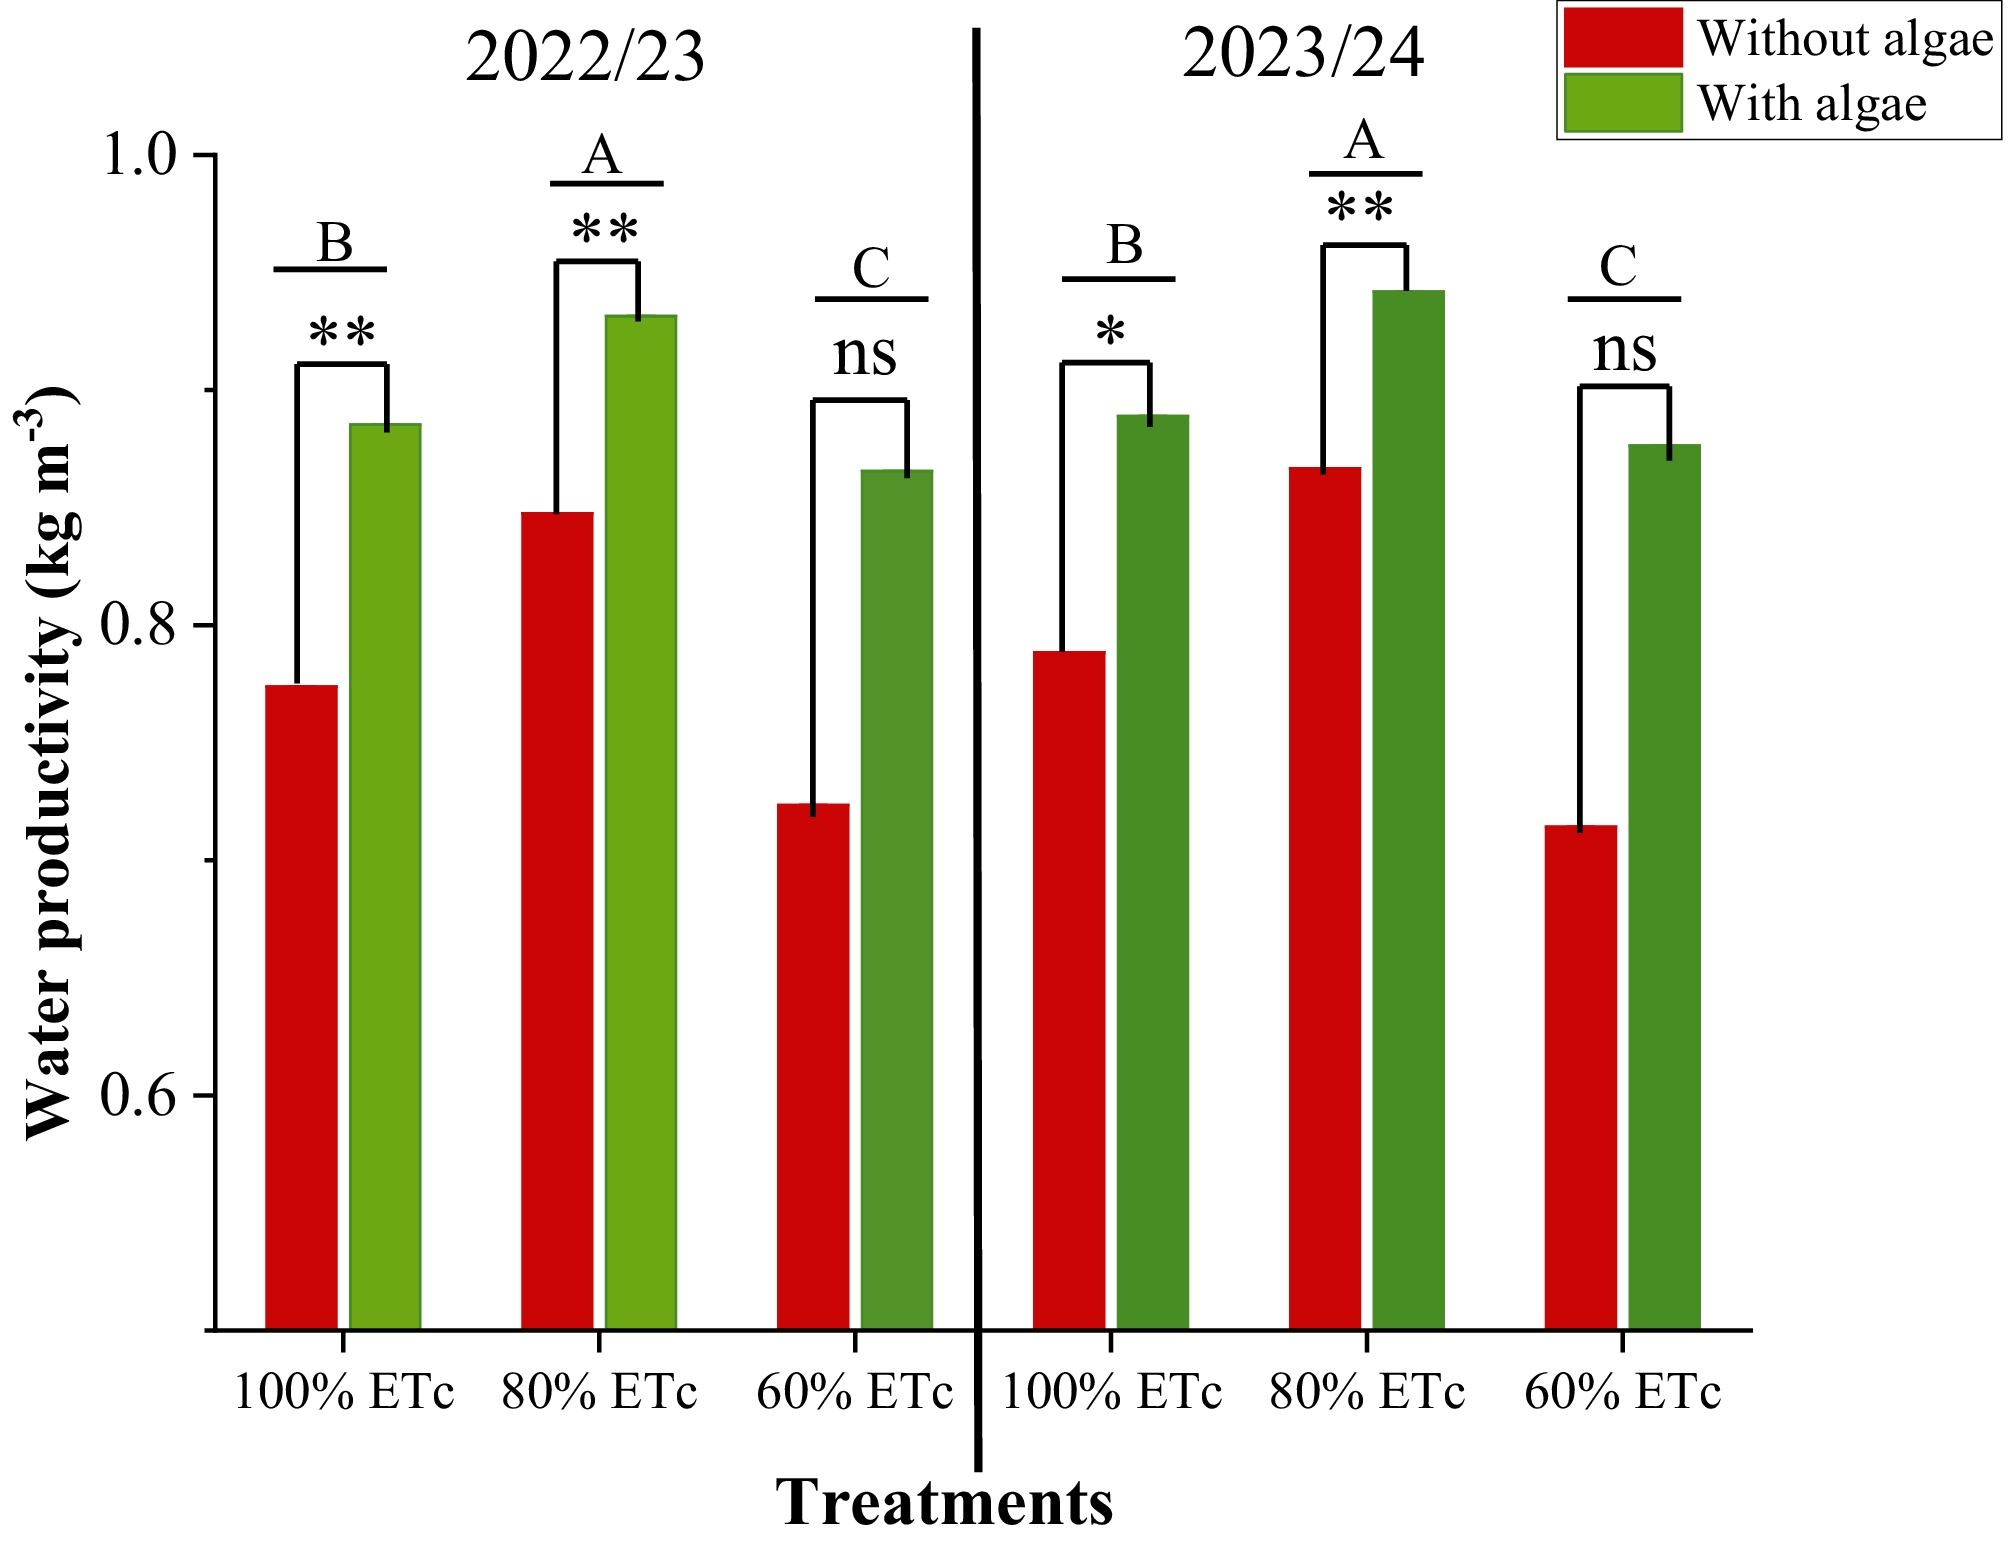
Figure 1.
Paired samples t-test analysis comparing the effect of applying algae on water productivity under different irrigation levels. *p ≤ 0.05; **p ≤ 0.001; ns = nonsignificant. A, B, and C refer to the differences between the means of various irrigation levels.
-
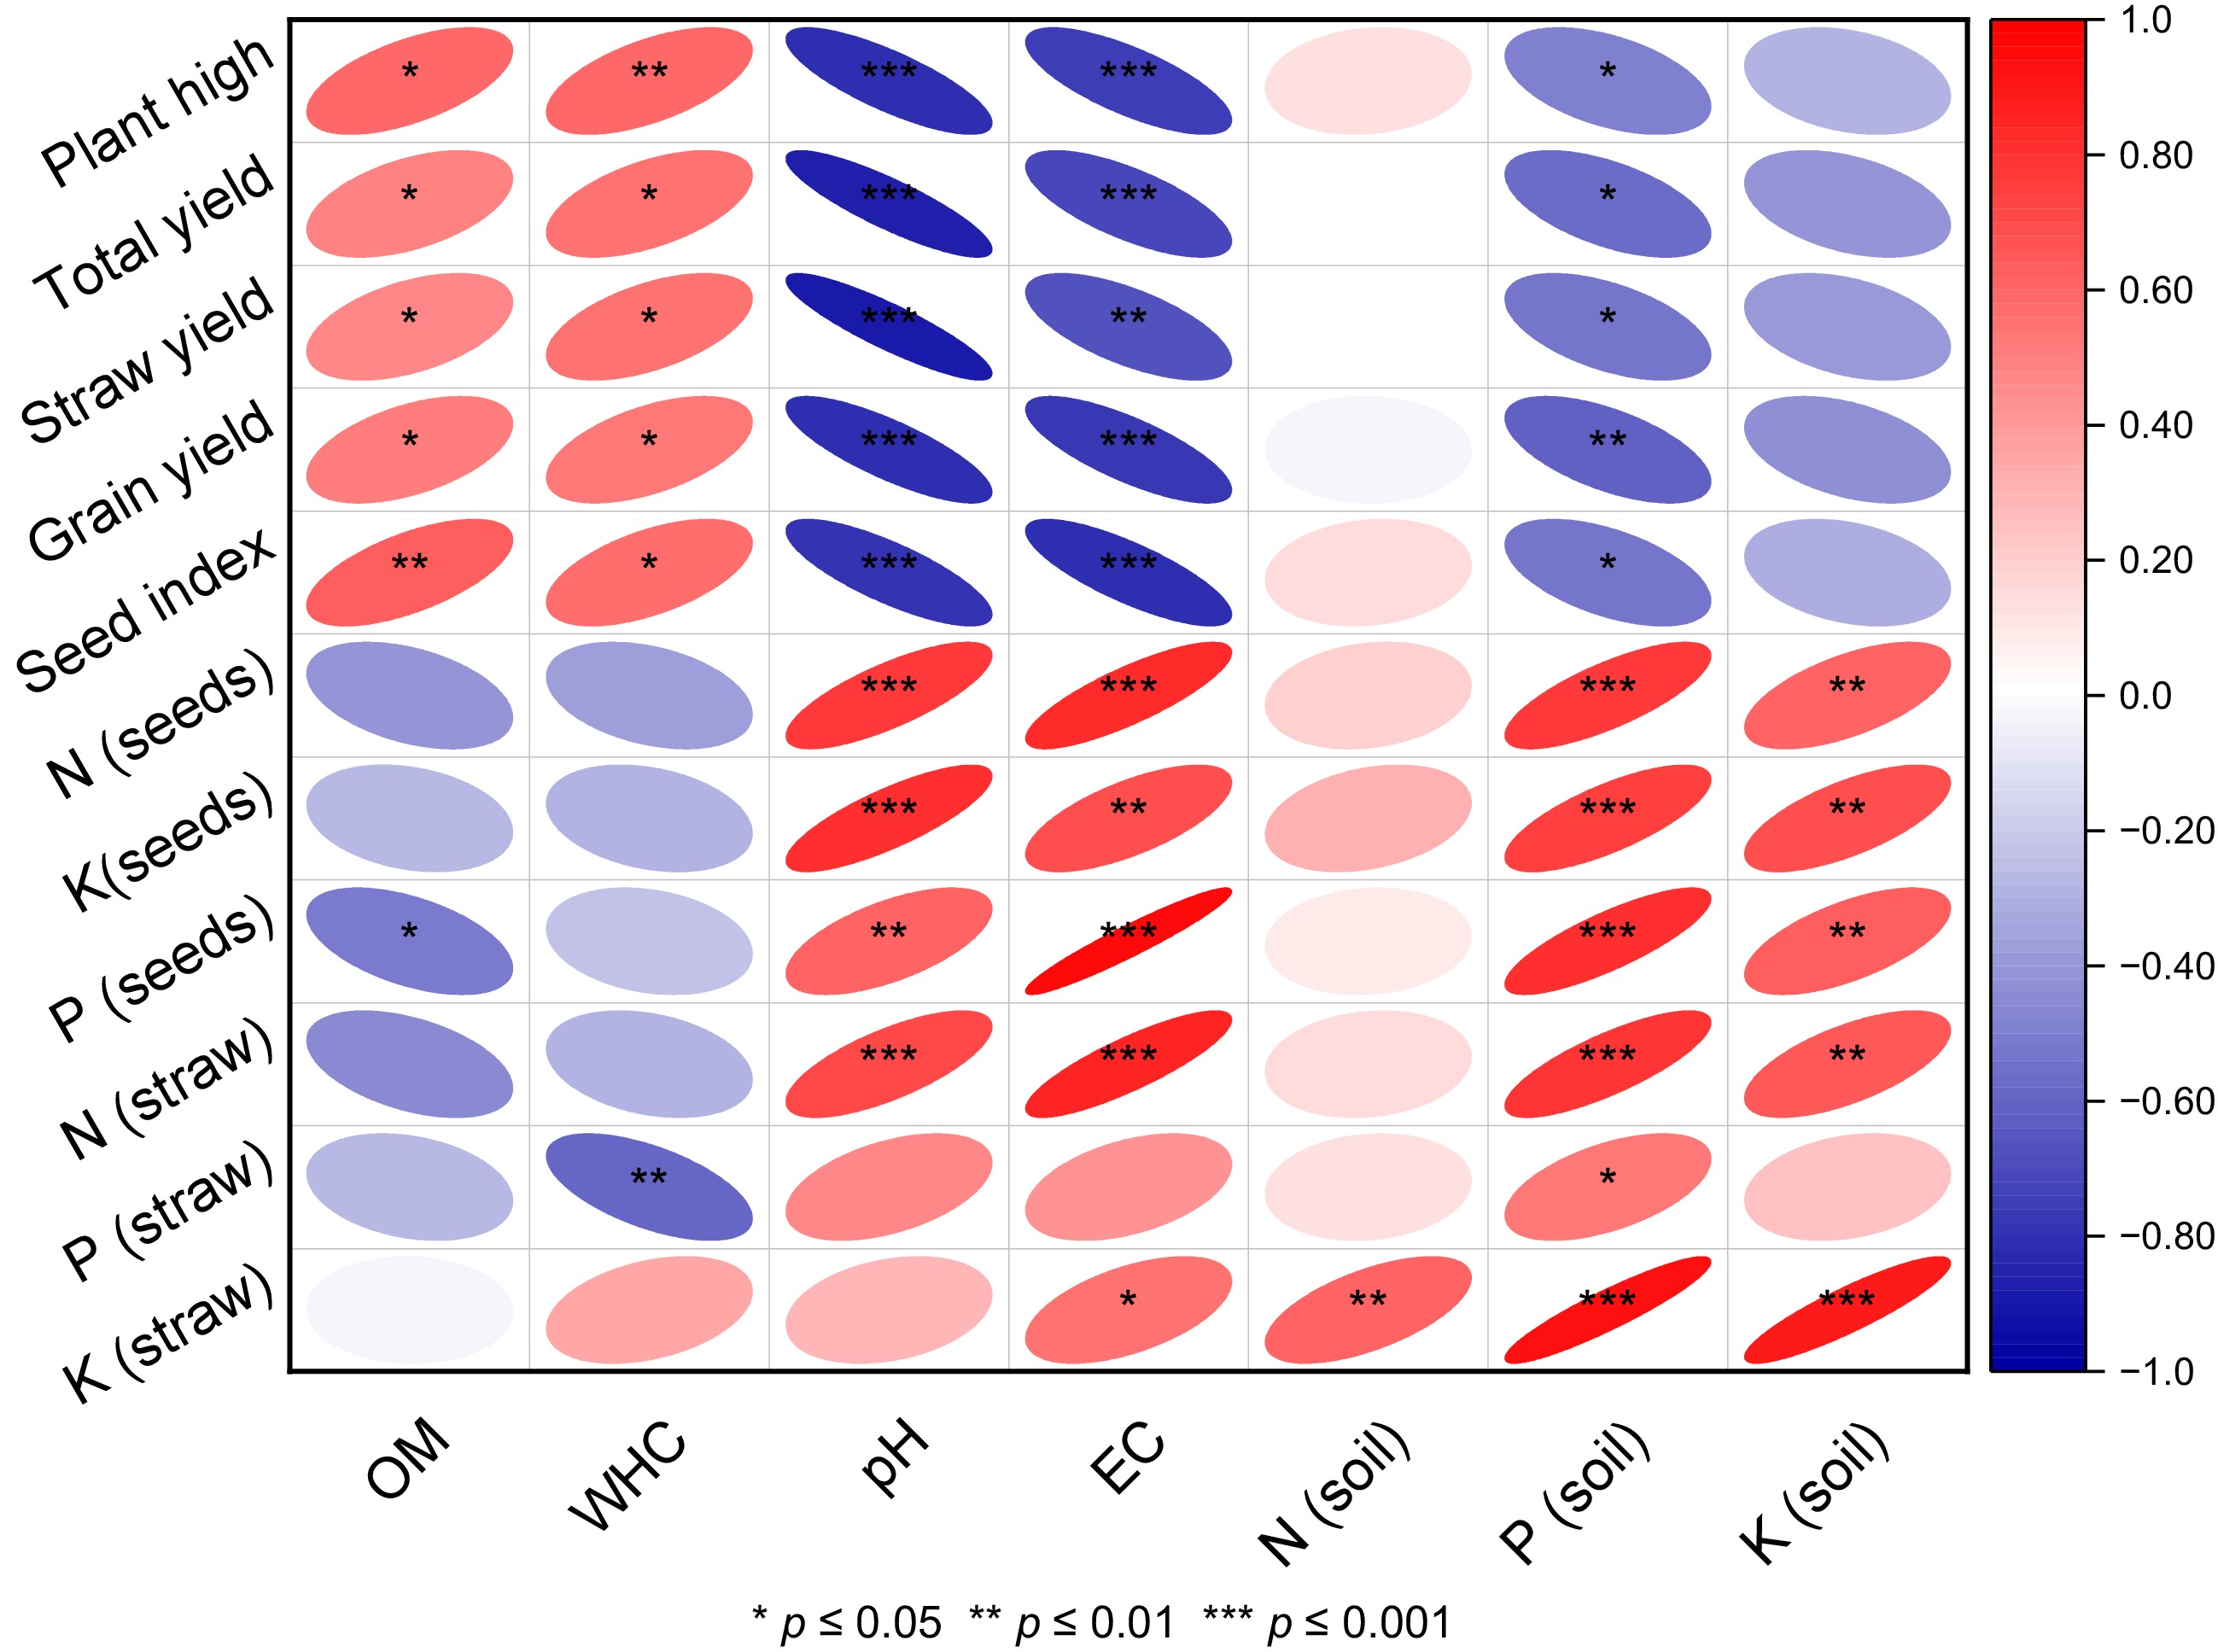
Figure 2.
Pearson's correlation analysis of soil and plant properties under different irrigation levels and algae treatments. OM, organic matter; WHC, water-holding capacity; NPK (soil).
-
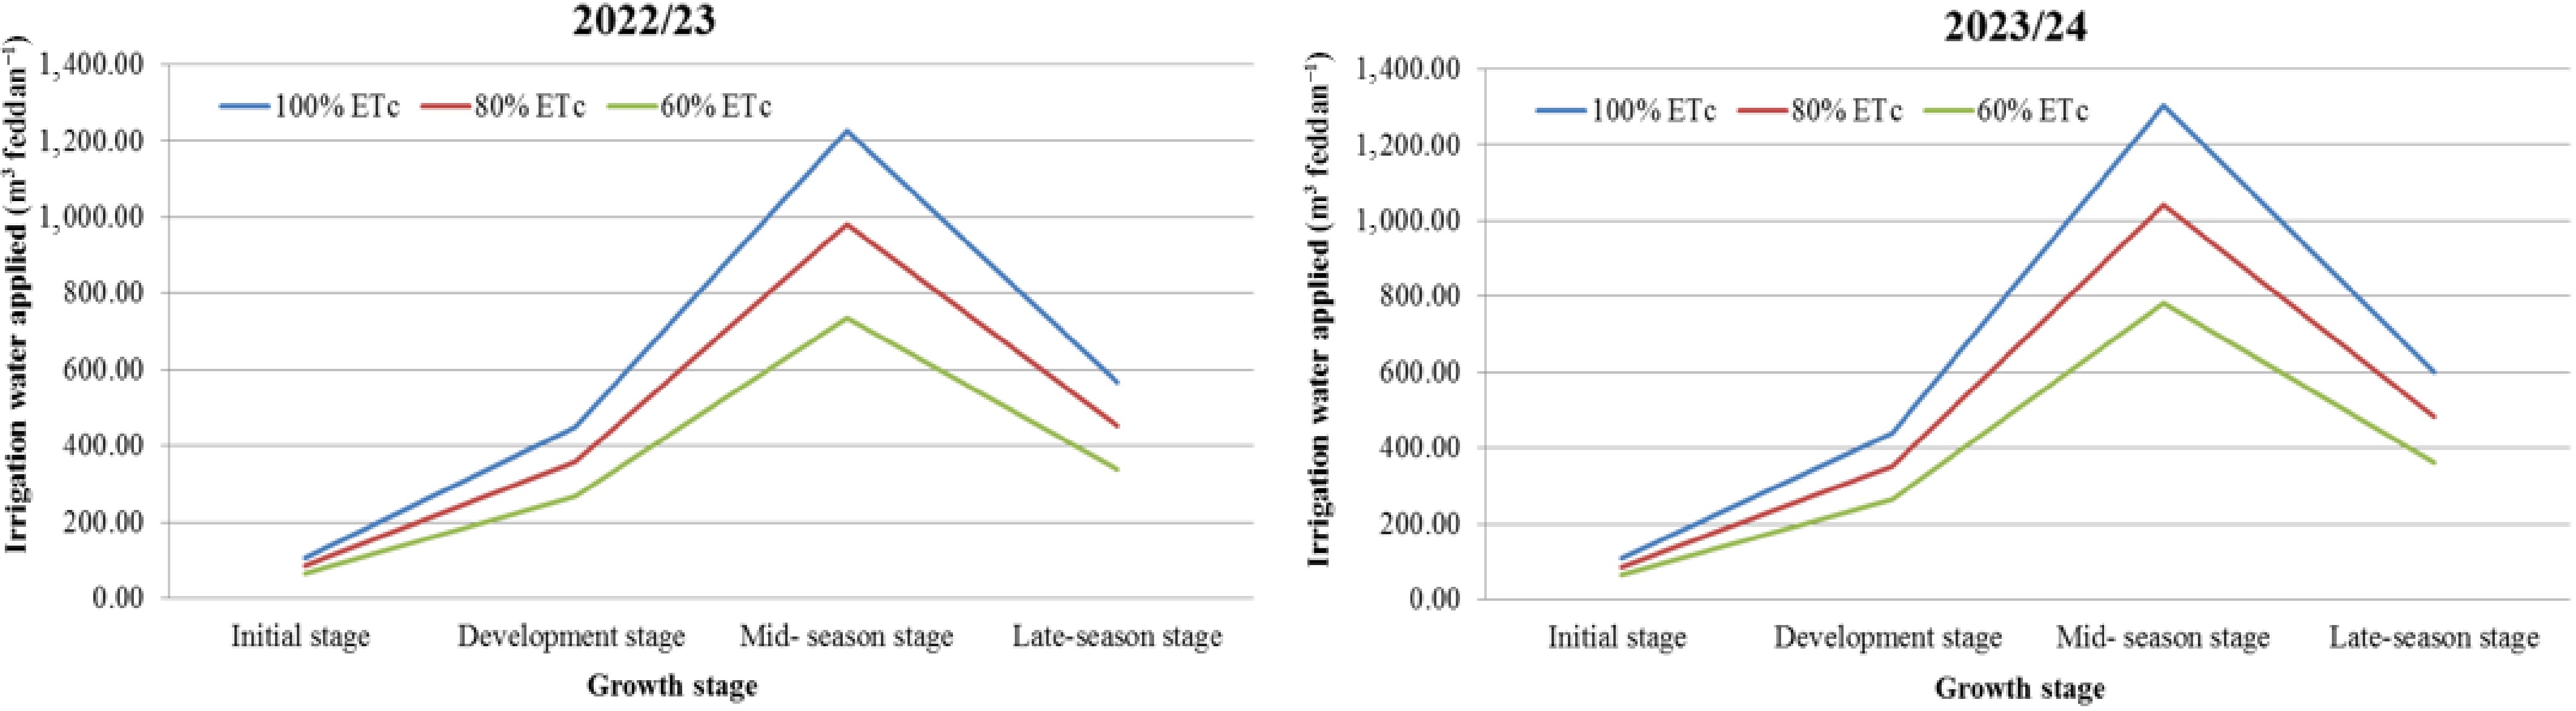
Figure 3.
Irrigation water applied (m3 feddan−1) at different growth stages of wheat grown under different irrigation levels during the two seasons 2022/2023 and 2023/2024.
-
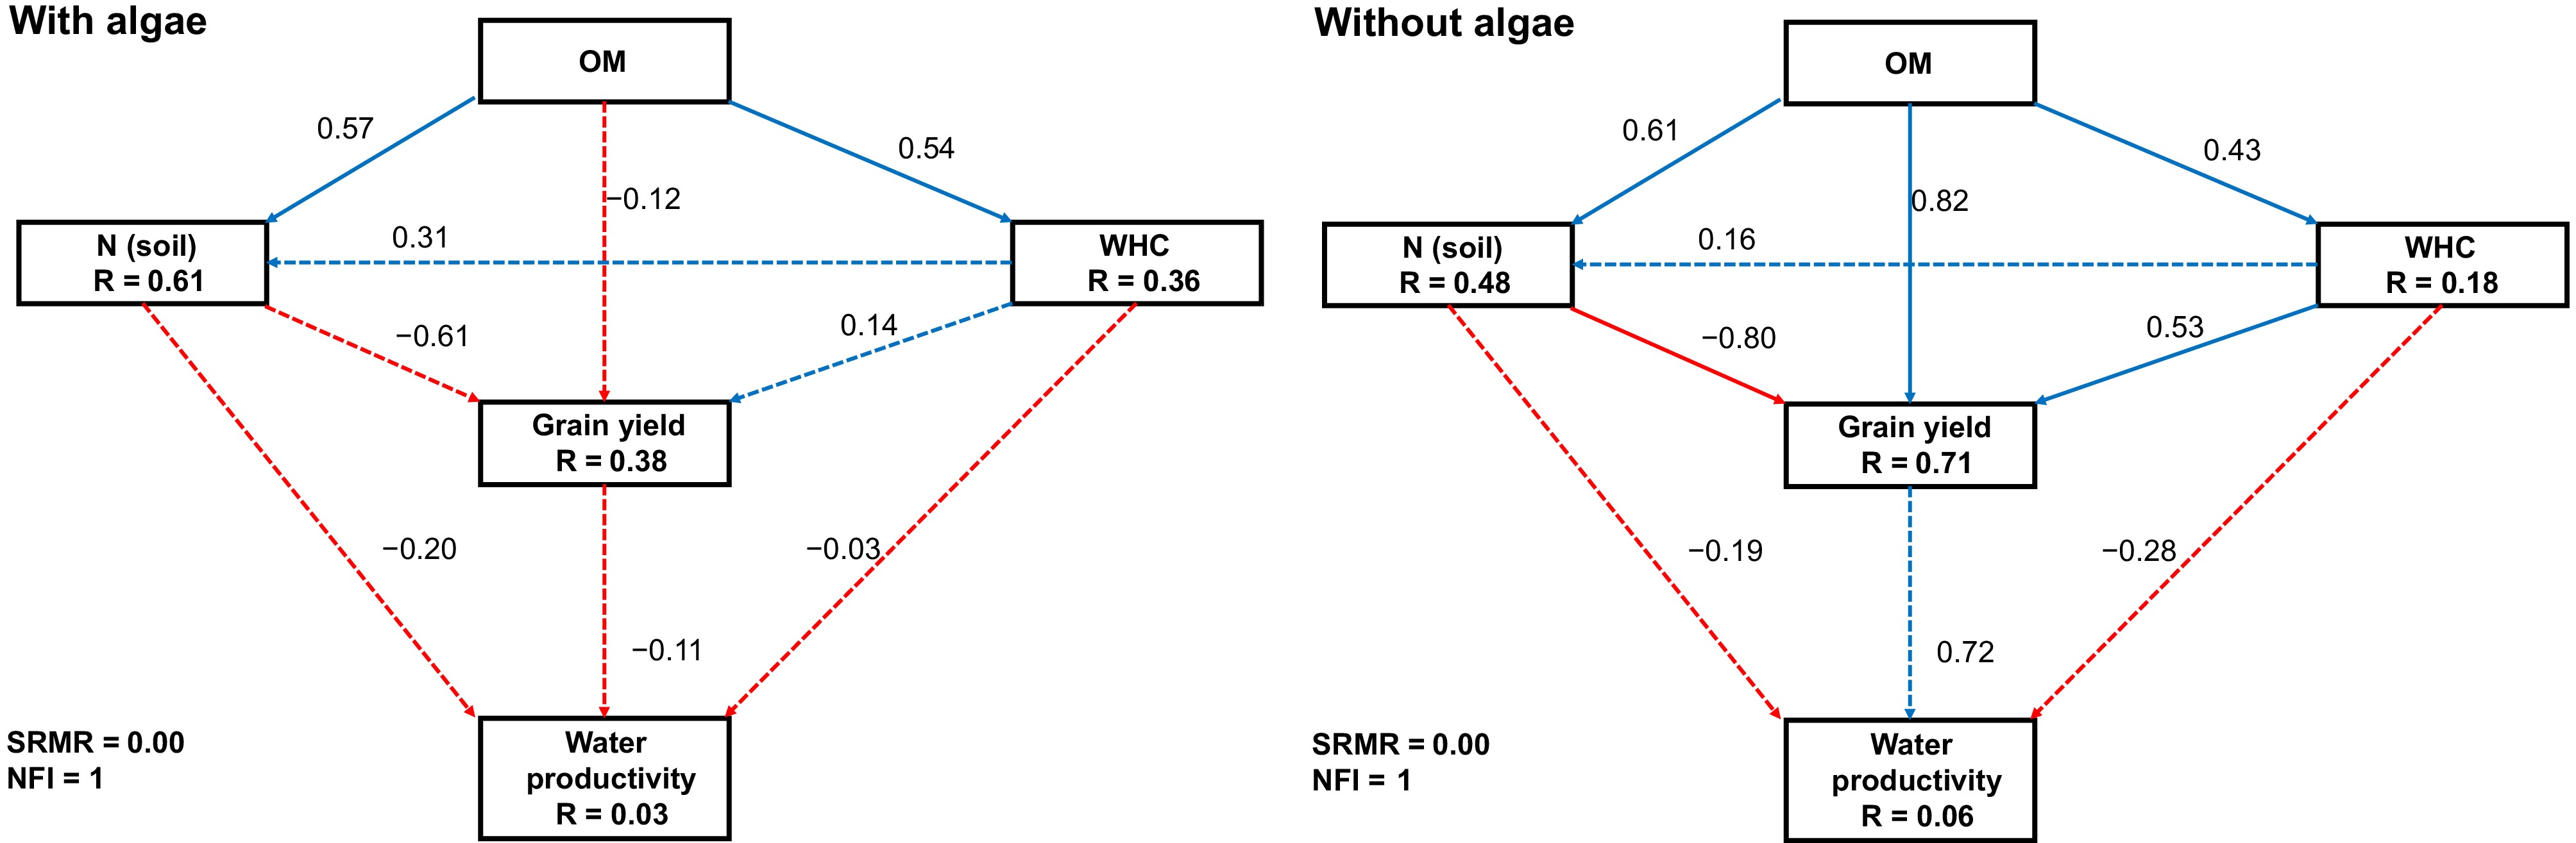
Figure 4.
Partial least squares structural equation model of the effects of organic matter (OM), WHC, and available soil N, and grain yield on water productivity, with and without the application of algae. Blue and red indicate positive and negative effects, respectively. Dashed arrows show that coefficients did not differ significantly (p ≤ 0.05).
-
Property Value Sand (%) 87.67 Silt (%) 8.06 Clay (%) 4.27 Texture grade Sand Water-holding capacity (%) 23.08 Bulk density (ton m−3) 1.65 Organic matter (%) 0.78 CaCO3 (g kg−1) 280.5 pH (1:1) 8.46 EC (1:1) (ds m−1) 0.58 Soluble cations (mmol kg−1) Calcium 1.67 Magnesium 0.69 Sodium 0.83 Potassium 0.26 Soluble anions (mmol kg−1) Bicarbonate 0.43 Chloride 1.54 Sulfate 1.92 Available macronutrients (mg kg−1) Nitrogen 32.2 Phosphorus (Olsen) 7.9 Potassium 40.1 EC electrical conductivity. Table 1.
Physical and chemical properties of representative composite soil samples from the experimental field site.
-
Temperature (°C) Relative
humidity (%)Wind speed
(km/h)Sunshine
hours (h)Max Min 2022–2023 December 22.9 9.3 57.6 9.6 9.0 January 21.1 7.1 56 10.1 8.9 February 20.2 6.1 51 11.8 9.7 March 27.1 12.1 34.3 9.9 9.9 April 31.5 15.1 25.5 14.2 10.3 2023–2024 December 23.4 9.9 60.2 8.9 9.0 January 20.9 7.1 53.2 9.1 8.9 February 21.9 8.2 46.3 10.5 9.7 March 26.6 11.1 36.5 10.9 9.9 April 32.1 16.6 32.6 13.7 10.3 Table 2.
Mean monthly meteorological data obtained from the Assiut weather station during two seasons, 2022–2023 and 2023–2024.
-
Irrigation Algae OM (%) WHC (%) pH EC (ds m−1) 2022–2023 2023–2024 2022–2023 2023–2024 2022–2023 2023–2024 2022–2023 2023–2024 100% Without 0.84 ± 0.00 0.86 ± 0.01 22.77 ± 0.18 23.43 ± 0.43 8.12 ± 0.05 8.16 ± 0.07 0.33 ± 0.01 0.34 ± 0.00 With 0.89 ± 0.00 0.89 ± 0.02 23.57 ± 0.46 24.10 ± 0.22 8.04 ± 0.04 8.03 ± 0.03 0.36 ± 0.01 0.36 ± 0.01 80% Without 0.82 ± 0.01 0.83 ± 0.01 22.88 ± 0.26 23.55 ± 0.43 8.16 ± 0.10 8.10 ± 0.03 0.59 ± 0.03 0.59 ± 0.01 With 0.94 ± 0.00 0.95 ± 0.00 24.07 ± 0.73 24.47 ± 0.33 8.03 ± 0.03 8.02 ± 0.01 0.62 ± 0.01 0.61 ± 0.01 60% Without 0.82 ± 0.02 0.83 ± 0.01 22.30 ± 0.56 22.97 ± 0.03 8.42 ± 0.09 8.35 ± 0.04 0.63 ± 0.02 0.62 ± 0.01 With 0.93 ± 0.00 0.95 ± 0.02 24.22 ± 0.26 24.38 ± 0.19 8.13 ± 0.05 8.04 ± 0.04 0.69 ± 0.01 0.67 ± 0.00 Irrigation ** ns ns ns ** ** ** ** Algae ** ** ** ** ** ** ** ** interaction ** ** ns ns * ** ns ** Data are presented as the mean ± standard deviation. OM, organic matter; WHC, water-holding capacity; EC, electrical conductivity. * p-value ≤ 0.05, ** p-value ≤ 0.001; ns = nonsignificant. Table 3.
Effect of irrigation levels and algae on soil properties.
-
Irrigation Algae Plant height (cm) Total yield (kg feddan−1) Grain yield (kg feddan−1) Straw yield (kg feddan−1) Seed index (g) 2022–2023 2023–2024 2022–2023 2023–2024 2022–2023 2023–2024 2022–2023 2023–2024 2022–2023 2023–2024 100% Without 97.07 ± 1.15 104.33 ± 2.16 4,866.33 ± 128.56 5,130.03 ± 23.09 1,815.83 ± 35.72 1,932.47 ± 23.77 3,050.53 ± 135.71 3,197.57 ± 21.96 49.07 ± 0.57 52.37 ± 0.55 With 100.00 ± 1.87 107.50 ± 1.13 5,184.50 ± 90.56 5,526.43 ± 61.30 1,989.03 ± 31.24 2,097.13 ± 31.76 3,195.50 ± 98.58 3,429.30 ± 58.75 50.00 ± 0.10 53.40 ± 0.26 80% Without 90.80 ± 3.26 97.20 ± 1.00 4,488.57 ± 35.61 4,782.73 ± 22.15 1,590.83 ± 27.32 1,699.53 ± 15.30 2,897.73 ± 56.79 3,083.20 ± 33.52 44.77 ± 0.58 47.60 ± 0.61 With 93.93 ± 3.05 101.97 ± 1.93 4,758.60 ± 197.37 5,028.33 ± 155.44 1,781.97 ± 15.47 1,906.67 ± 16.61 2,976.70 ± 211.23 3,121.70 ± 171.29 46.93 ± 0.15 50.30 ± 0.26 60% Without 75.93 ± 0.76 78.40 ± 0.56 2,880.97 ± 37.81 3,031.13 ± 18.82 1,018.50 ± 97.45 1,050.40 ± 70.54 1,862.53 ± 112.92 1,980.80 ± 54.87 36.53 ± 0.49 38.80 ± 0.10 With 80.00 ± 0.26 83.43 ± 0.95 3,107.83 ± 58.75 3,282.97 ± 20.07 1,132.30 ± 13.05 1,217.63 ± 24.40 1,975.50 ± 57.12 2,065.33 ± 20.48 38.27 ± 0.55 40.93 ± 0.59 Irrigation ** ** ** ** ** ** ** ** ** ** Algae ** ** ** ** ** ** ns ** ** ** Interaction ns ns ns ns ns ns ns ns ns * Data are presented as the mean ± standard deviation. * p ≤ 0.05; ** p ≤ 0.001; ns = nonsignificant. Table 4.
Effect of irrigation levels and algae on wheat yield.
-
Irrigation Algae N in straw (%) P in straw (%) K in straw (%) 2022–2023 2023–2024 2022–2023 2023–2024 2022–2023 2023–2024 100% Without 0.45 ± 0.02 0.45 ± 0.01 0.18 ± 0.01 0.18 ± 0.01 1.24 ± 0.01 1.27 ± 0.01 With 0.57 ± 0.02 0.59 ± 0.02 0.19 ± 0.01 0.19 ± 0.01 1.27 ± 0.01 1.30 ± 0.01 80% Without 0.51 ± 0.02 0.53 ± 0.01 0.18 ± 0.01 0.18 ± 0.01 1.25 ± 0.01 1.29 ± 0.01 With 0.63 ± 0.02 0.65 ± 0.01 0.20 ± 0.01 0.20 ± 0.01 1.28 ± 0.01 1.31 ± 0.01 60% Without 0.60 ± 0.02 0.62 ± 0.01 0.19 ± 0.01 0.19 ± 0.01 1.27 ± 0.01 1.30 ± 0.01 With 0.72 ± 0.01 0.74 ± 0.01 0.20 ± 0.01 0.20 ± 0.01 1.30 ± 0.01 1.34 ± 0.01 Irrigation ** ** * ns ** ** Algae ** ** ** ** ** ** Interaction ns ns ns ns ns ns Mean ± standard deviation. N nitrogen, P phosphorus, K potassium. * p value ≤ 0.05; ** p value ≤ 0.001; ns = nonsignificant. Table 5.
Effect of irrigation levels and algae on the nutrient content of straw.
-
Irrigation Algae N in grain (%) P in grain (%) K in grain (%) 2022–2023 2023–2024 2022–2023 2023–2024 2022–2023 2023–2024 100% Without 1.59 ± 0.01 1.64 ± 0.01 0.31 ± 0.01 0.32 ± 0.01 0.63 ± 0.01 0.65 ± 0.01 With 1.72 ± 0.01 1.74 ± 0.00 0.43 ± 0.02 0.44 ± 0.01 0.67 ± 0.02 0.69 ± 0.02 80% Without 1.71 ± 0.01 1.75 ± 0.00 0.39 ± 0.01 0.40 ± 0.01 0.64 ± 0.01 0.66 ± 0.01 With 1.92 ± 0.04 1.98 ± 0.04 0.54 ± 0.02 0.55 ± 0.02 0.73 ± 0.01 0.75 ± 0.01 60% Without 1.94 ± 0.05 1.95 ± 0.00 0.44 ± 0.02 0.44 ± 0.01 0.71 ± 0.01 0.72 ± 0.01 With 2.05 ± 0.03 2.05 ± 0.04 0.63 ± 0.01 0.64 ± 0.01 0.75 ± 0.01 0.77 ± 0.01 Irrigation ** ** ** ** ** ** Algae ** ** ** ** ** ** Interaction * ** ** ** ** ** Mean ± standard deviation. N nitrogen, P phosphorus, K potassium. * p value ≤ 0.05, ** p value ≤ 0.001; ns = non-significant. Table 6.
Effect of irrigation levels and algae on the nutrient content of grain.
Figures
(4)
Tables
(6)