-
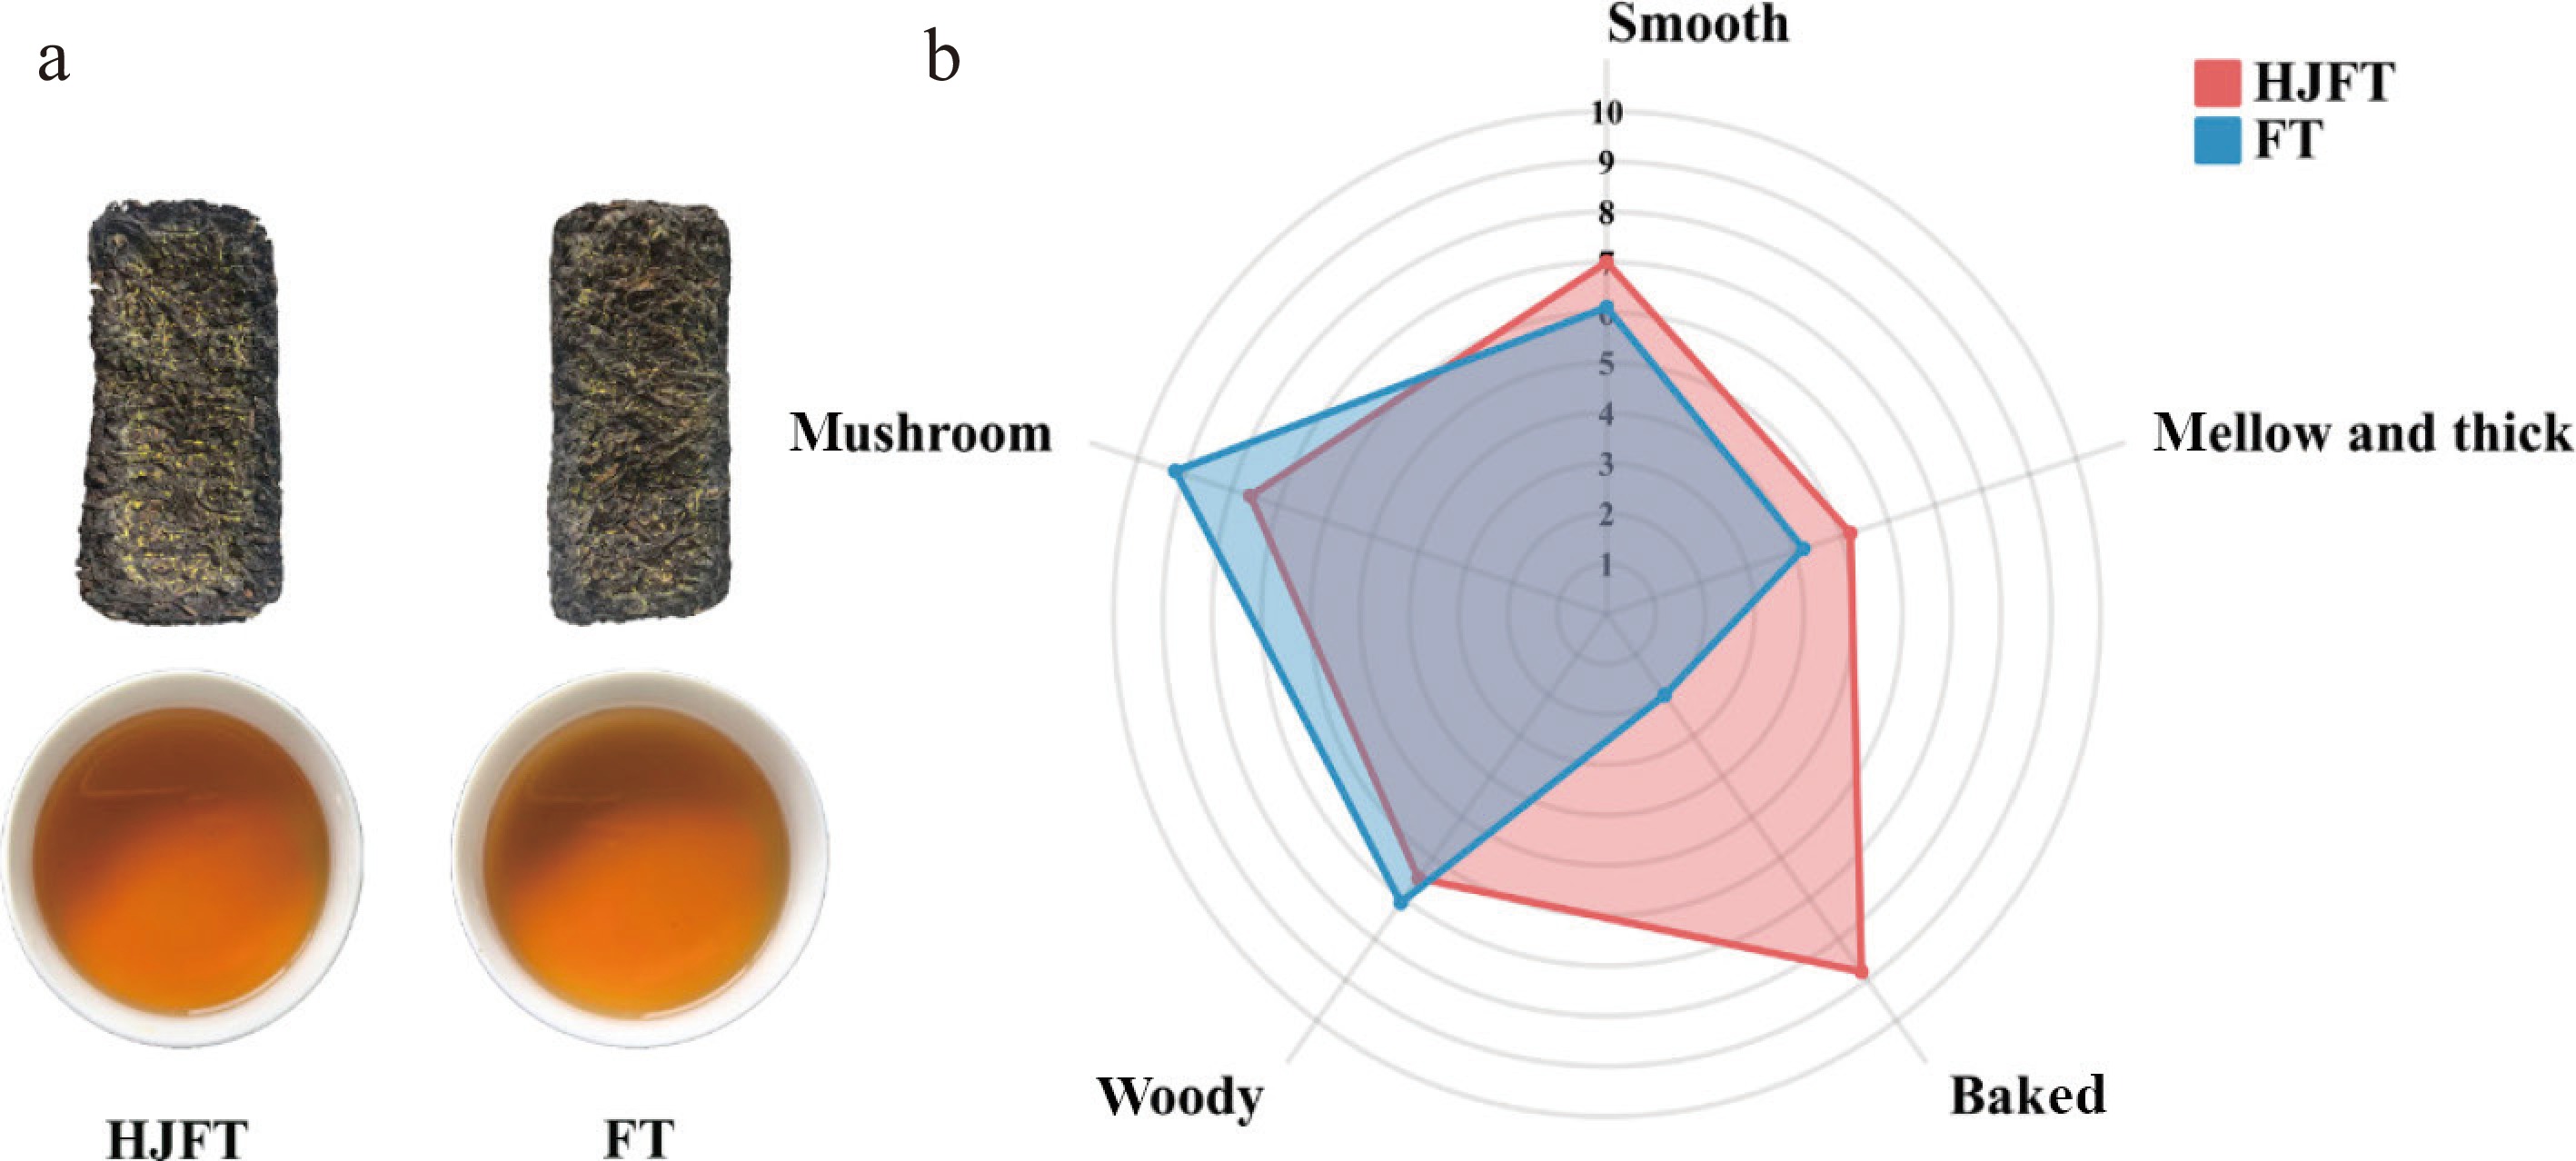
Figure 1.
Sensory evaluation correlation diagram. (a) FT and HJFT samples and the brewed tea infusion; (b) radar chart of FT and HJFT aroma intensity and taste characteristics.
-
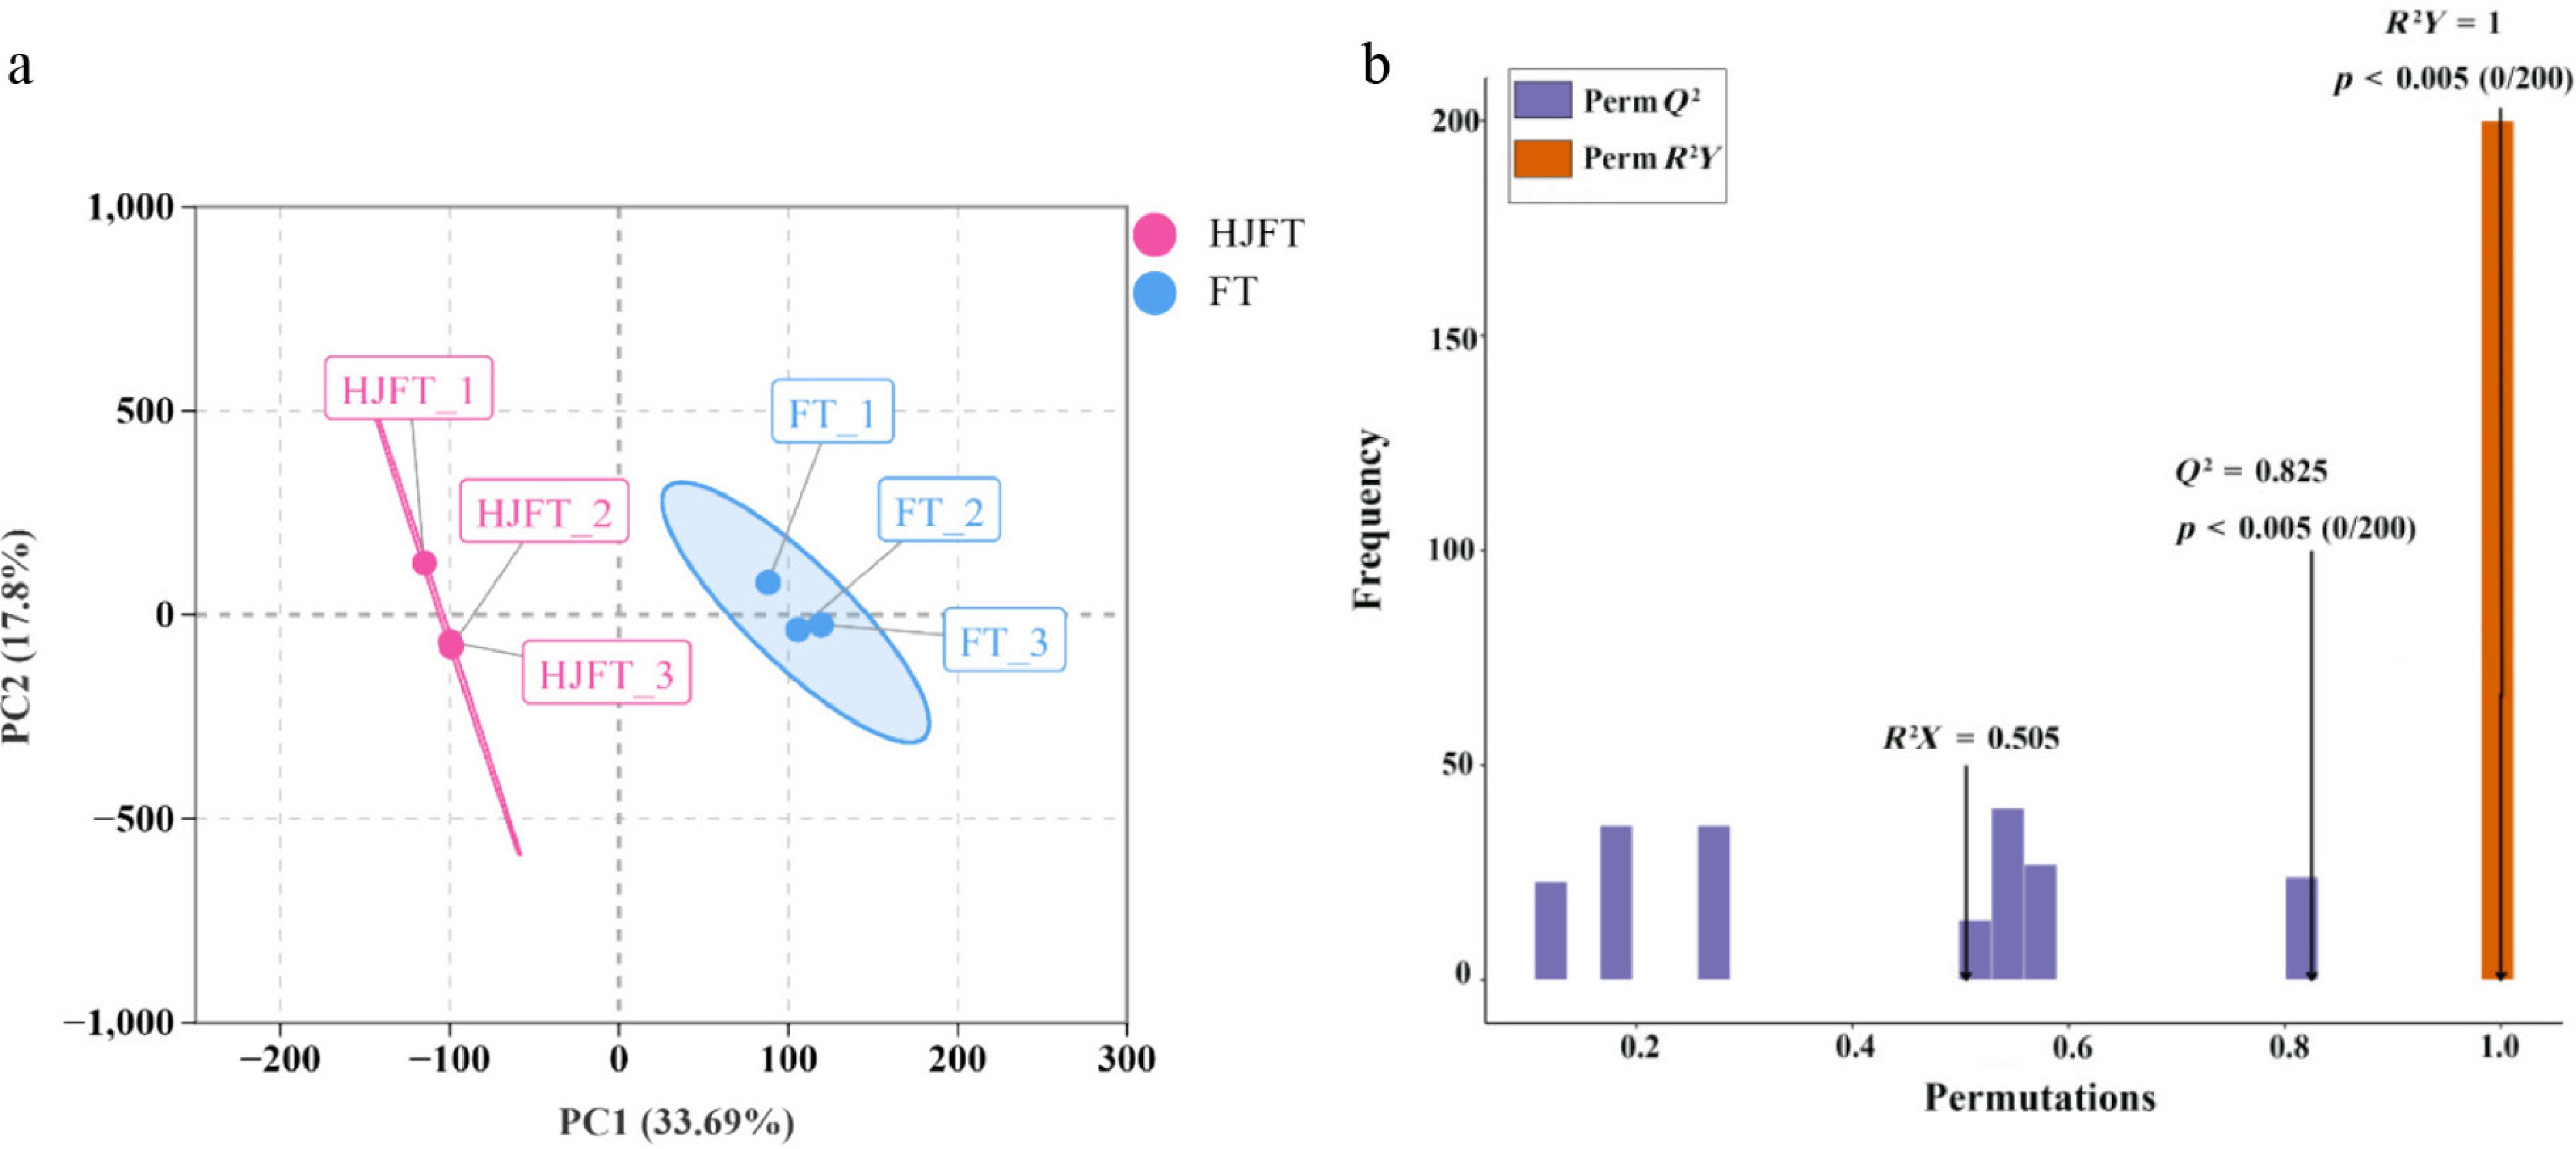
Figure 2.
PCA and OPLS-DA analysis. (a) PCA analysis plot; (b) OPLS-DA model of differential metabolites.
-
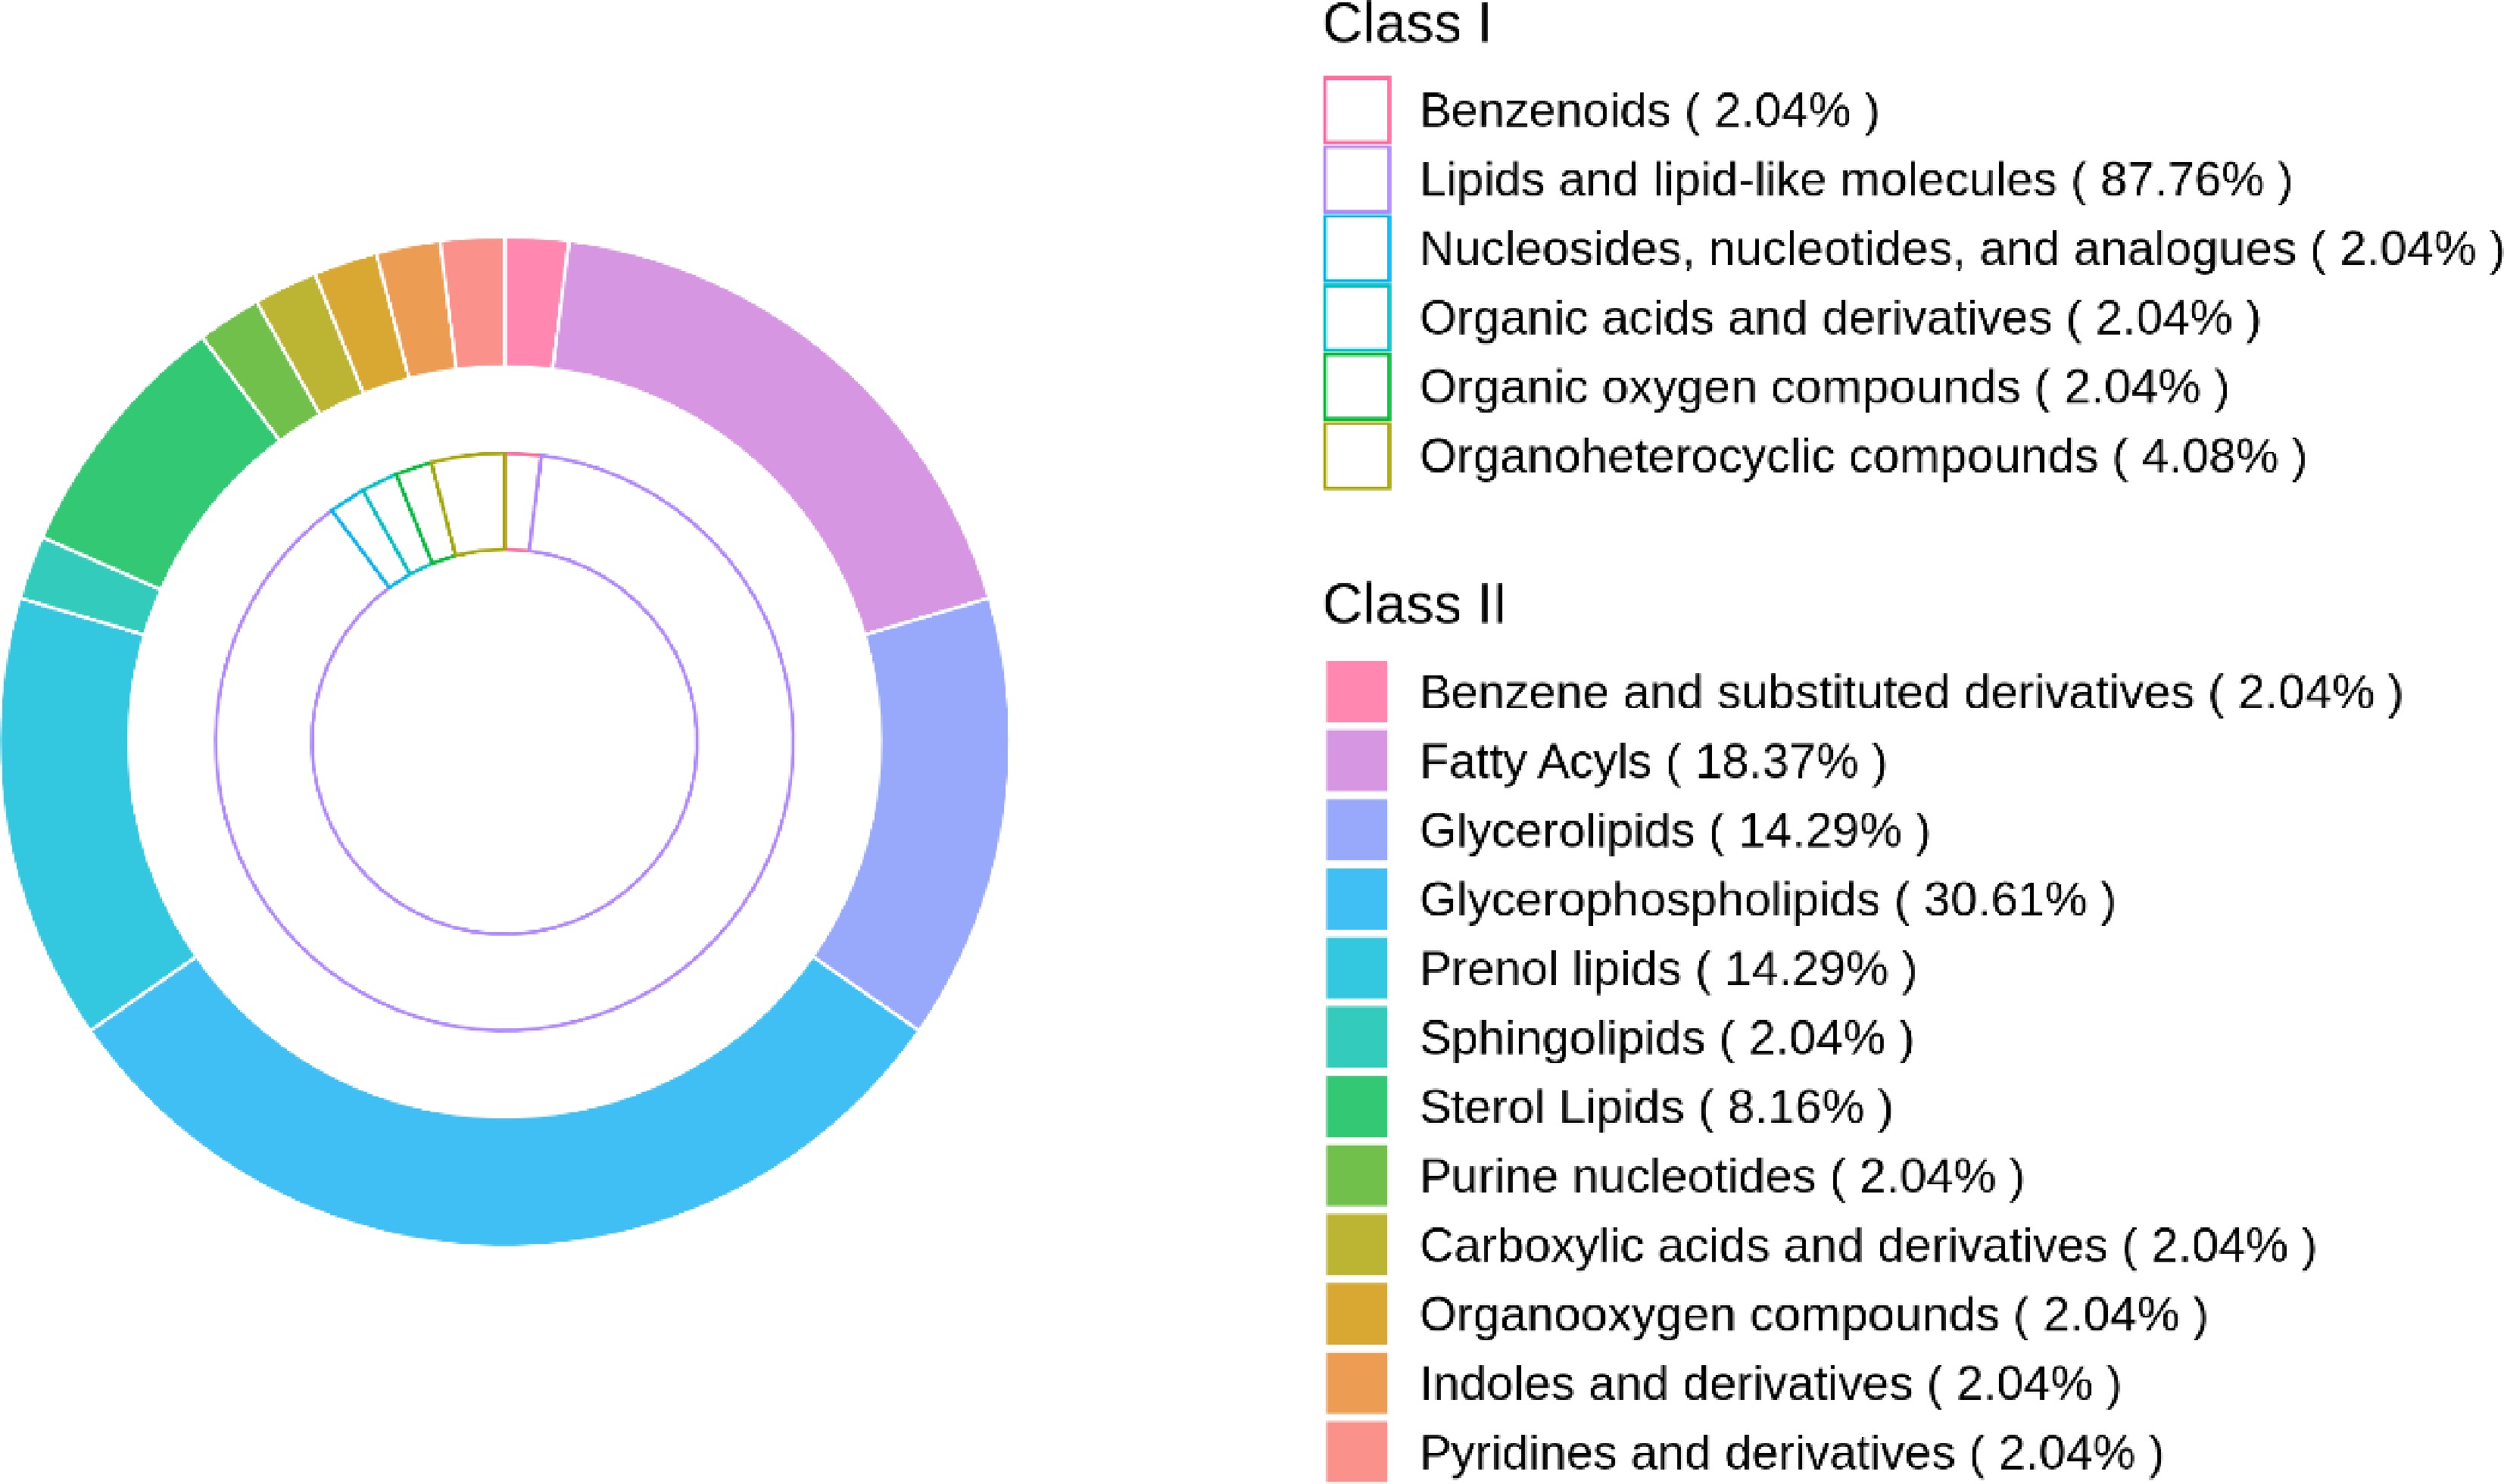
Figure 3.
Comparison of different metabolite classes in FT and HJFT. The proportion of Class I (inner circle) and Class II (outer circle) classifications based on the substances after screening.
-
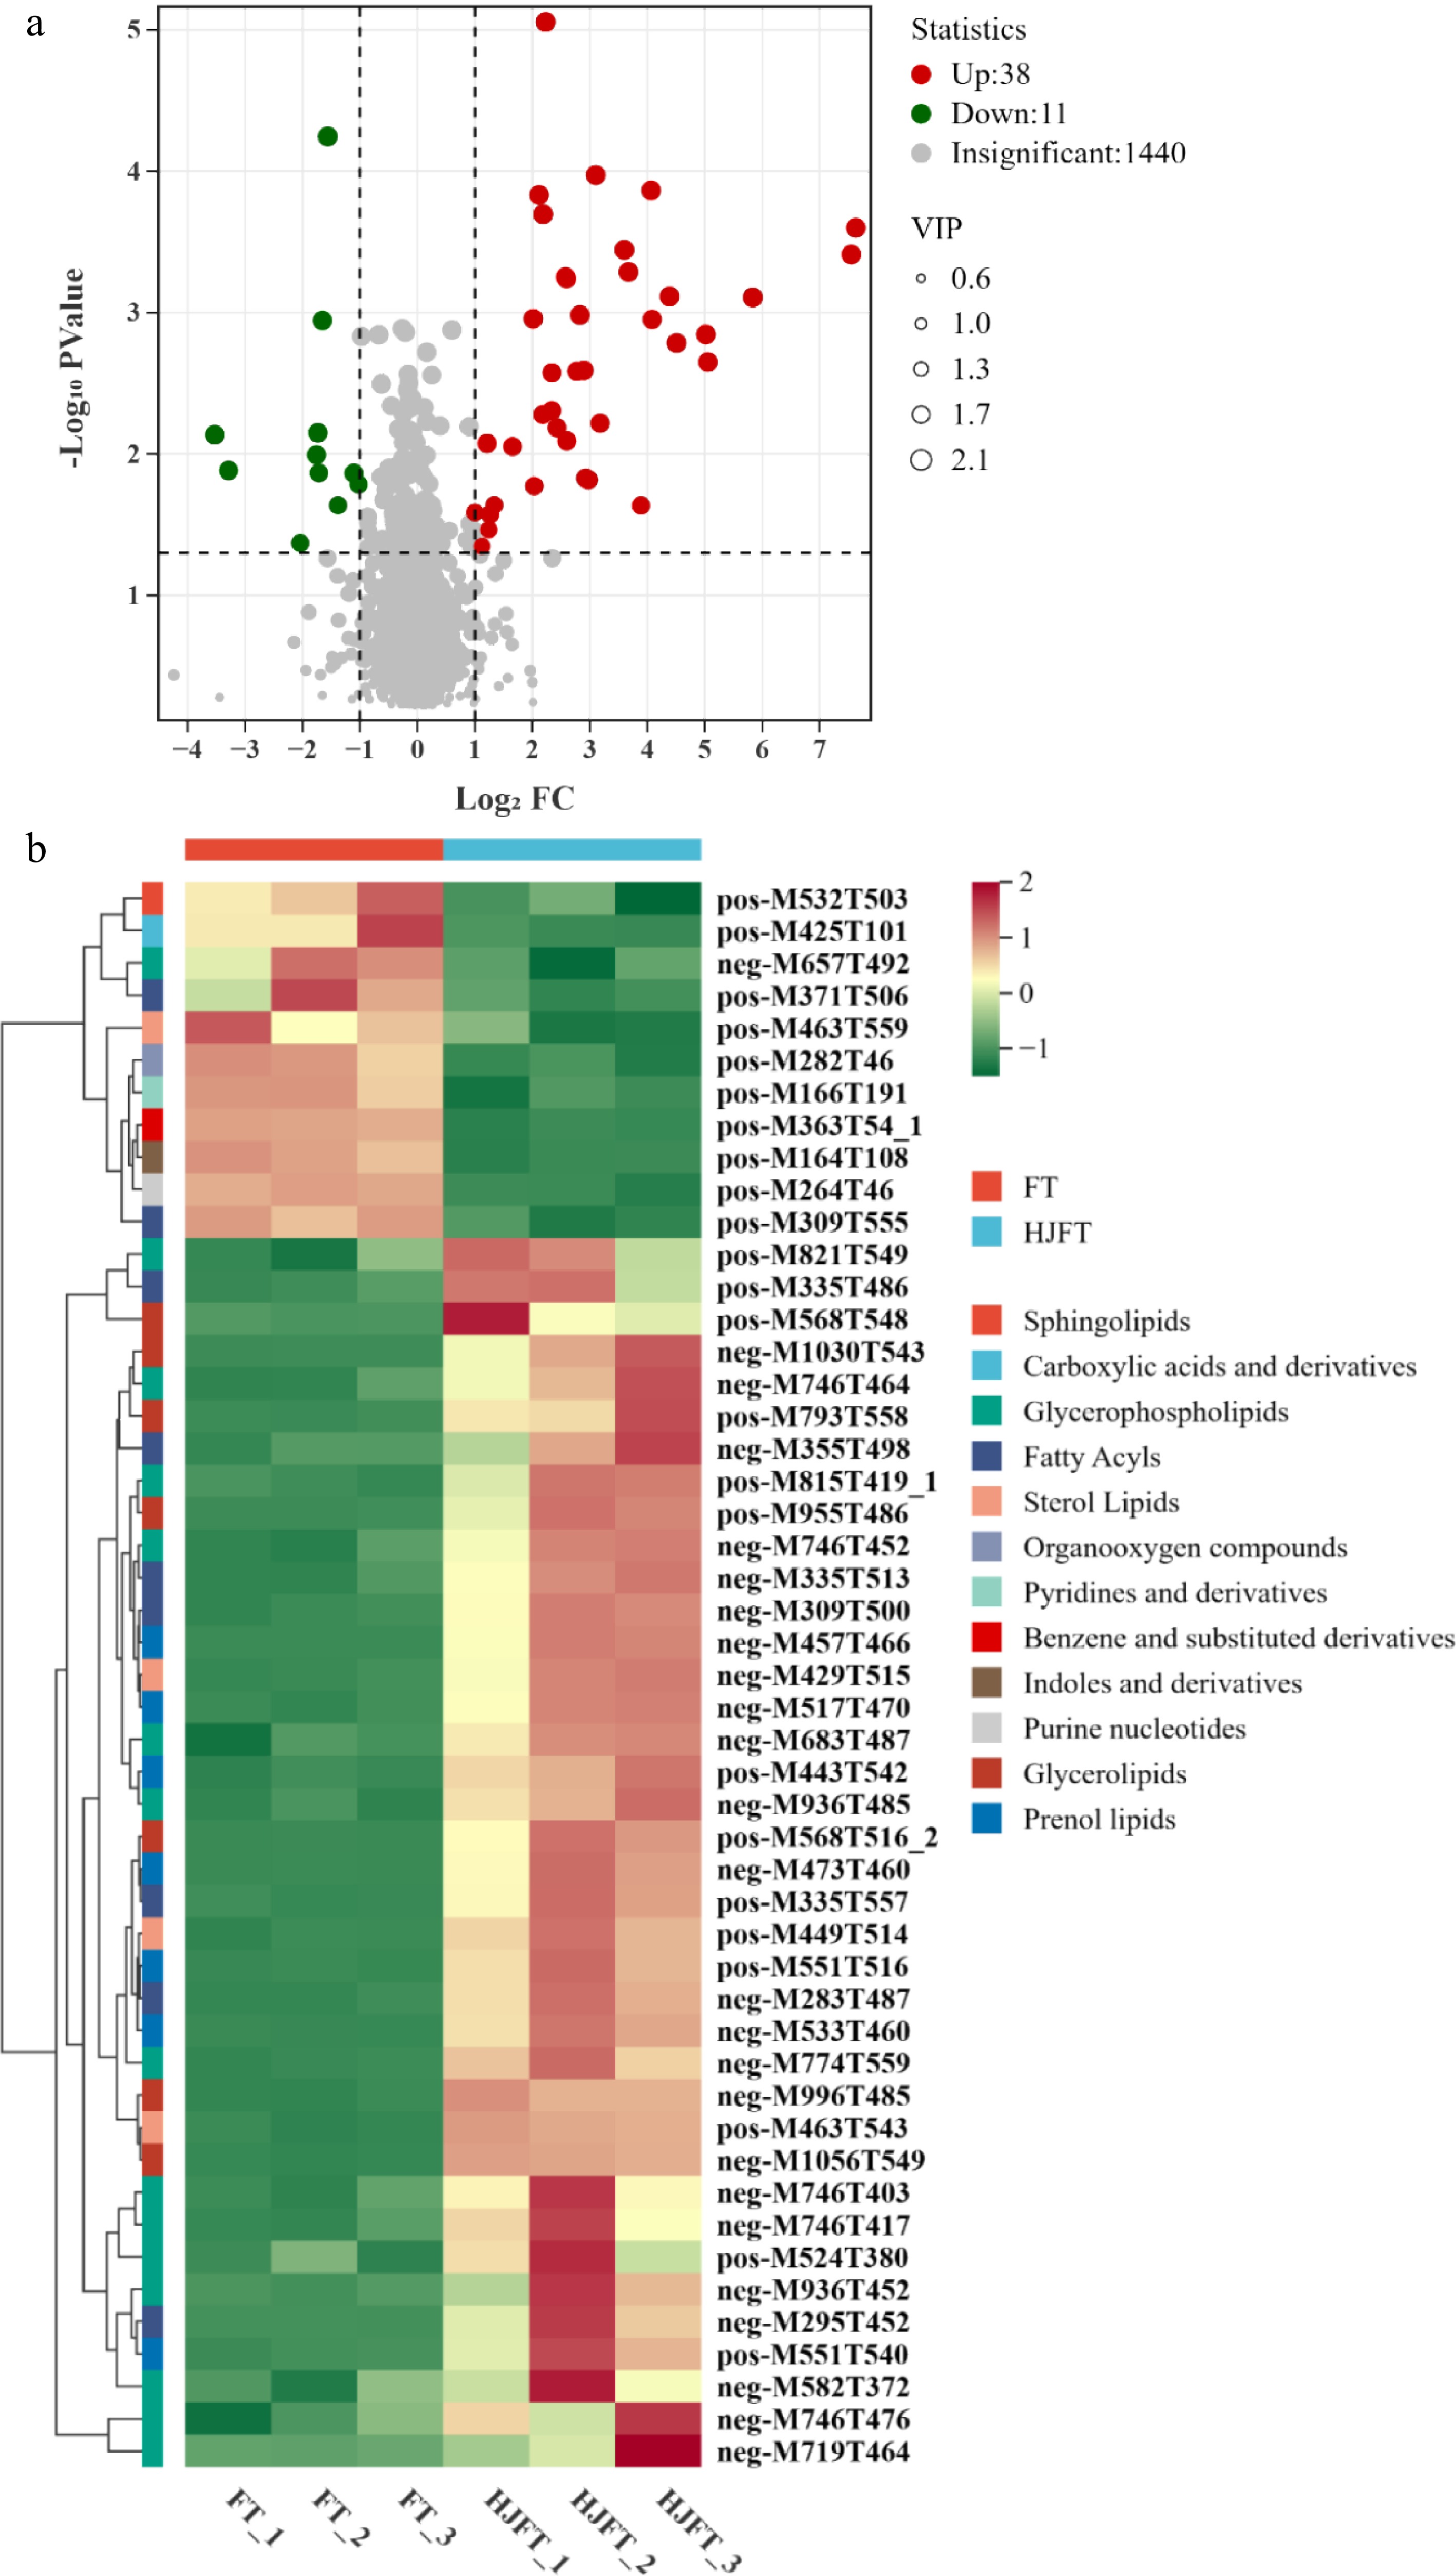
Figure 4.
Differential metabolites of FT and HJFT. (a) Volcano gram of upregulated and downregulated metabolites; (b) clustering heatmap of differential metabolites.
-
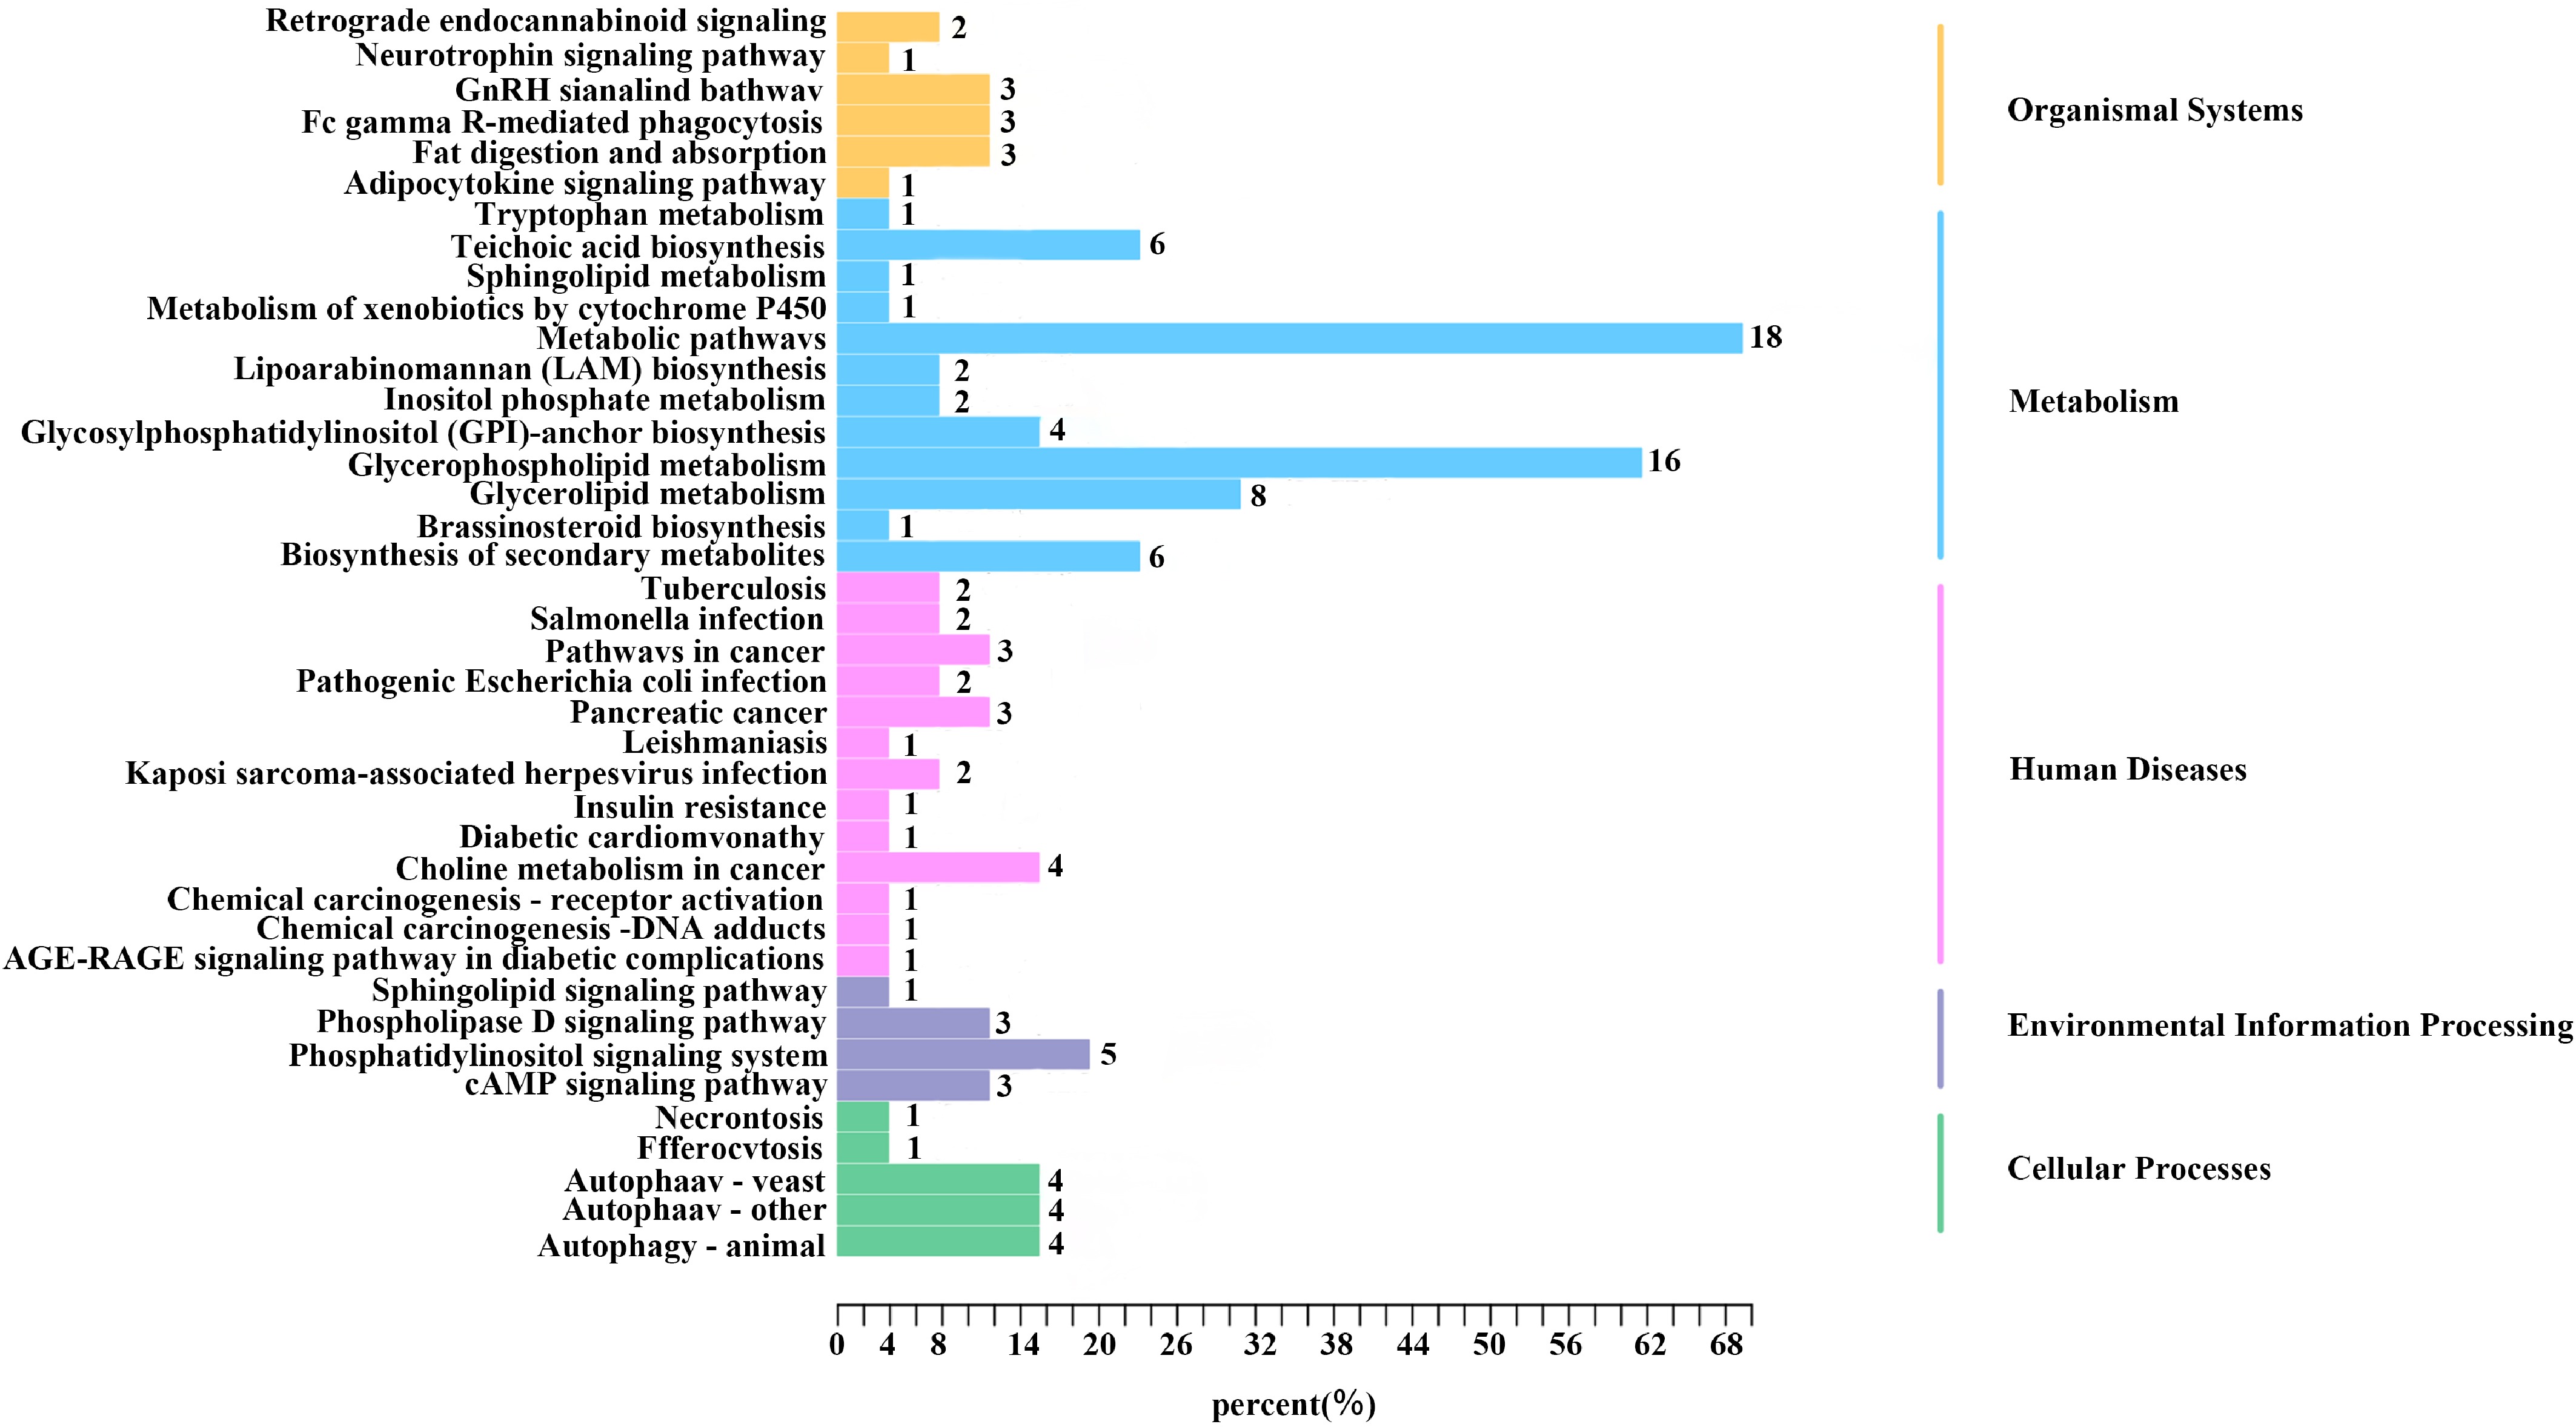
Figure 5.
KEGG enrichment pathway analysis includes environmental information processing channels (10%), cellular processing channels (12.5%), human diseases channels (32.5%), organismal systems channels (15%), and metabolism channels (30%). The numbers following the bars in the figure represent the substances contained in each pathway.
-
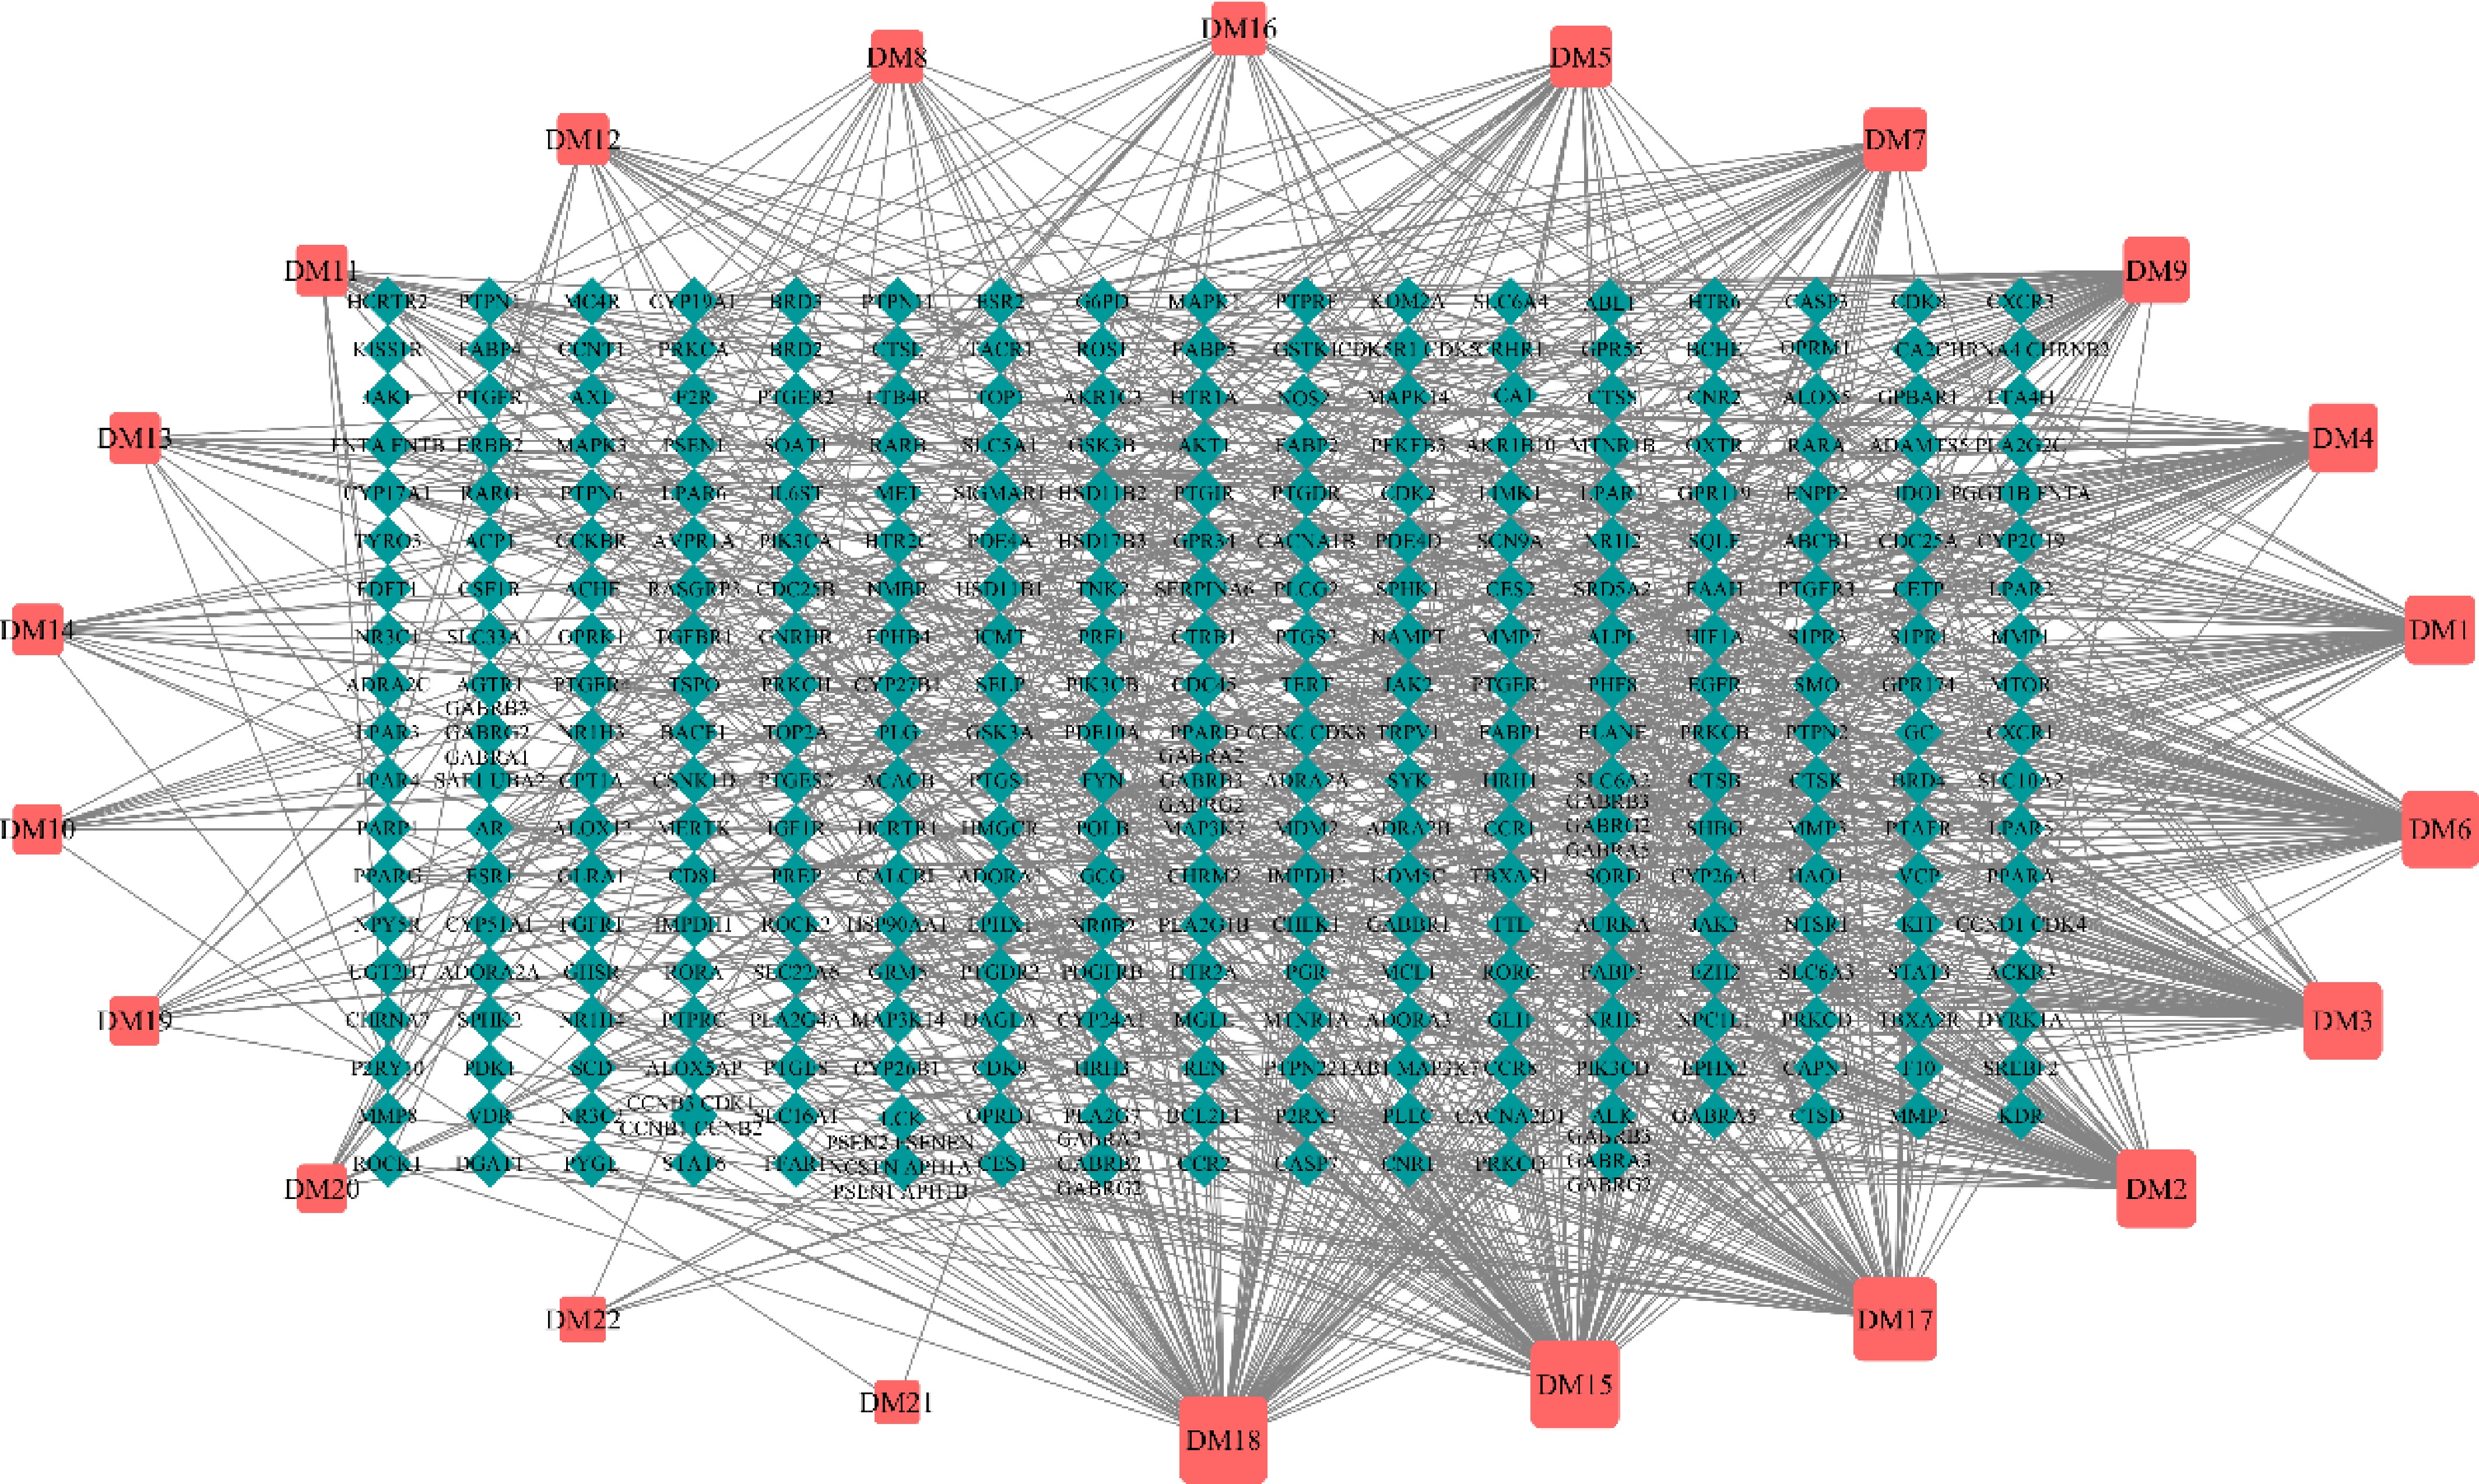
Figure 6.
Metabolite-target network analysis. The red box represents metabolites; the light blue diamond represents the target genes.
-
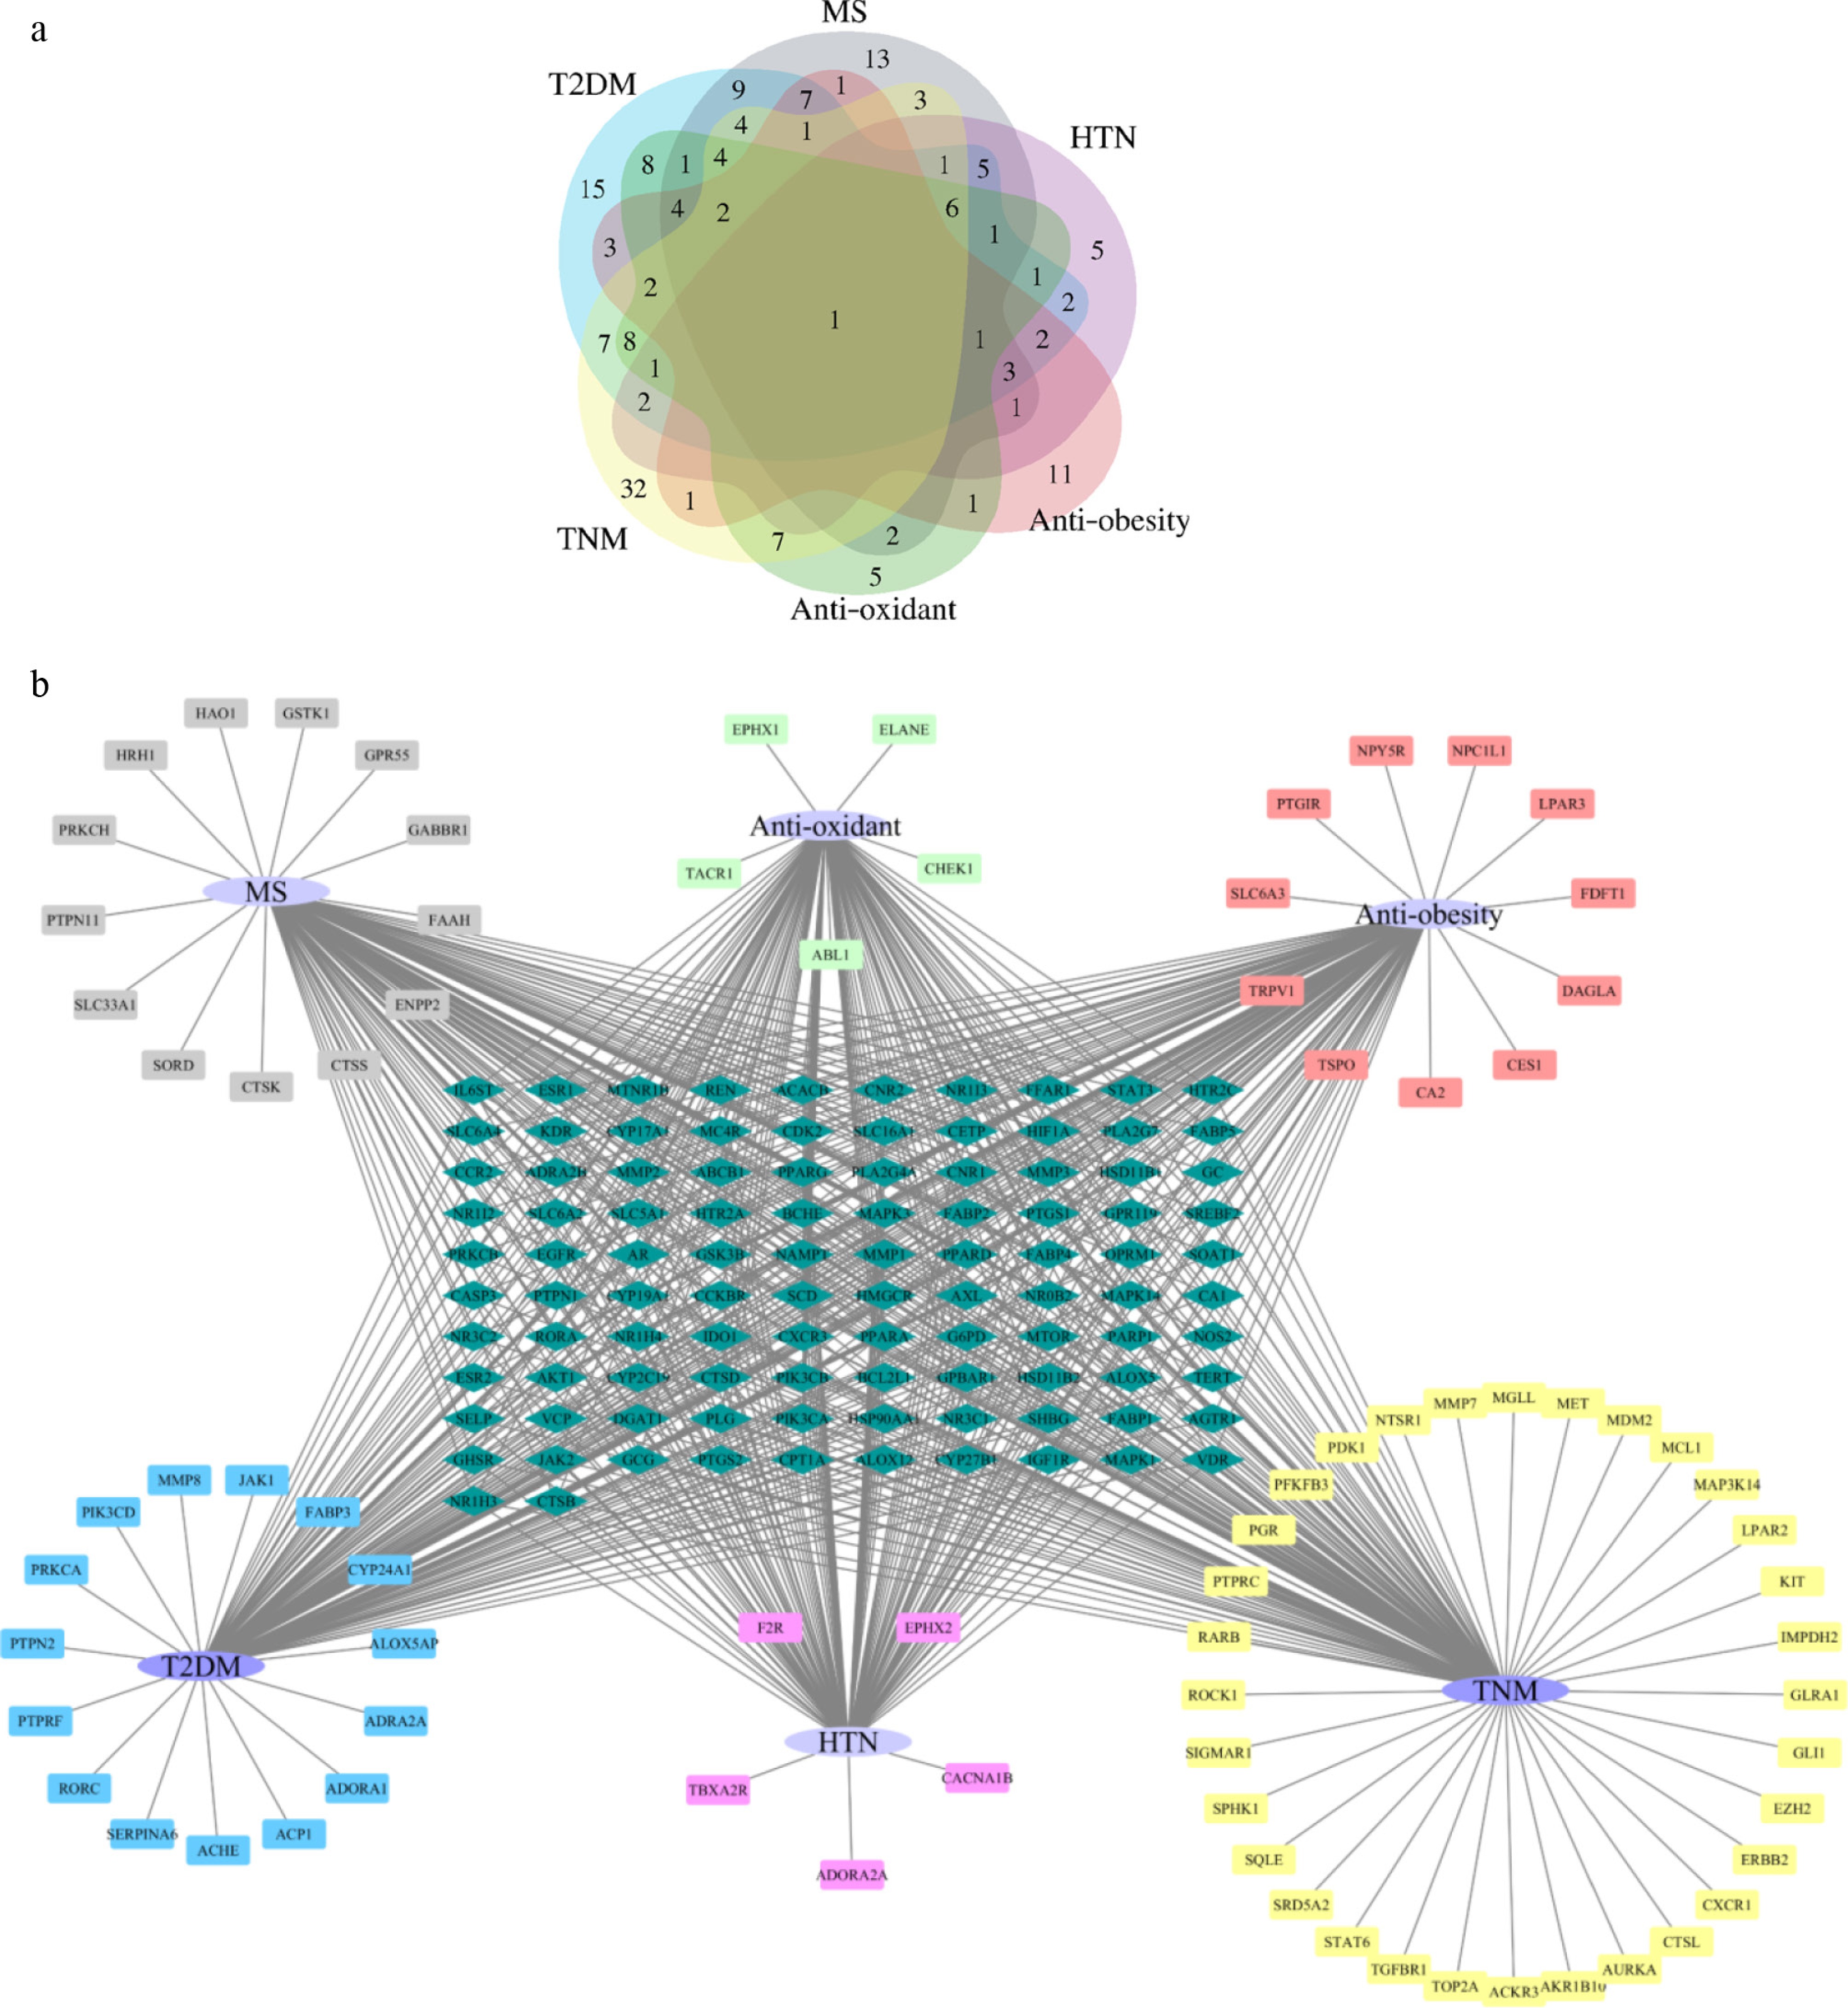
Figure 7.
Disease-target diagram. (a) The Venn diagram comprehensive overlap of up-regulate metabolite-target and six types of disease-targets; (b) Six types of disease targets network (Purple nodes represent the diseases, light blue nodes represent multi disease associated targets, which associated with two or more diseases, the highlighted rectangles represent disease-specific targets, which linked to a single disease).
-
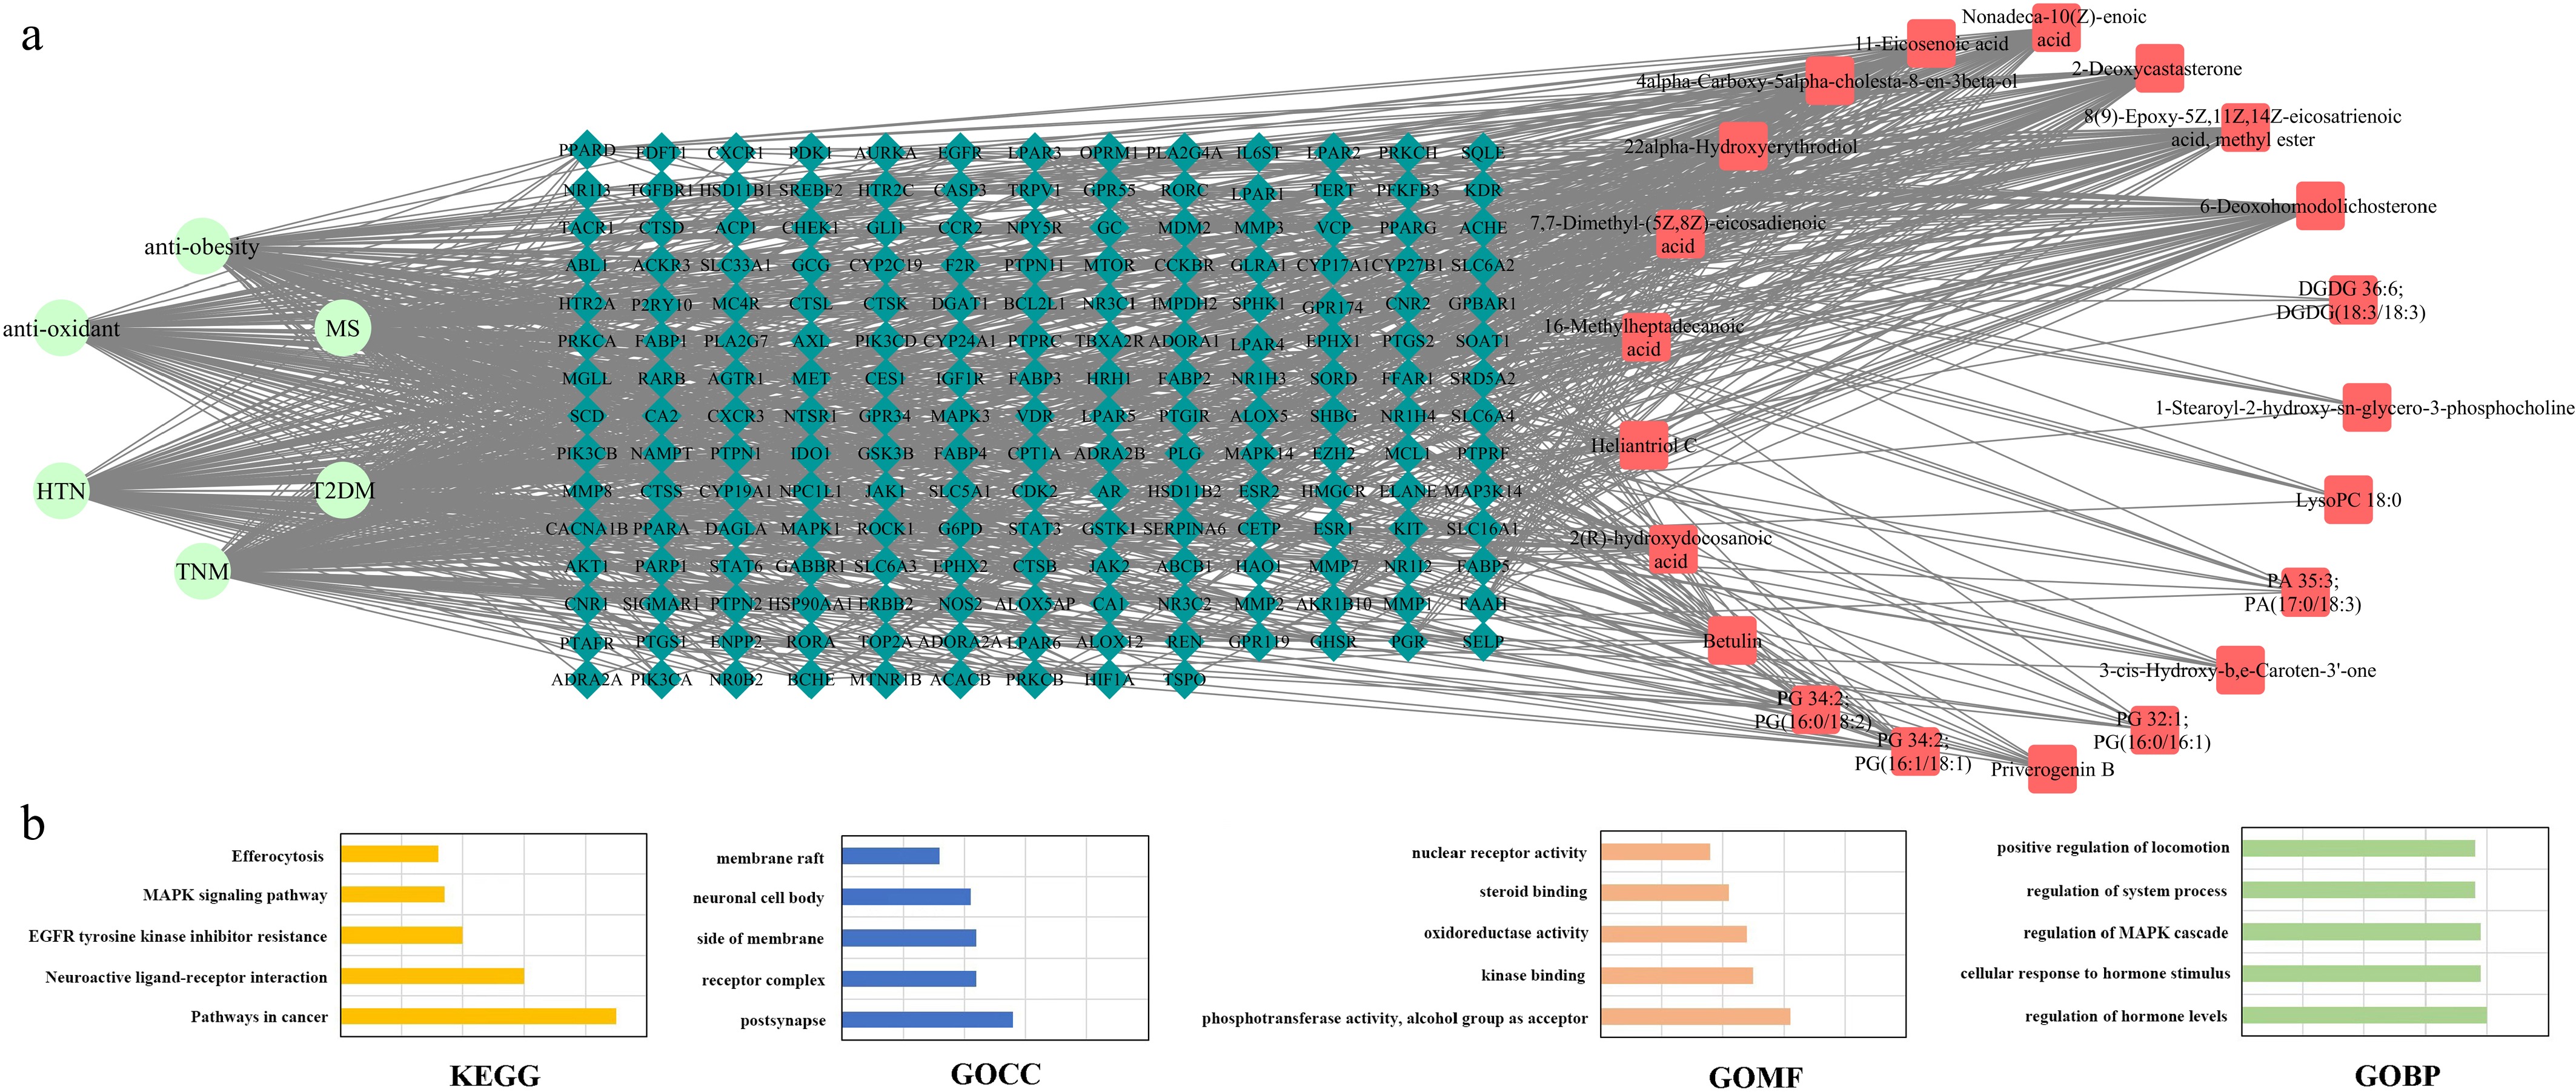
Figure 8.
Disease-target-metabolite analysis diagram. (a) Disease-target-metabolite pharmacology network. (The green nodes represent diseases, the red nodes represent metabolites, and the lake blue nodes represent target genes with common interaction associations. Node size represents the degree value). (b) The top five pathways of disease-target-metabolite enrichment. (From top to bottom: KEGG pathway enrichment, GOCC pathway enrichment, GOMF pathway enrichment, and GOBP pathway enrichment.
-
Metabolites Number 16-Methylheptadecanoic acid DM1 Nonadeca-10(Z)-enoic acid DM2 11-Eicosenoic acid DM3 7,7-Dimethyl-(5Z,8Z)-eicosadienoic acid DM4 2(R)-hydroxydocosanoic acid DM5 4alpha-Carboxy-5alpha-cholesta-8-en-3beta-ol DM6 Heliantriol C DM7 Priverogenin B DM8 22alpha-Hydroxyerythrodiol DM9 LysoPC 18:0 DM10 PA 35:3; PA (17:0/18:3) DM11 PG 32:1; PG (16:0/16:1) DM12 PG 34:2; PG (16:0/18:2) DM13 PG 34:2; PG (16:1/18:1) DM14 8(9)-Epoxy-5Z,11Z,14Z-eicosatrienoic acid, methyl ester DM15 Betulin DM16 2-Deoxycastasterone DM17 6-Deoxohomodolichosterone DM18 1-Stearoyl-2-hydroxy-sn-glycero-3-phosphocholine DM19 3-cis-Hydroxy-b, e-Caroten-3'-one DM20 PE (22:4(7Z,10Z,13Z,16Z)/20:5(5Z,8Z,11Z,14Z,17Z)) DM21 DGDG 36:6; DGDG (18:3/18:3) DM22 Table 1.
The 22 upregulated metabolites and number matching table (DM1–DM22).
Figures
(8)
Tables
(1)