-
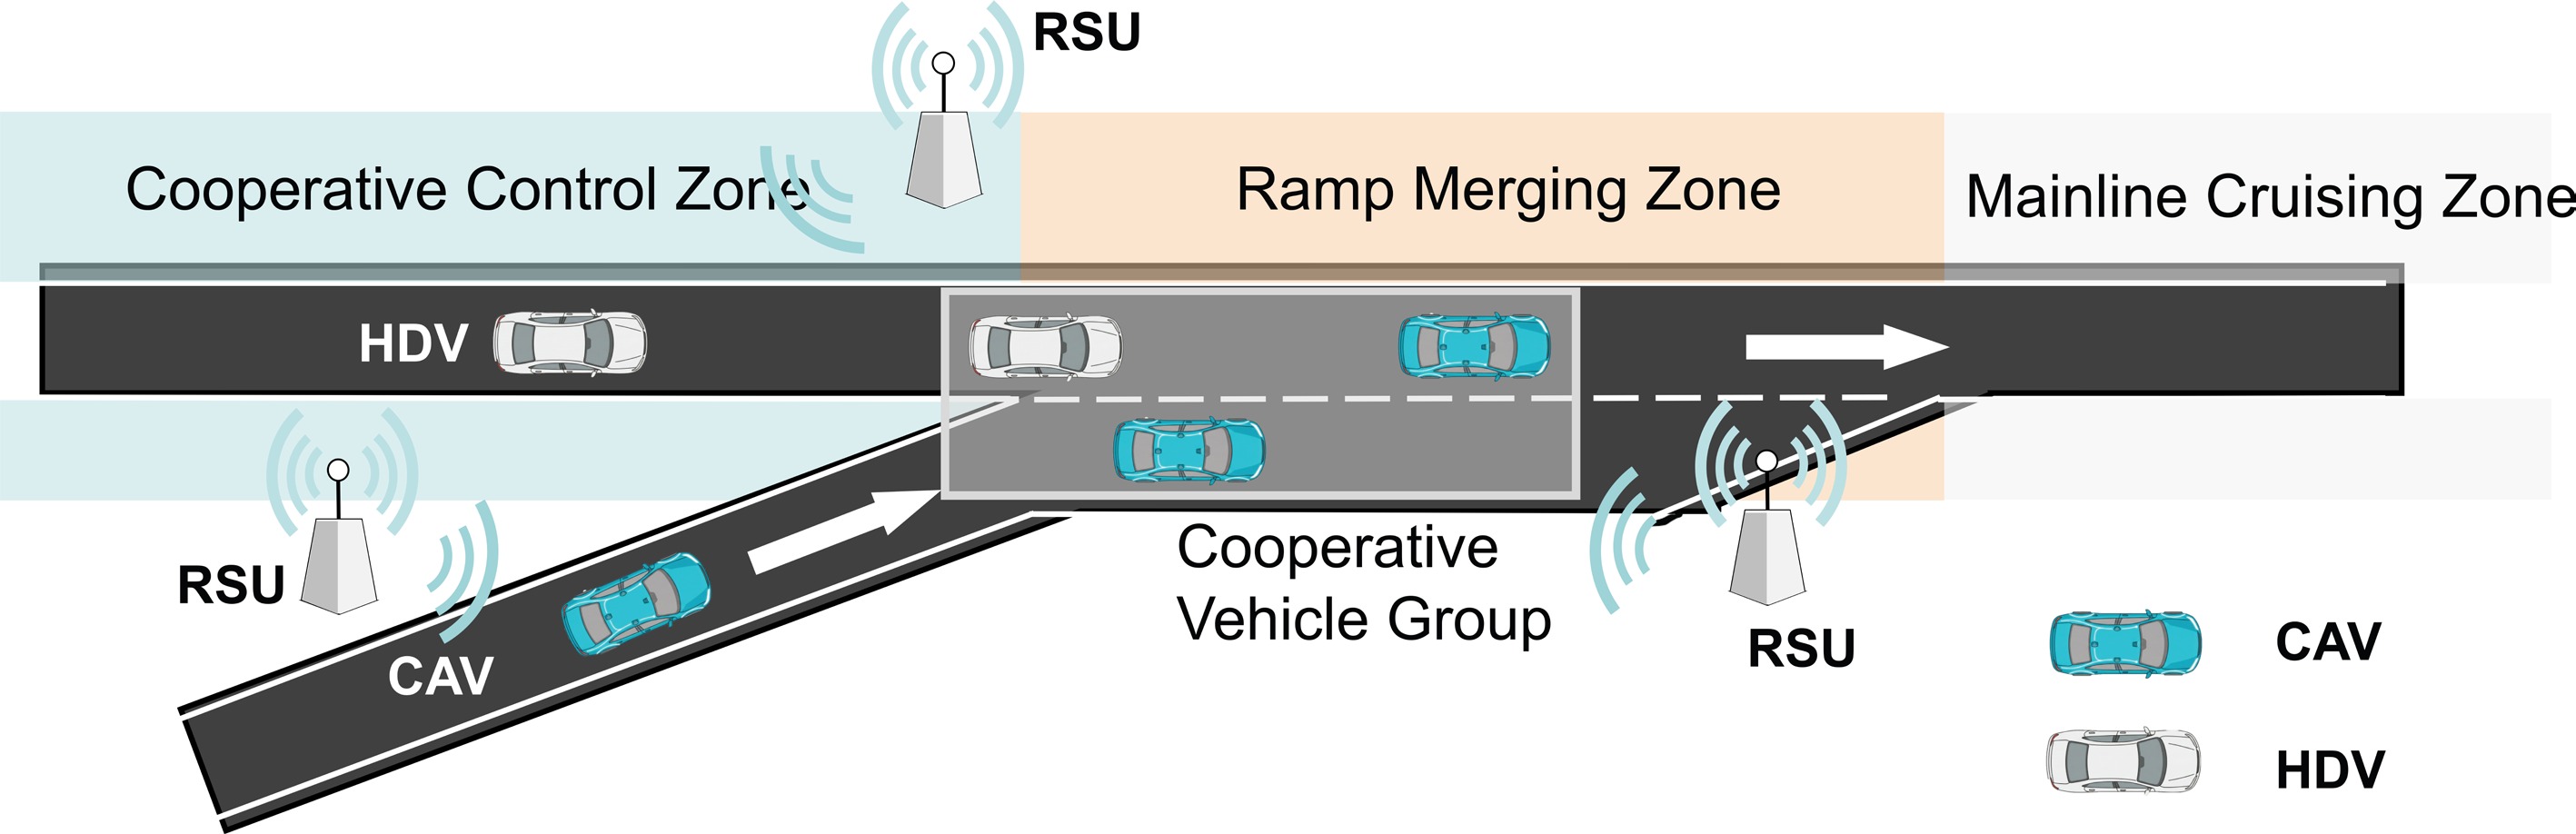
Figure 1.
Freeway on-ramp merging in a mixed traffic environment.
-
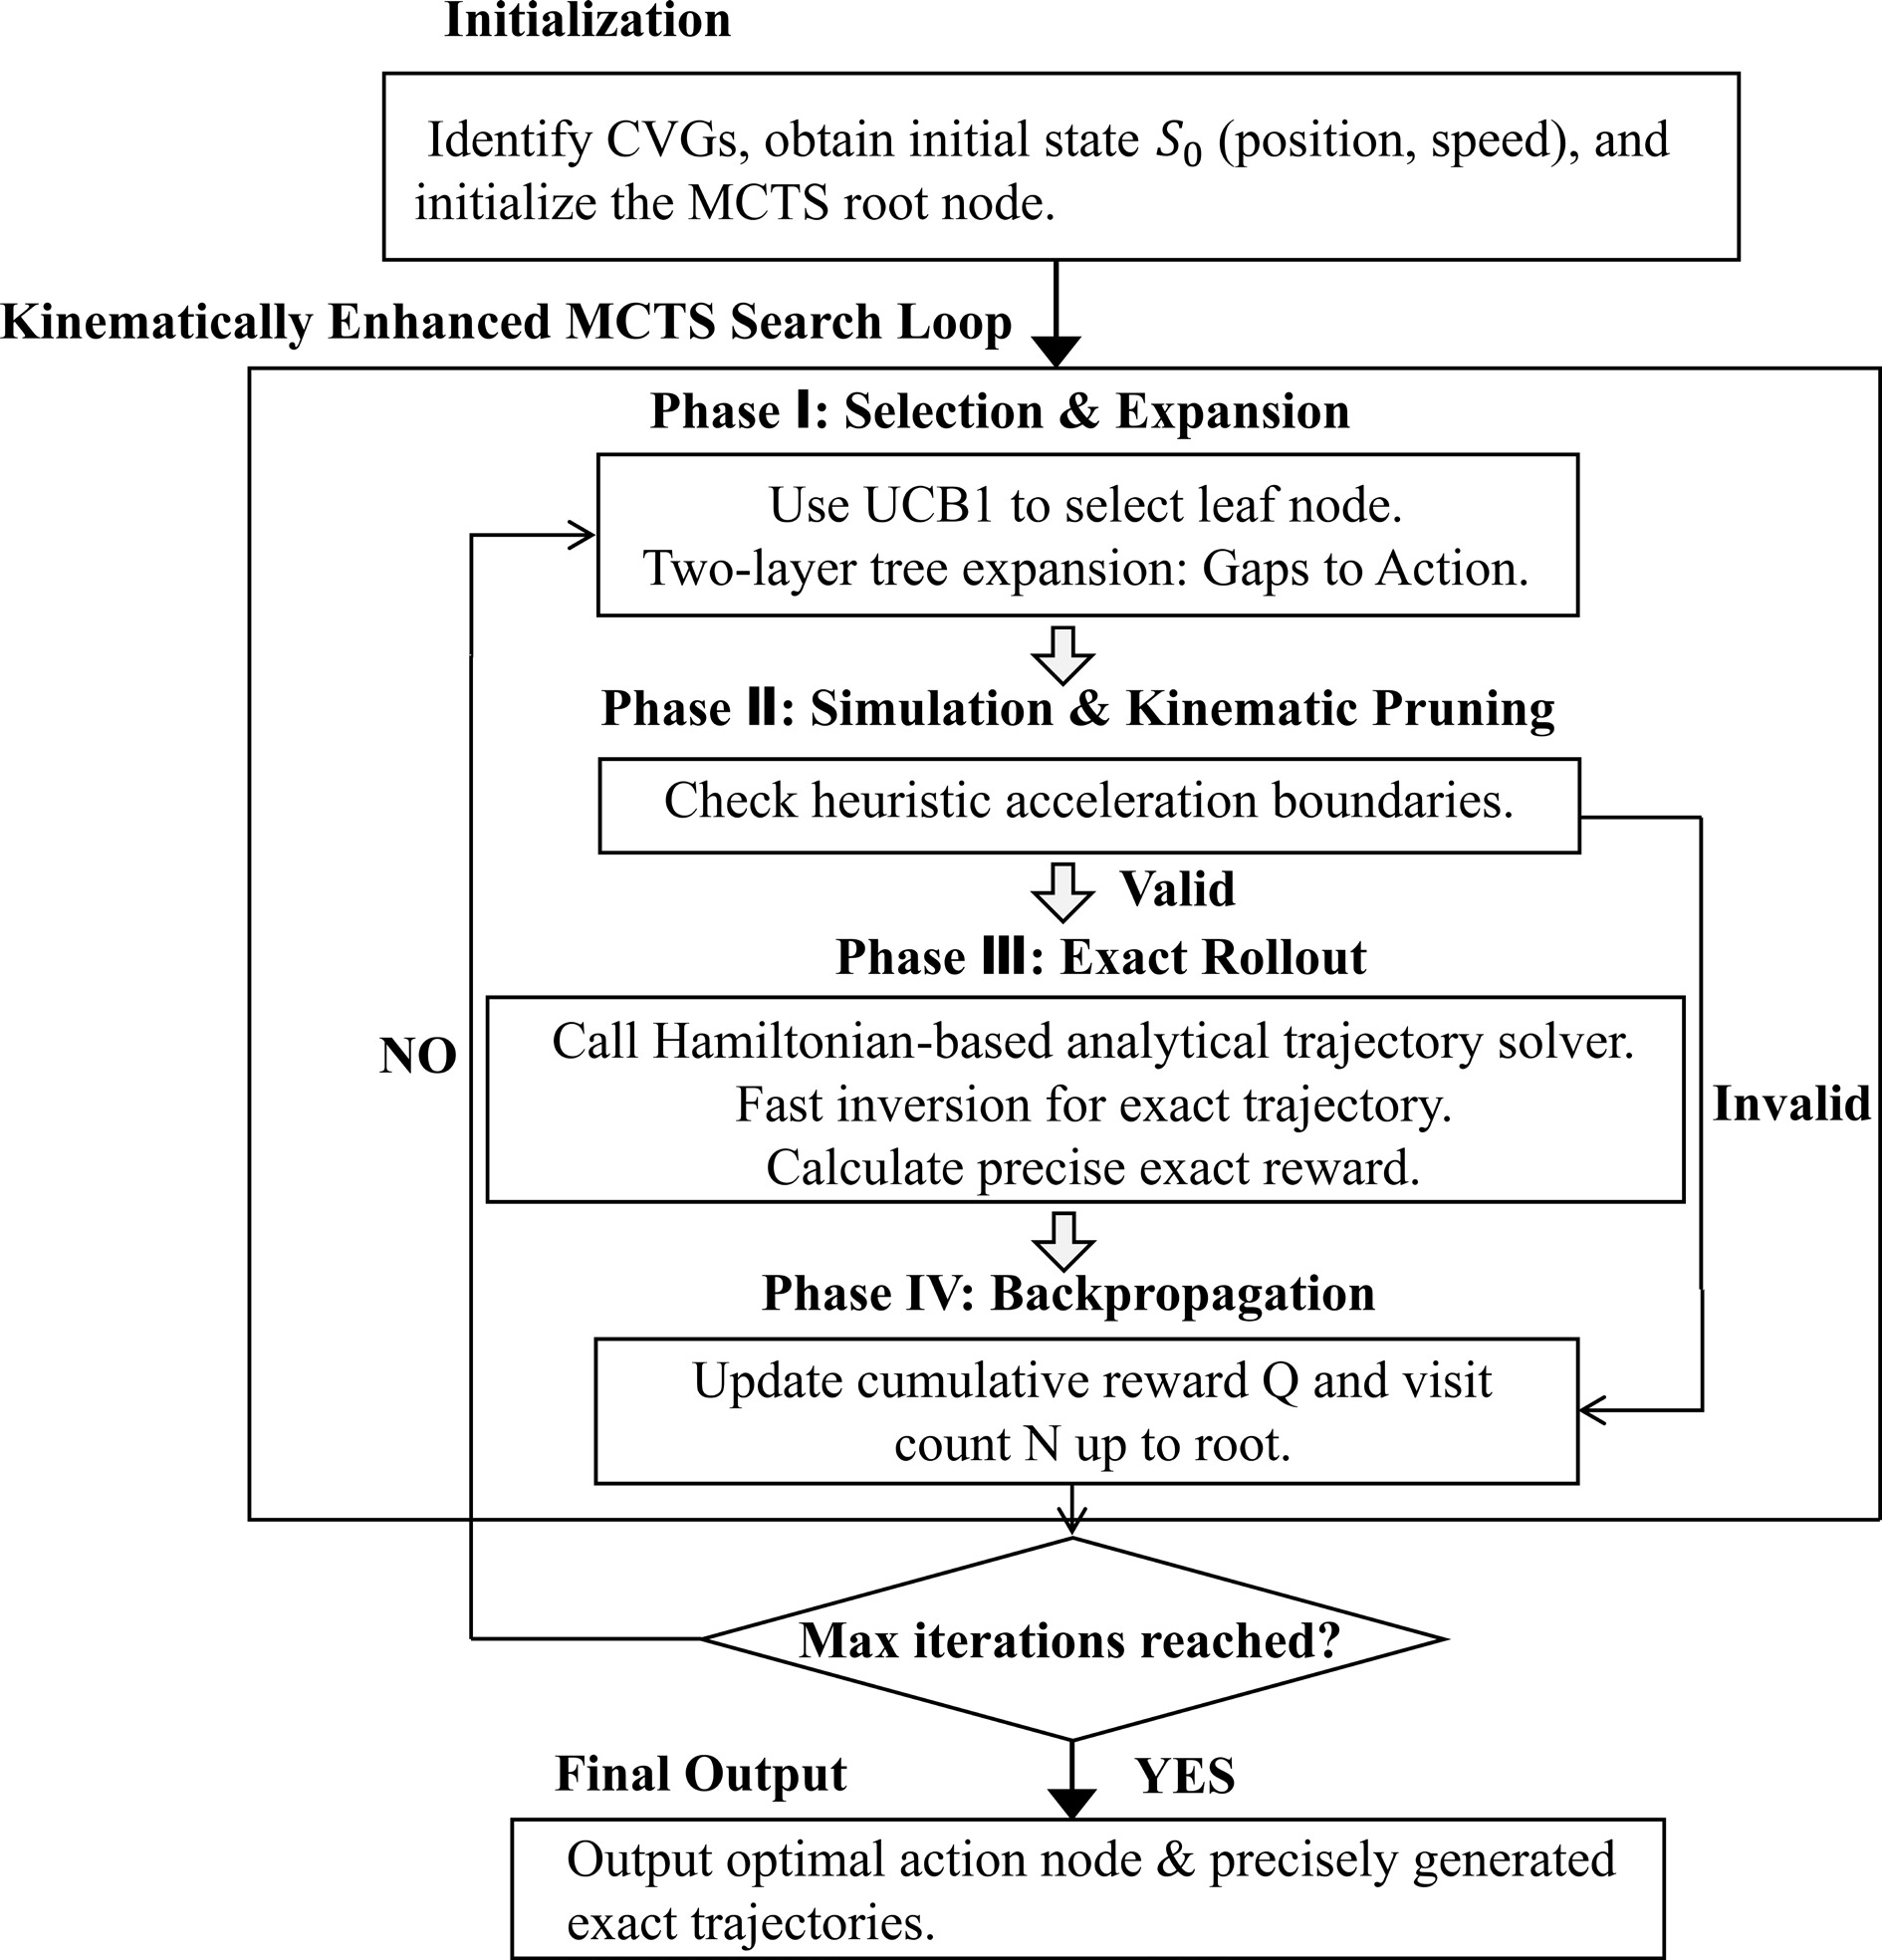
Figure 2.
Flowchart of the kinematically enhanced MCTS algorithm.
-
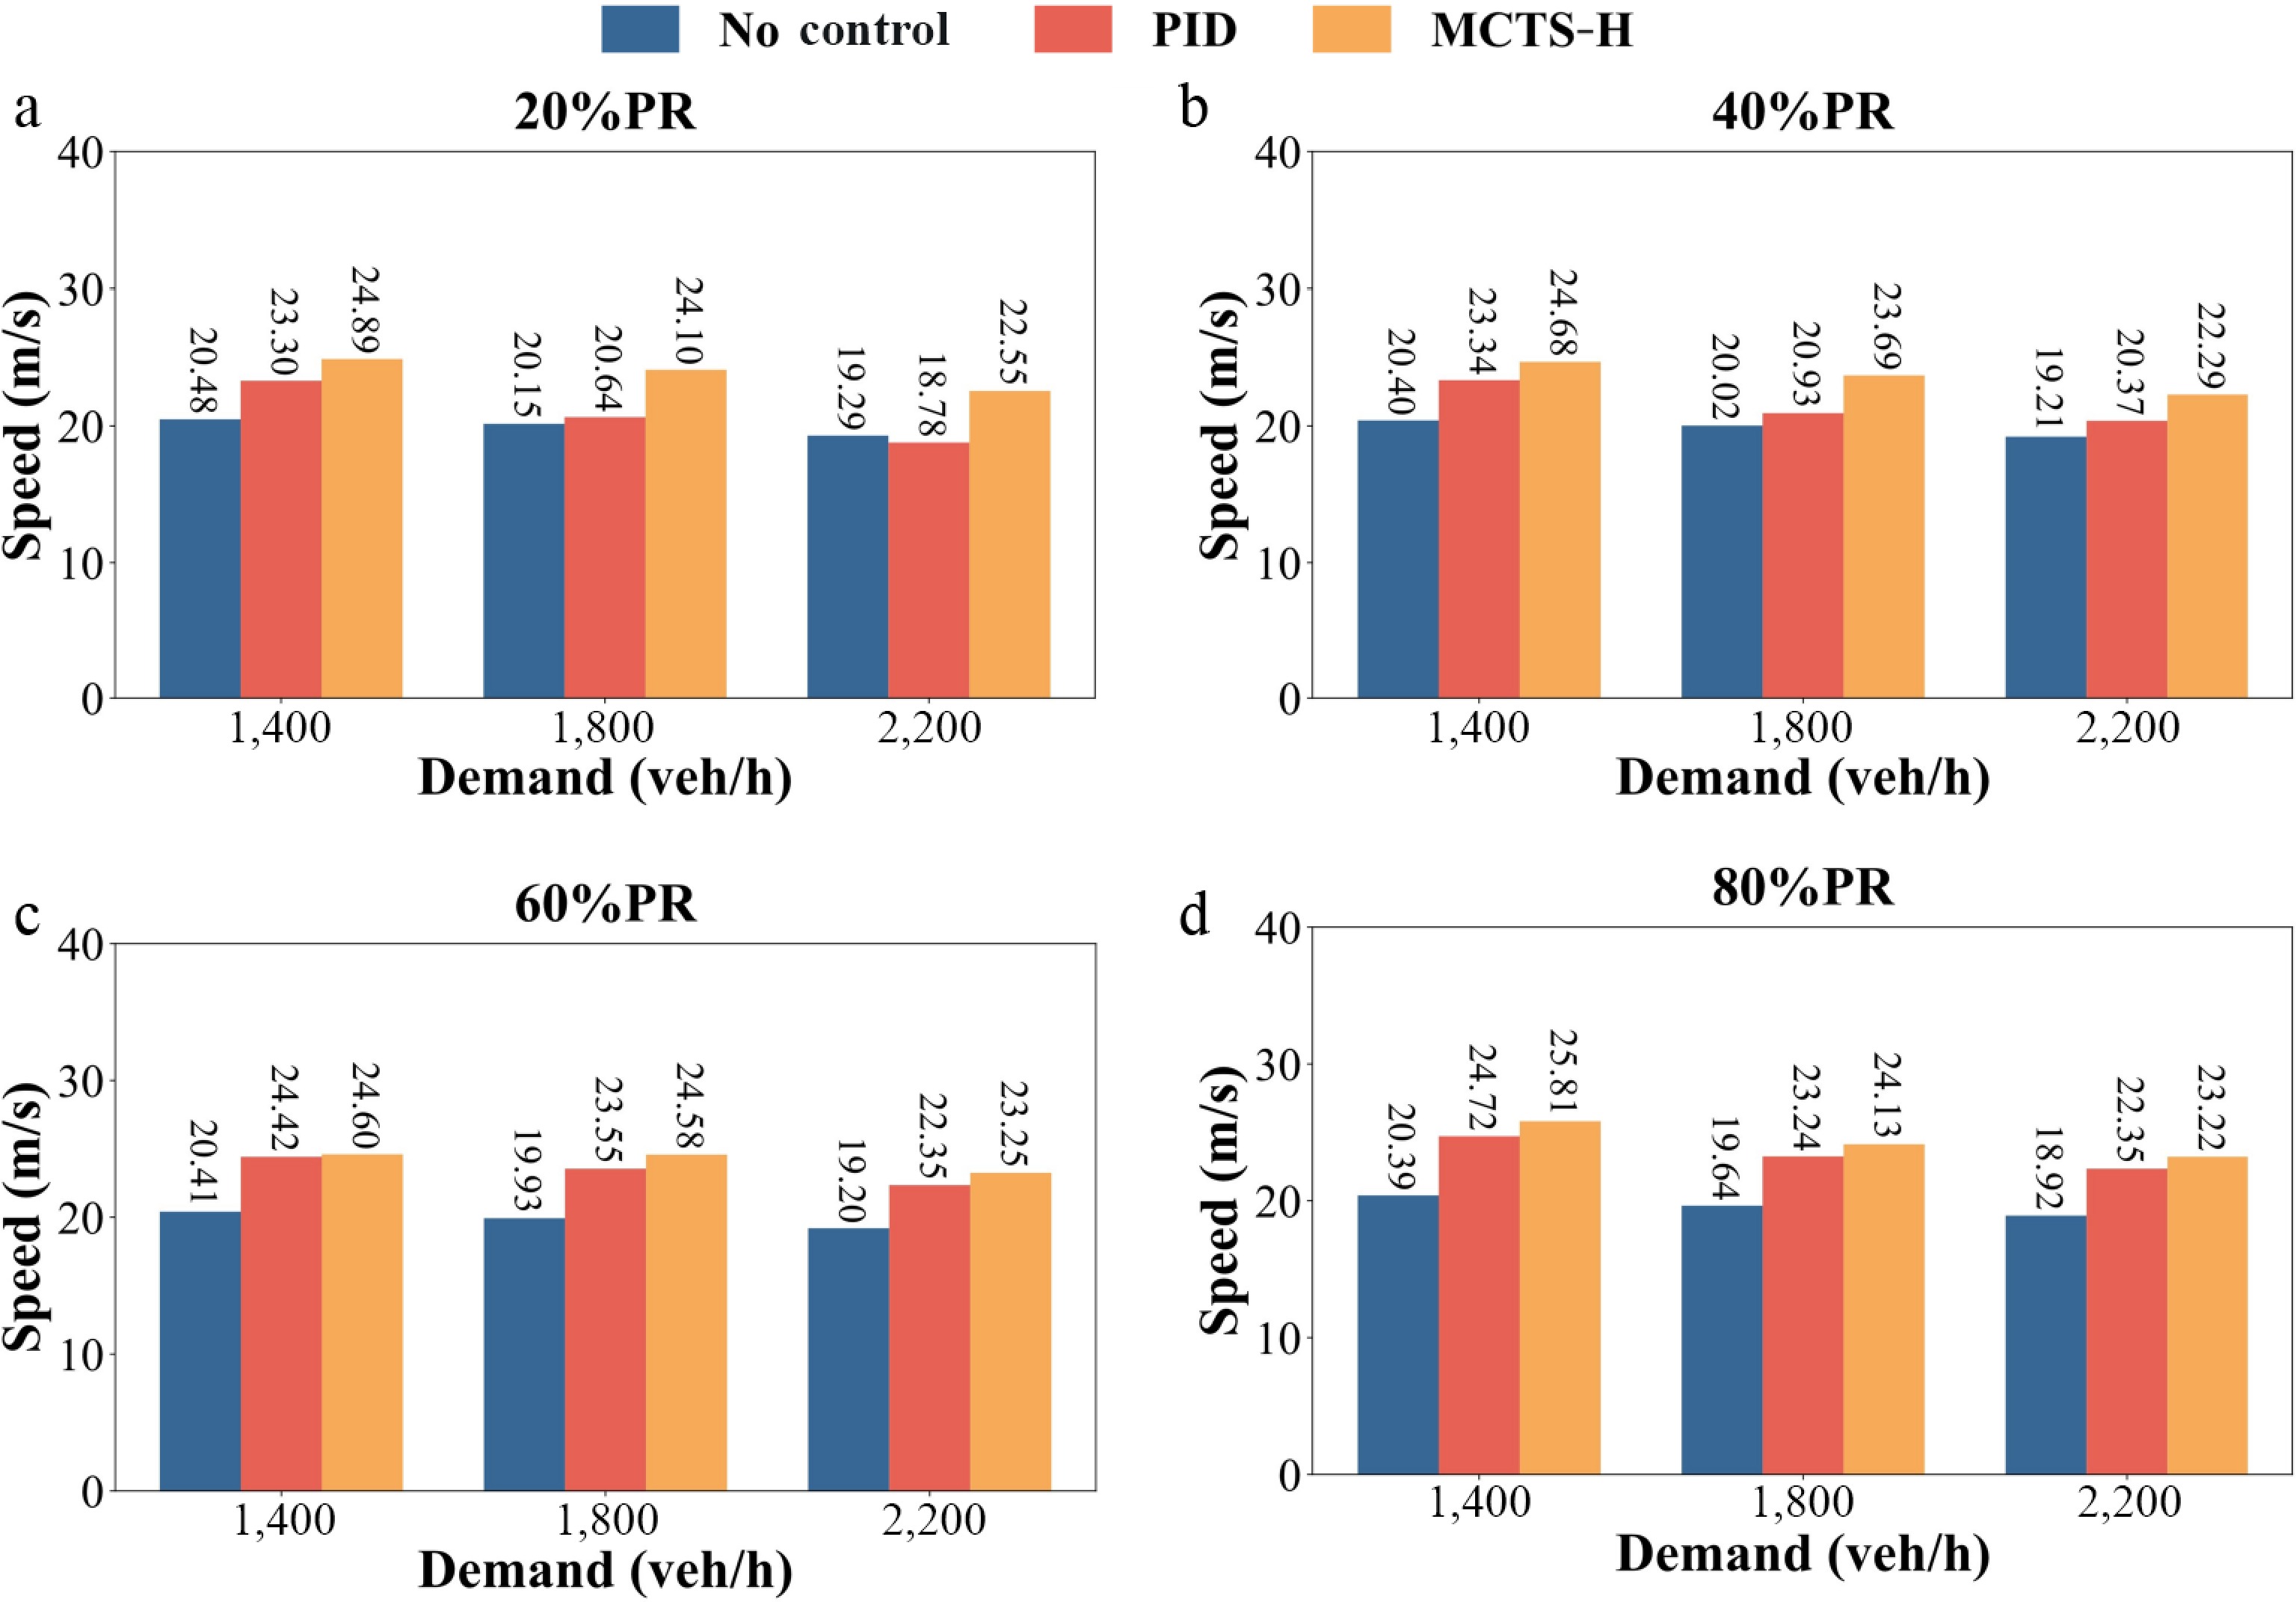
Figure 3.
Comparison of average vehicle speeds across varying traffic demands; (a) results at 20% PR; (b) results at 40% PR; (c) results at 60% PR; (d) results at 80% PR.
-
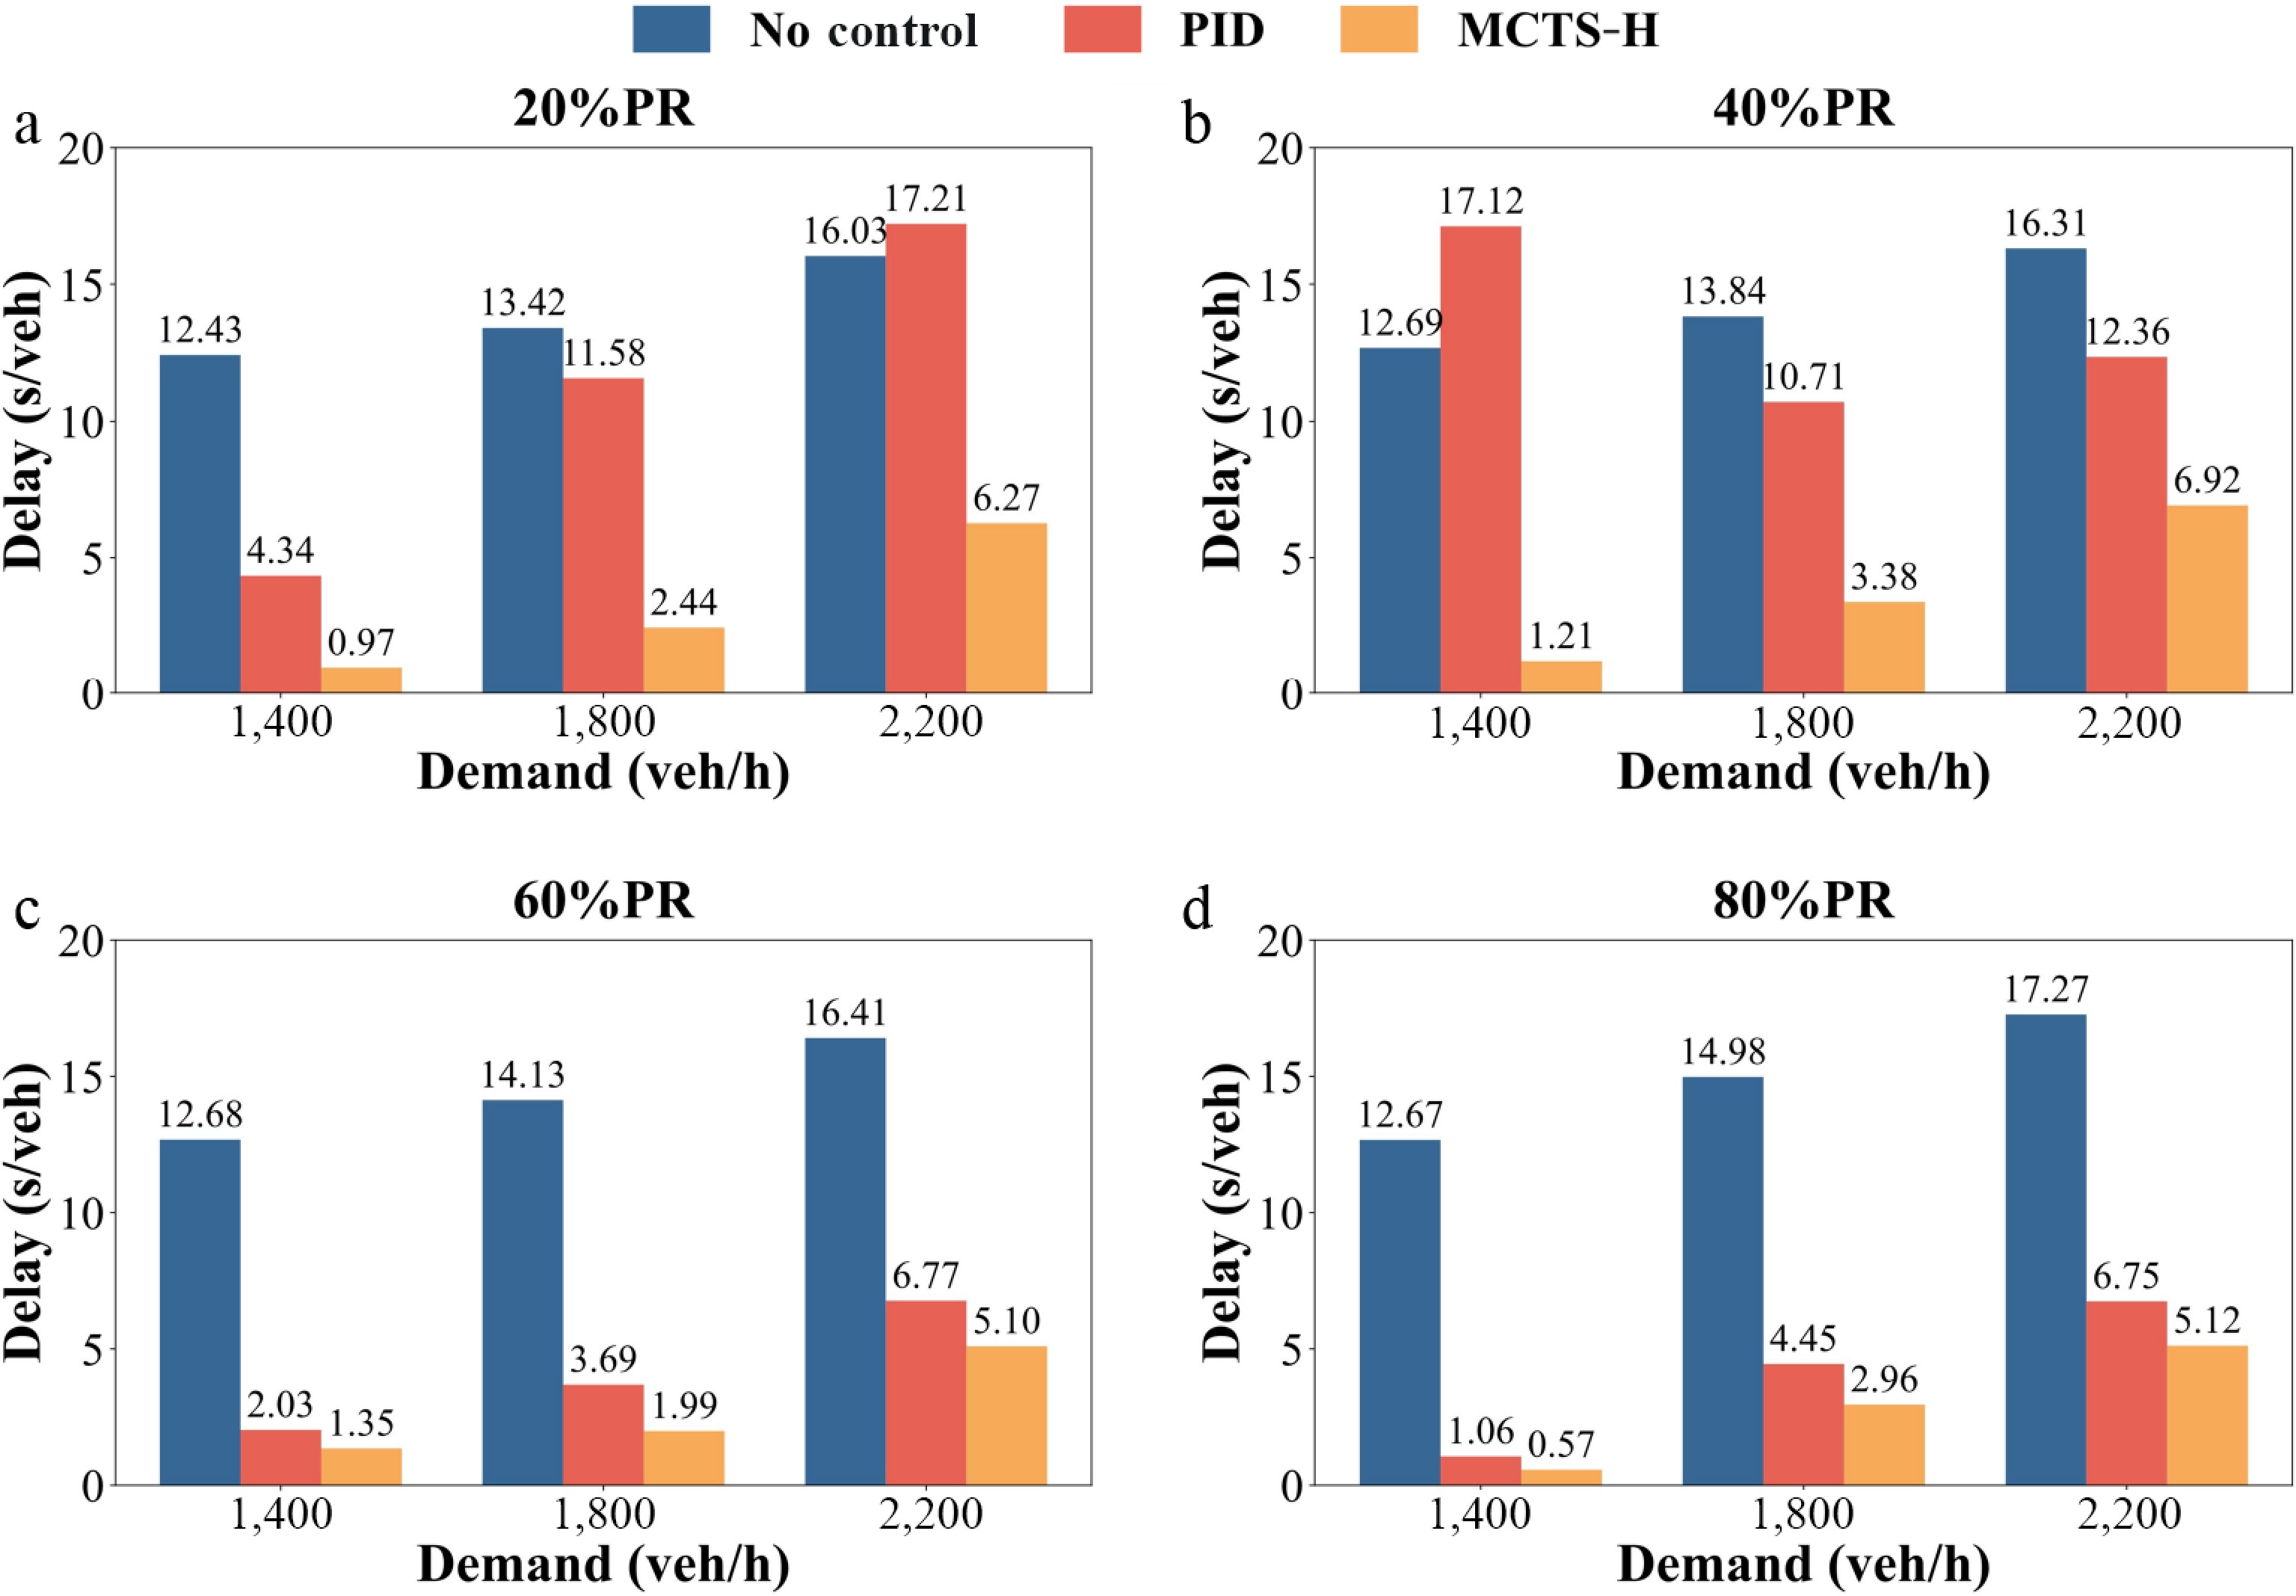
Figure 4.
Average vehicle delay performance under varying traffic demands; (a) results at 20% PR; (b) results at 40% PR; (c) results at 60% PR; (d) results at 80% PR.
-
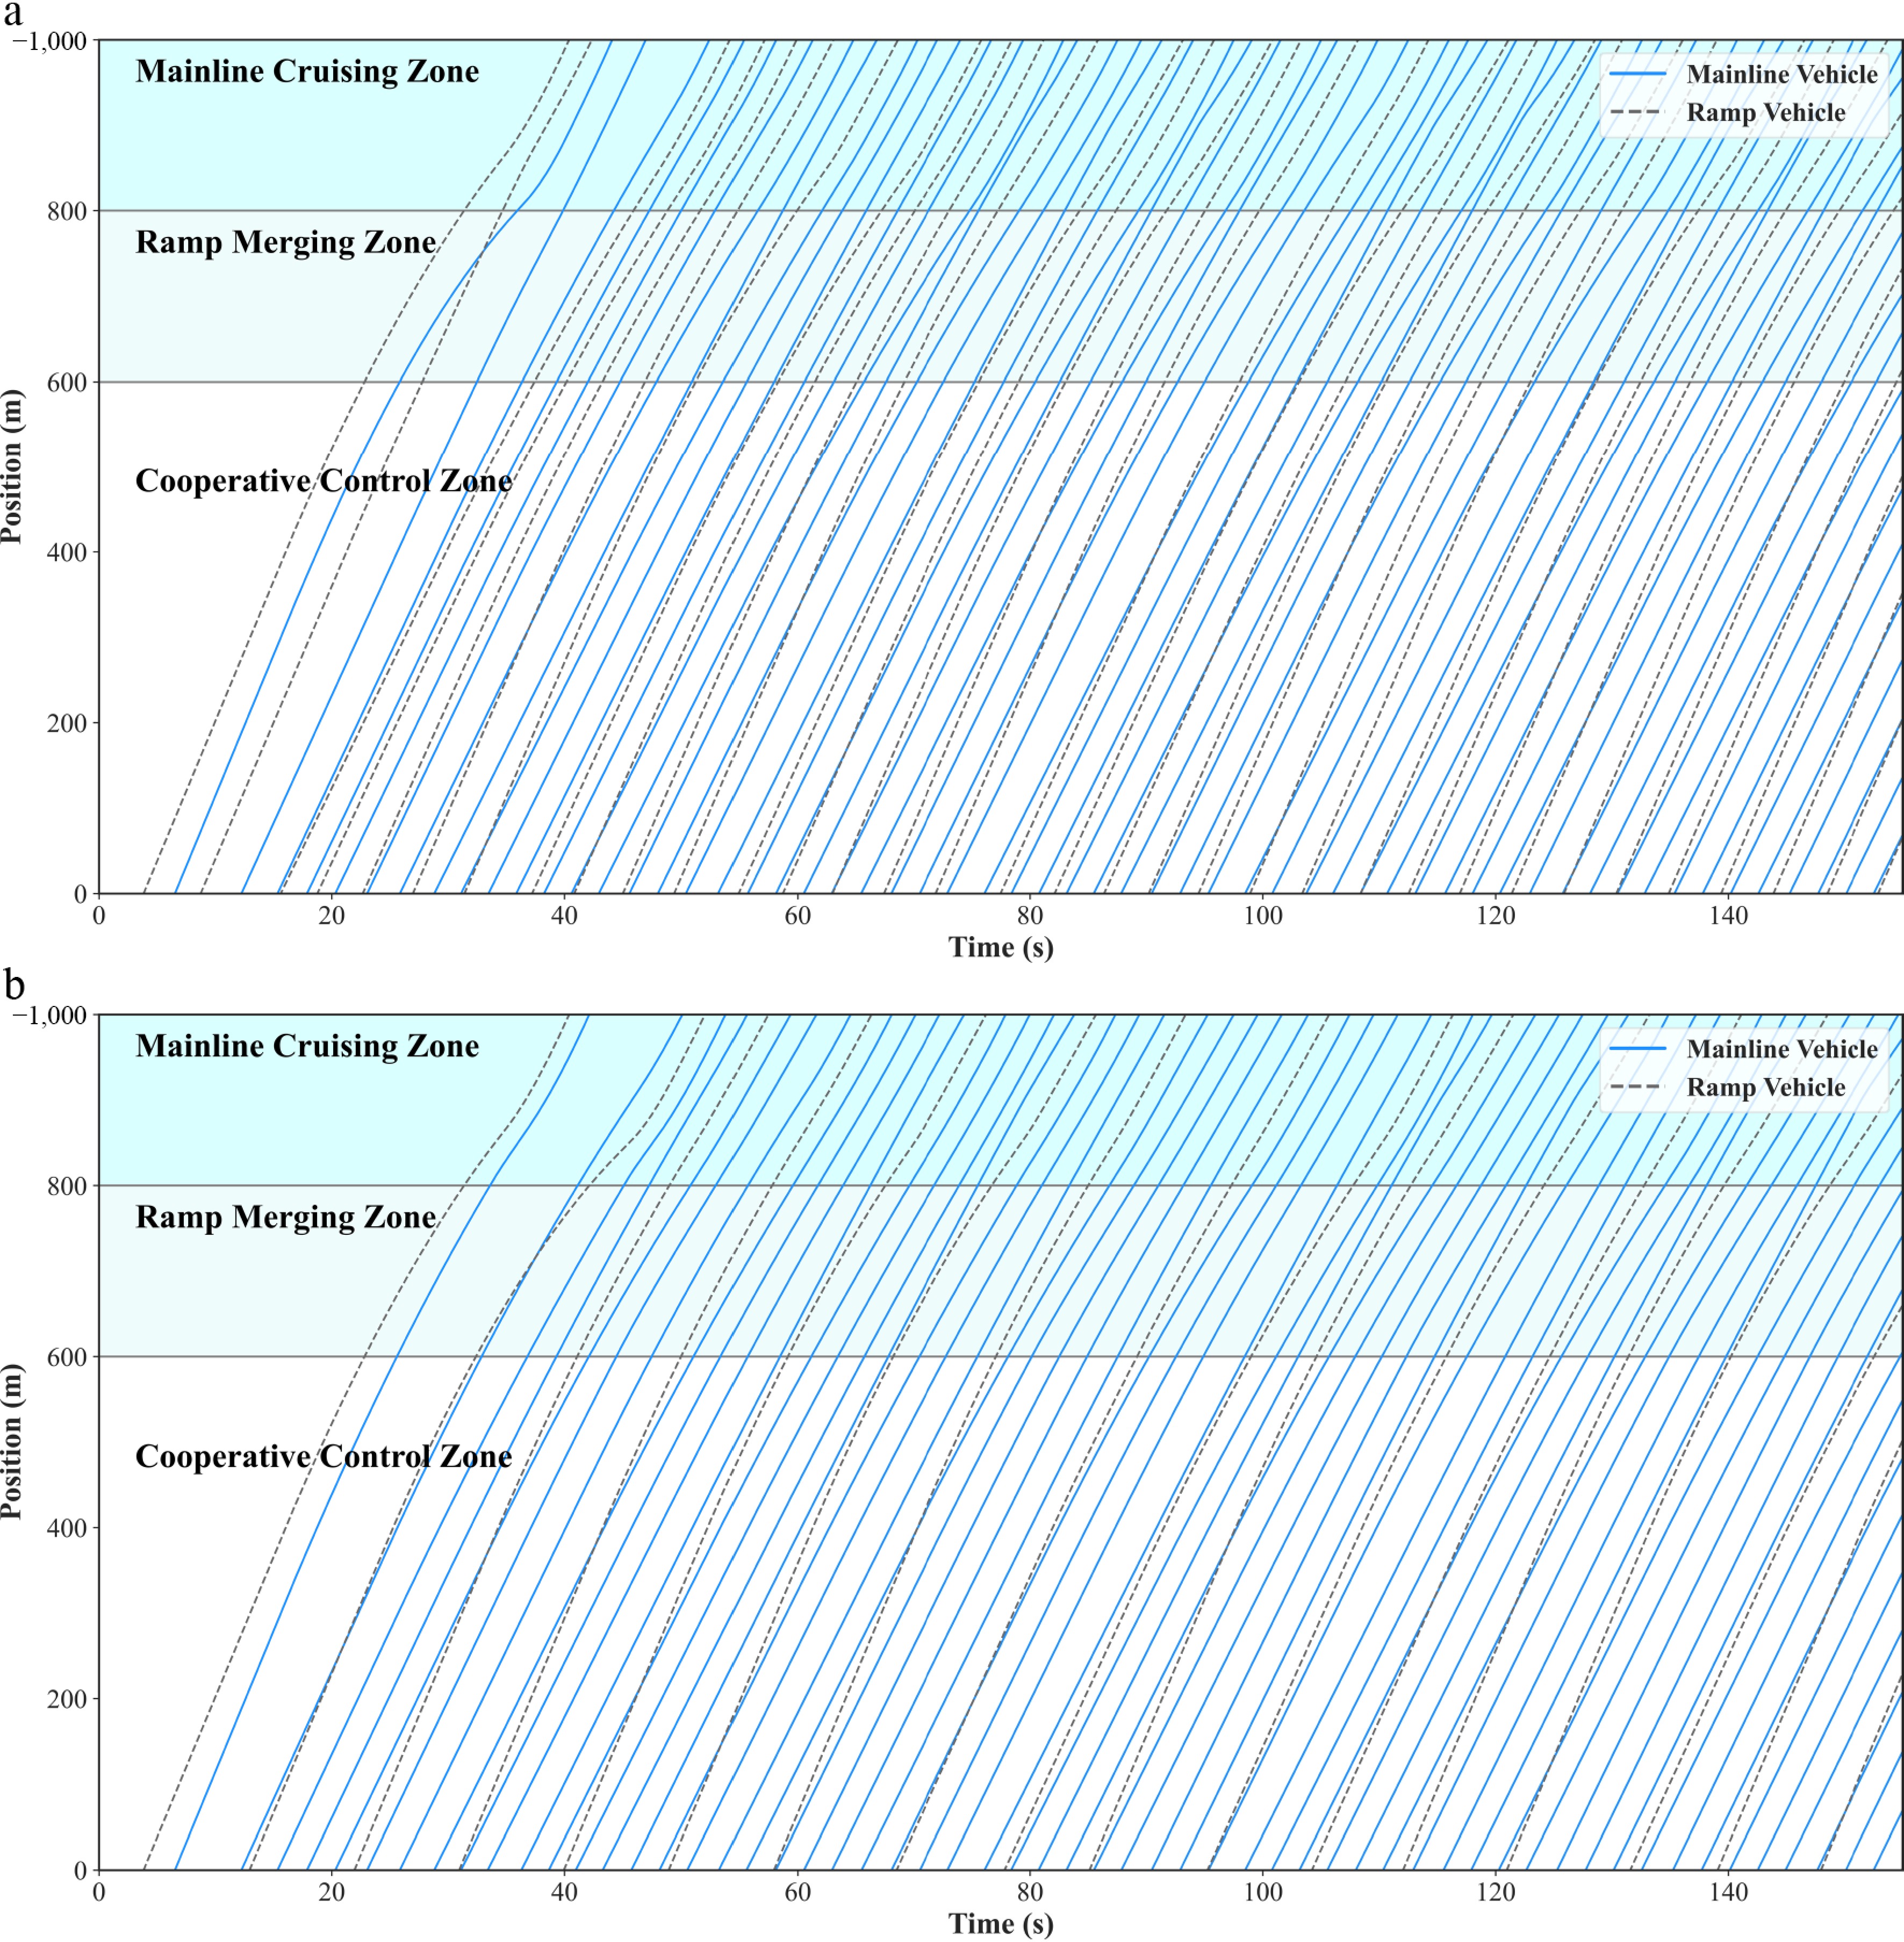
Figure 5.
Spatiotemporal trajectory diagram of vehicles in the on-ramp merging area under the MCTS-H cooperative control method. (a) Low traffic demand scenario. (b) High traffic demand scenario.
-
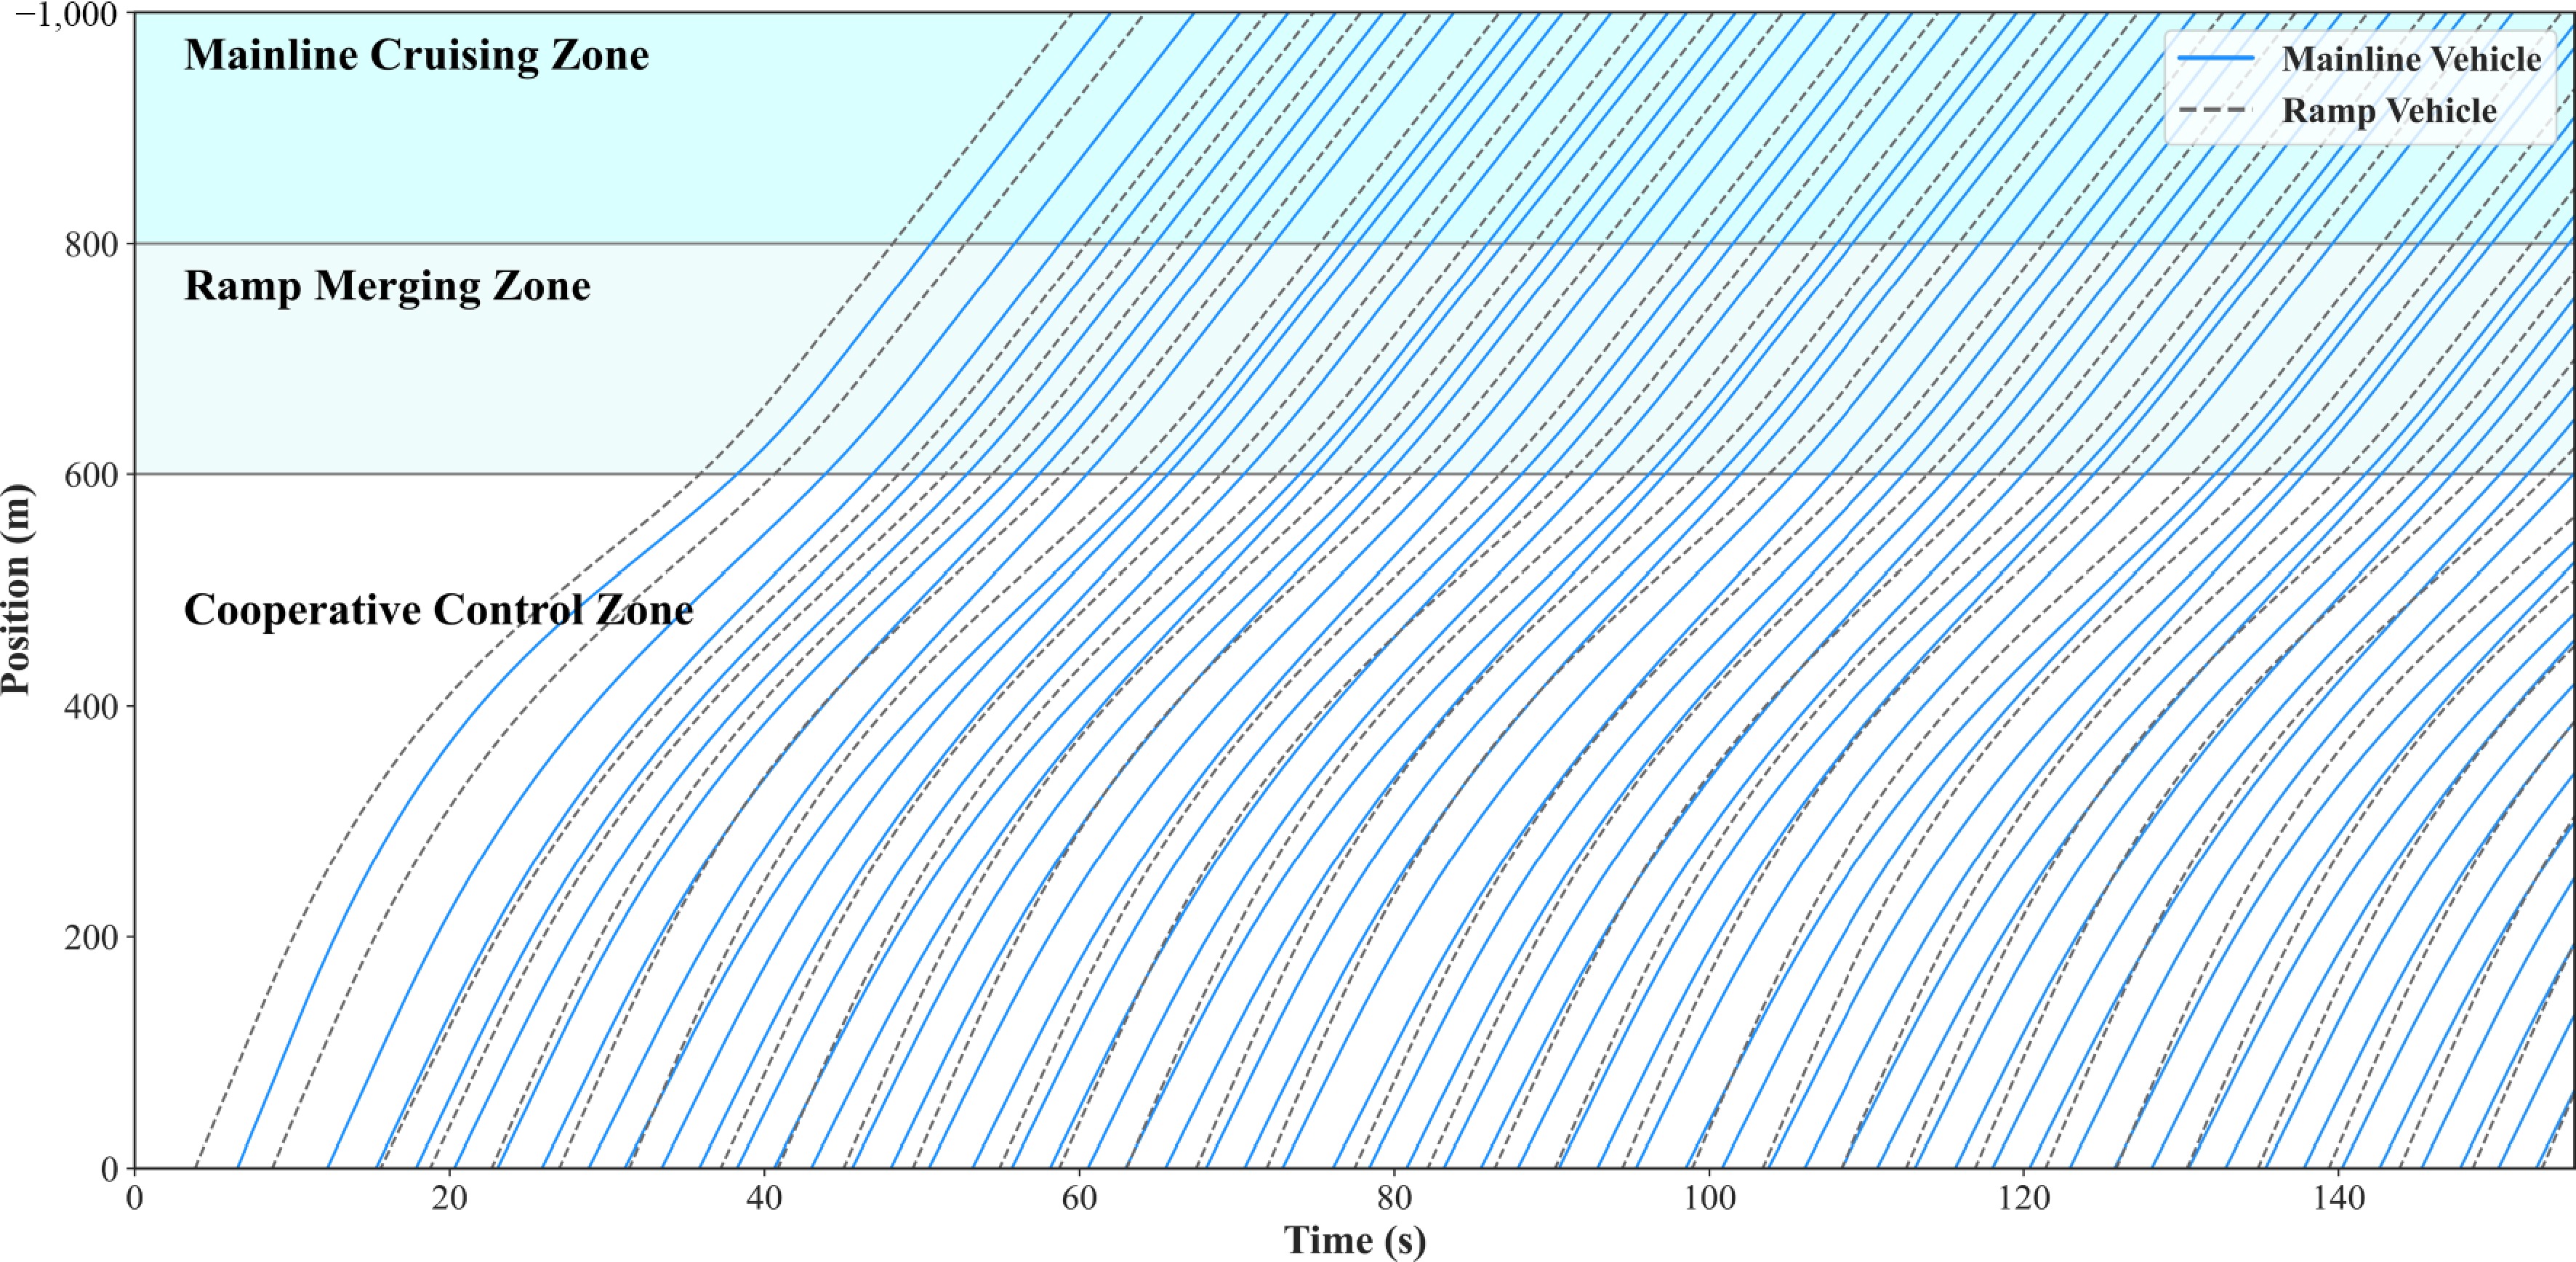
Figure 6.
Spatiotemporal trajectory diagram of vehicles in the on-ramp merging area under the PID method.
-
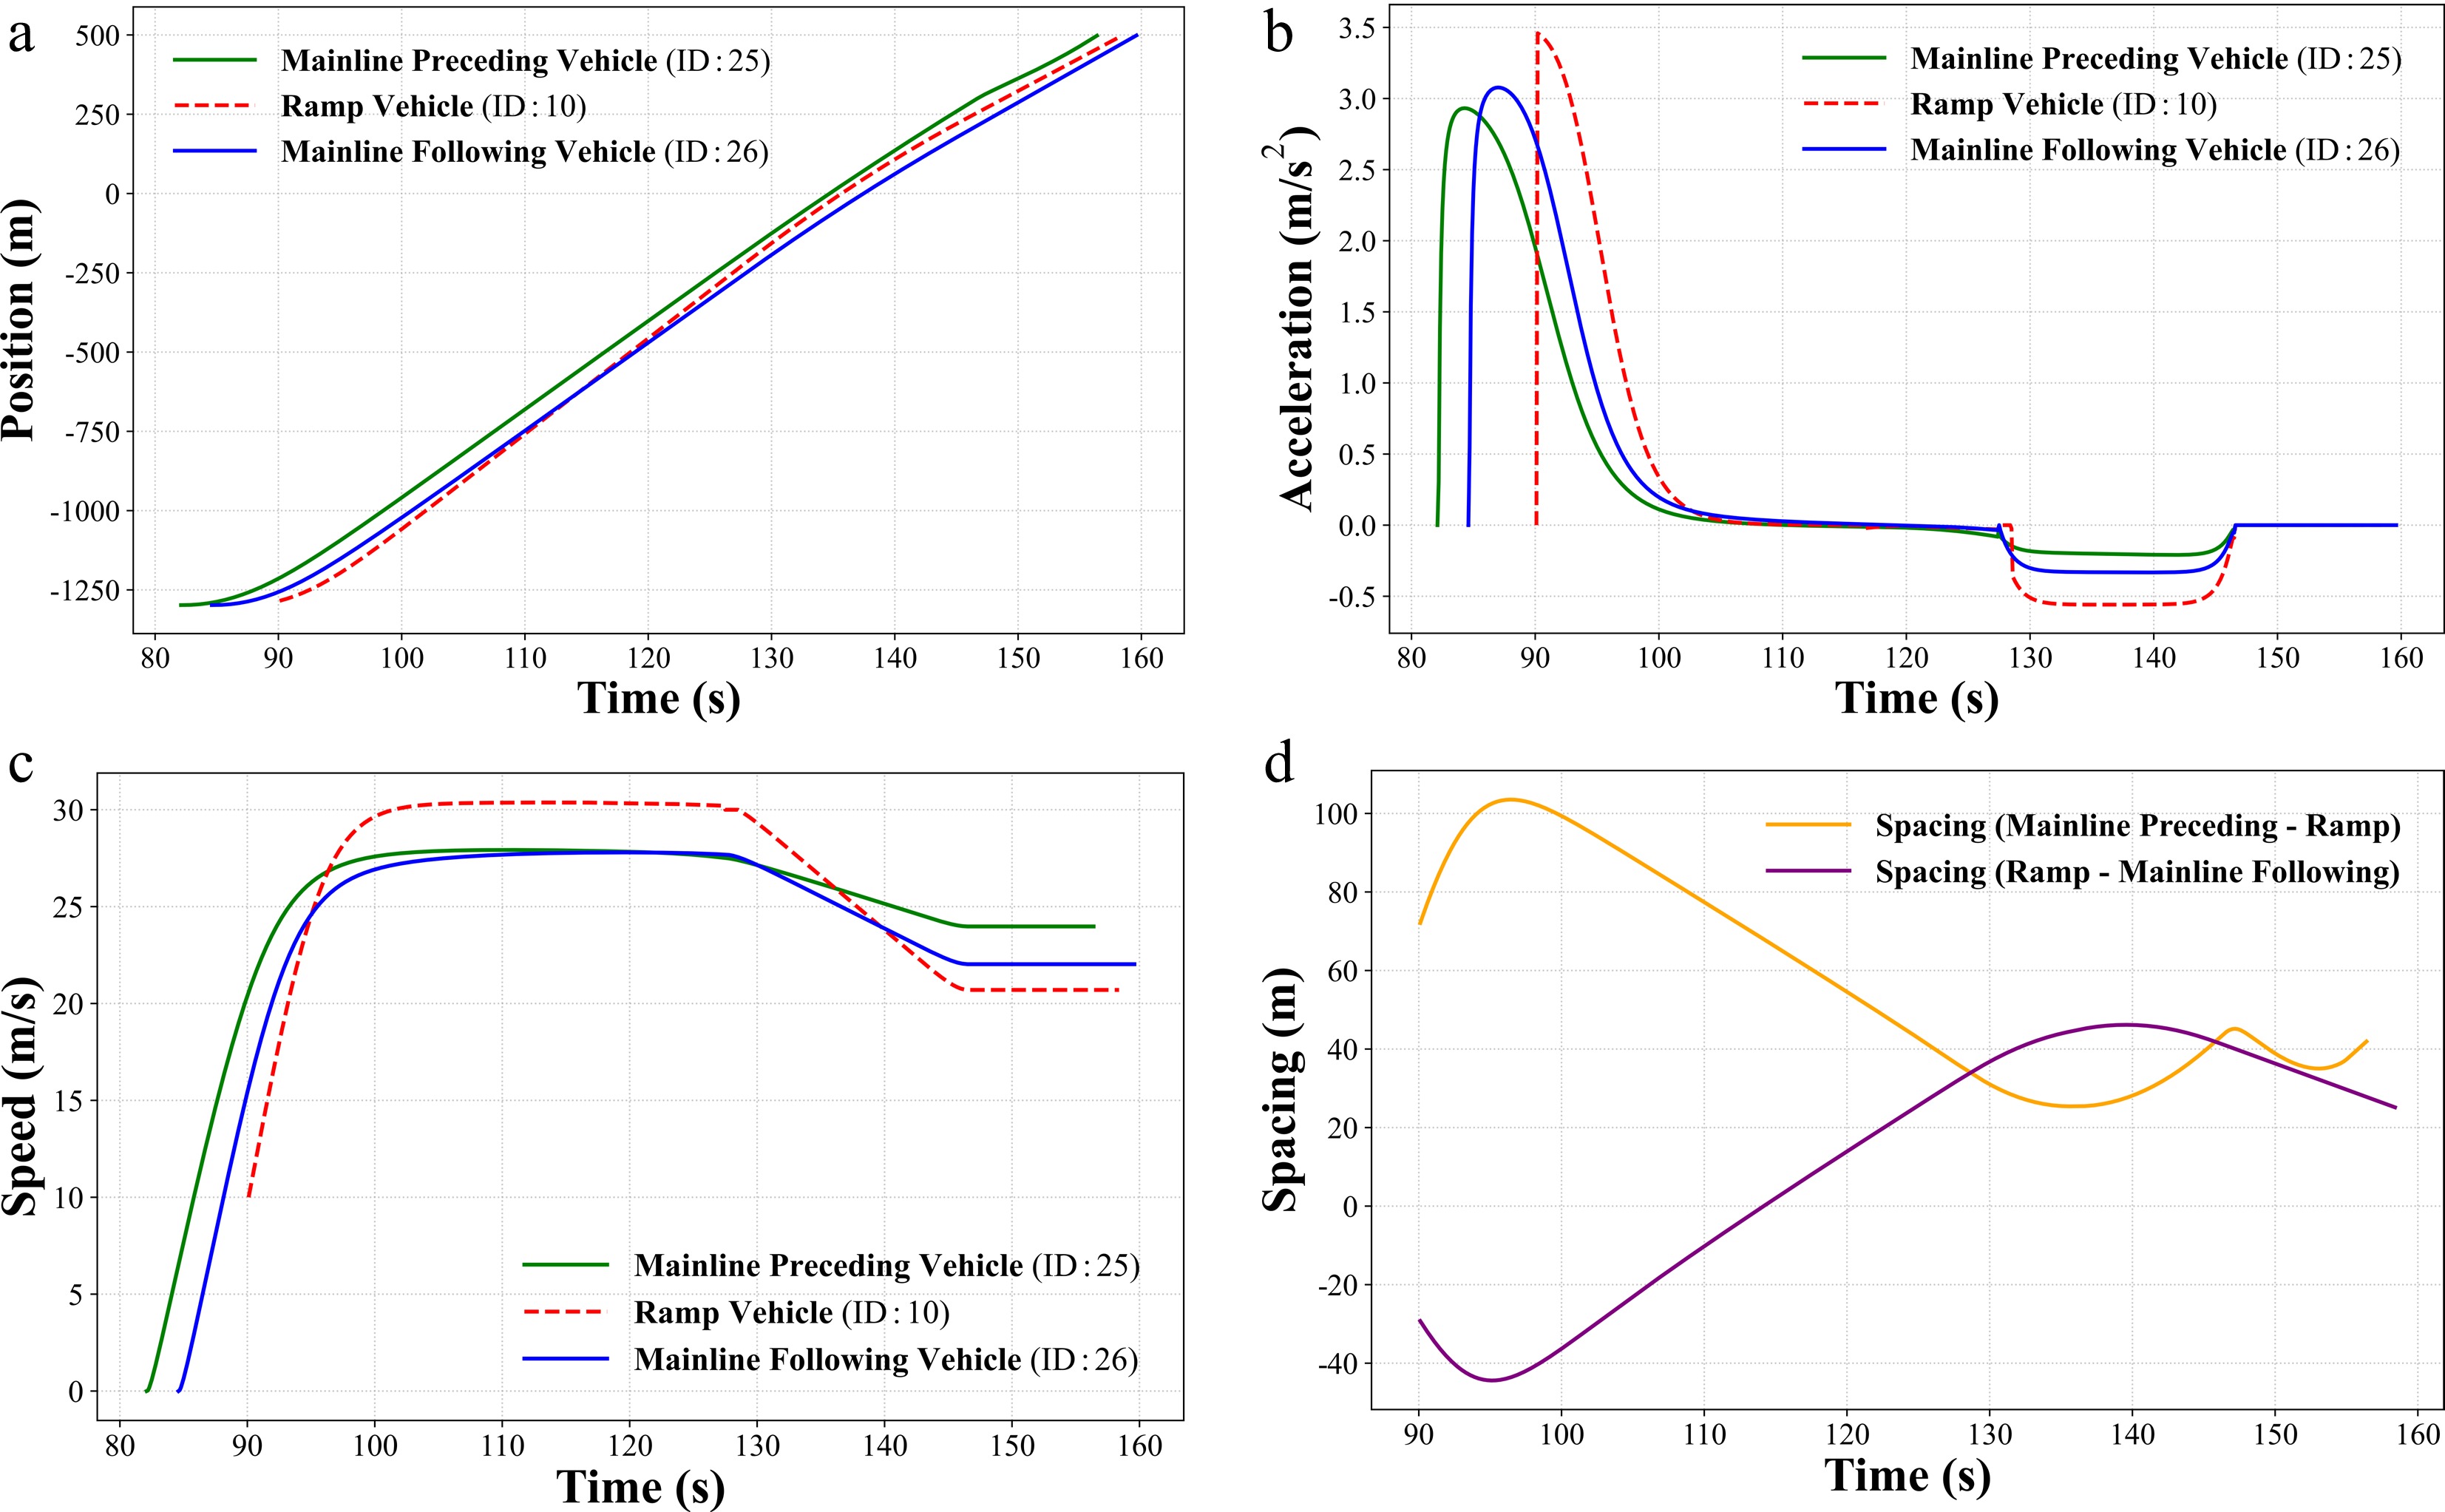
Figure 7.
Cooperative trajectories and dynamic characteristics analysis of three vehicle groups under the MCTS-H cooperative control method; (a) longitudinal position trajectories; (b) acceleration profiles; (c) speed profiles; (d) evolution of inter-vehicle spacing.
-
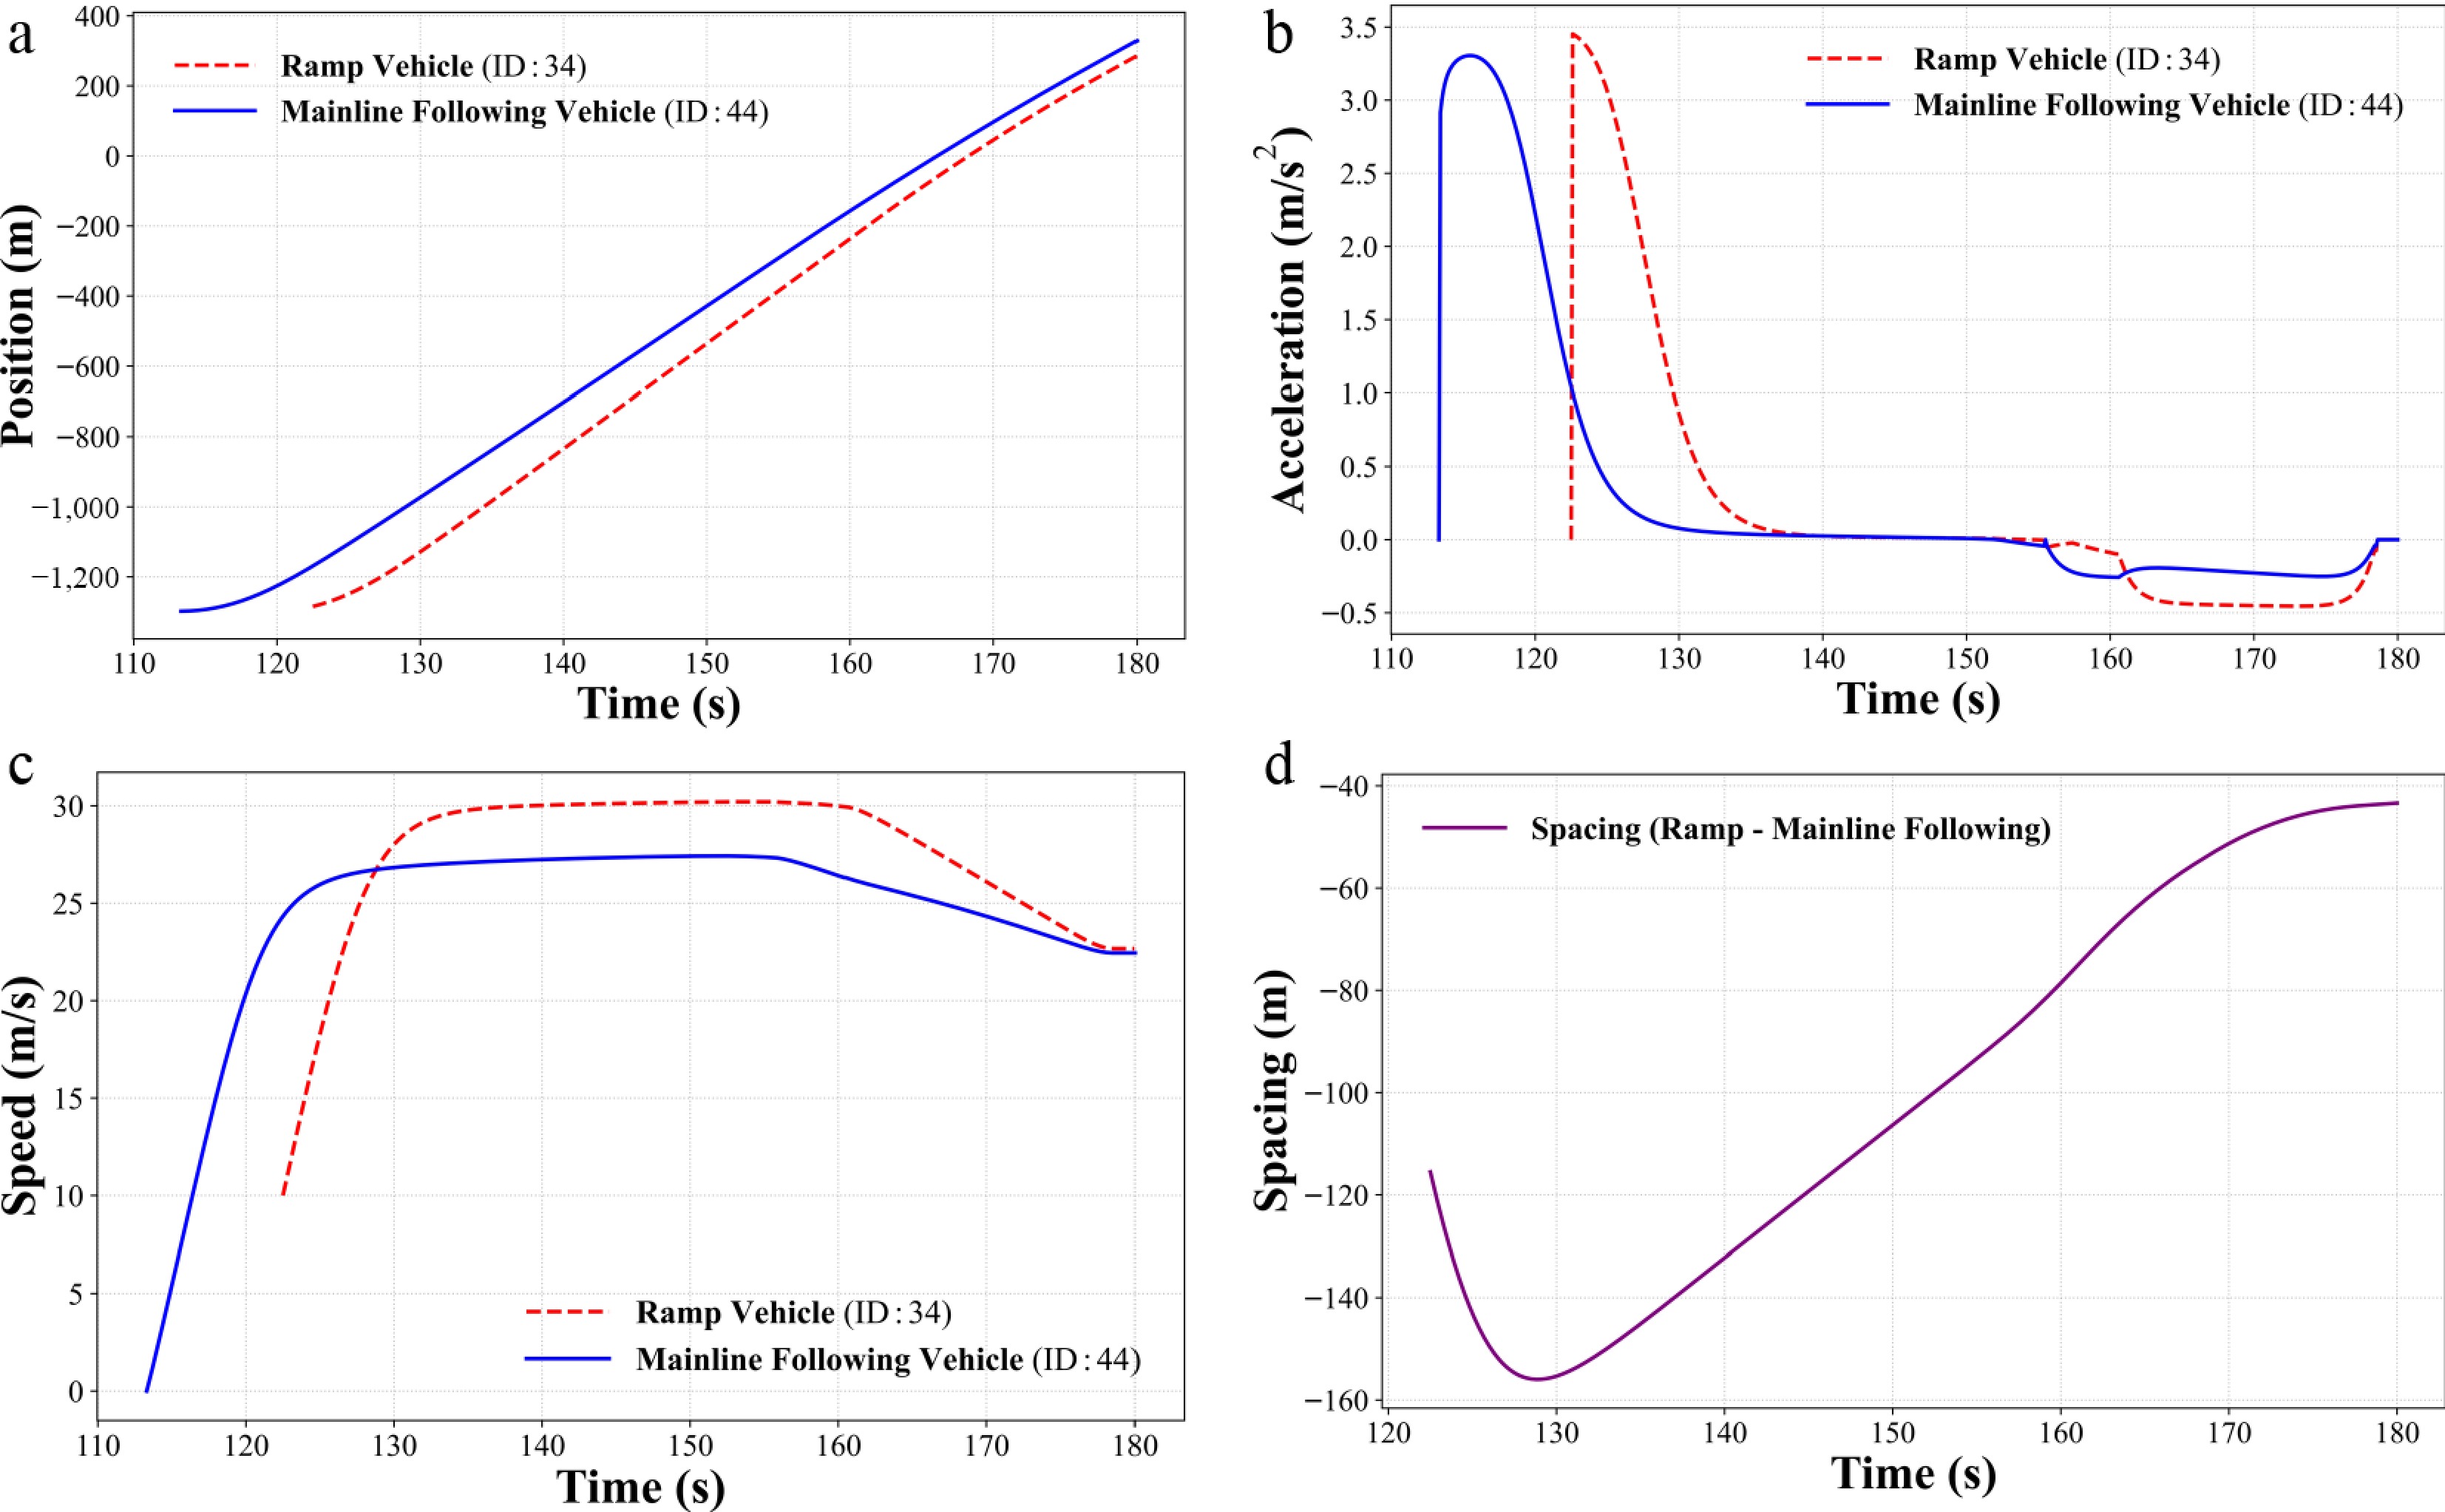
Figure 8.
Cooperative trajectories and dynamic characteristics analysis of two vehicle groups under the MCTS-H cooperative control method; (a) longitudinal position trajectories; (b) acceleration profiles; (c) speed profiles; (d) evolution of inter-vehicle spacing.
-
Notation Description i Index of the on-ramp vehicle k Index of the candidate gap on the mainline ri The ith vehicle originating from the on-ramp mlead,k,mlag,k The leading and lagging vehicles from the kth candidate gap on the mainline Ci,k The cooperative vehicle group corresponding to the on-ramp vehicle $ {r}_{i} $ gk The kth candidate merging gap on the mainline f(X) Overall objective function of the hierarchical cooperative merging problem α Discrete cooperative action associated with the selected candidate gap on the mainline A Set of admissible cooperative actions t0,tm The initial time and the designated merging time for a vehicle (s) $ t_{\text{rm}}^{\min },t_{\text{rm}}^{\max } $ The earliest and latest achievable time (s) for a vehicle to depart and reach the boundary of the merging area x(t),v(t),a(t) Longitudinal position (m), speed (m/s), and acceleration (m/s2) vmax,vmin The maximum and minimum speed (m/s) limits of the road amax,amin The maximum acceleration (m/s2) and maximum deceleration (m/s2) of the vehicle umax,umin The maximum and minimum continuous control input, i.e., jerk (m/s3) u(t) Continuous control input, i.e., jerk (m/s3) dsafe Minimum safe longitudinal distance (m) Lveh Standard length of a vehicle (m) ωe,ωs Weight coefficients for acceleration, and jerk penalties ωa,ωu Weight coefficients for traffic efficiency and traffic flow stability Jdecision,Jcontrol Objective functions of the decision-making and optimal control layers Jstability,Jefficiency Sub-objective functions of the traffic flow stability and traffic efficiency N Layer of Monte Carlo tree search Node Node of Monte Carlo tree search Table 1.
Key notations and descriptions of the cooperative merging problem.
-
Category Parameter Value Simulation Platform Simulation duration 180 s Simulation step size 0.1 s Road topology Mainline length 1,200 m Cooperative control zone 600 m Merging zone 200 m Downstream zone 400 m Ramp length 1,000 m Acceleration lane 200 m Lane width 3.75 m Control trigger position 400 m upstream of merge point Initial conditions Mainline initial speed 33 m/s Ramp initial speed 10 m/s Traffic flow setting Arrival distribution Poisson distribution Headway distribution Negative exponential distribution Traffic demand 1,400, 1,800, 2,200 veh/h Traffic demand split 50−50, 65−35, 80−20 CAV penetration rate 20, 40, 60, 80 Table 2.
Key parameter configuration of simulation platform and scenario settings.
-
Parameter Value Vehicle length 5.0 m Standing gap 2.5 m Maximum acceleration of CAVs 3.5 m/s2 Maximum acceleration of HDVs 2.5 m/s2 Minimum deceleration of vehicles −4.0 m/s2 Minimum safe time headway 1.5 s Maximum road speed limit 33.0 m/s Desired merging speed 20.0 m/s Initial speed of mainline vehicle 33.0 m/s Initial speed of ramp vehicle 10.0 m/s Random noise term 0.5 Table 3.
Key parameter configuration of vehicle kinematics and simulation models.
-
Parameter Value Simulation time step 5.0 s Maximum search depth 10.0 Exploration constant 1.414 Decision update period 1 s Weight of efficiency term 0.4 Weight of stability term 0.3 Control weight coefficient of ramp vehicle 1.5 Control weight coefficient of mainline vehicle 2.0 Acceleration weight coefficient 1.0 Jerk weight coefficient 1.0 Weight ratio 0.5 Trajectory planning horizon 5.0 Table 4.
Key parameter configuration of the MCTS-H algorithm.
-
Method Demand (veh/h) Average travel speed (m/s) Total travel time (min) 1,400 1,800 2,200 1,400 1,800 2,200 No control 20.48 20.15 19.29 156.96 181.07 206.81 PID 23.30 20.64 18.78 141.51 172.91 203.70 MCTS-H 24.89 24.10 22.55 132.94 155.76 181.48 Table 5.
Average travel speed and total travel time under the 50–50 demand split at a 20% CAV penetration rate.
-
Method Demand (veh/h) Average travel speed (m/s) Total travel time (min) 1,400 1,800 2,200 1,400 1,800 2,200 No control 20.69 20.58 20.42 132.58 148.81 165.13 PID 23.51 23.45 23.19 119.87 134.22 149.58 MCTS-H 25.33 25.01 24.72 111.73 126.27 140.85 Table 6.
Average travel speed and toal travel time under the 65–35 demand split at a 20% CAV penetration rate.
-
Method Demand (veh/h) Average travel speed (m/s) Total travel time (min) 1,400 1,800 2,200 1,400 1,800 2,200 No control 20.65 20.74 20.64 109.16 117.79 126.98 PID 23.40 23.45 23.49 99.08 107.02 114.80 MCTS-H 25.34 25.36 25.28 91.90 99.38 107.06 Table 7.
Average travel speed and total travel time under the 80–20 demand split at a 20% CAV penetration rate.
Figures
(8)
Tables
(7)