-
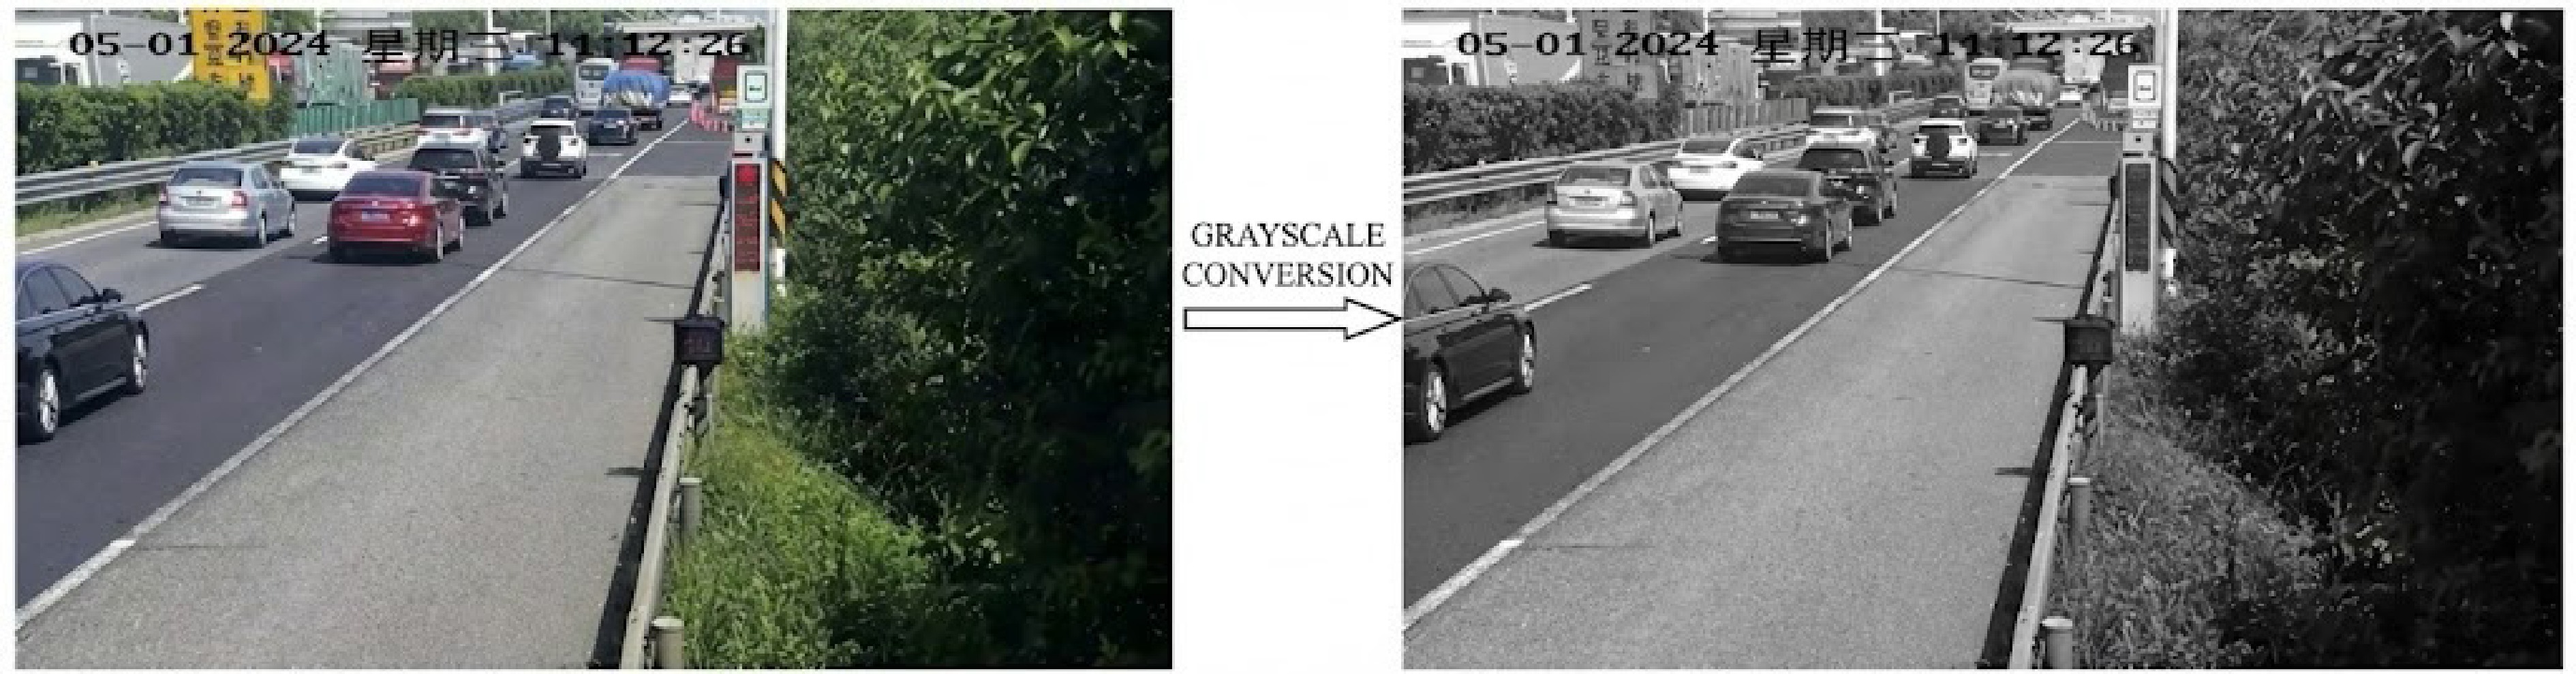
Figure 1.
Video grayscale processing.
-
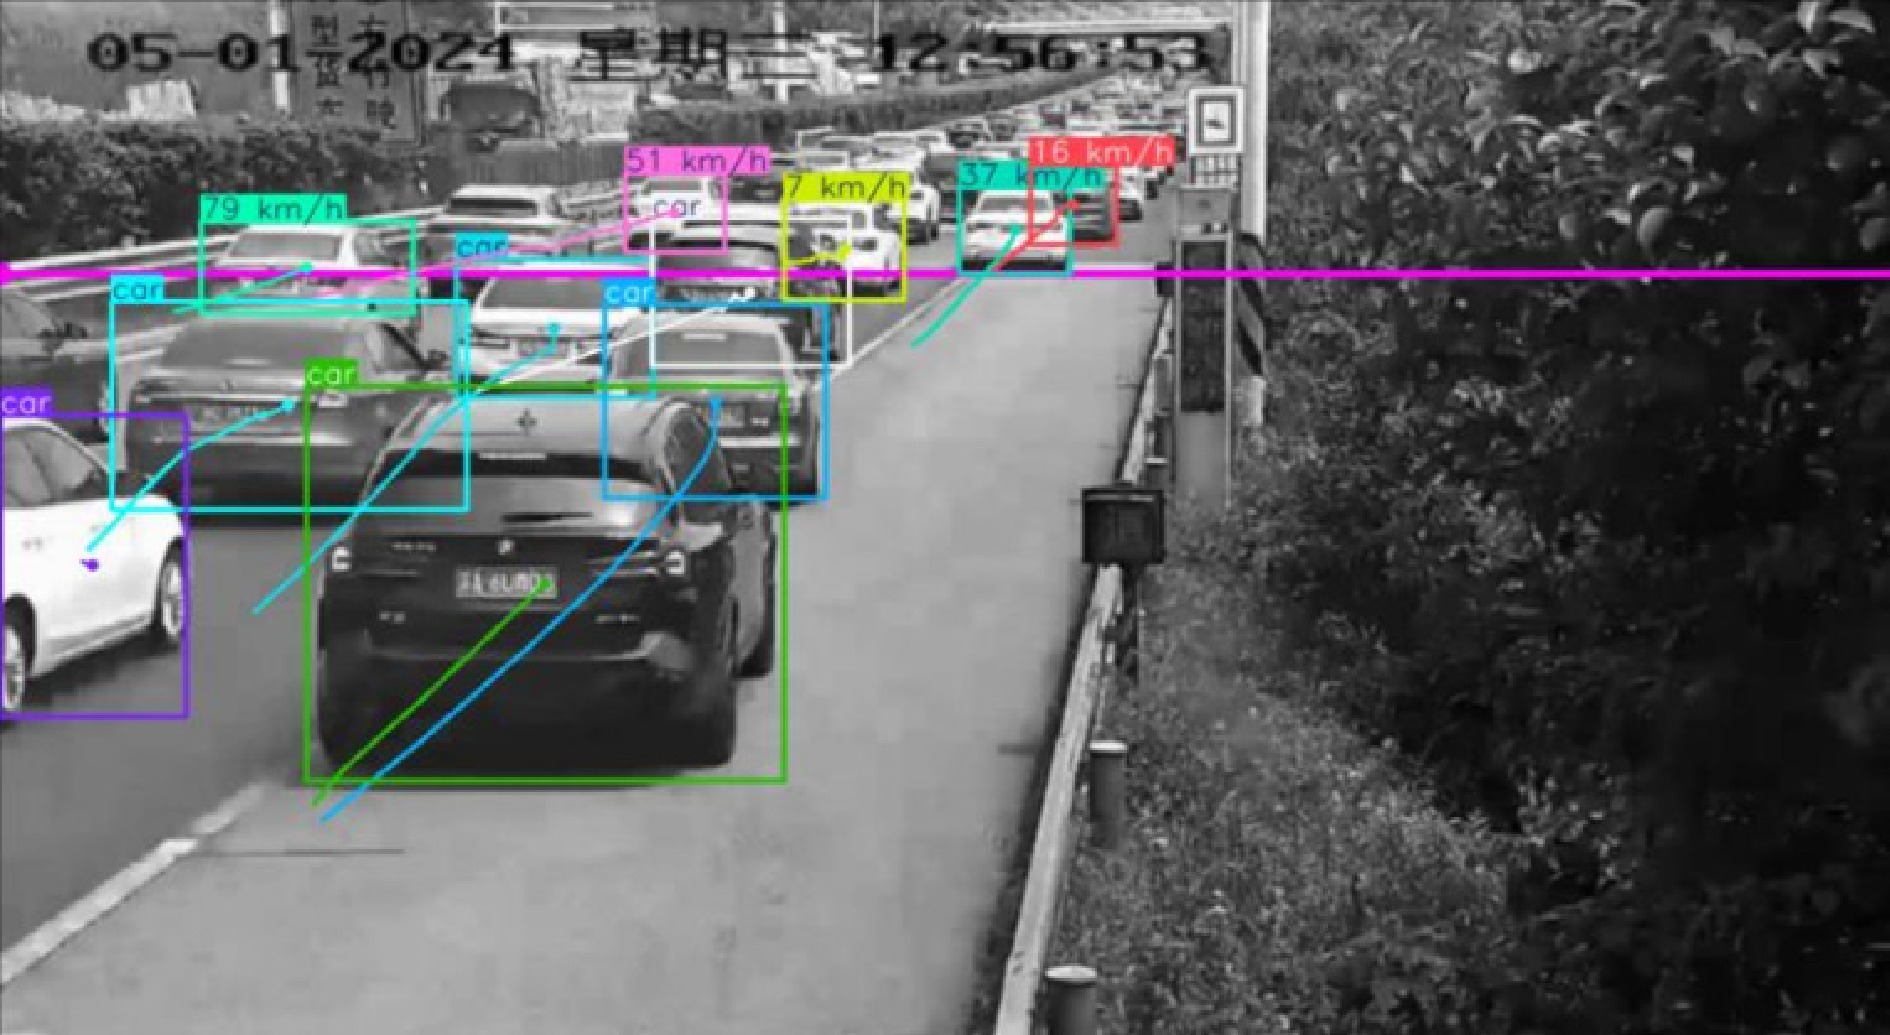
Figure 2.
Vehicle dynamics identification process.
-
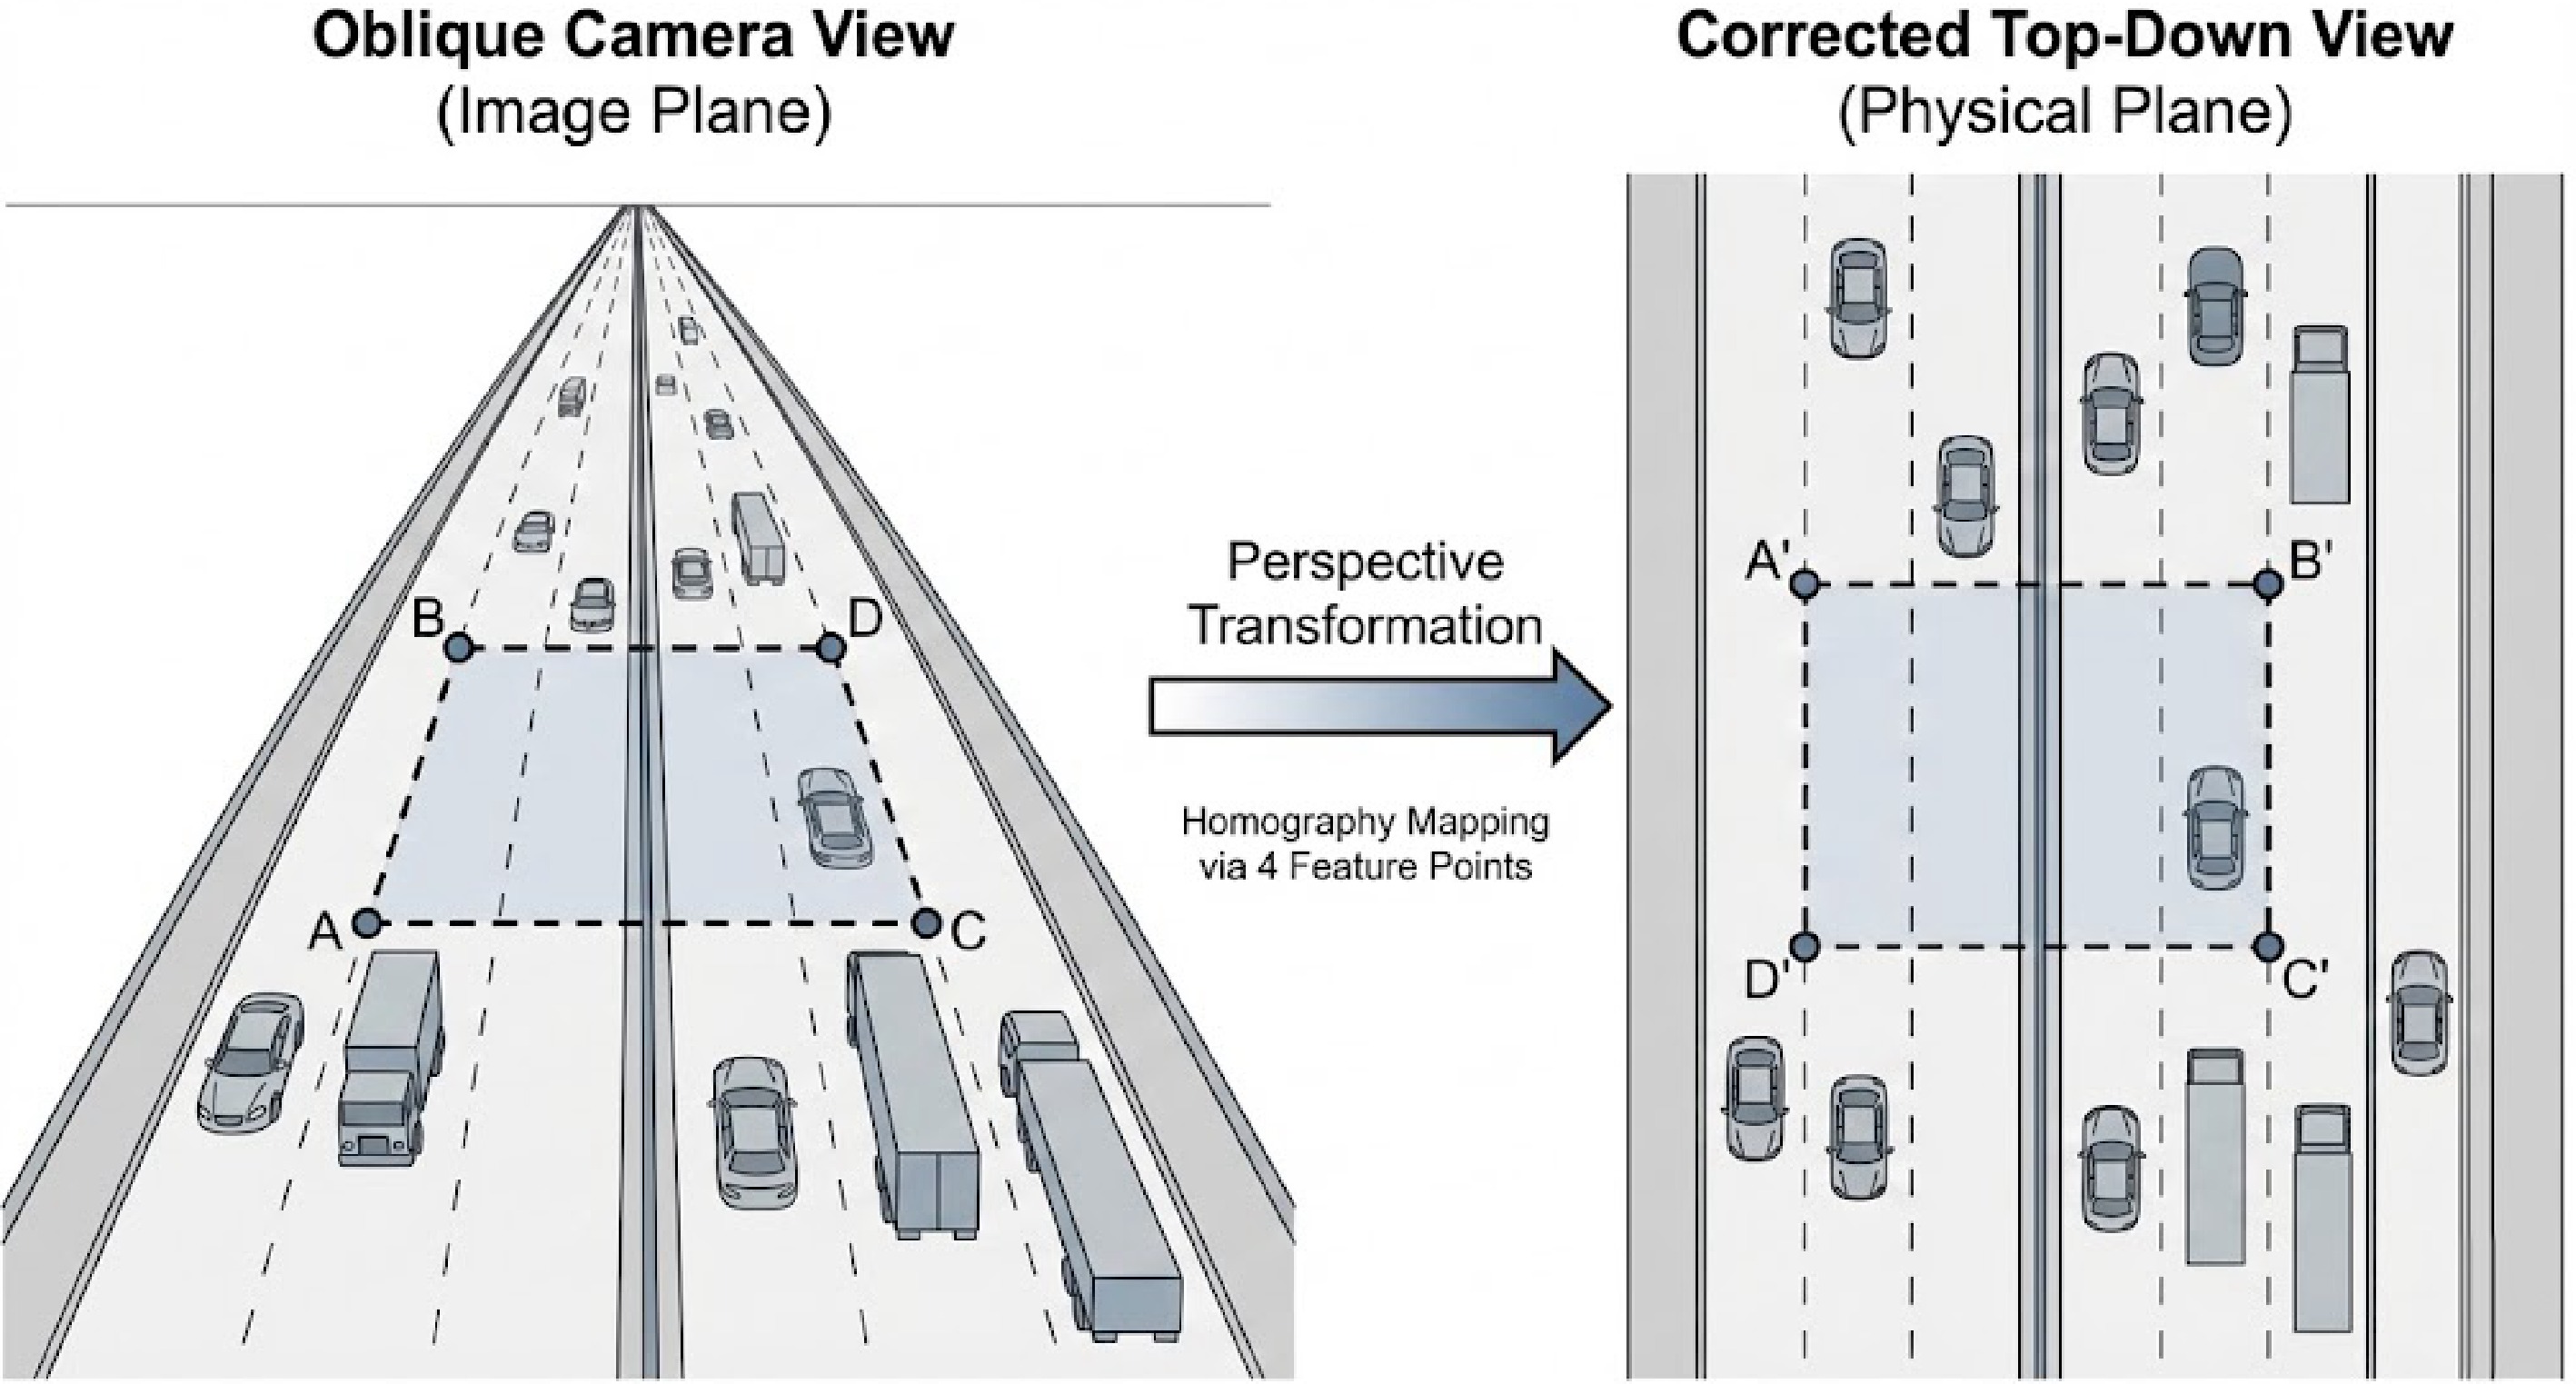
Figure 3.
Diagram of perspective transformation.
-
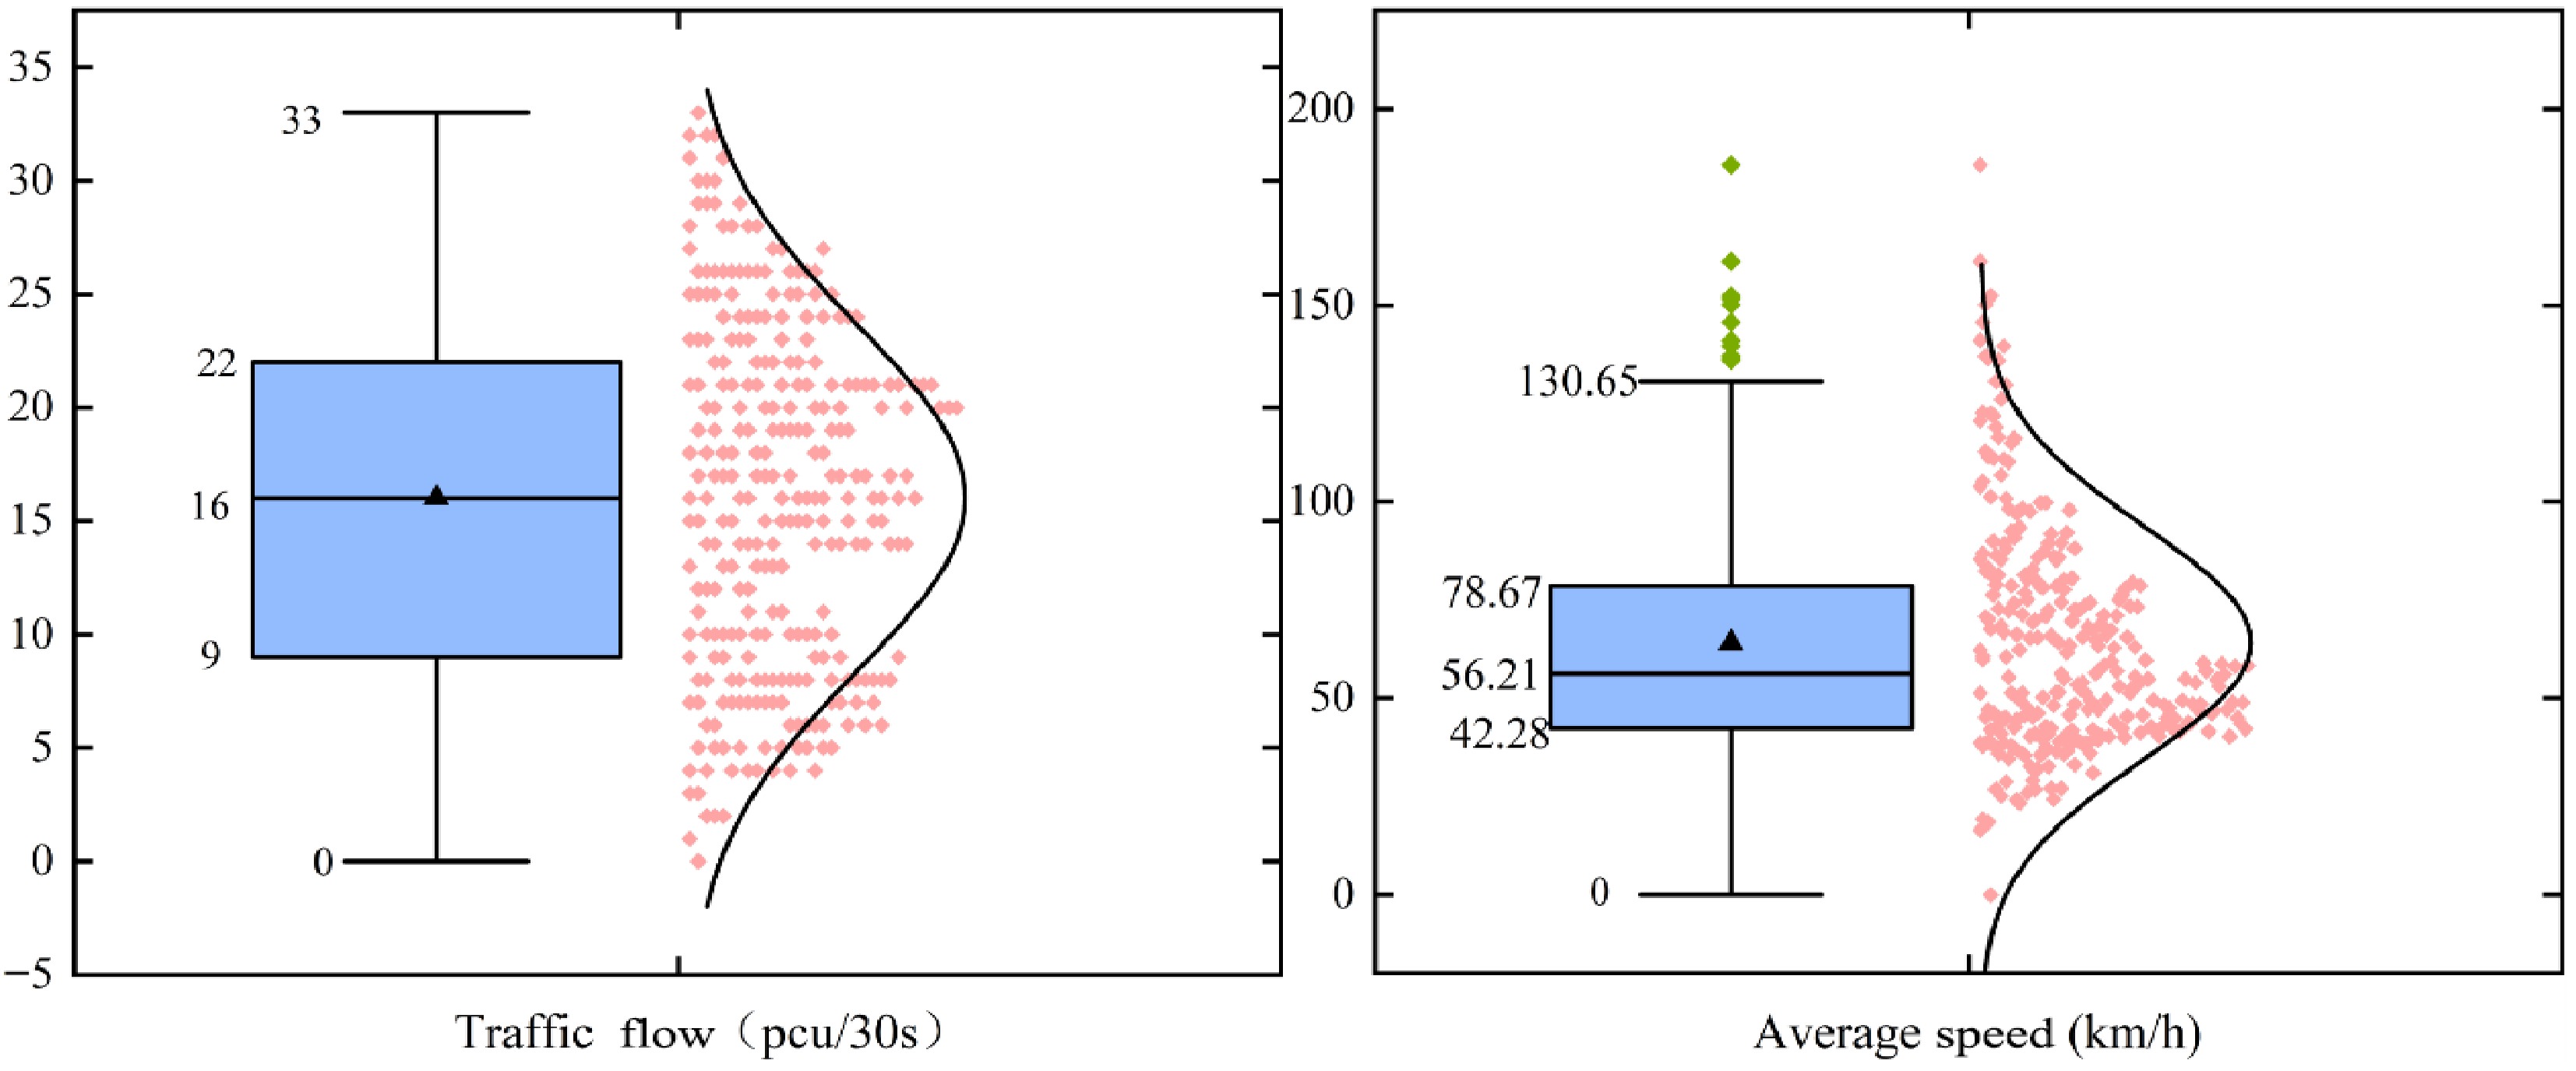
Figure 4.
Traffic flow and vehicle speed outlier detection.
-
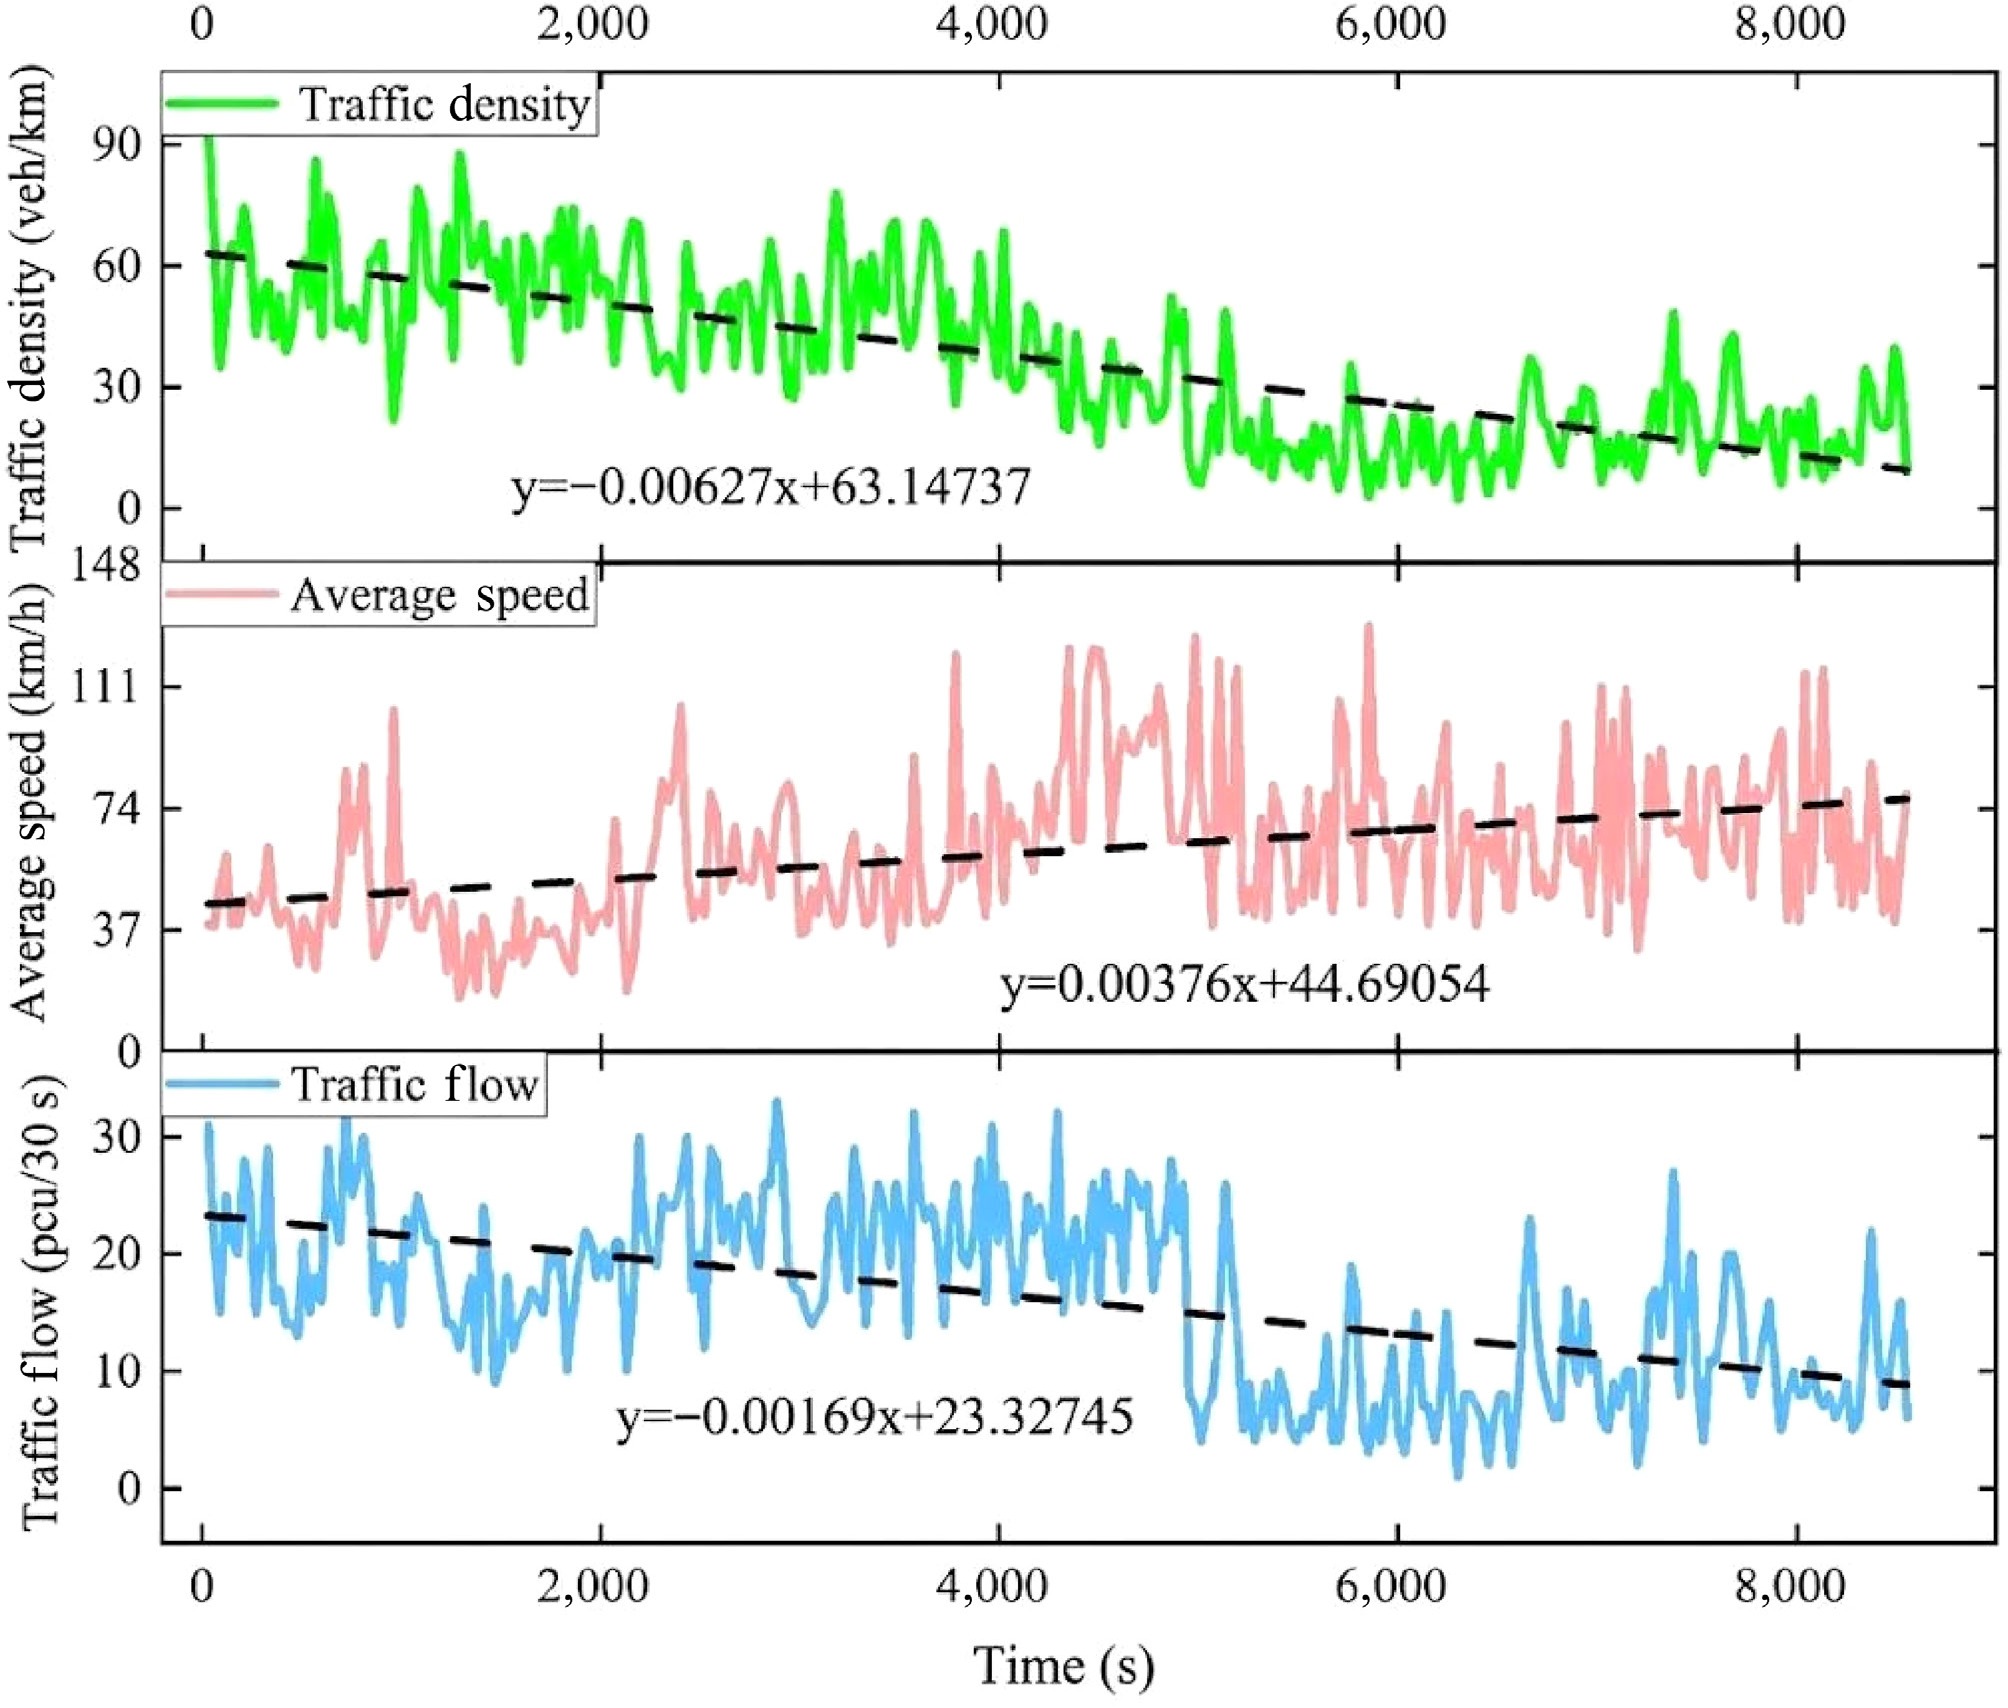
Figure 5.
Traffic flow, average vehicle speed, and density time series chart.
-
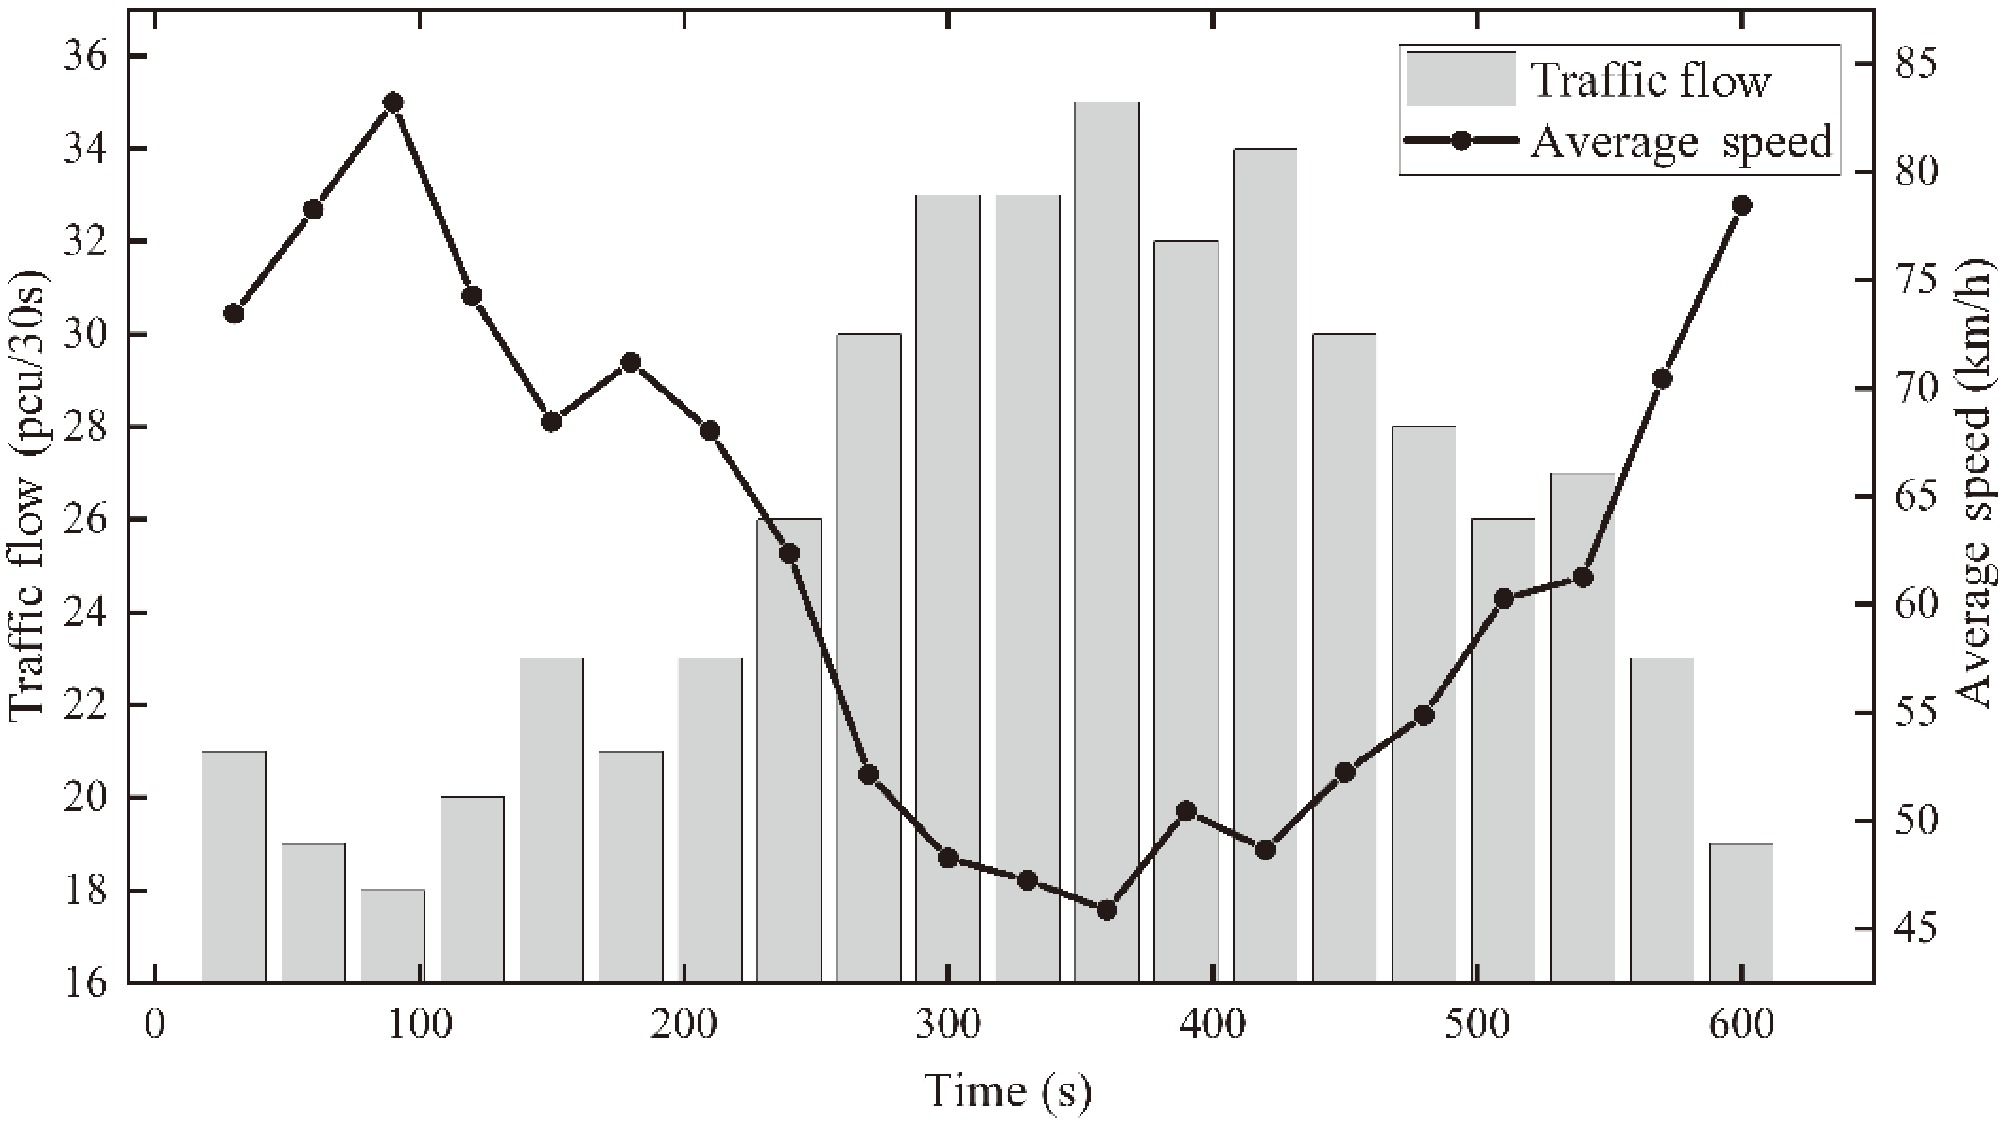
Figure 6.
Traffic volume and average Vehicle speed forecast results.
-
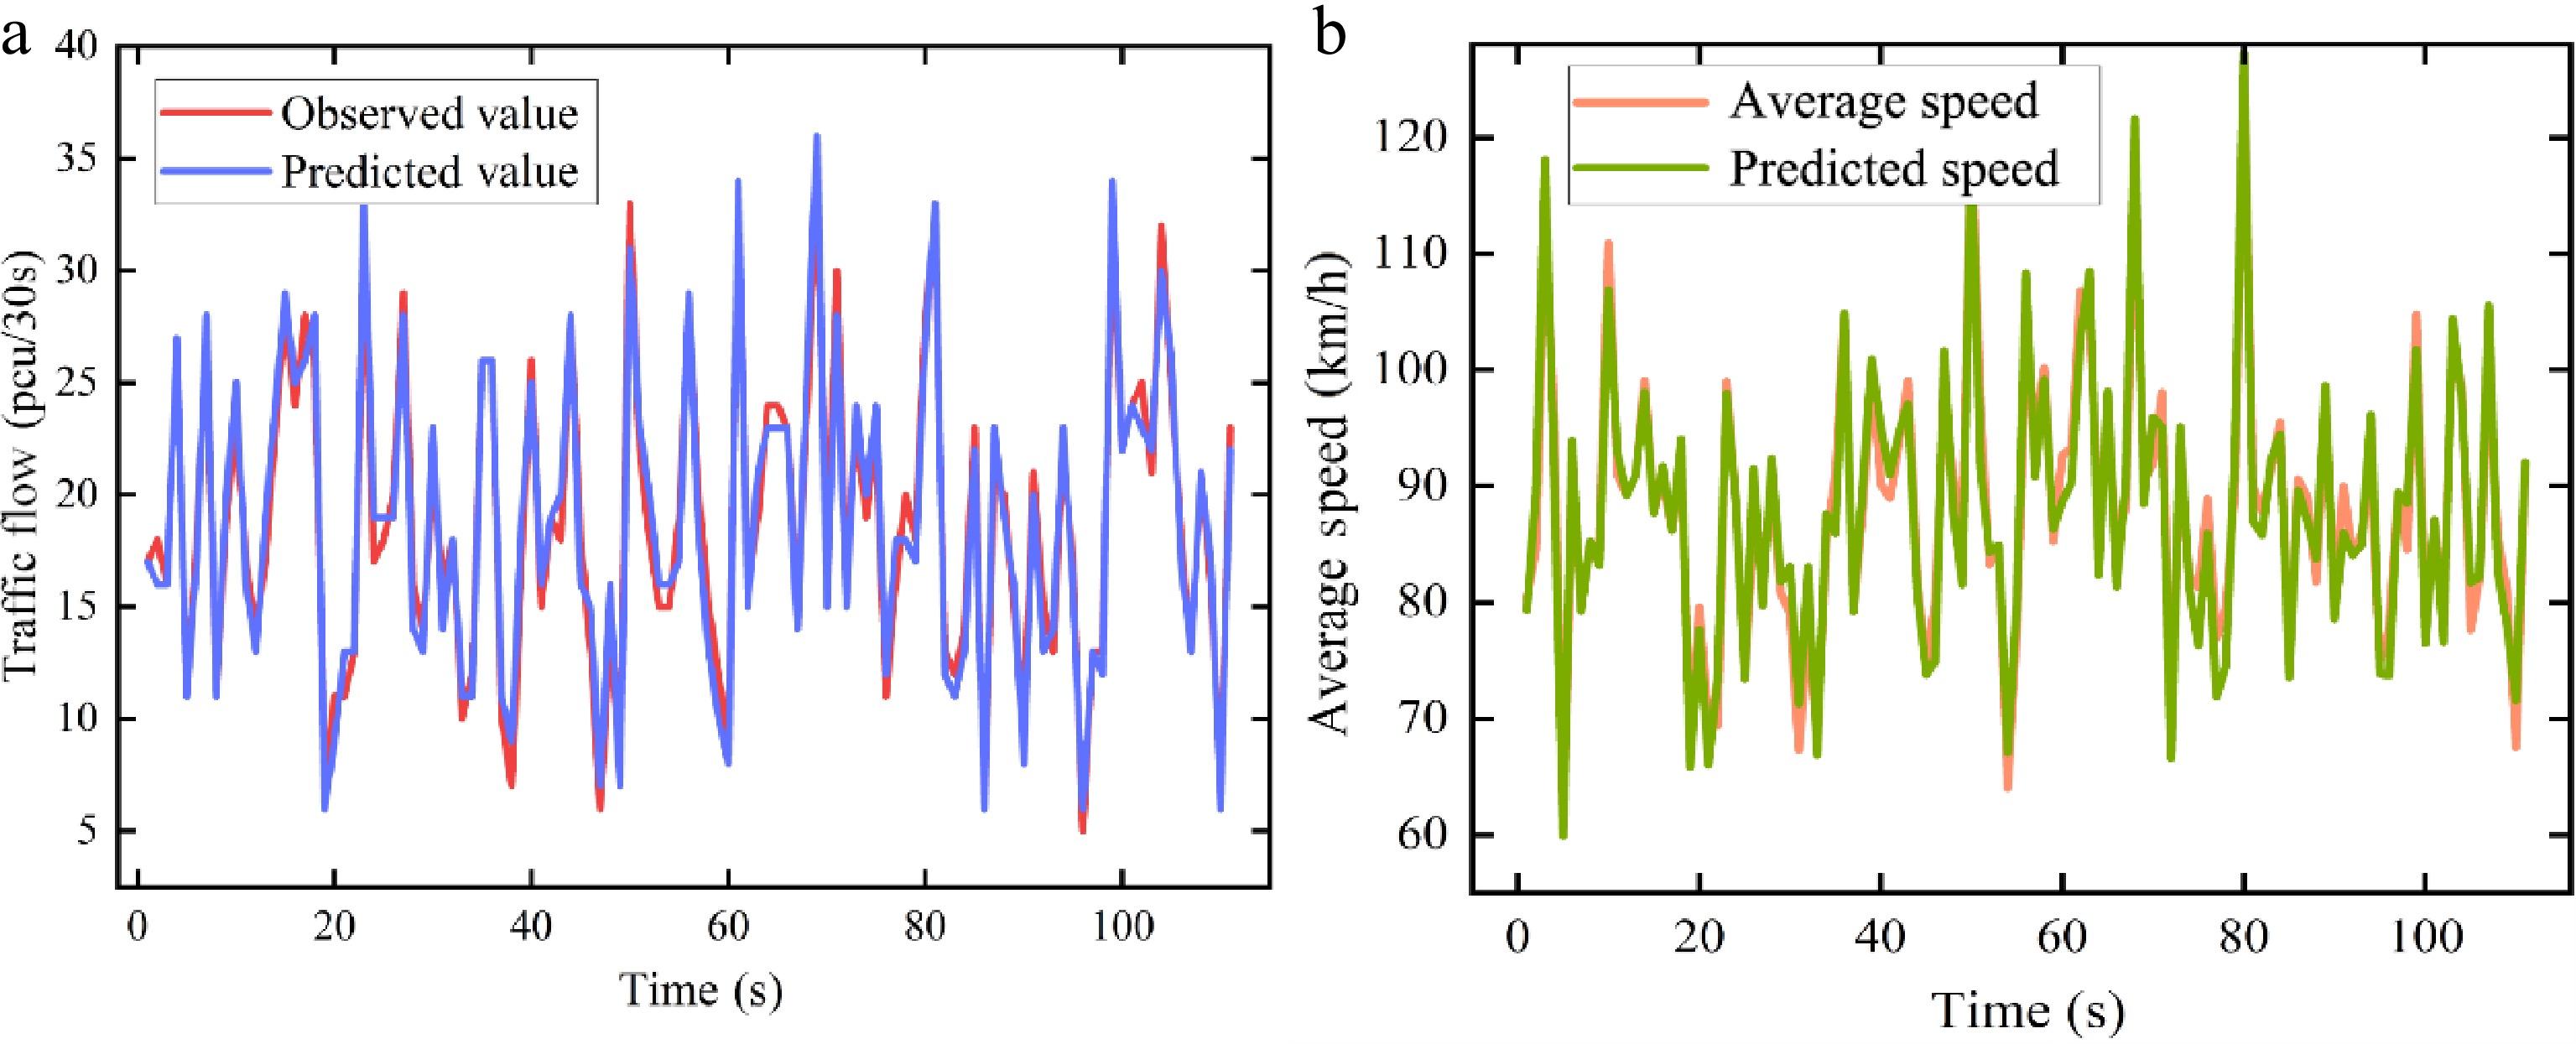
Figure 7.
Comparison of the time-varying characteristics of predicted and actual traffic flow.
-
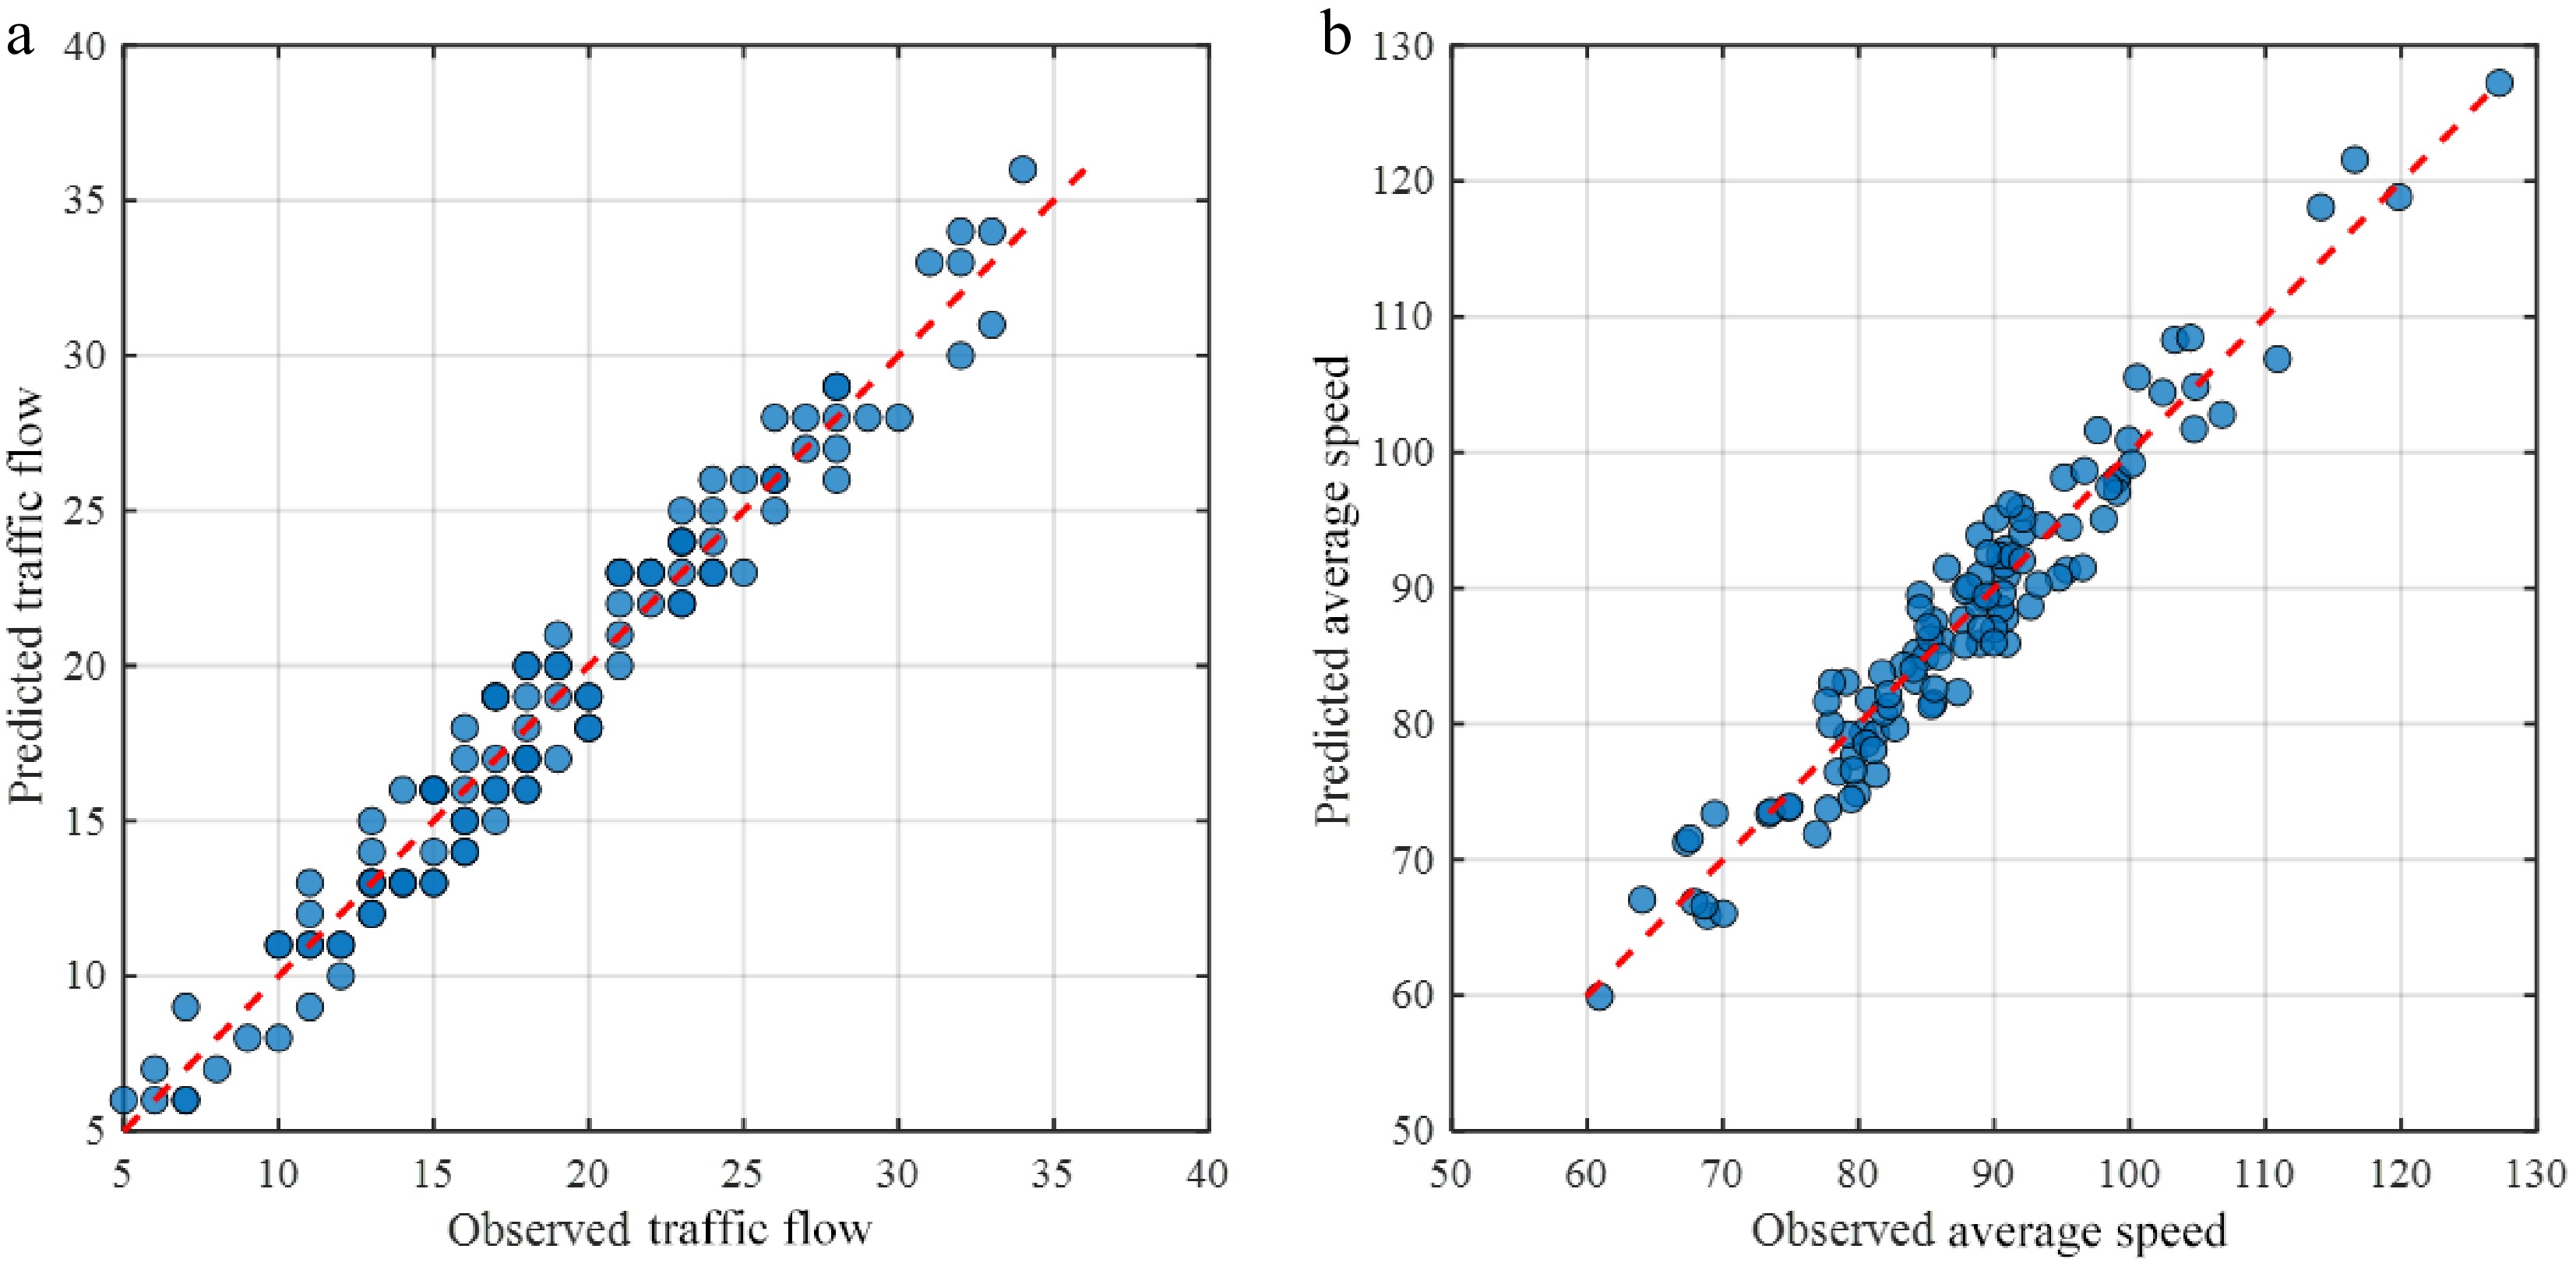
Figure 8.
Observed vs predicted scatter plots for traffic flow and average speed.
-
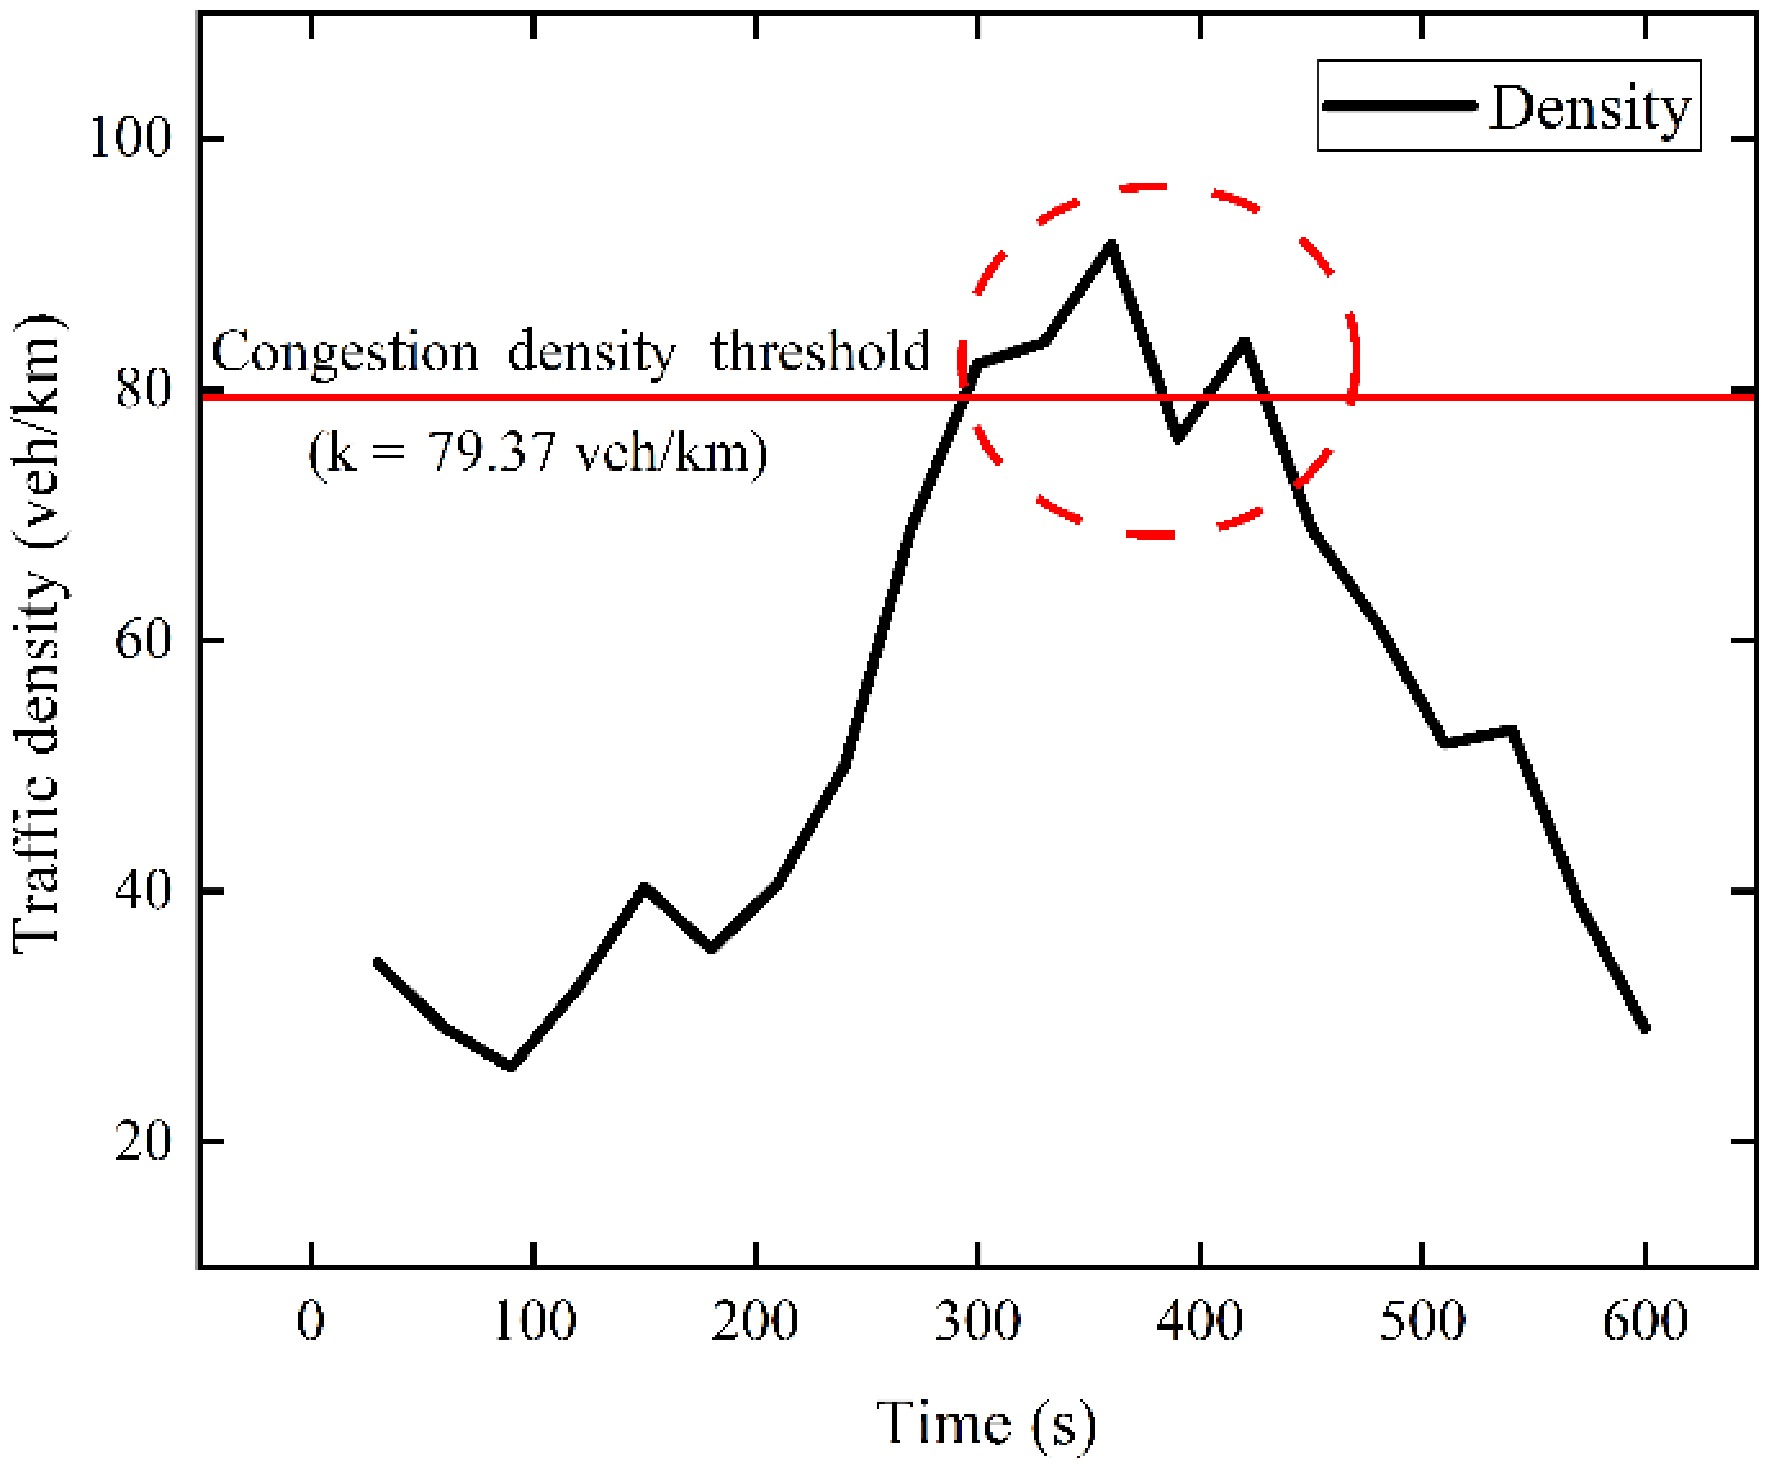
Figure 9.
Traffic density trend prediction chart.
-
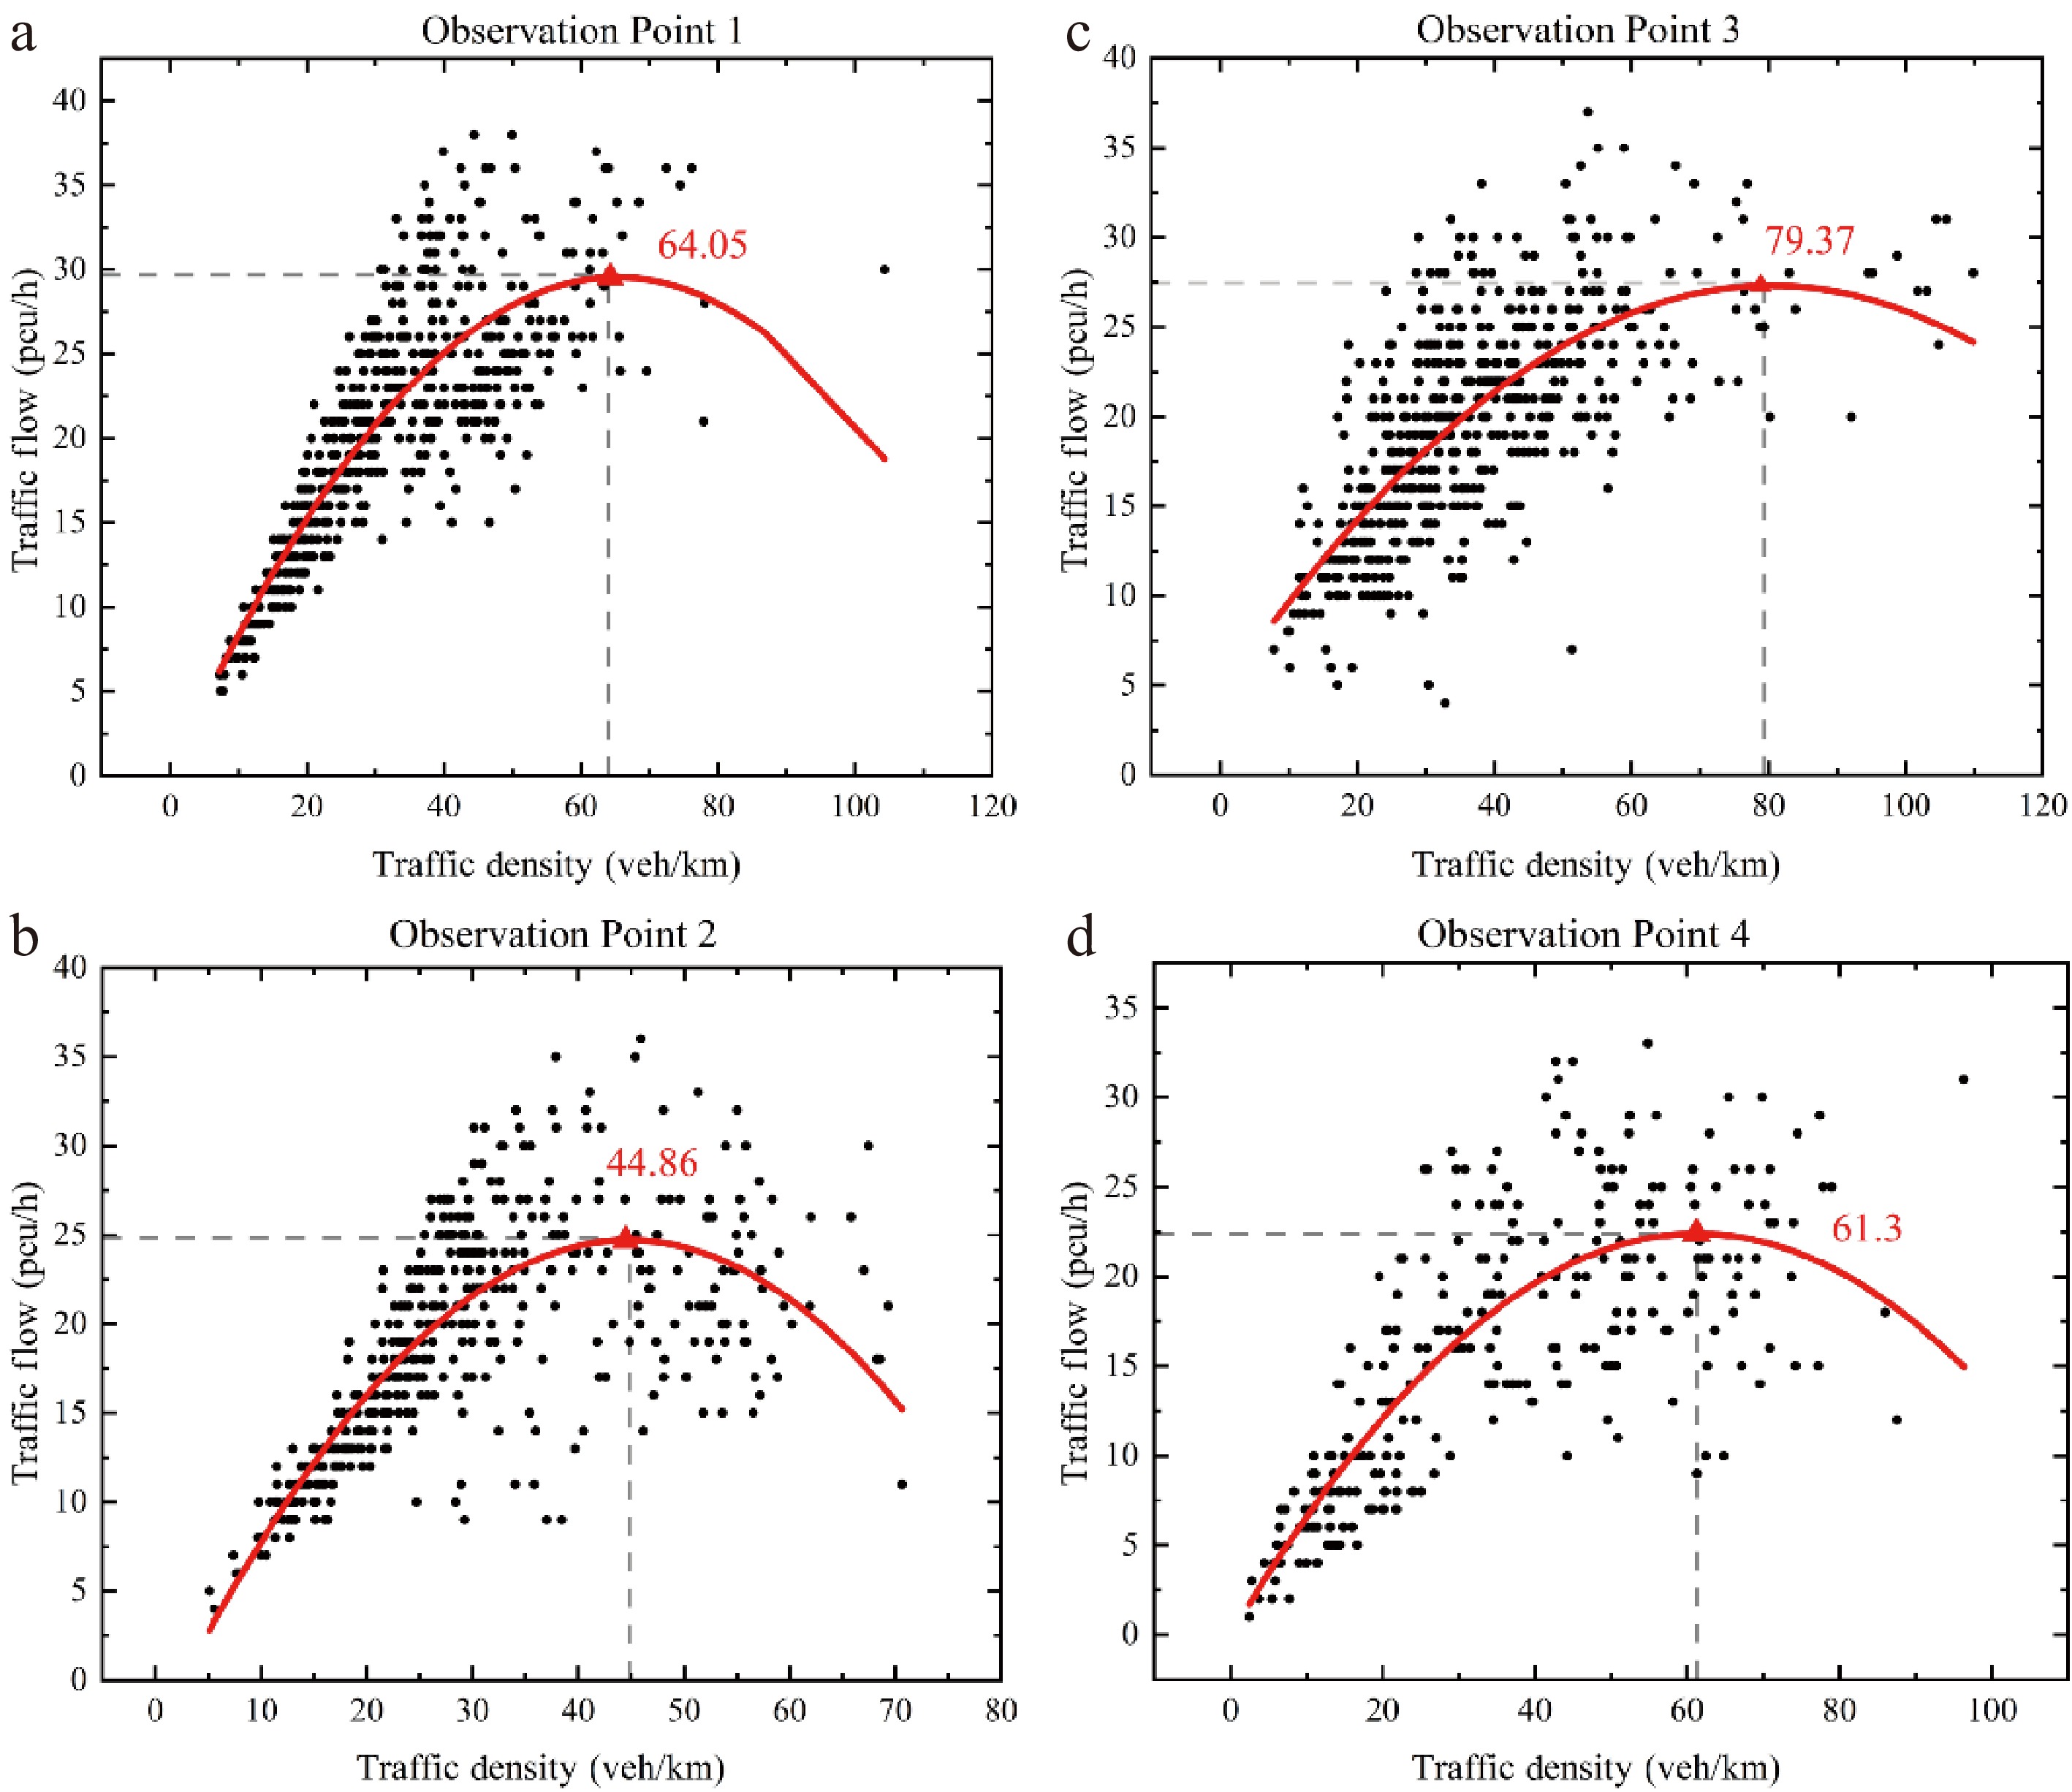
Figure 10.
Flow-density relationship diagram for each observation point. (a) Observation Point 1. (b) Observation Point 2. (c) Observation Point 3. (d) Observation Point 4.
-
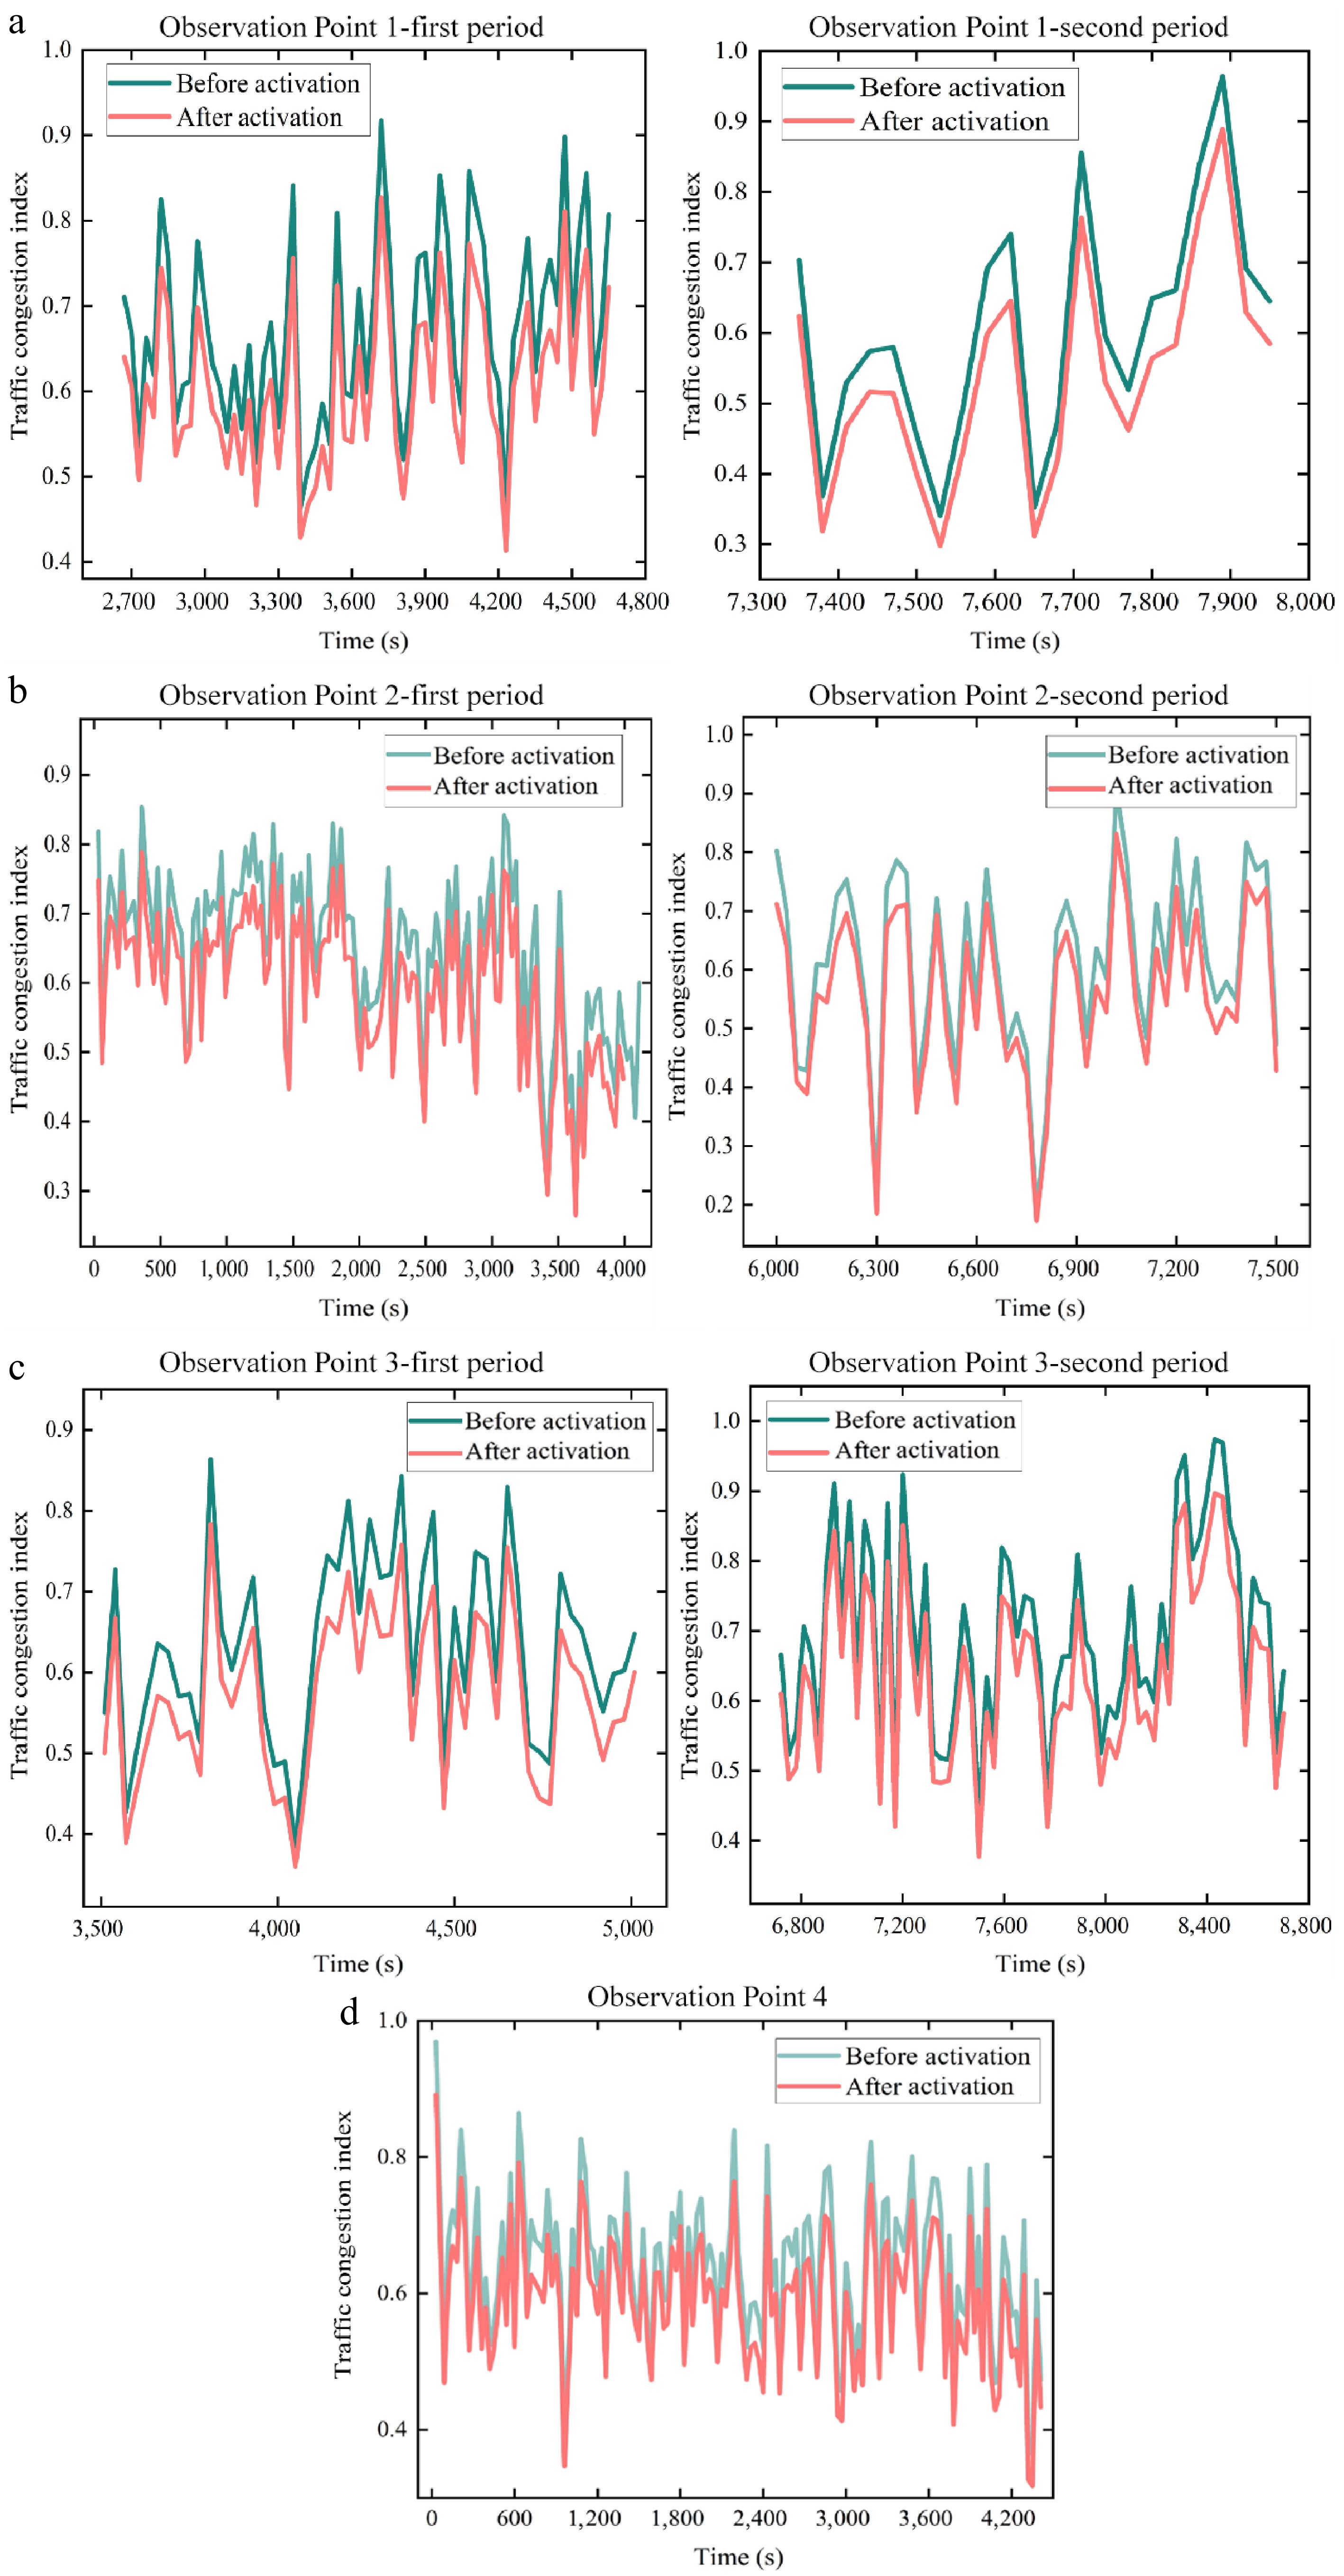
Figure 11.
Comparison of the traffic congestion index before and after the activation of emergency lanes at each observation point. (a) Observation Point 1. (b) Observation Point 2. (c) Observation Point 3. (d) Observation Point 4.
-
Module Parameter Value Module Parameter Value YOLOv8 Input image size 640 × 640 DeepSORT Minimum detection confidence 0.3 YOLOv8 Confidence threshold 0.3 DeepSORT Maximum cosine distance 0.2 YOLOv8 IoU threshold 0.5 DeepSORT Maximum IoU matching distance 0.7 YOLOv8 Maximum number of detections 100 DeepSORT Maximum age 30 YOLOv8 Detection classes Car, bus, truck DeepSORT Feature gallery size 100 Table 1.
The YOLOv8 and DeepSORT parameter settings.
-
Predicted data MAE MSE MAPE R2 Traffic flow 0.4214 0.4638 2.11% 0.968 Average speed 1.2341 1.6332 1.37% 0.973 Table 2.
Traffic flow prediction model evaluation metric results.
-
Observation point Average congestion index reduction Observation Point 1 10.44% Observation Point 2 11.23% Observation Point 3 9.56% Observation Point 4 8.22% Table 3.
Average congestion index reduction at observation points after proactive HSR activation.
Figures
(11)
Tables
(3)