-
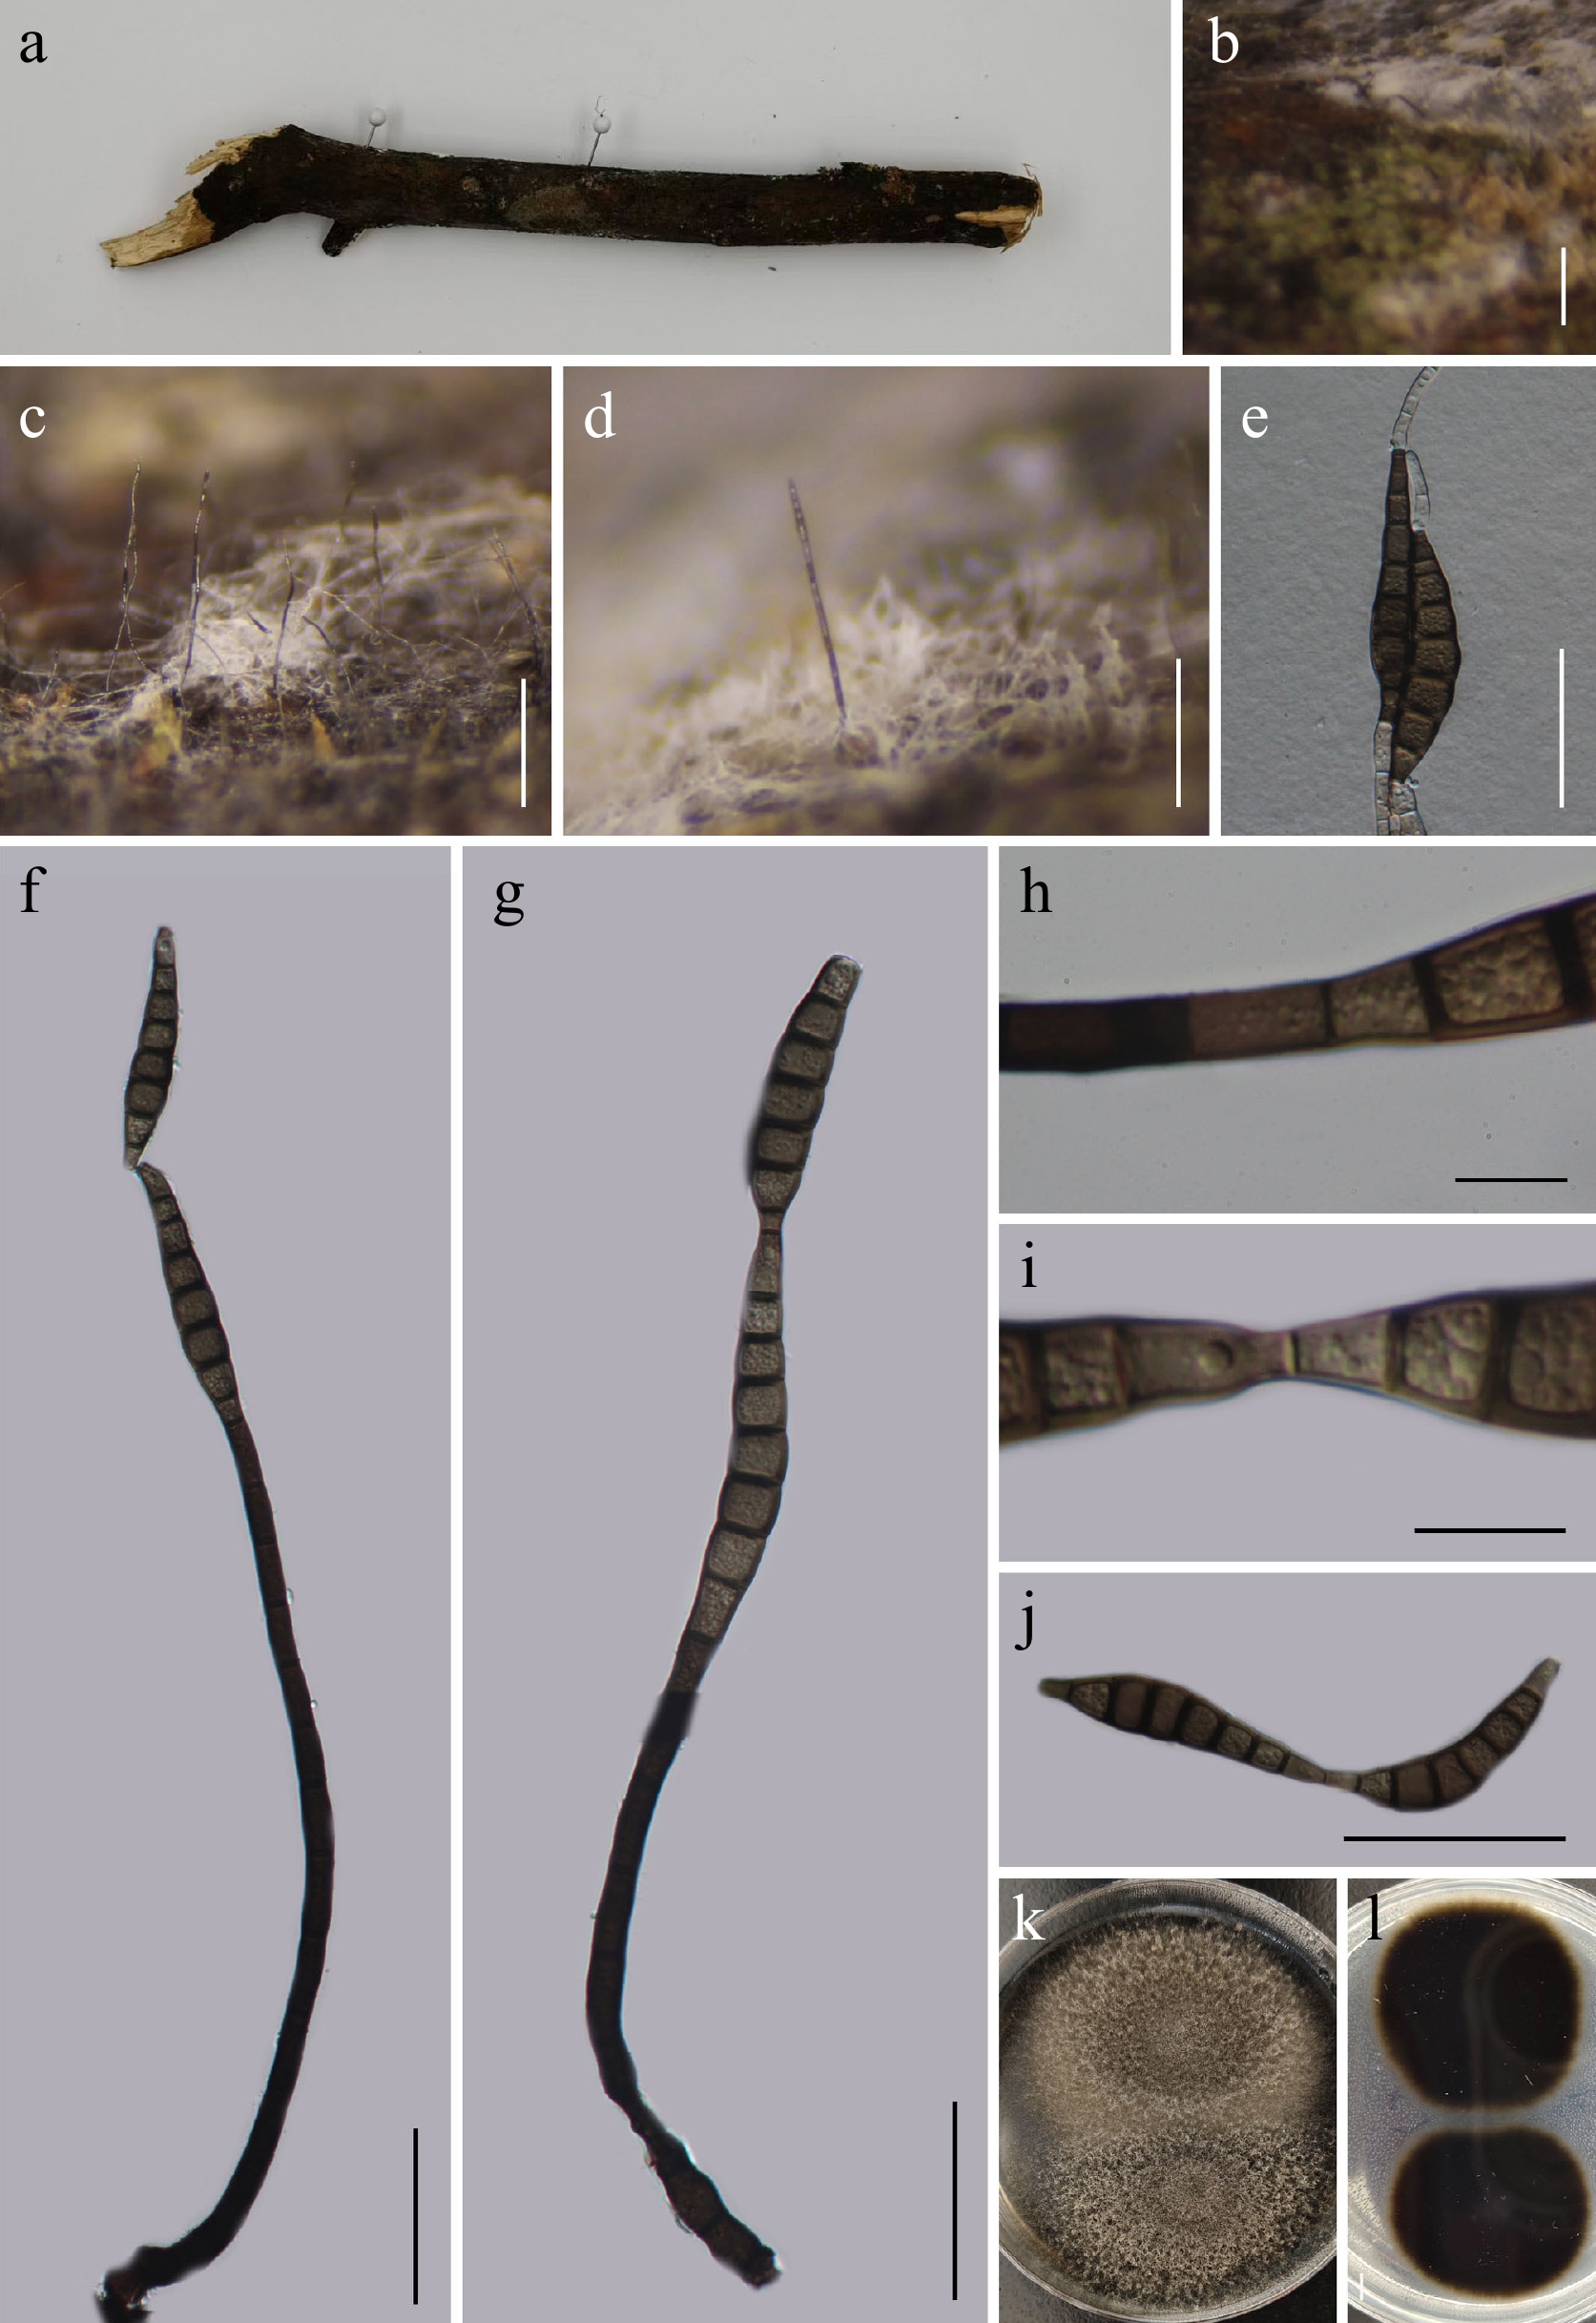
Figure 1.
Kirschsteiniothelia chinensis (GMB5168 holotype). (a) Host. (b)–(d) Colonies on natural substrate. (e) Germinating conidia. (f), (g) Conidiophores and conidia. (h), (i) Conidiogenous cells with conidia. (j) Conidia. (k), (l) Surface and reverse view of culture on PDA. Scale bars: b = 1 mm, c = 0.5 mm, d = 0.25 mm, e–g, j = 50 μm, h, i = 10 μm.
-
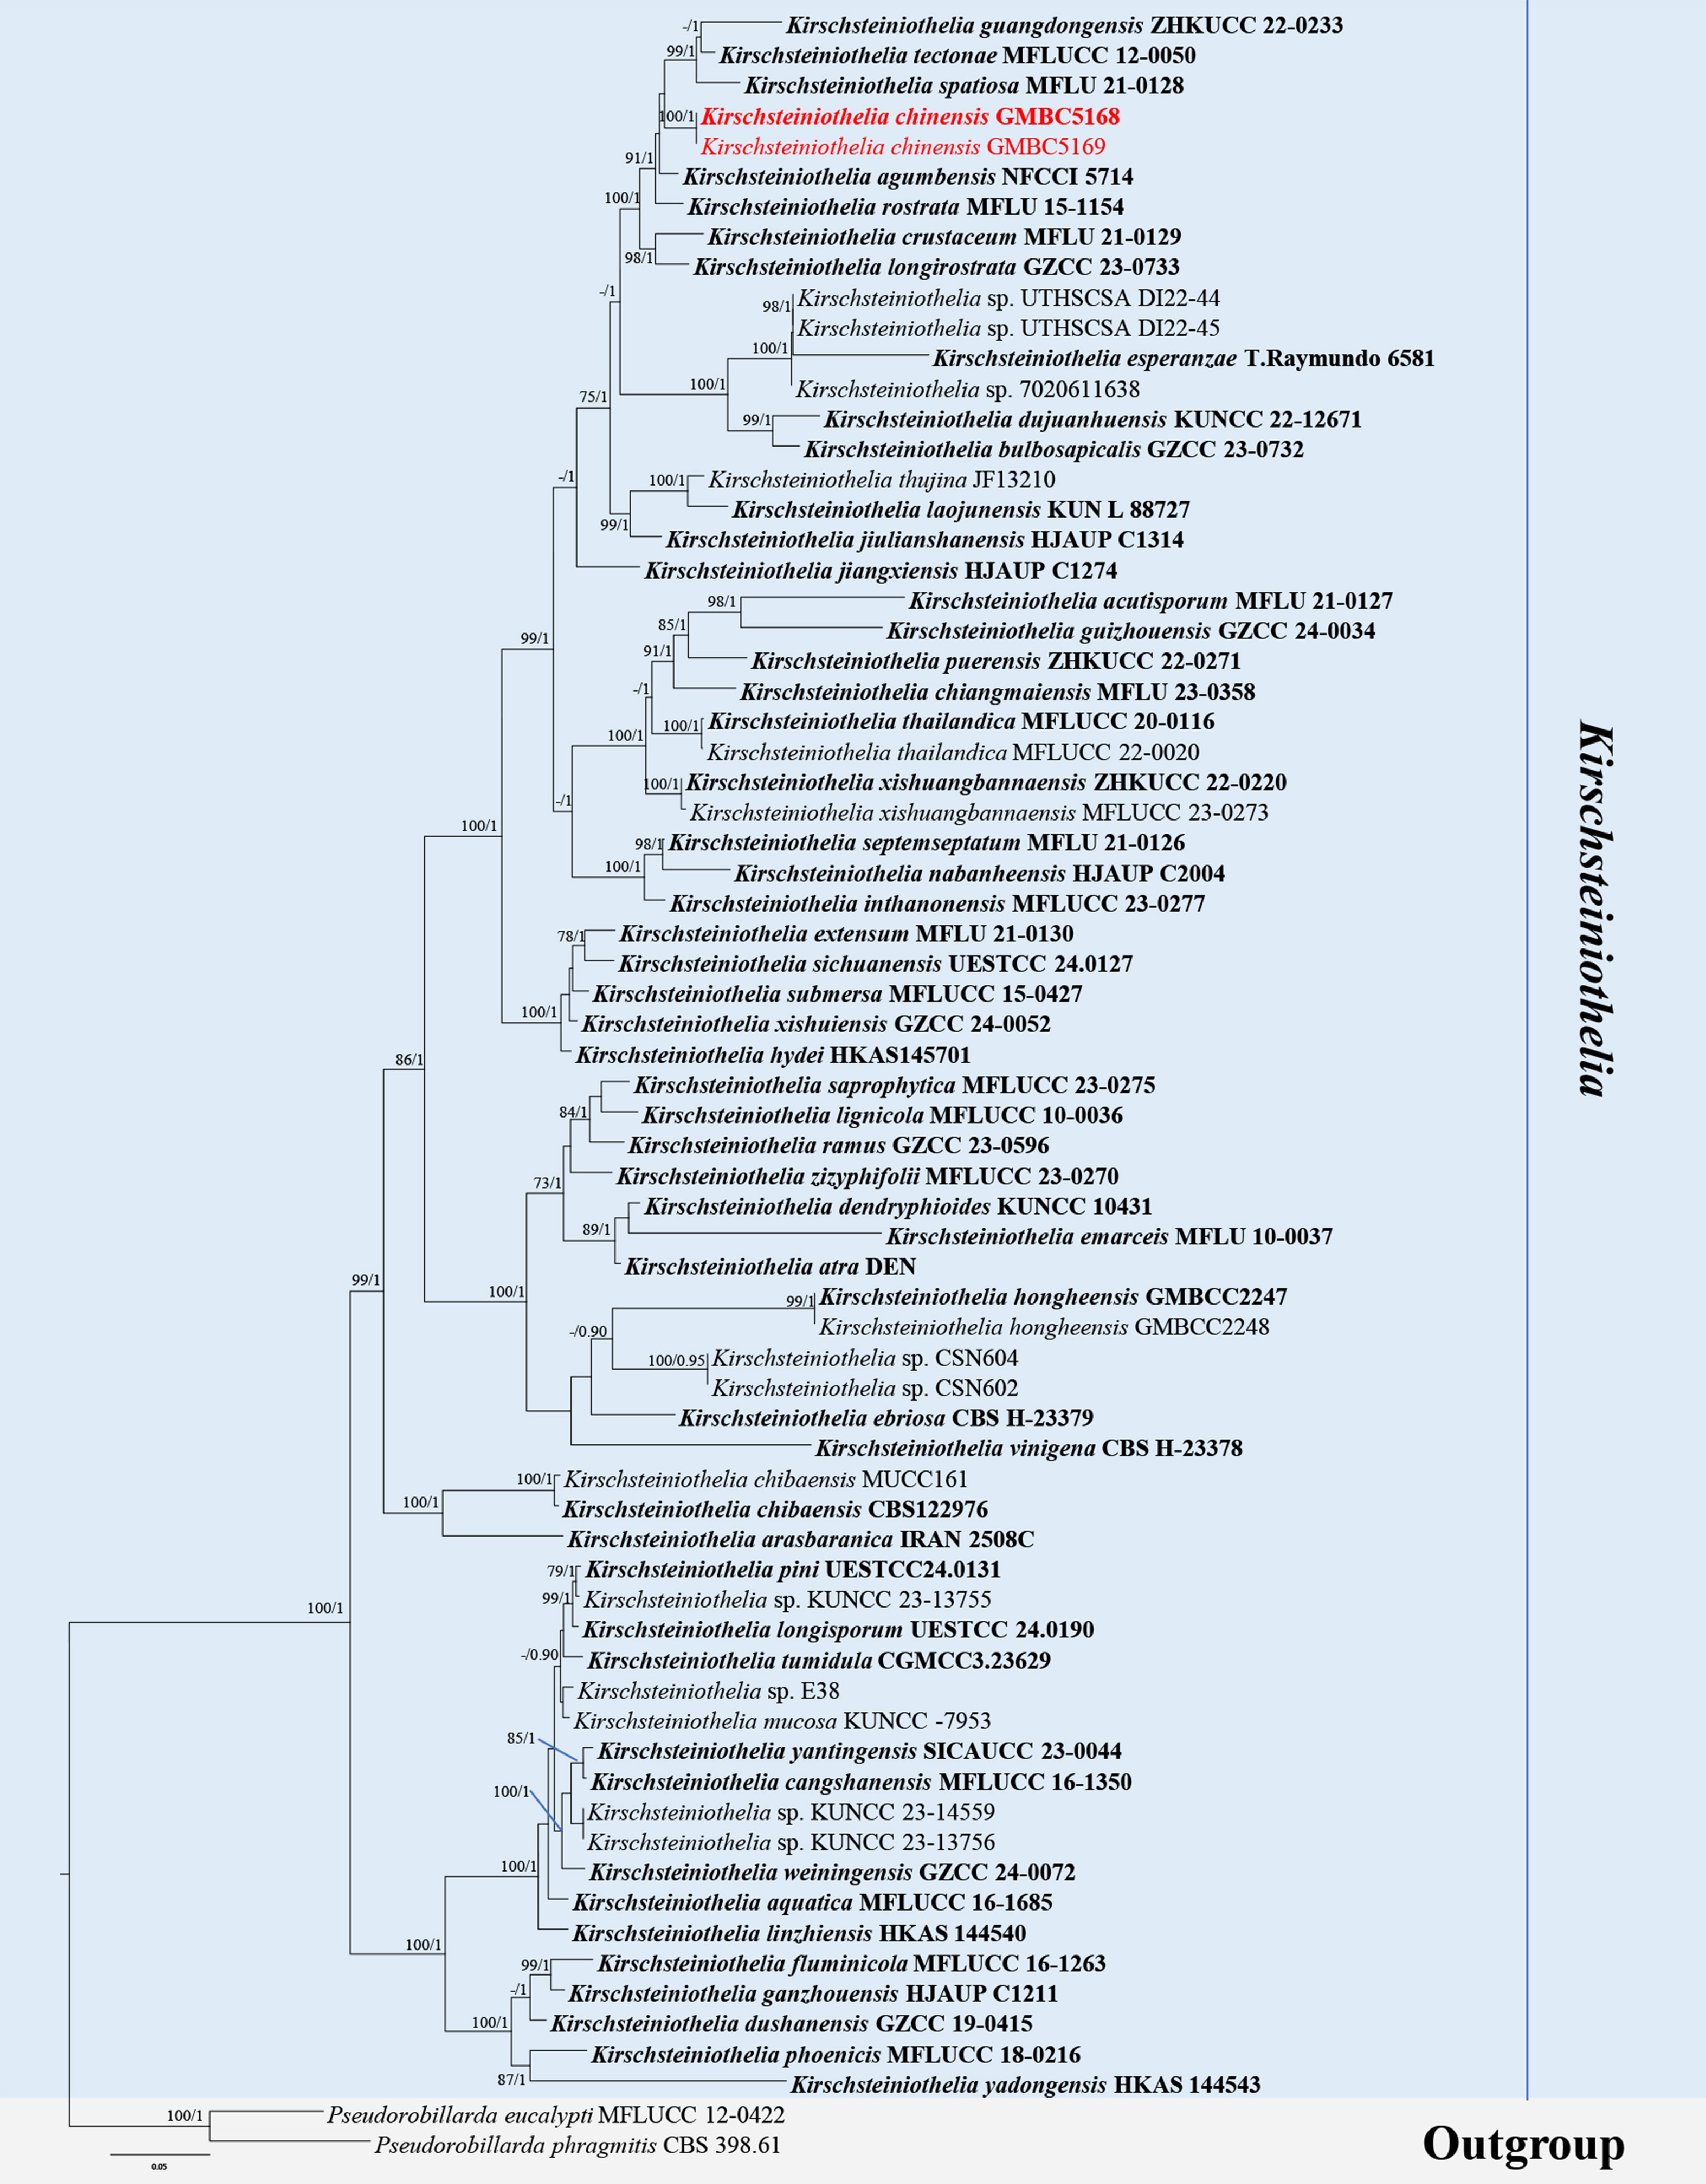
Figure 2.
ML tree of selected Kirschsteiniothelia species based on the ITS-LSU-SSU dataset. The combined dataset comprised 71 taxa and 2,429 characters (ITS: 1–520 bp; LSU: 521–1,405 bp; SSU: 1,406–2,429 bp), including indel regions. Maximum likelihood (lnL = –22,055.122970) and Bayesian analyses produced consistent tree topologies. Pseudorobillarda phragmitis (CBS 398.61) and P. eucalypti (MFLUCC 12-0422) were selected as the outgroup taxa. Bayesian posterior probabilities (PP) ≥ 0.90 and RAxML bootstrap support values ≥ 70 % are shown on the branches. The newly described species is marked in red. Ex-type/type strains are indicated in bold.
-
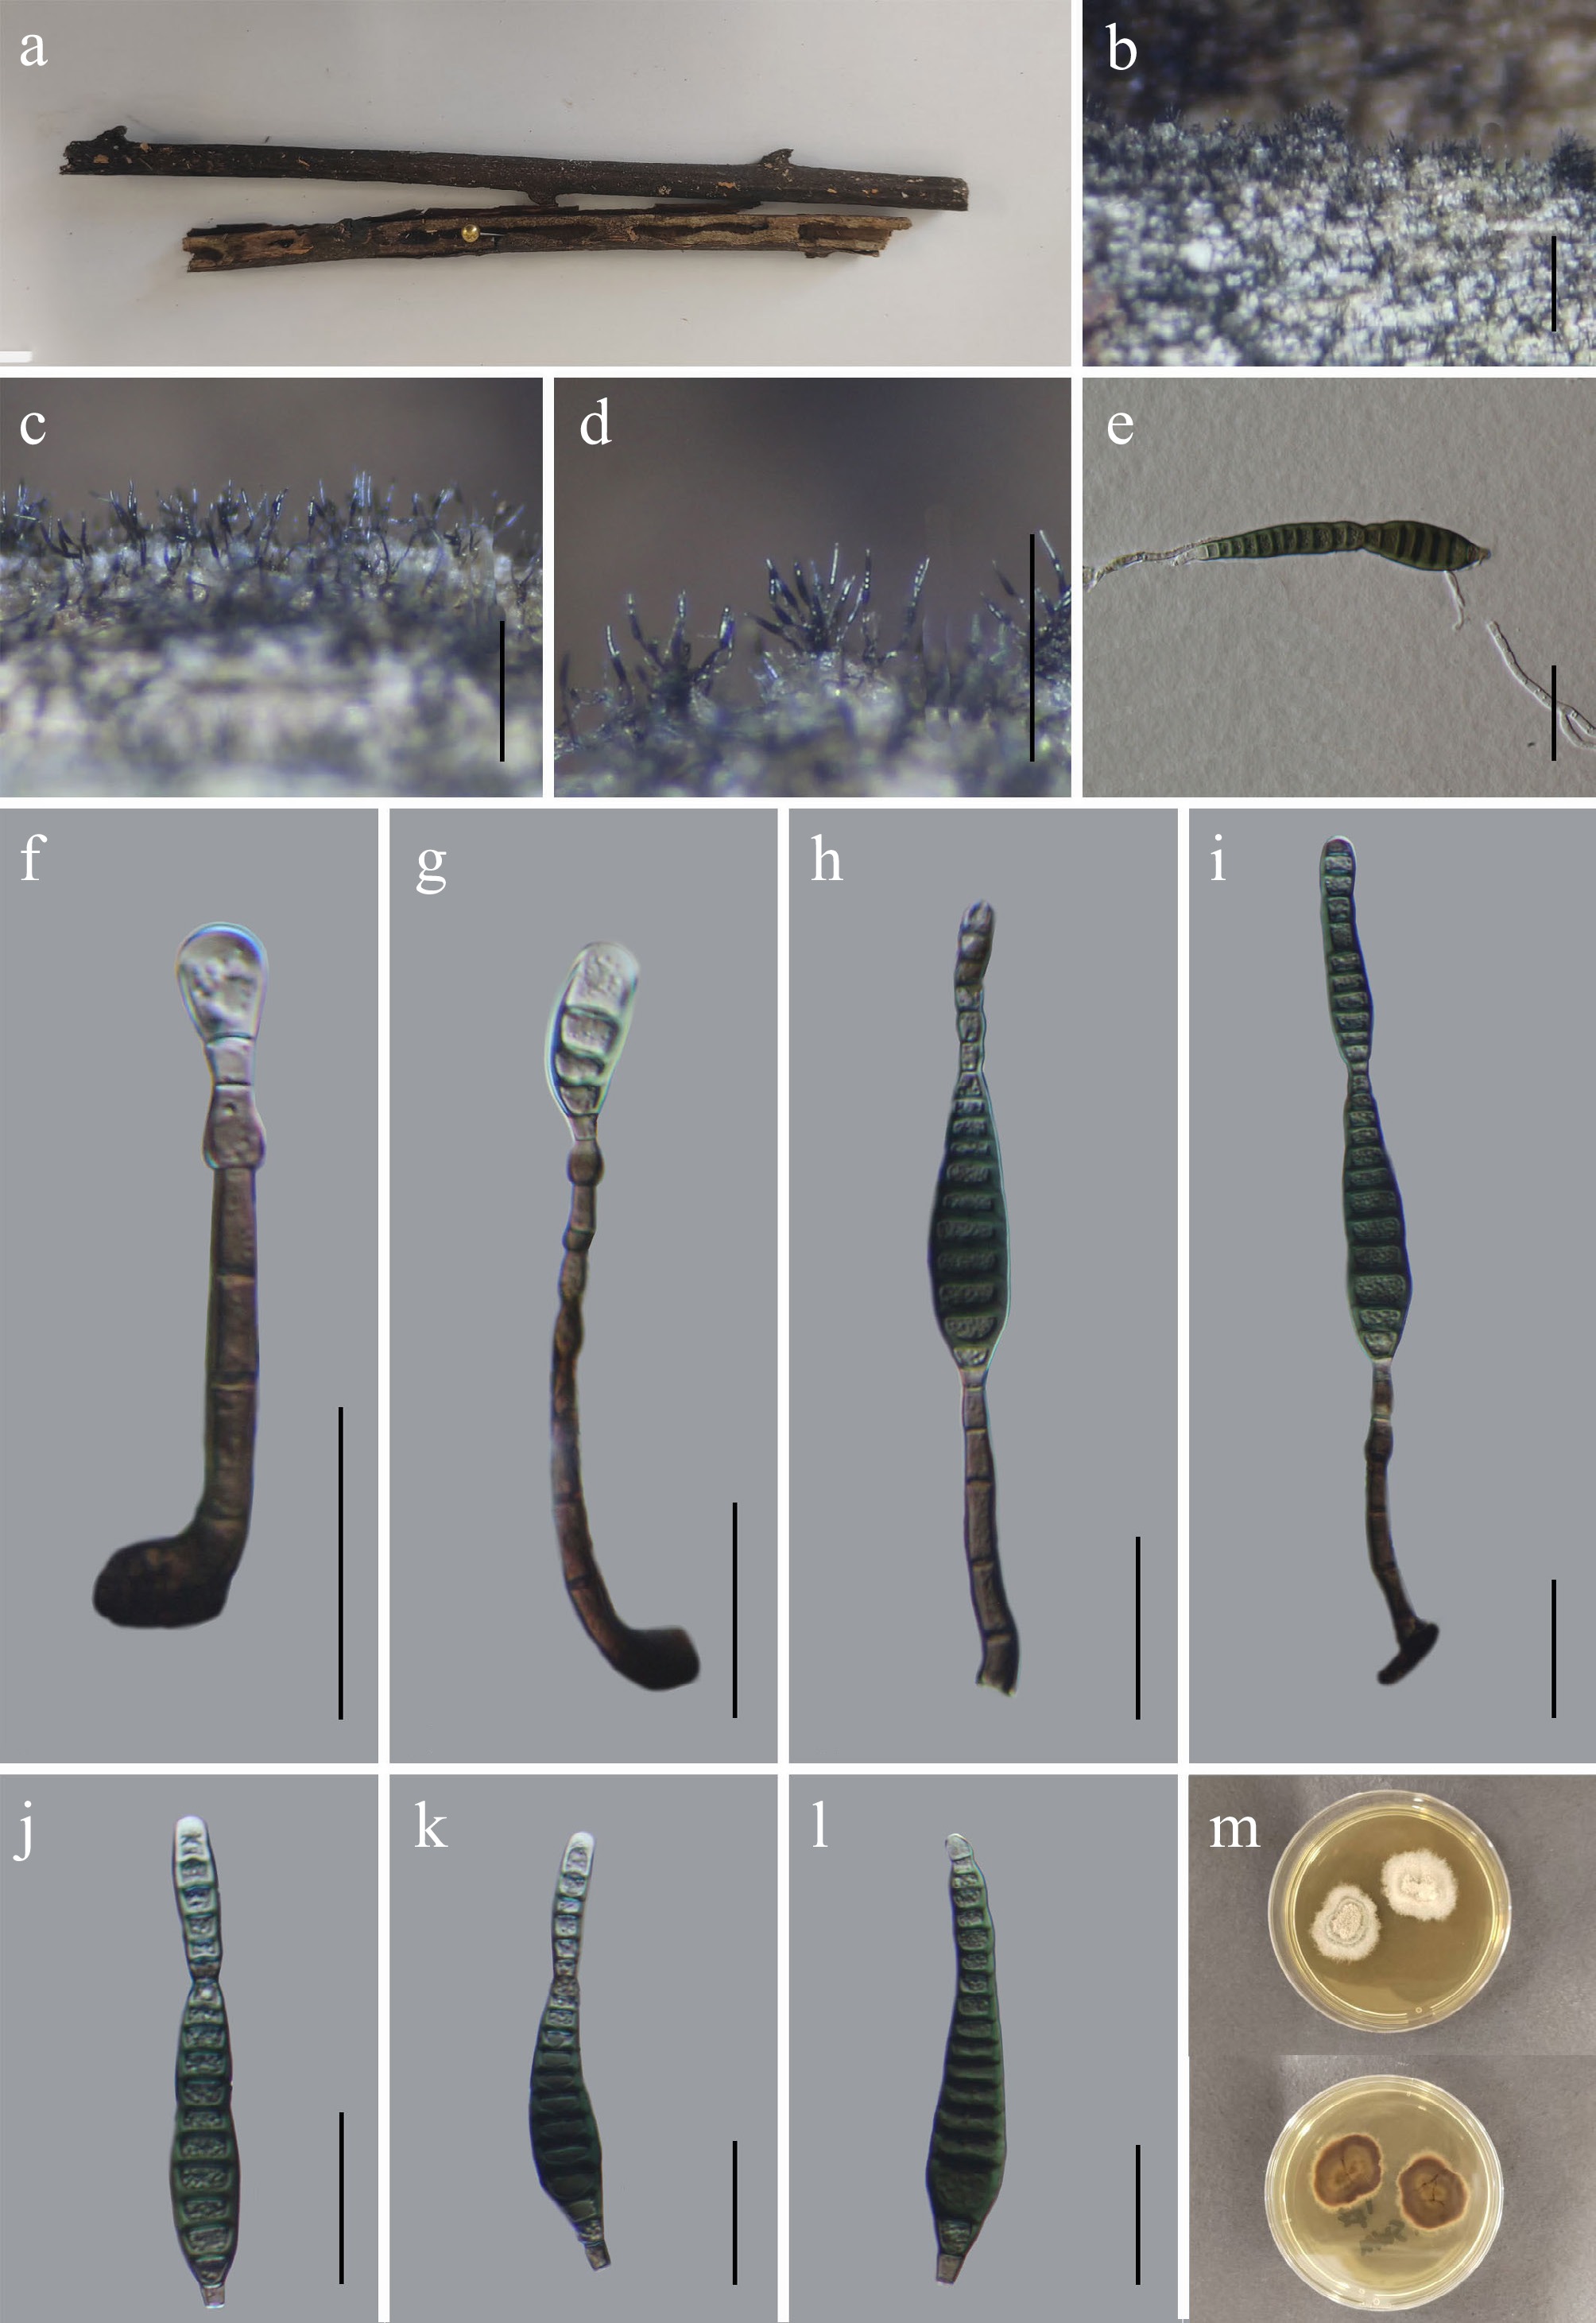
Figure 3.
Nigrograna chinensis (GMB6935 holotype). (a) Host. (b)–(d) Colonies on natural substrate. (e) Germinating conidium. (f)–(i) Conidiophores and conidia. (j)–(l) Conidia. (m) Surface and reverse view of culture on PDA. Scale bars: b = 1 mm, c, d = 0.5 mm, e–l = 30 μm.
-
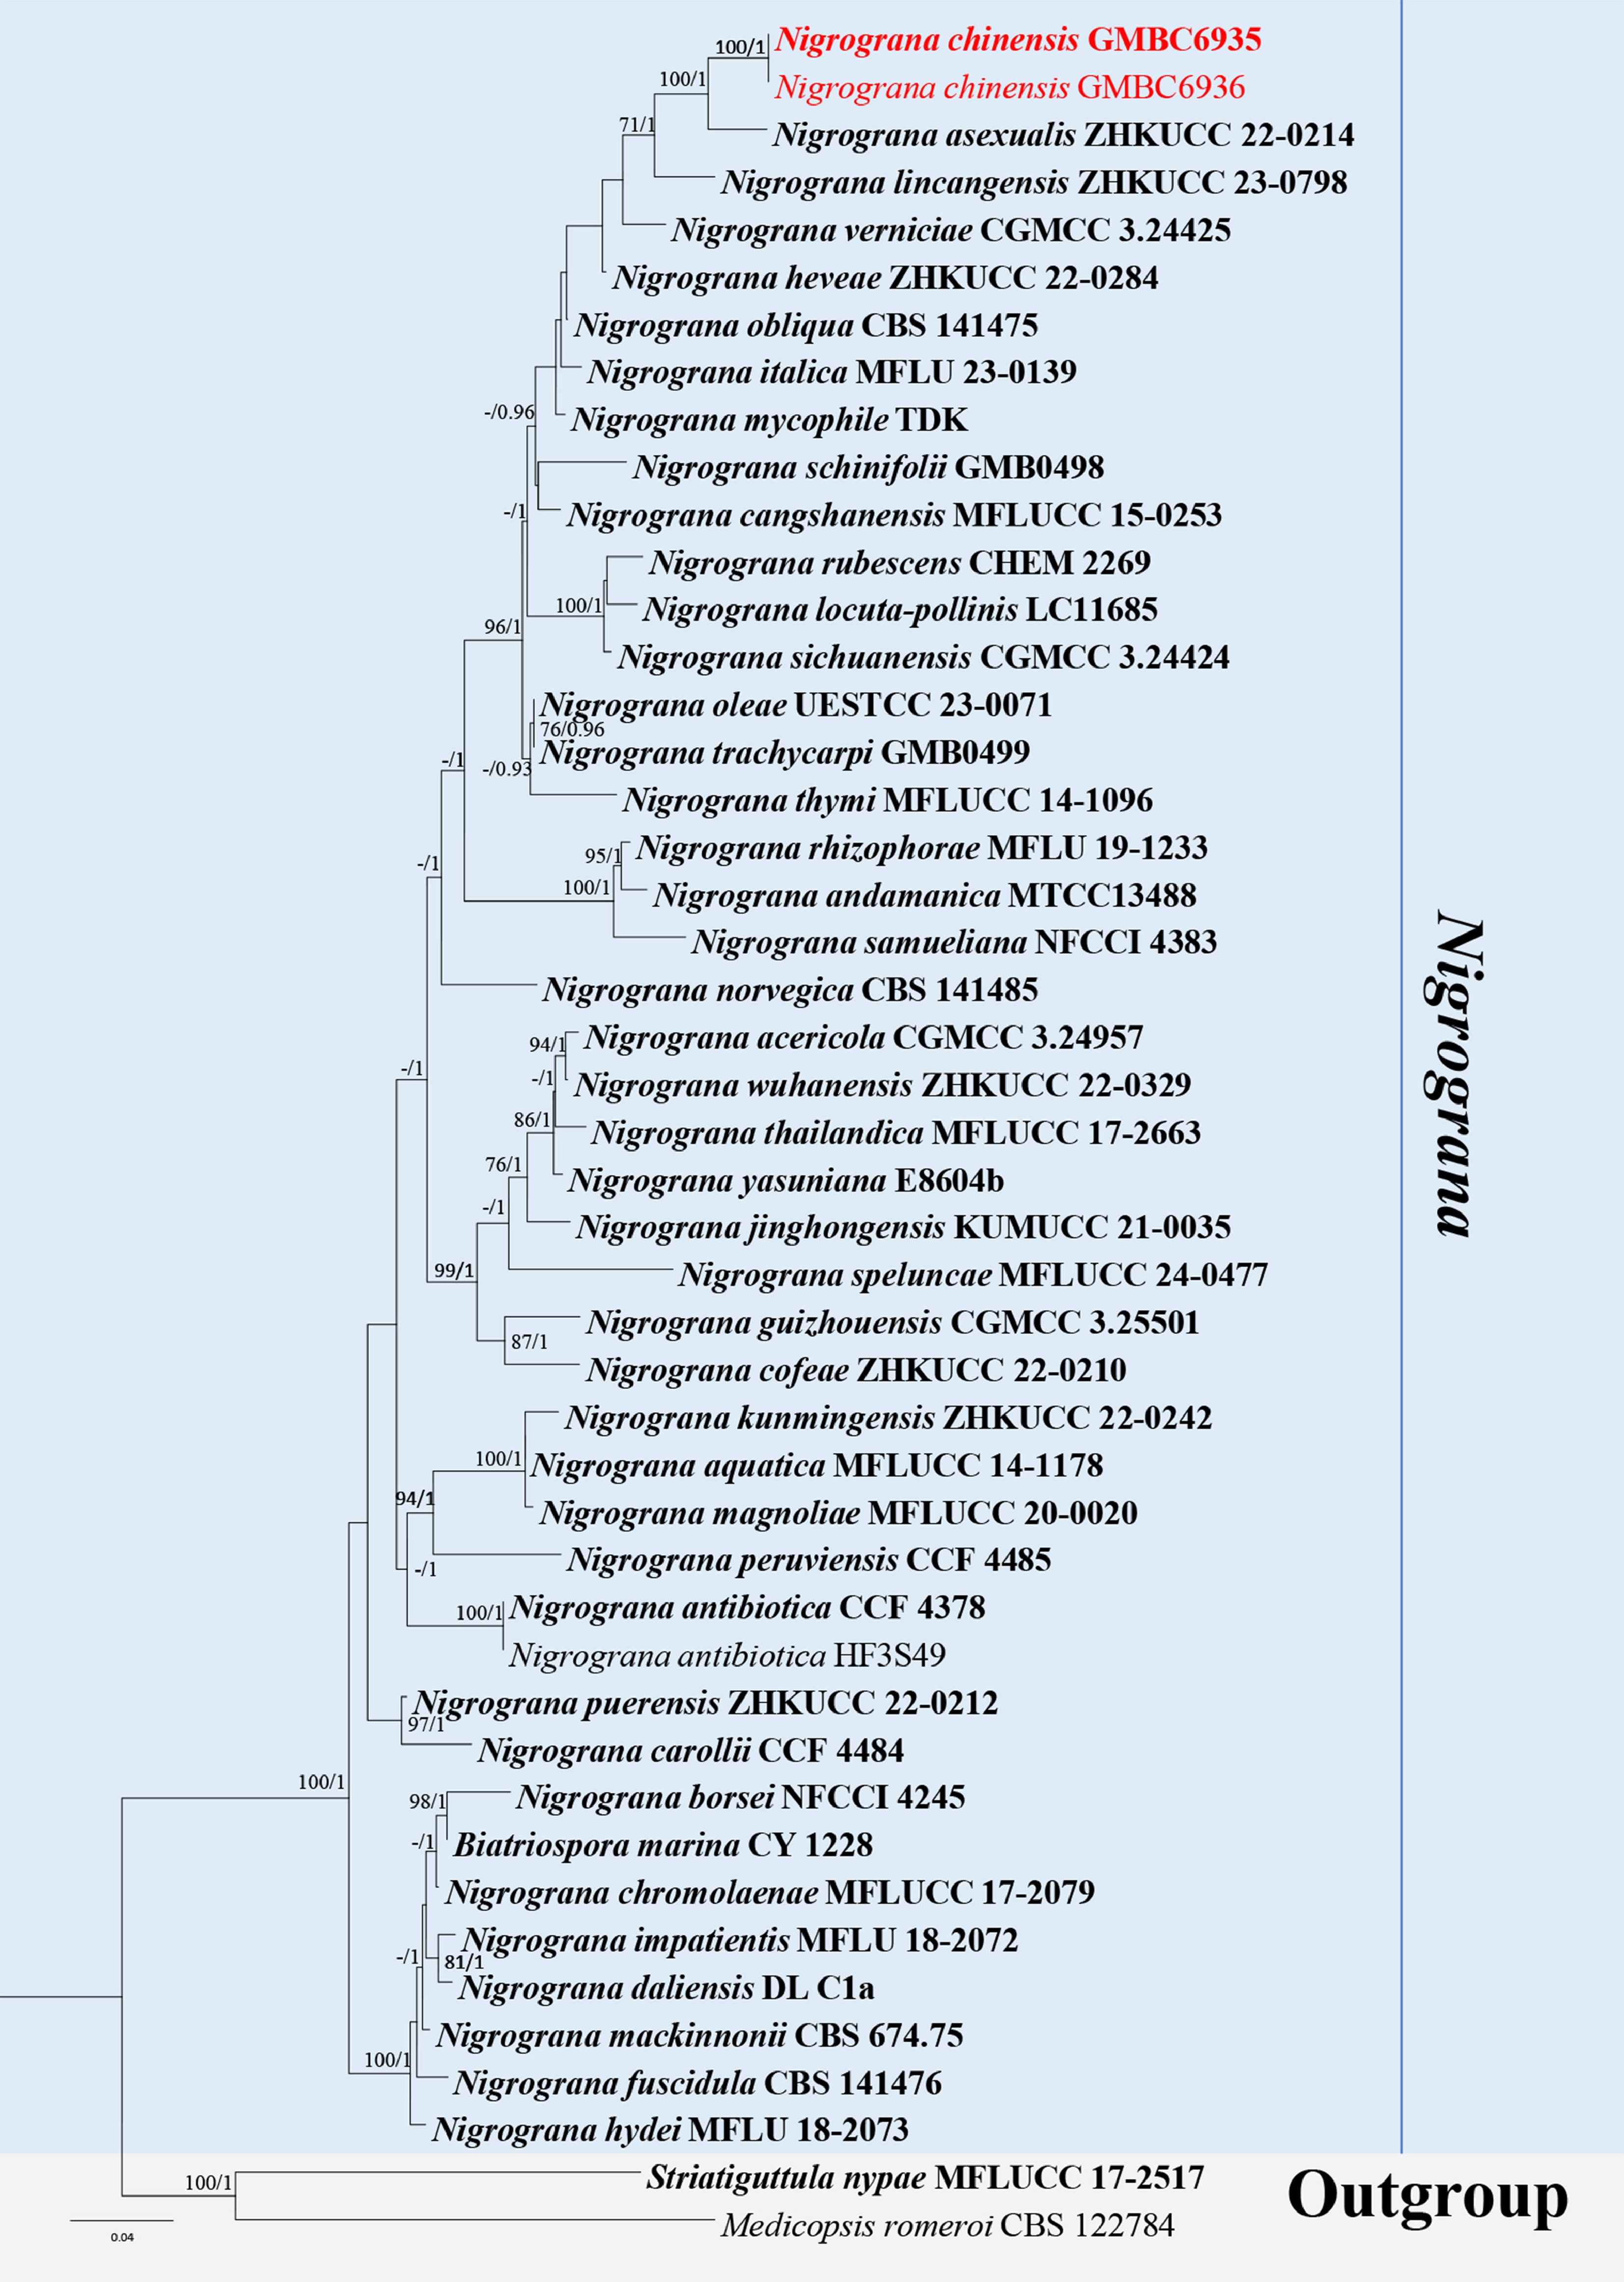
Figure 4.
ML tree of selected Nigrograna species based on the ITS-LSU-SSU-tef1-α-rpb2 dataset. The combined dataset comprised 47 taxa and 4,464 characters (ITS: 1–529 bp; LSU: 530–1,402 bp; SSU: 1,403–2,425 bp; tef1-α: 2,426–3,405 bp; rpb2: 3,406–4,464 bp), including indel regions. Maximum likelihood (lnL = −22,113.458225) and Bayesian analyses produced consistent tree topologies. Striatiguttula nypae (MFLUCC 17-2517) and Medicopsis romeroi (CBS122784) were selected as the outgroup taxa. Bayesian posterior probabilities (PP) ≥ 0.90 and RAxML bootstrap support values ≥ 70 % are shown on the branches. The newly described species is marked in red. Ex-type/type strains are indicated in bold.
-
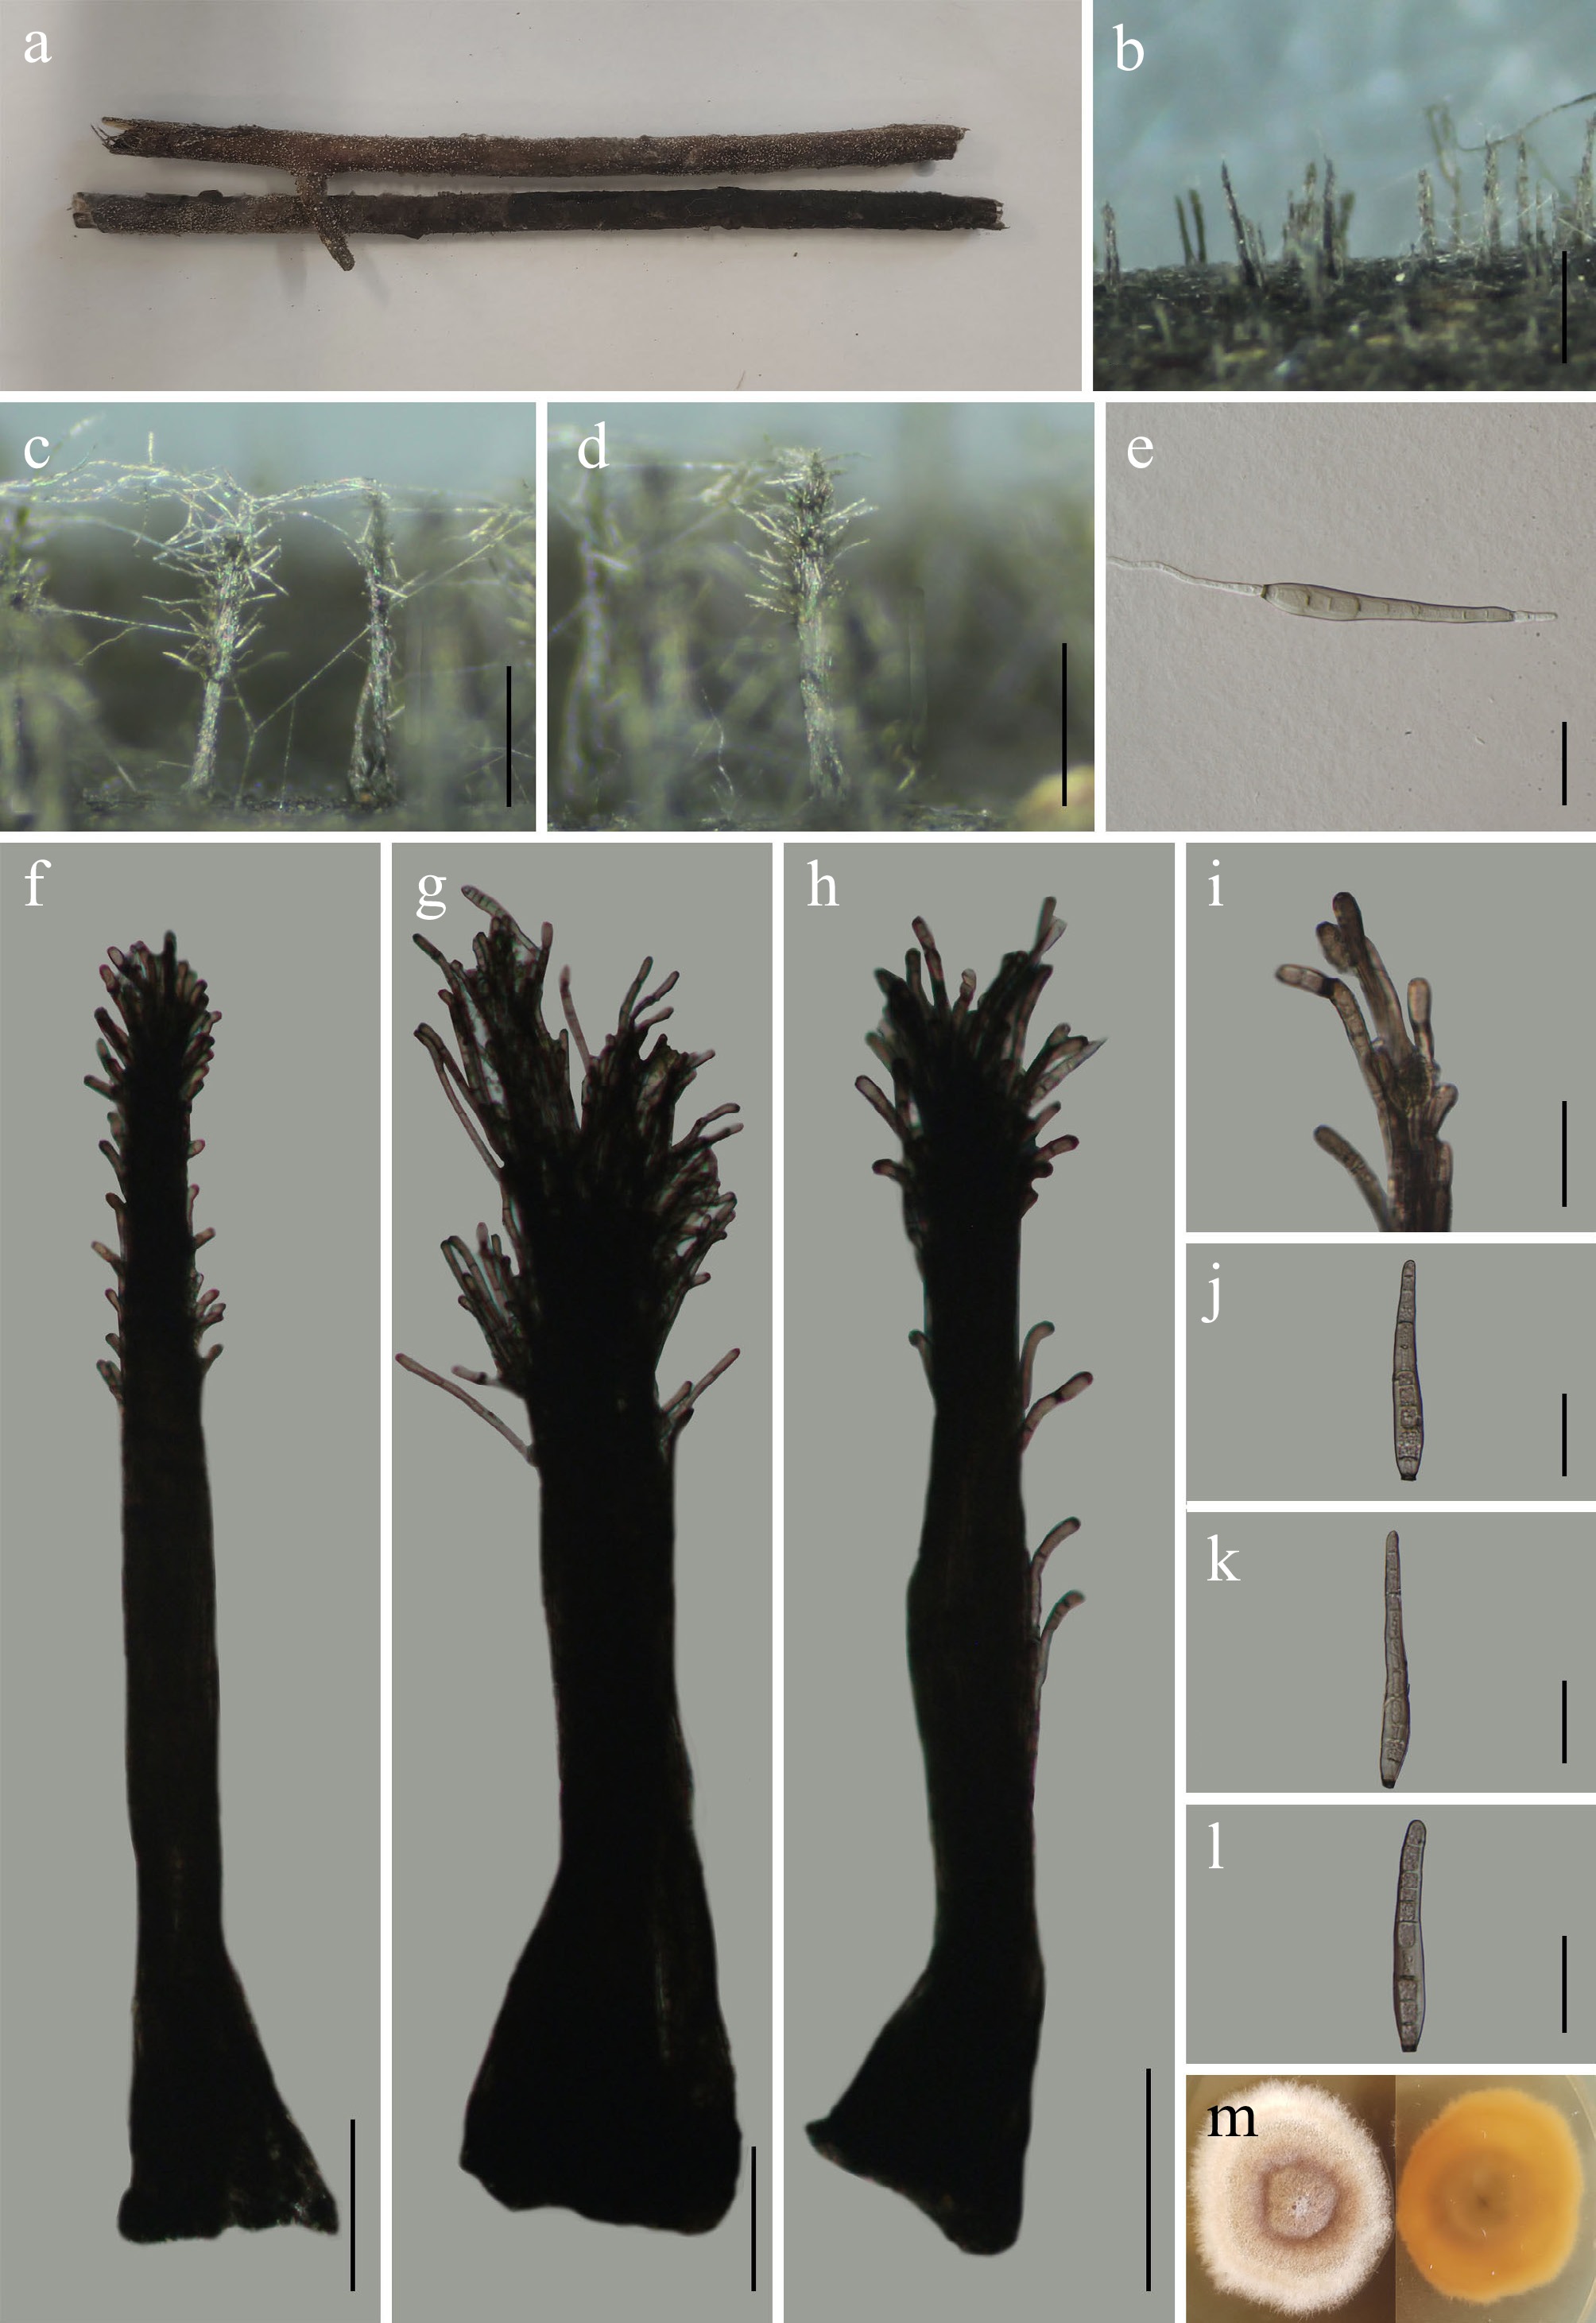
Figure 5.
Corynespora guizhouensis (GMB6927 holotype). (a) Host. (b)–(d) Colonies on natural substrate. (e) Germinating conidium. (f)–(h) Conidiophores and conidia. (i) Conidiogenous cells. (j)–(l) Conidia. (m) Surface and reverse view of culture on PDA. Scale bars: b = 1 mm, c–d = 0.5 mm, f–h = 100 μm, e, i–l = 30 μm.
-
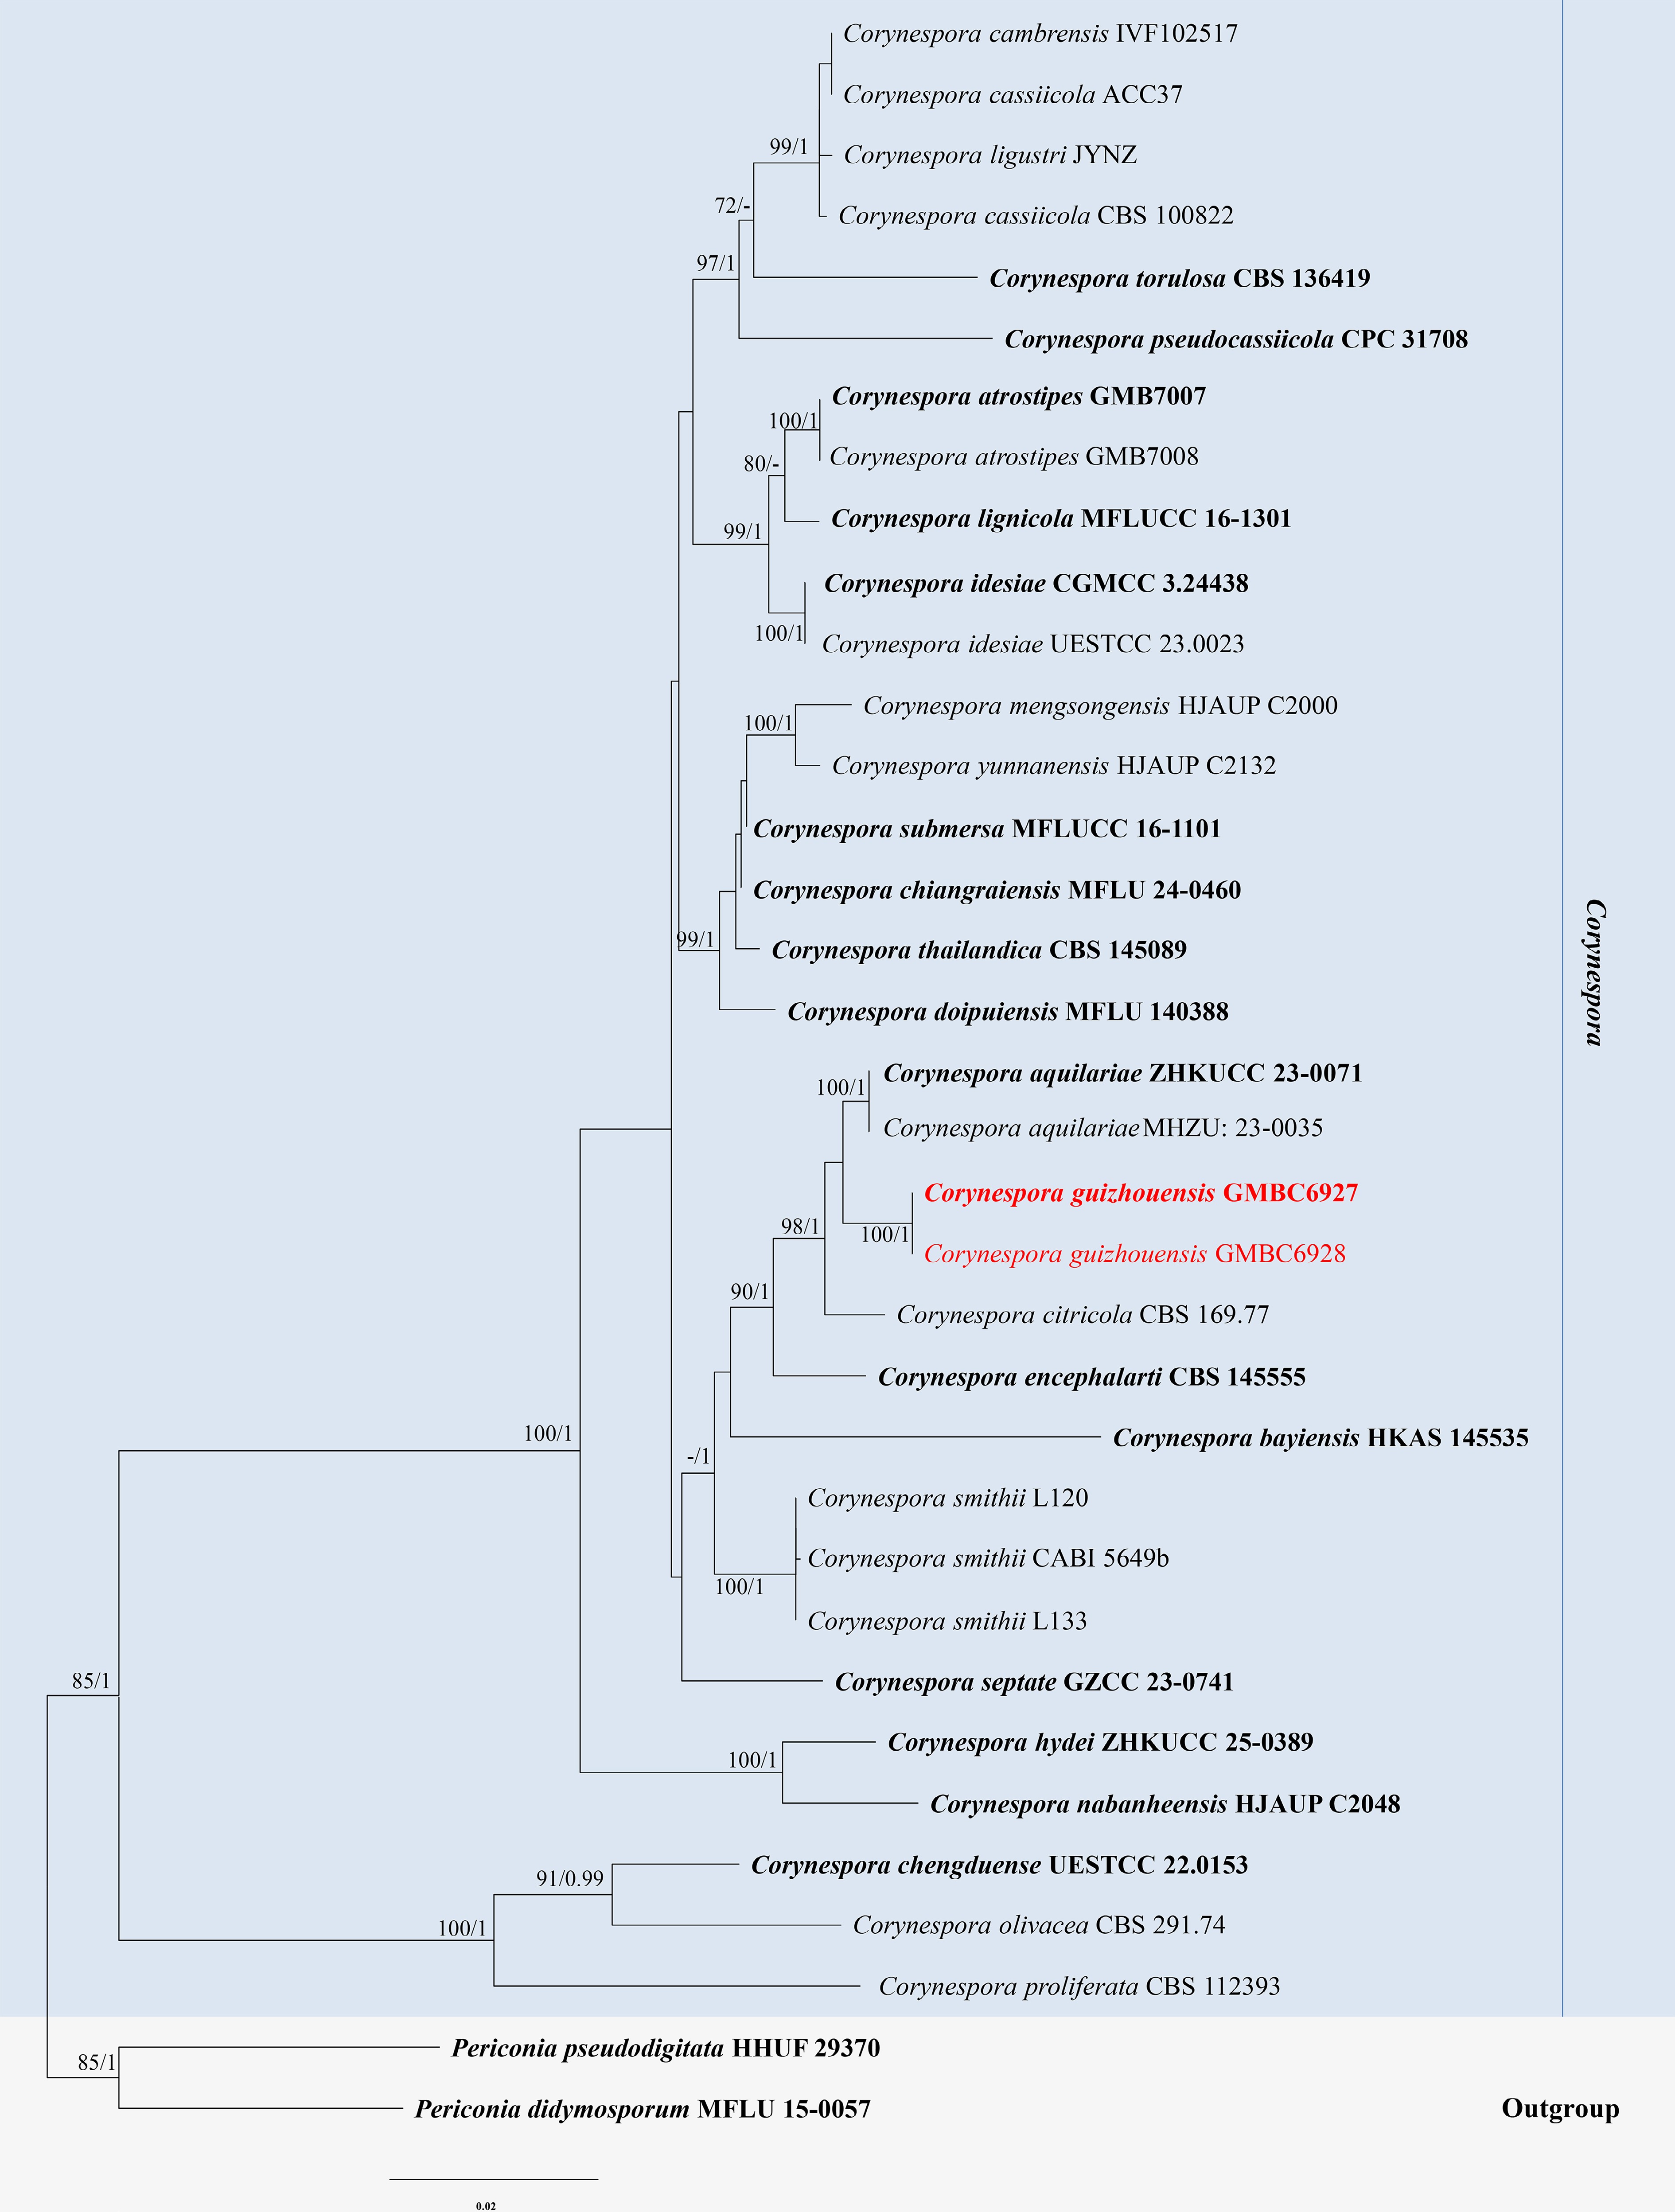
Figure 6.
ML tree of selected Corynespora species based on the ITS-LSU-SSU-tef1-α-rpb2 dataset. The combined dataset comprised 27 taxa and 3,207 characters (ITS: 1–437, LSU: 438–1,297, SSU: 1,298–2,307, tef1-α: 2,304–3,207). Maximum likelihood (lnL = −12,287.196510) and Bayesian analyses produced consistent tree topologies. Periconia digitata (CBS 510.77) and P. igniaria (CBS 845.96) were selected as the outgroup taxa. Bayesian posterior probabilities (PP) ≥ 0.90 and RAxML bootstrap support values ≥ 70 % are shown on the branches. The newly described species is marked in red. Ex-type/type strains are indicated in bold.
-
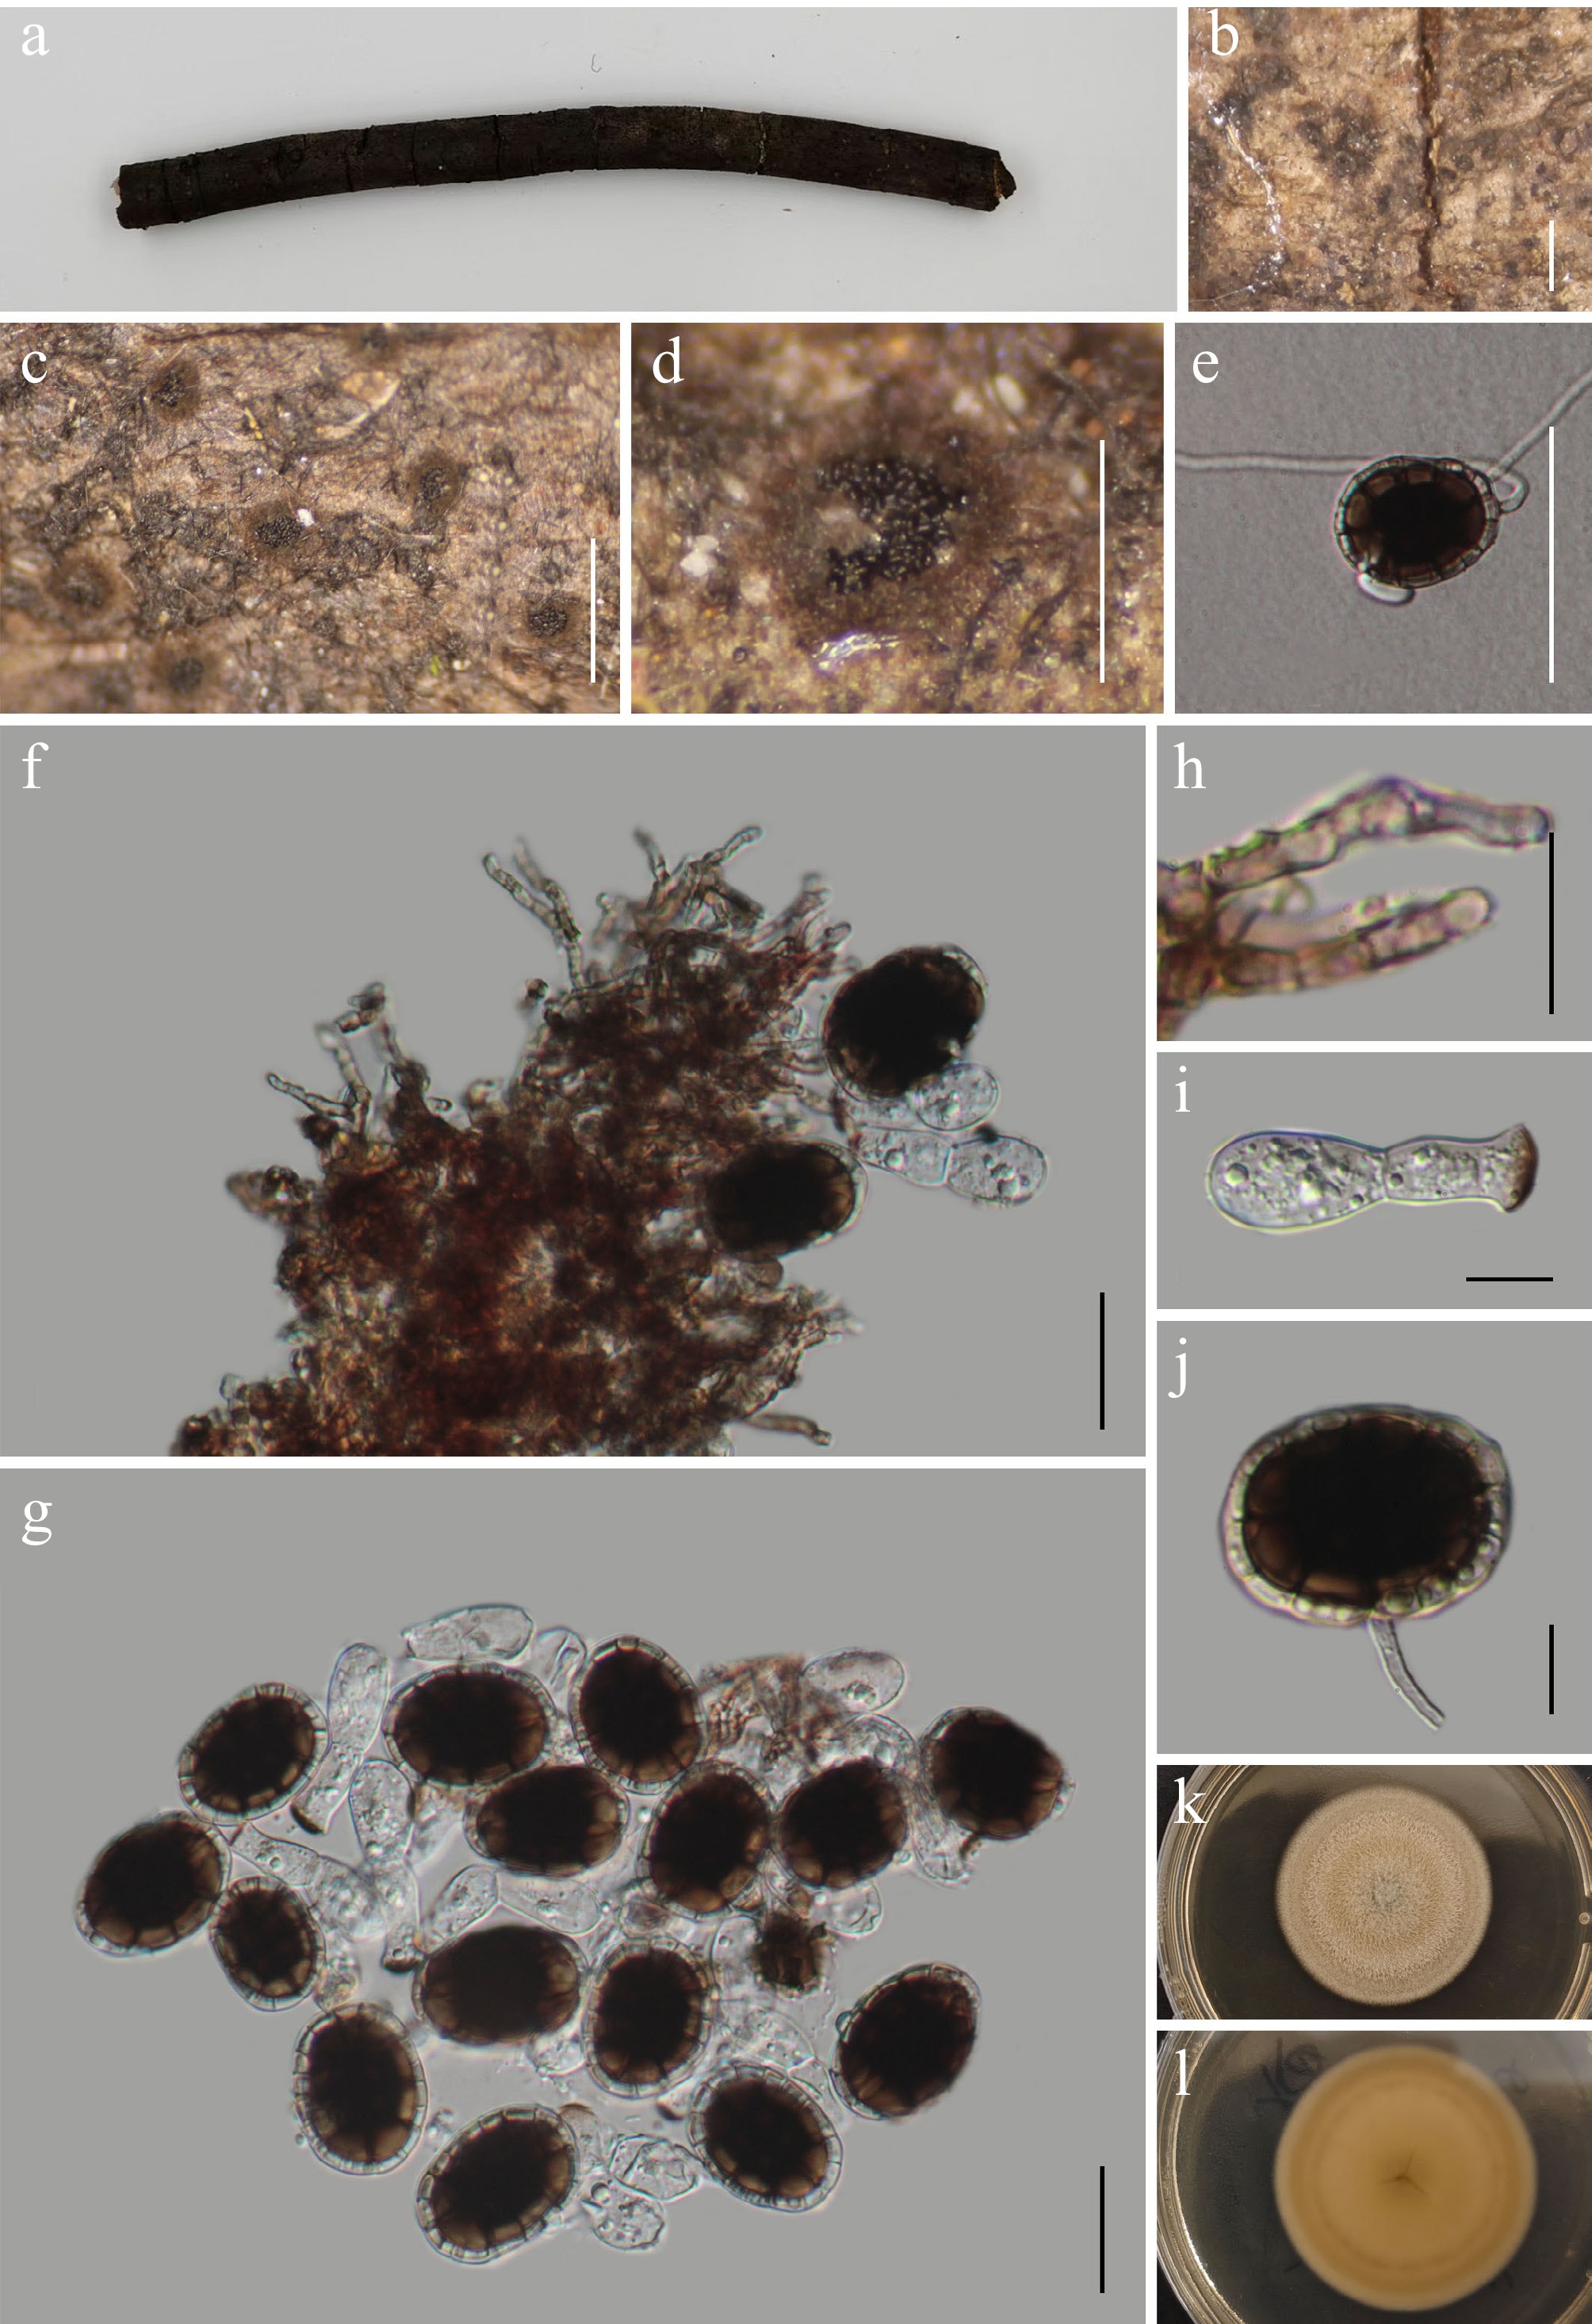
Figure 7.
Hermatomyces hyalodimorphus (GMB5172 holotype). (a) Host. (b)–(d) Colonies on natural substrate. (e) Germinating conidium. (f) Subicular hyphae and conidia. (g) Conidia. (h) Peripheral hyphae. (i) Hyaline conidium. (j) Lenticular conidium. (k), (l) Surface and reverse view of culture on PDA. Scale bars: b, c = 1 mm, d = 0.5 mm, e = 40 μm, f–h = 15 μm, i = 10 μm, j = 5 μm
-
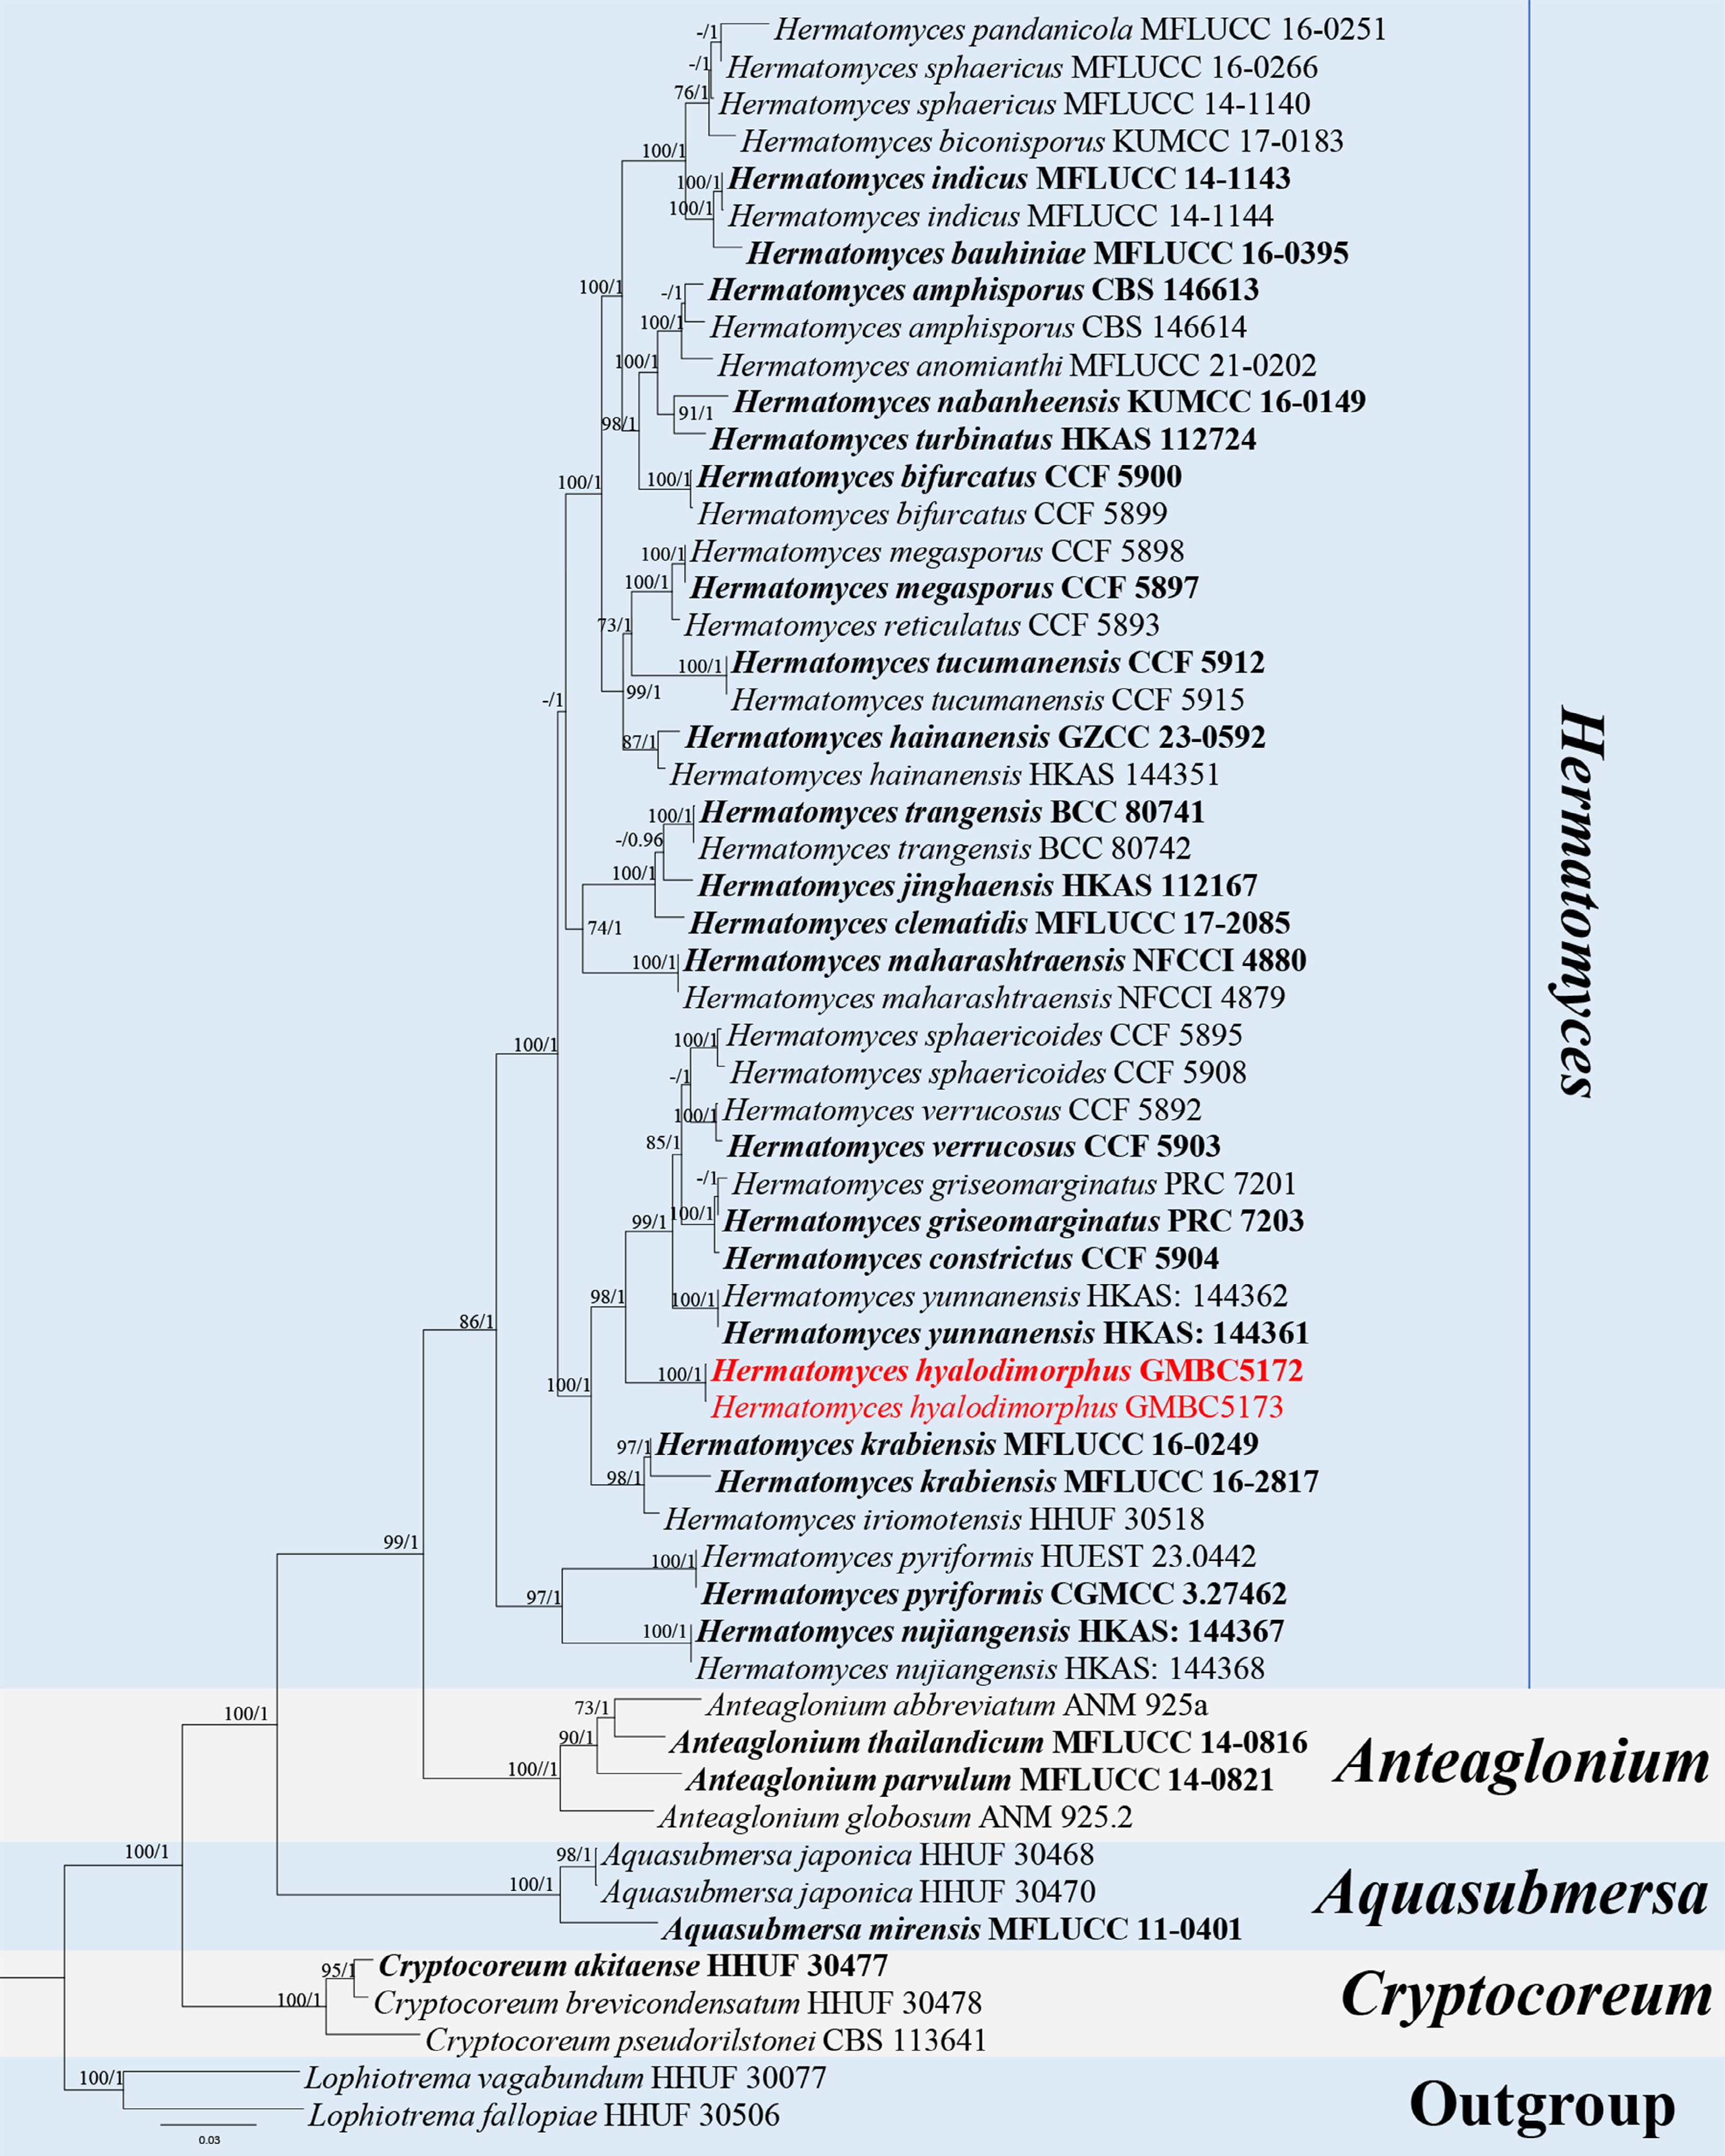
Figure 8.
ML tree of selected species of Hermatomyces and related genera inferred from a combined ITS-LSU- tef1-α-rpb2 dataset. The combined dataset comprised 57 taxa and 3,331 characters (ITS: 1–510 bp; LSU: 511–1,376 bp; tef1-α: 1,377–2,316 bp; rpb2: 2,317–3,331 bp), including indel regions. Maximum likelihood (lnL = −18,361.071594) and Bayesian analyses produced consistent tree topologies. Lophiotrema fallopiae (HHUF 30506) and L. vagabundum (HHUF 30077) were selected as the outgroup taxa. Bayesian posterior probabilities (PP) ≥ 0.90 and RAxML bootstrap support values ≥ 70 % are shown on the branches. The newly described species is marked in red. Ex-type/type strains are indicated in bold.
-
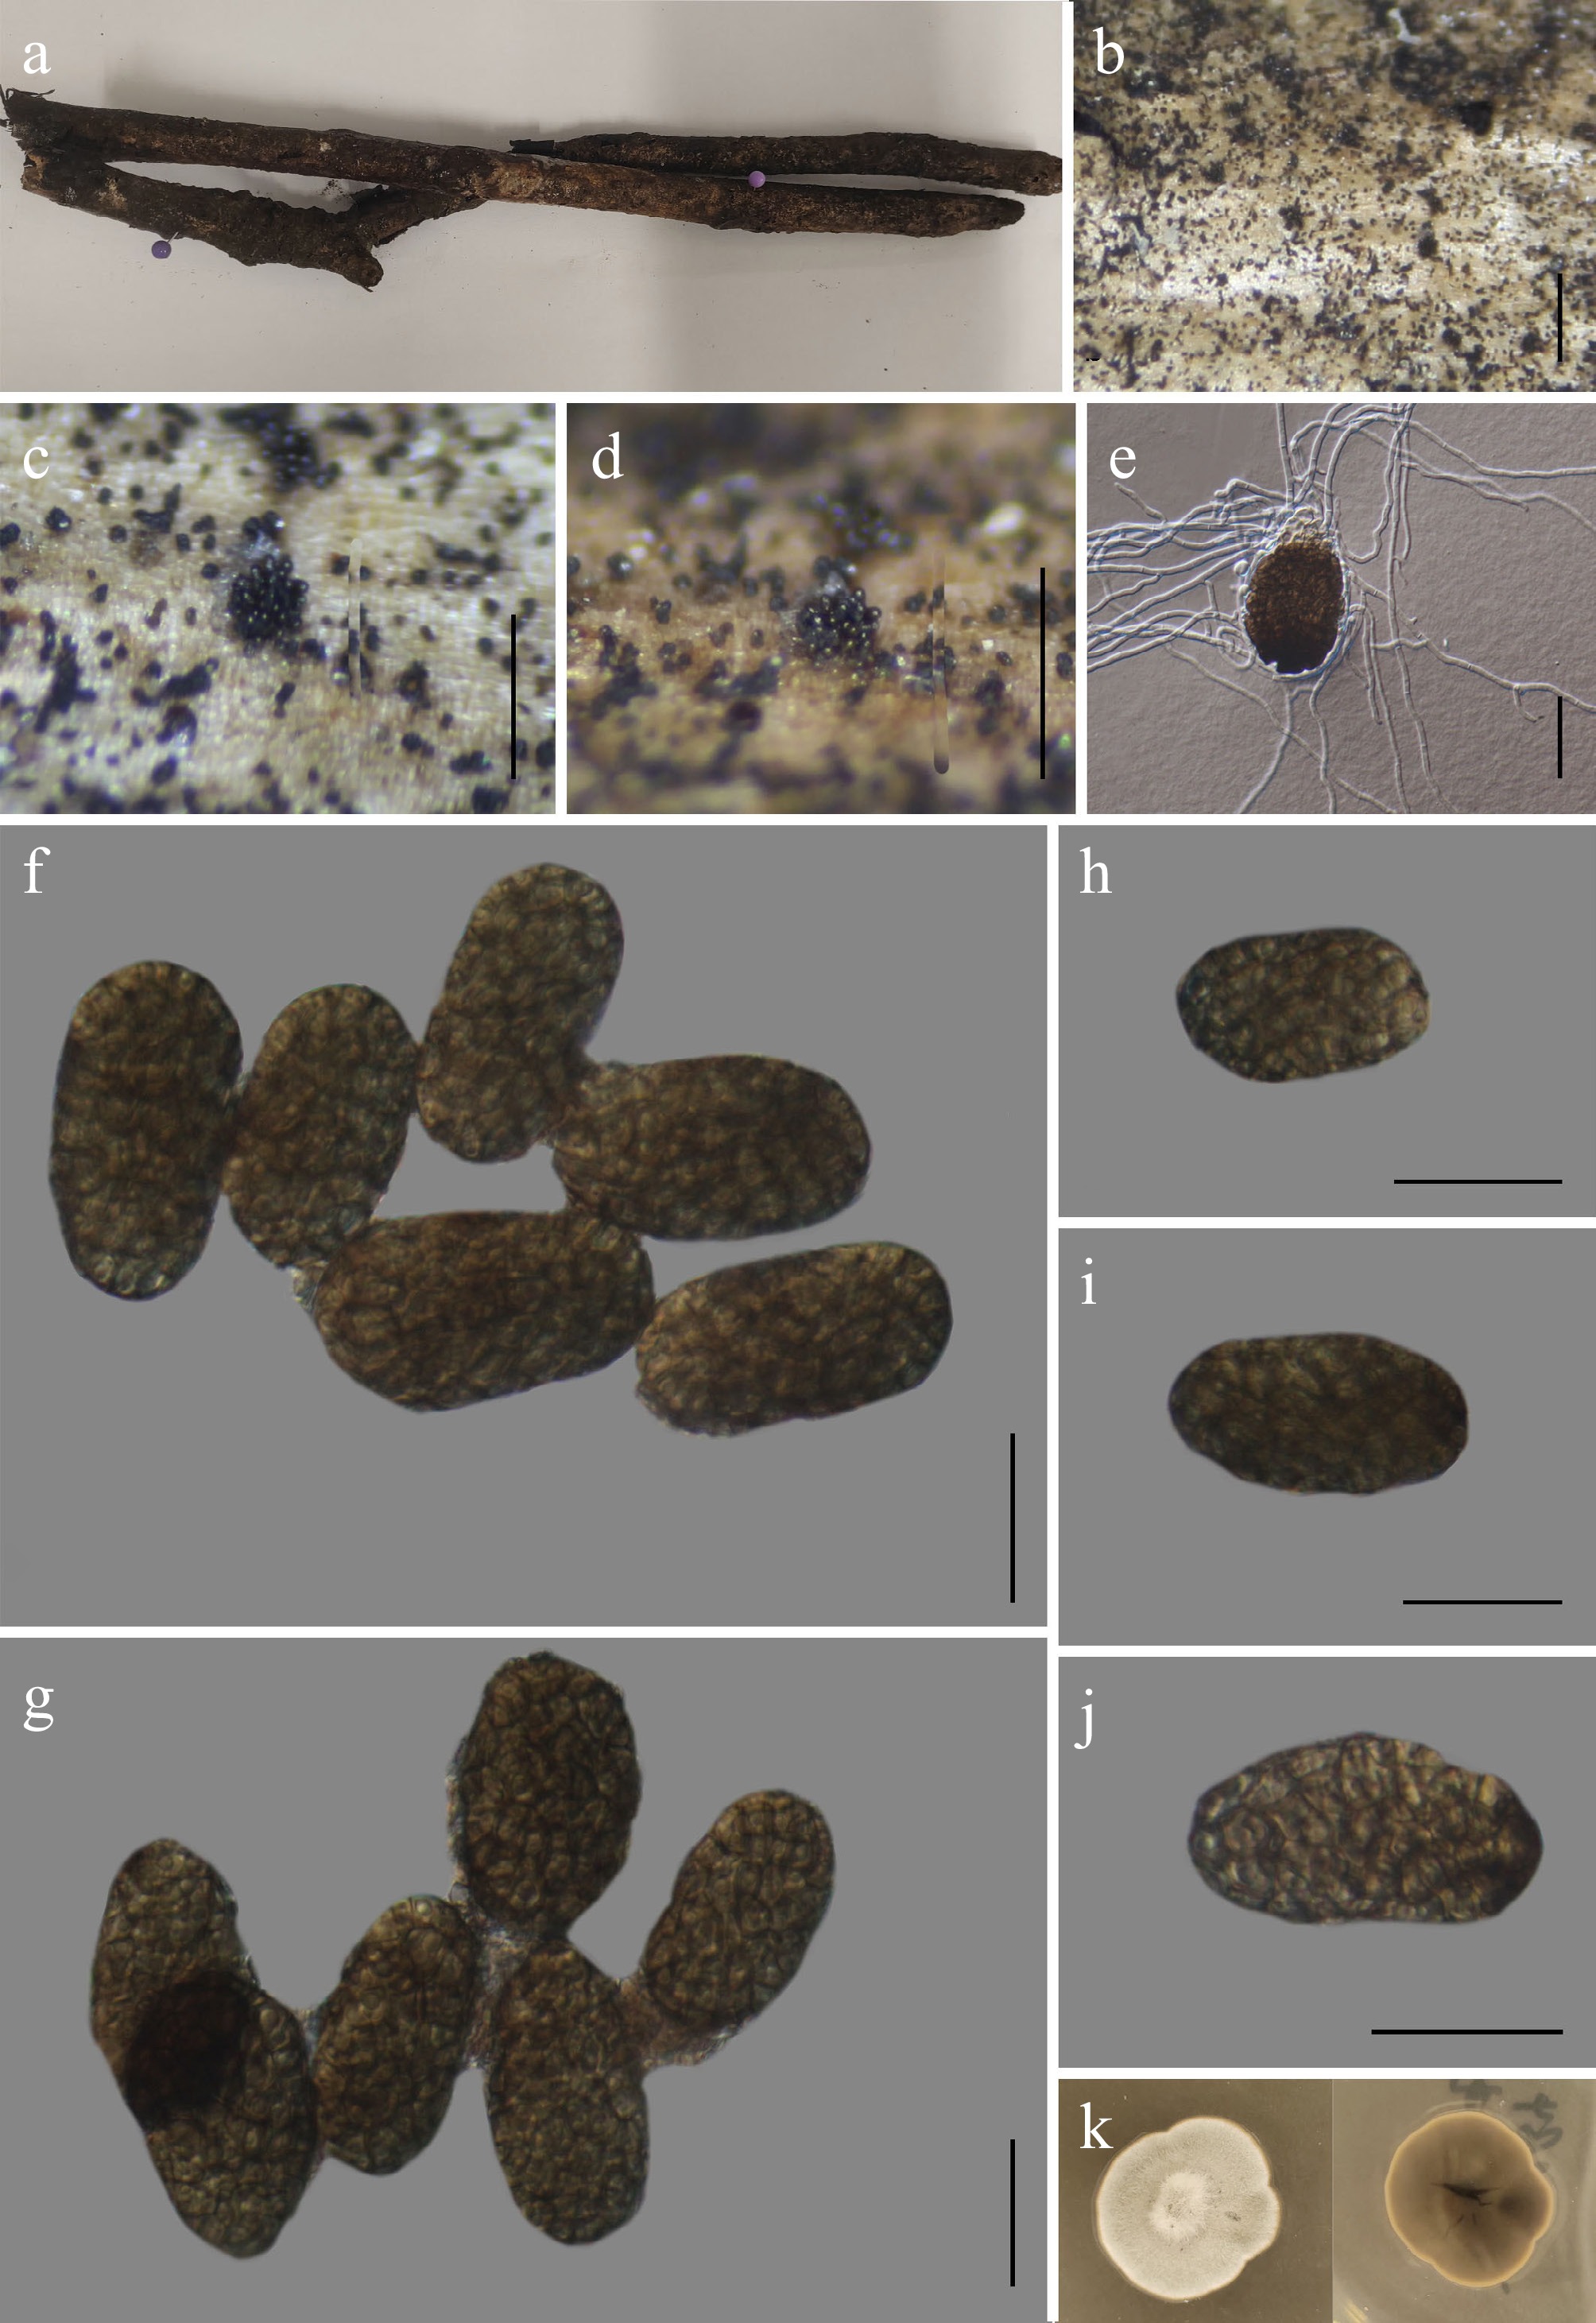
Figure 9.
Xenopleopunctum dictyosporum (GMB6953 holotype). (a) Host. (b)–(d) Colonies on natural substrate. (e) Germinating conidium. (f)–(j) Conidia. (k) Surface and reverse view of culture on PDA. Scale bars: b = 1 mm, c, d = 0.5 mm, f–j = 30μm.
-
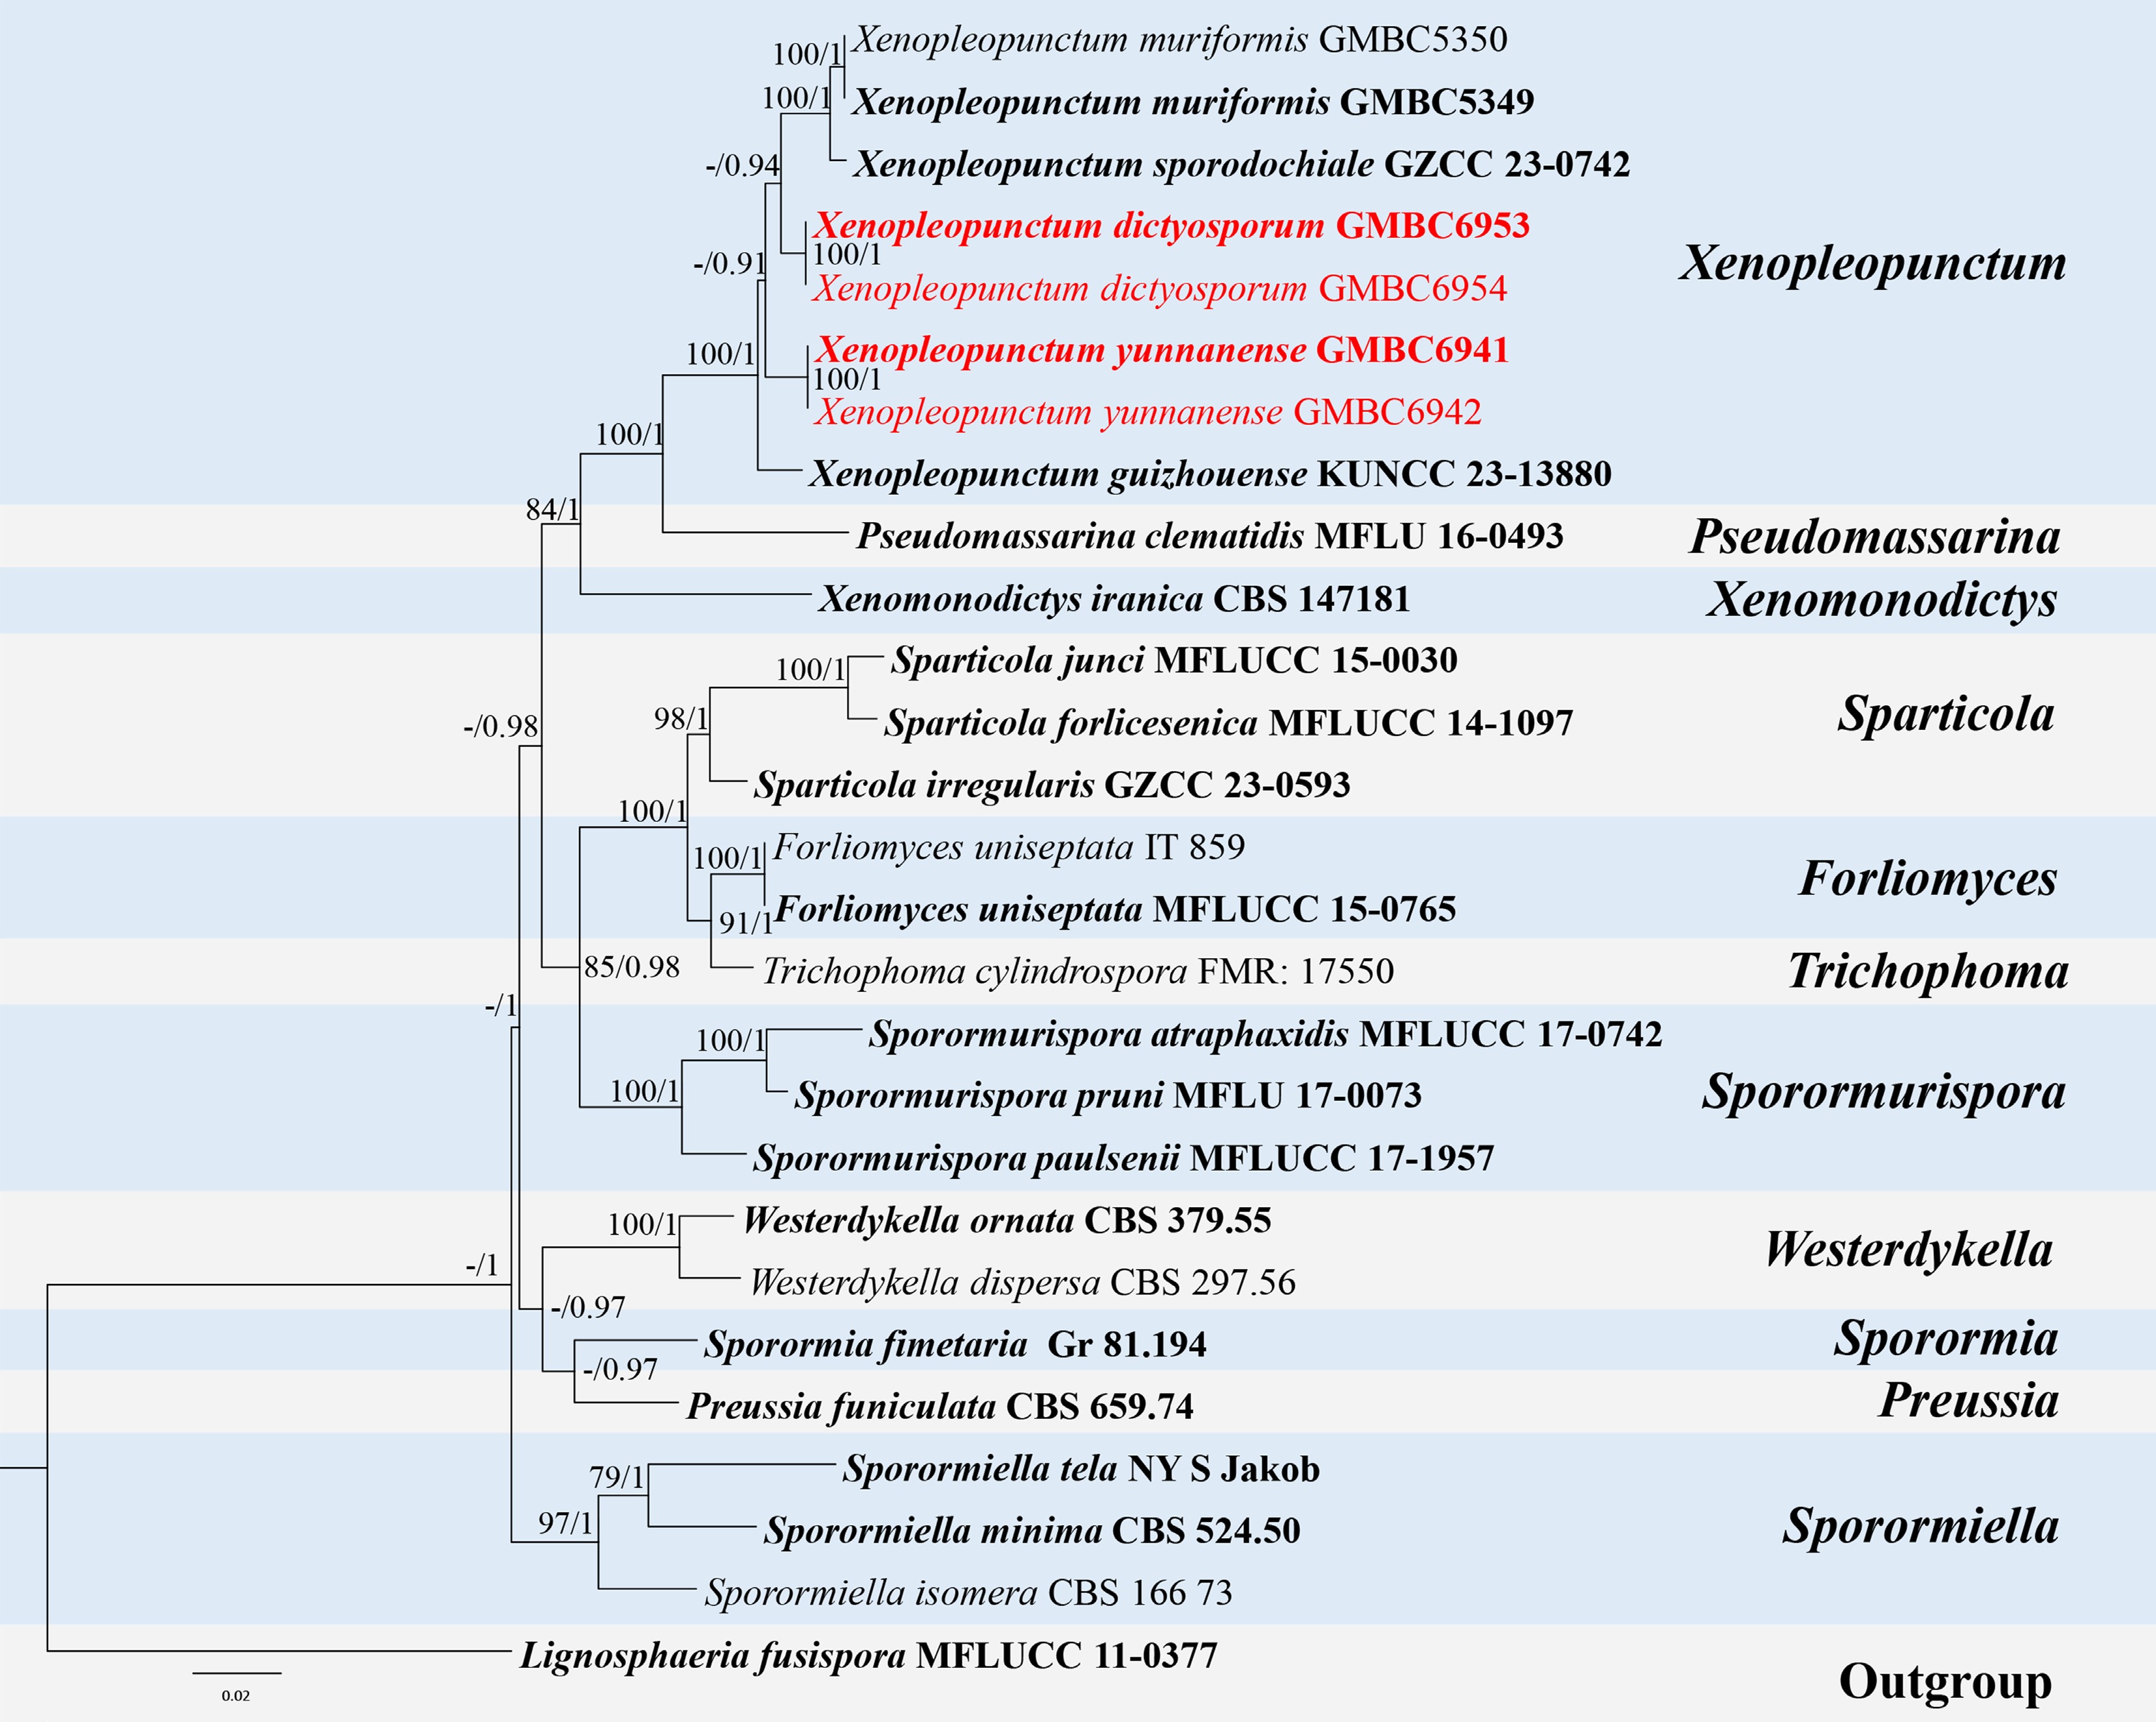
Figure 10.
ML tree of selected species of Xenopleopunctum and related genera inferred from a combined ITS-LSU-SSU dataset. The combined dataset comprised 27 taxa, 2,425 characters (ITS:1–514 bp; LSU: 515–1,418 bp; SSU: 1,419–2,425 bp), including indel regions. Maximum likelihood (lnL = −9,247.818154) and Bayesian analyses produced consistent tree topologies. Lignosphaeria fusispora (MFLUCC 11-0377) was selected as the outgroup taxon. Bayesian posterior probabilities (PP) ≥ 0.90 and RAxML bootstrap support values ≥ 70 % are shown on the branches. The newly described species are marked in red. Ex-type/type strains are indicated in bold.
-
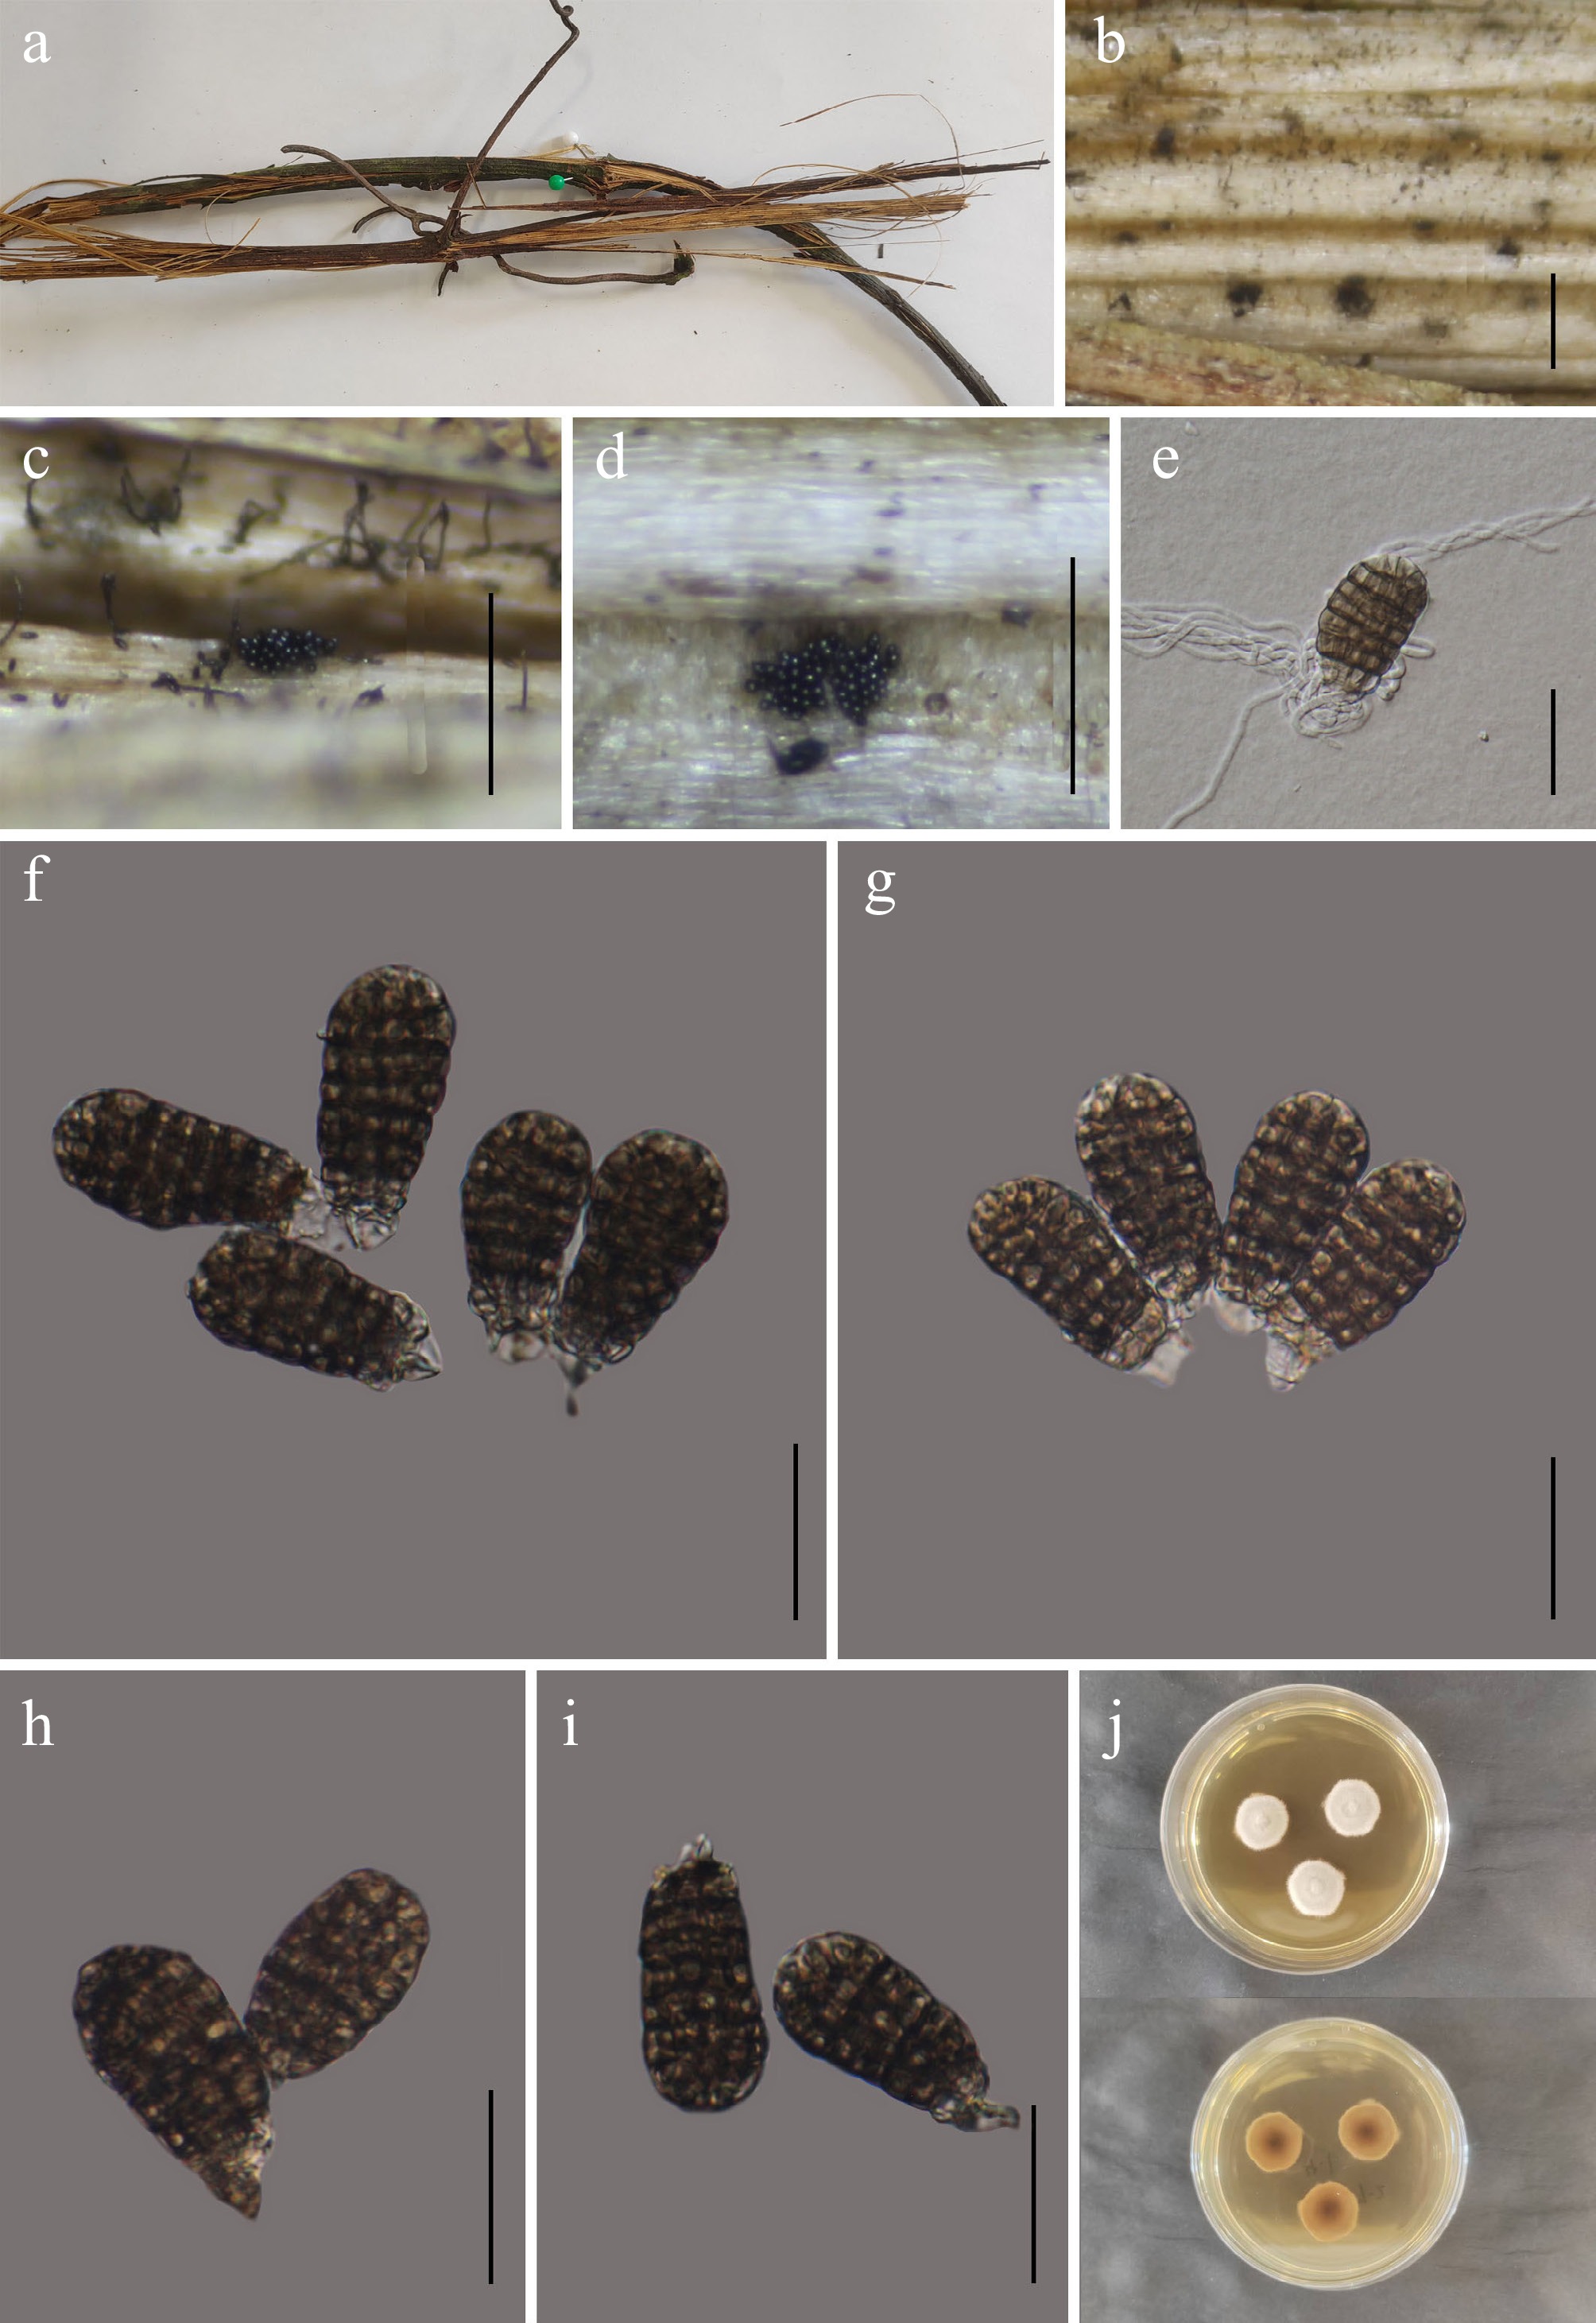
Figure 11.
Xenopleopunctum yunnanense (GMB6941 holotype). (a) Host. (b)–(d) Colonies on natural substrate. (e) Germinating conidium. (f)–(i) Conidia. (j) Surface and reverse view of colonies on PDA. Scale bars: b = 1 mm, c, d = 0.5 mm, e–i = 30 μm.
-
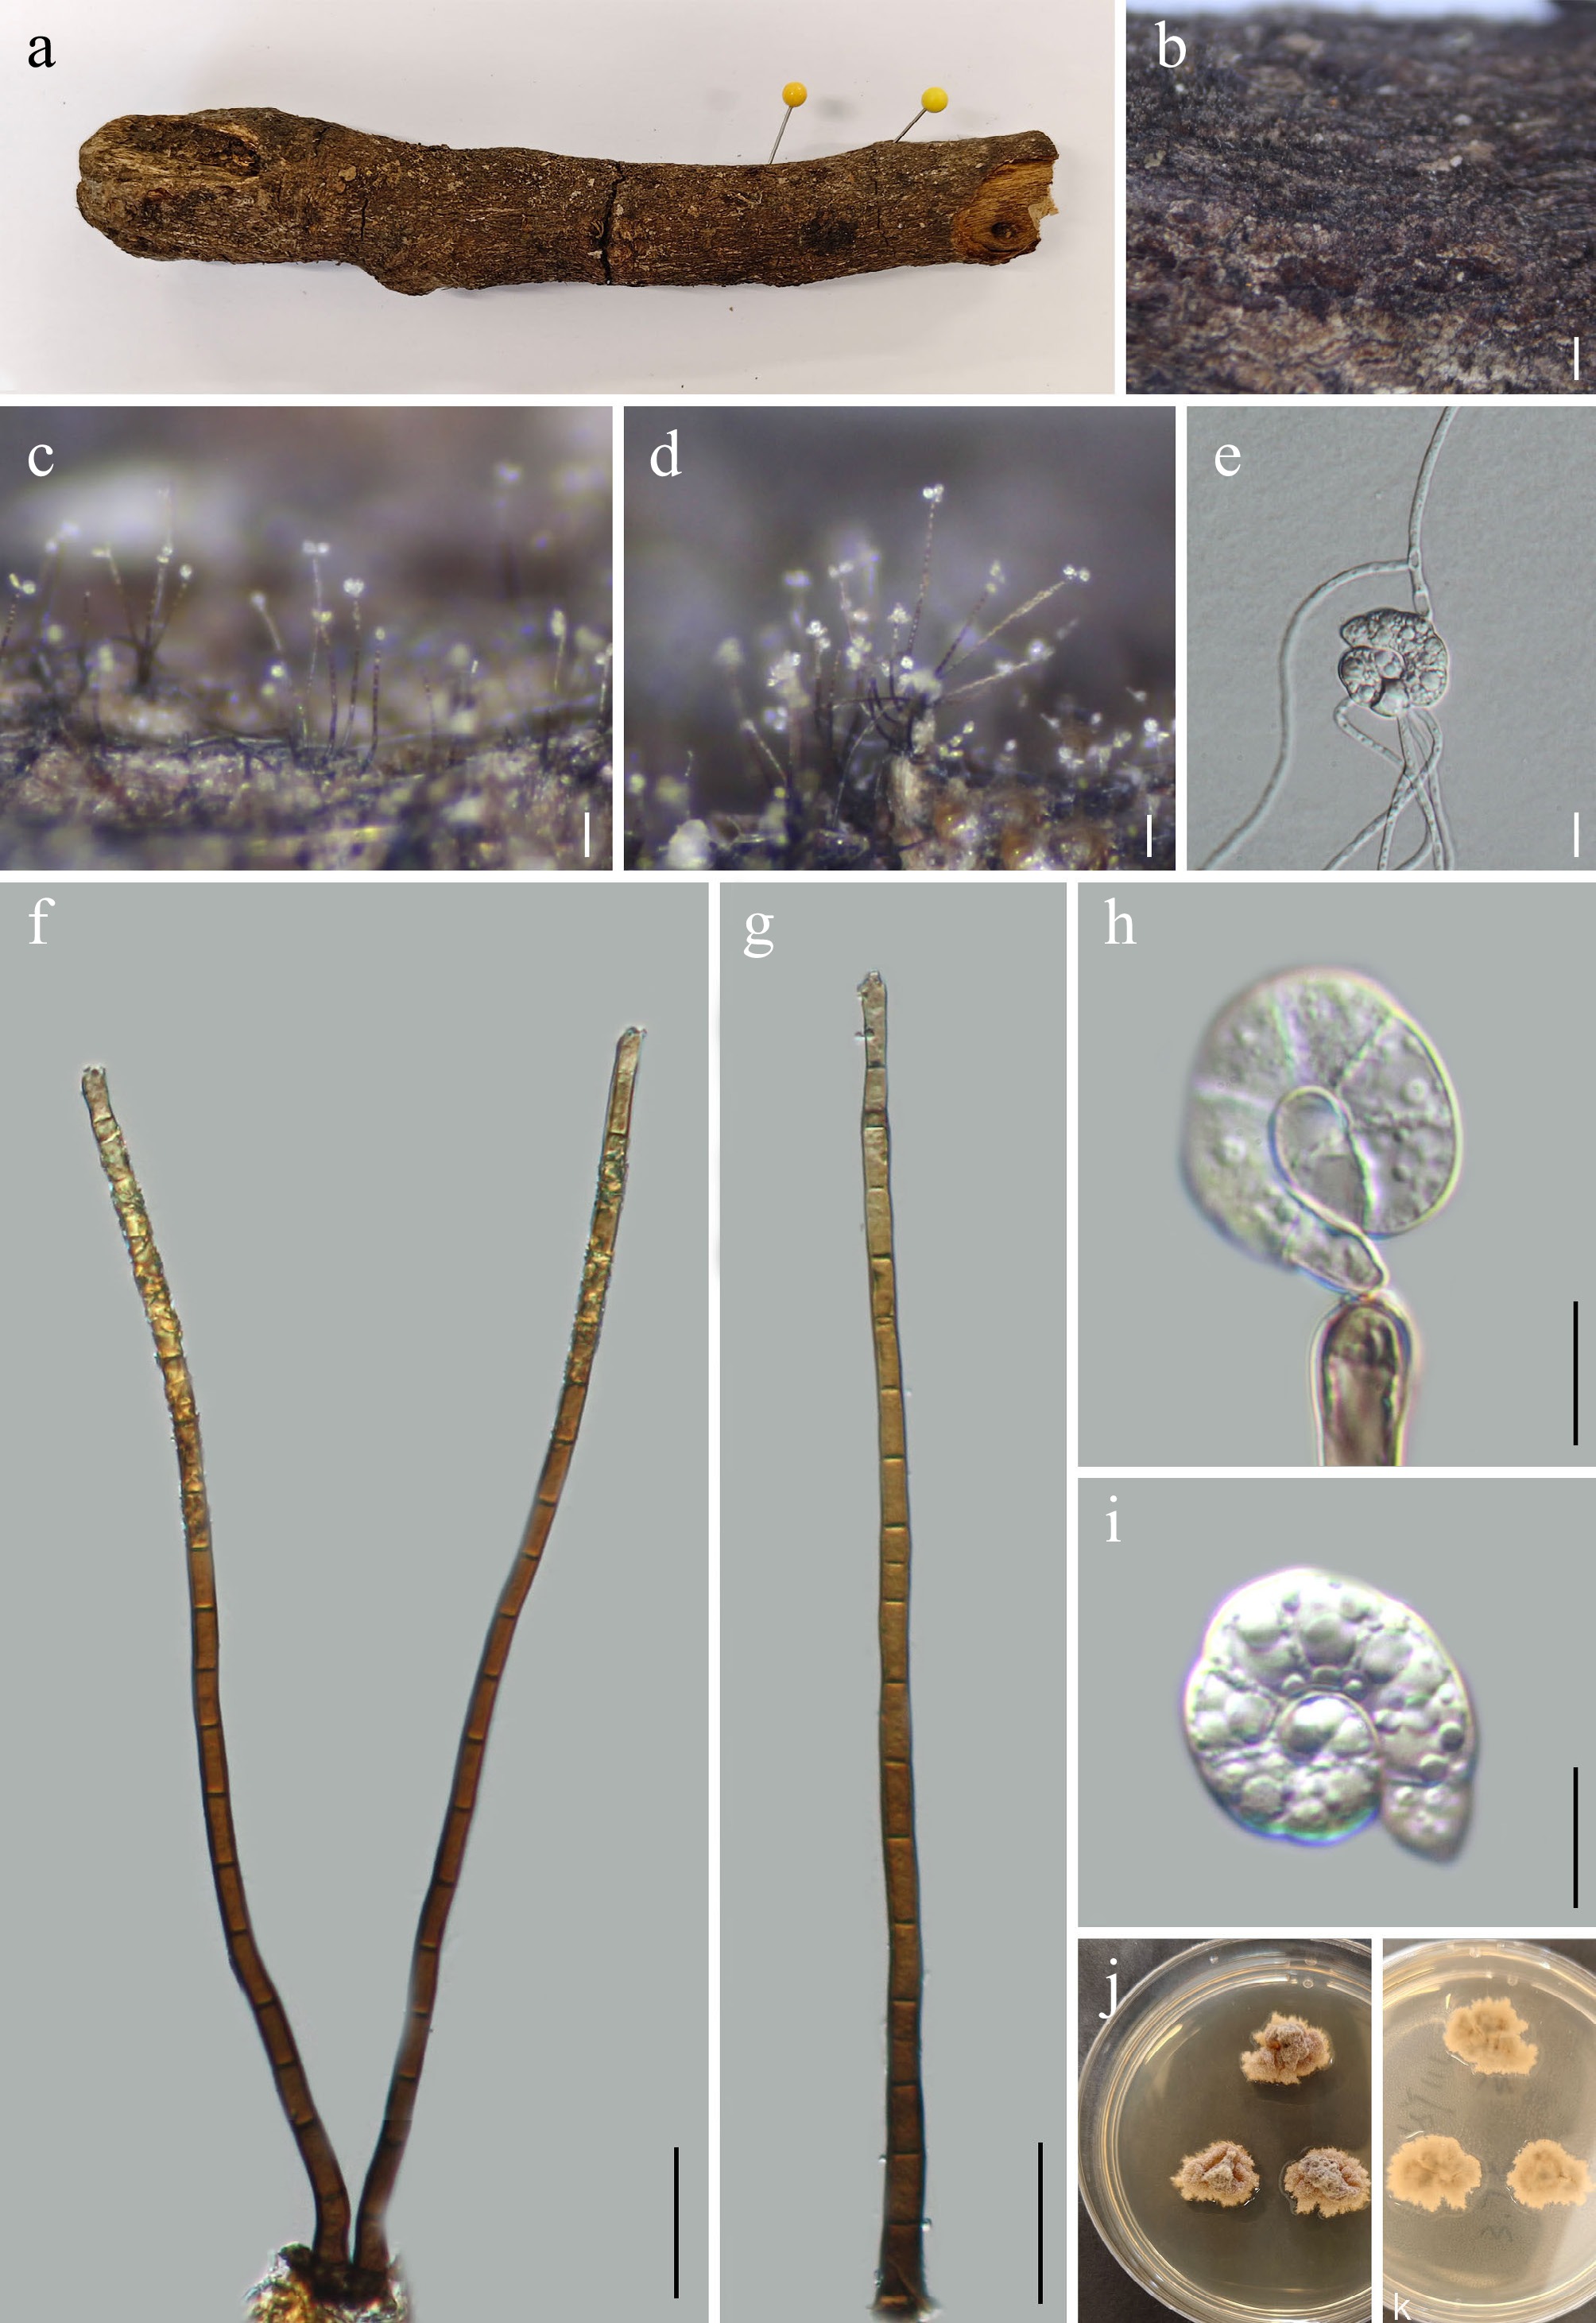
Figure 12.
Helicoma wuliangshanense (GMB5146 holotype). (a) Host. (b)–(d) Colonies on natural substrate. (e) Germinating conidium. (f), (g) Conidiophores. (h) Conidiogenous cells. (i) Conidium. (j), (k) Surface and reverse view of culture on PDA. Scale bars: b = 1 mm, c, d = 0.5 mm, f, g = 50 μm, e, h, i = 10 μm.
-
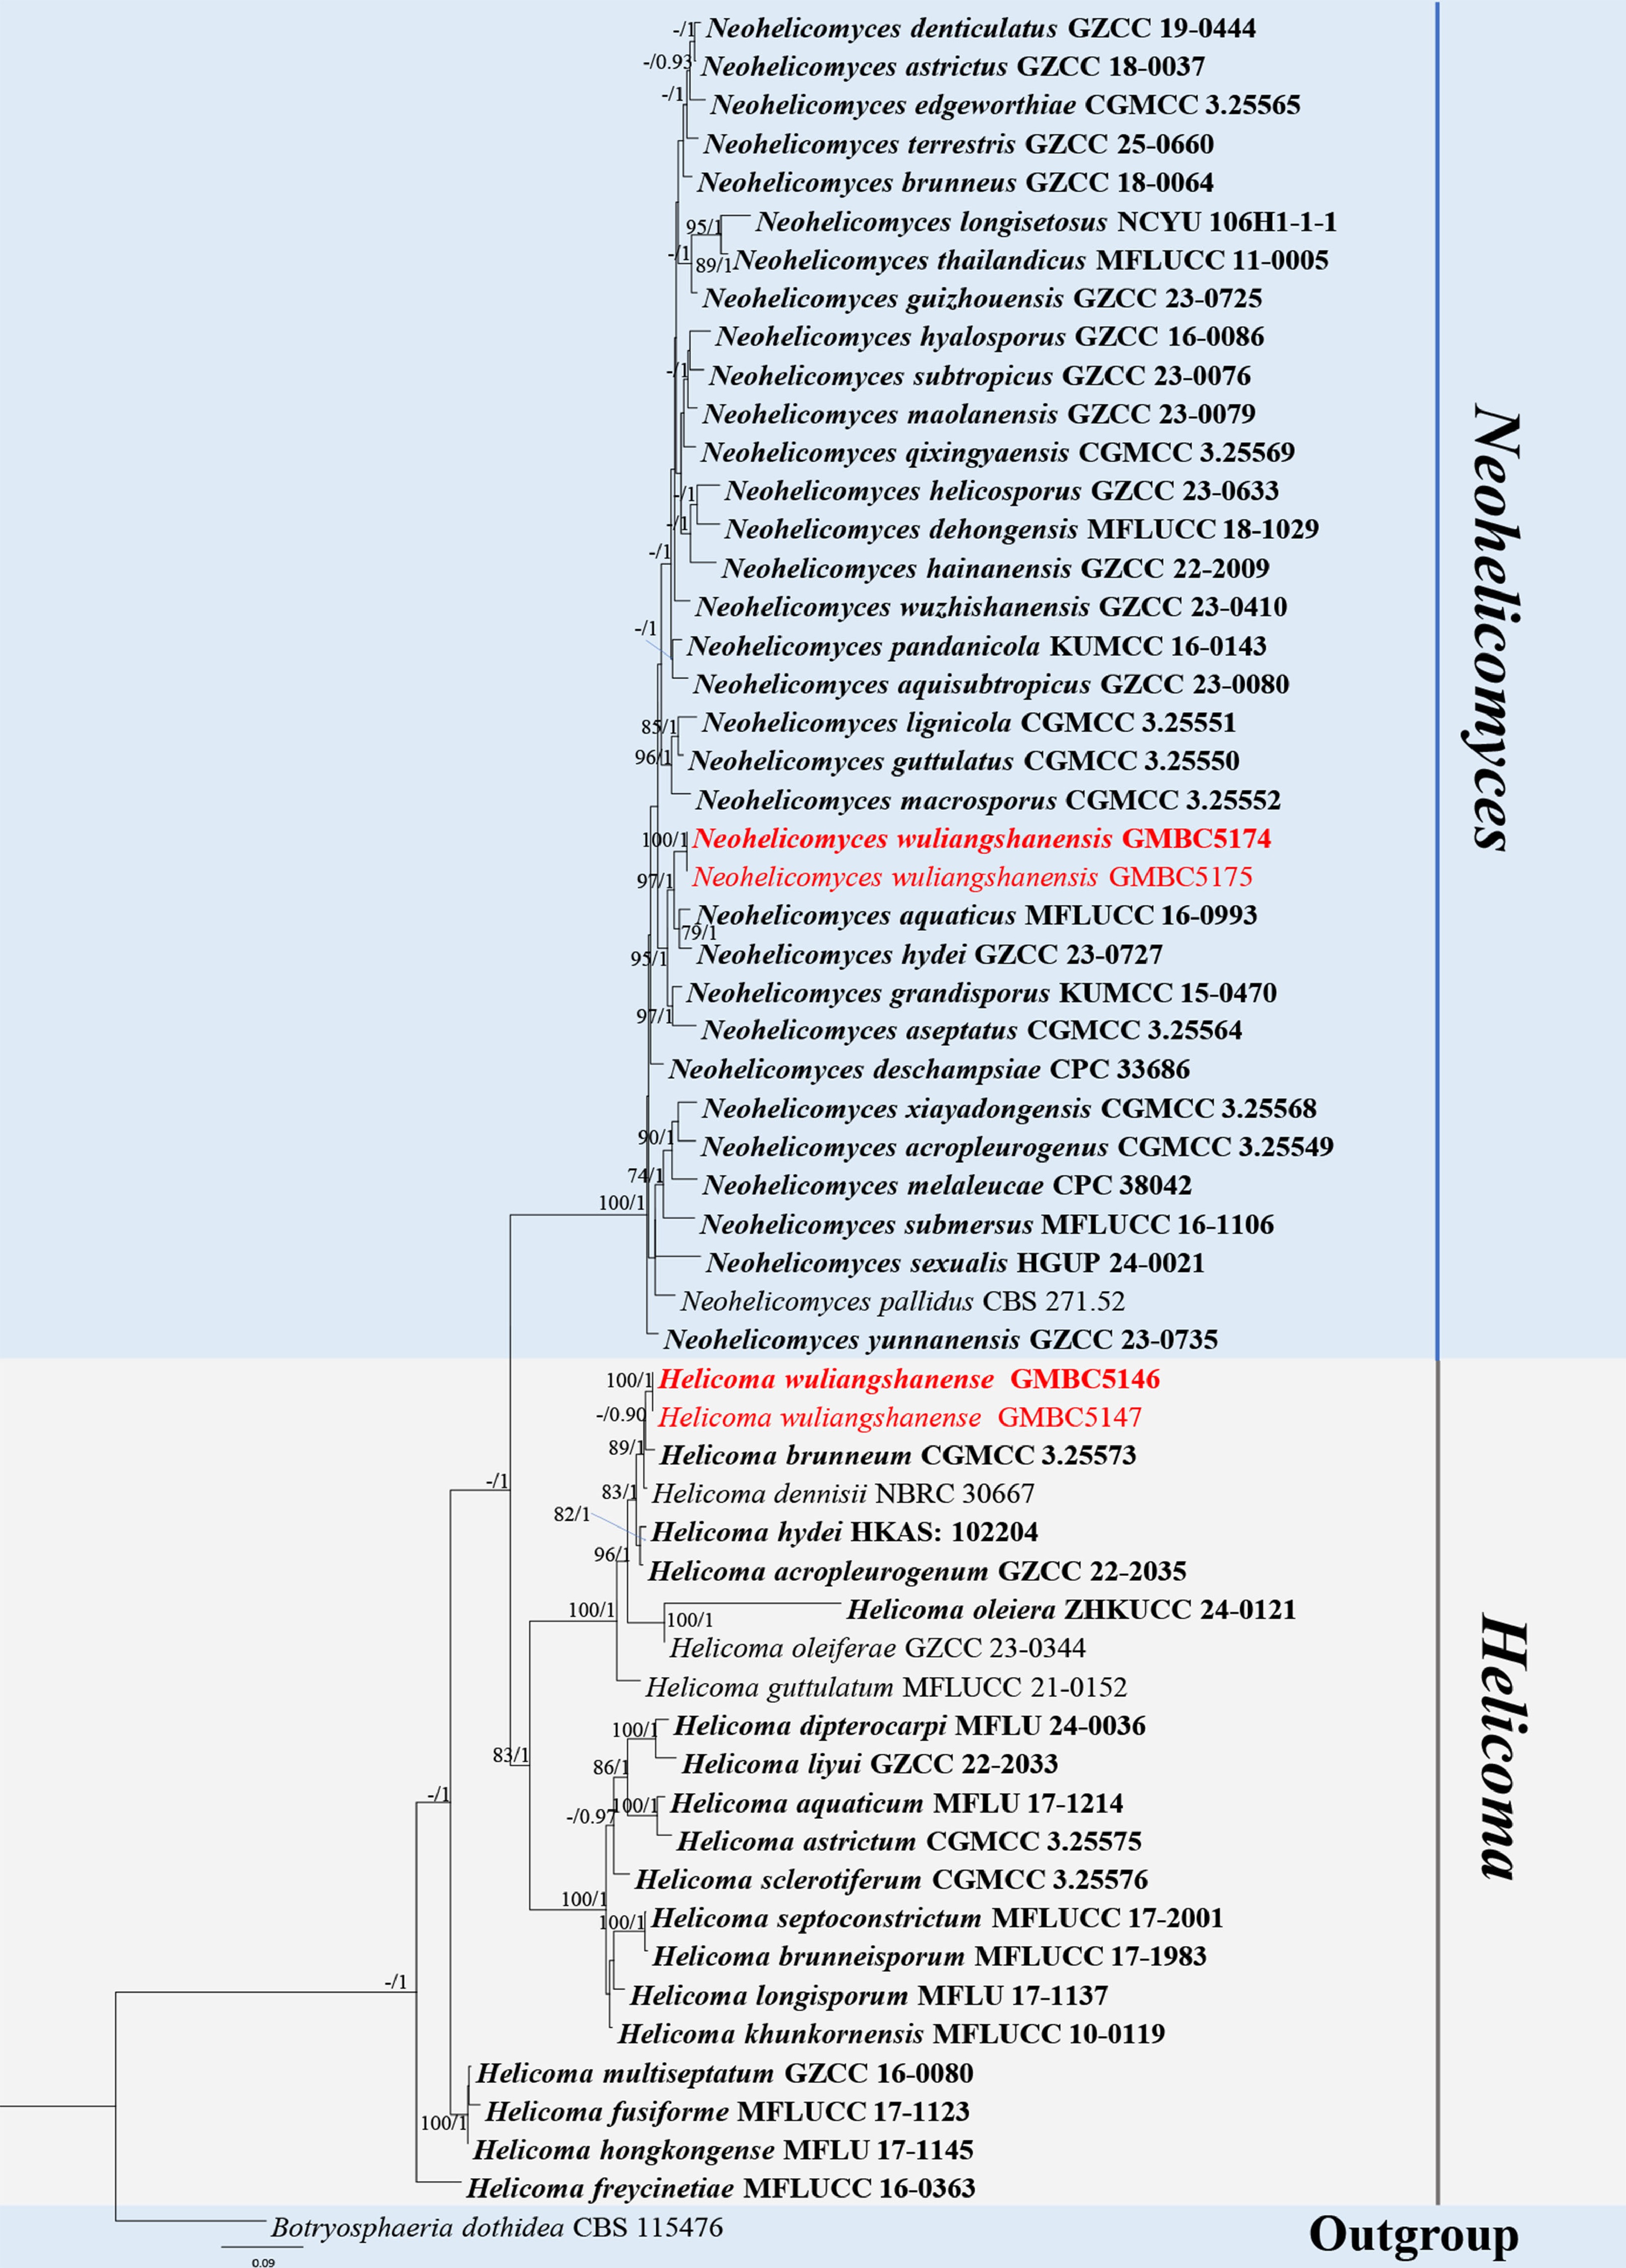
Figure 13.
ML tree of Neohelicomyces and closely related genera (including Helicoma) inferred from a combined ITS-LSU-SSU-tef1-α-rpb2 dataset. The combined dataset comprised 58 taxa, 3,446 characters (ITS: 1–571 bp; LSU: 572–1,431 bp; tef1-α: 1,432–2,345 bp; rpb2: 2,346–3,446 bp), including indel regions. Maximum likelihood (lnL = −23,540.830905) and Bayesian analyses produced consistent tree topologies. Botryosphaeria dothidea (CBS 115476) was selected as the outgroup taxon. Bayesian posterior probabilities (PP) ≥ 0.90 and RAxML bootstrap support values ≥ 70 % are shown on the branches. The newly described species are marked in red. Ex-type/type strains are indicated in bold.
-
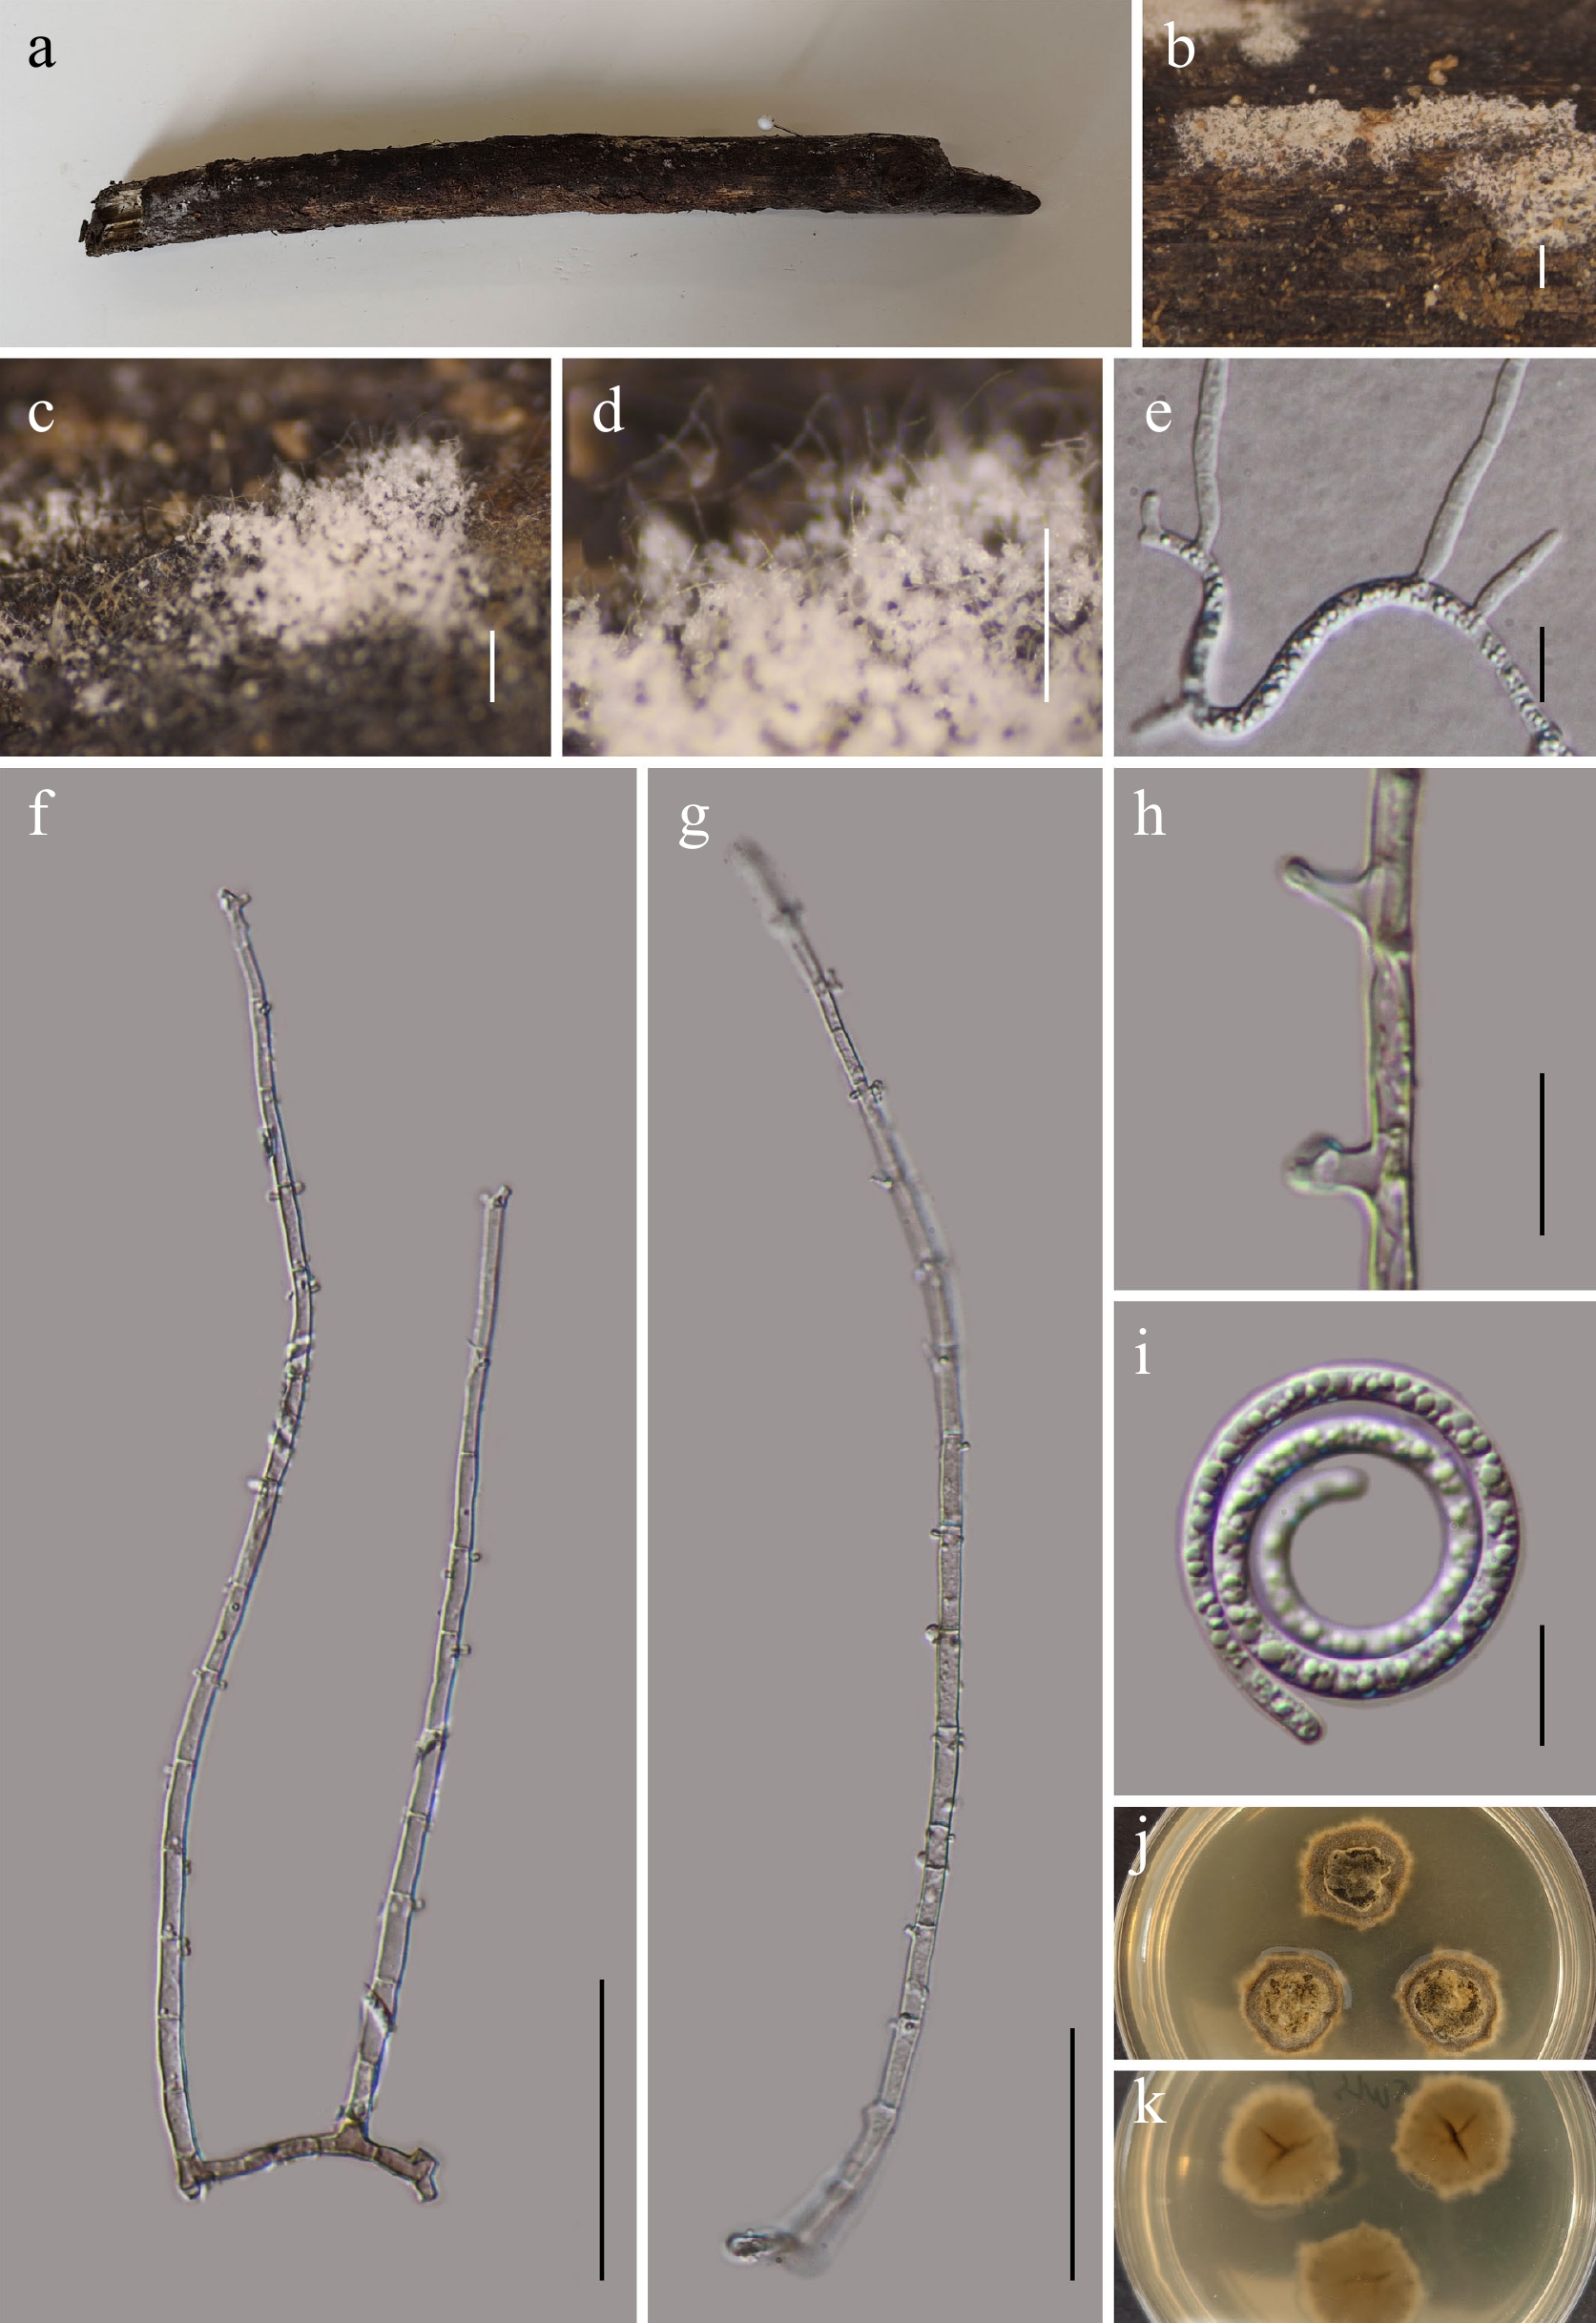
Figure 14.
Neohelicomyces wuliangshanensis (GMB5174 holotype). (a) Host. (b)–(d) Colonies on natural substrate. (e) Germinating conidium. (f), (g) Conidiophores and conidia. (h) Conidiogenous cells. (i) Conidia. (j), (k) Surface and reverse view of culture on PDA. Scale bars: b =1 mm, c, d = 0.5 mm, f, g = 50 μm, e, h, i = 10 μm.
-
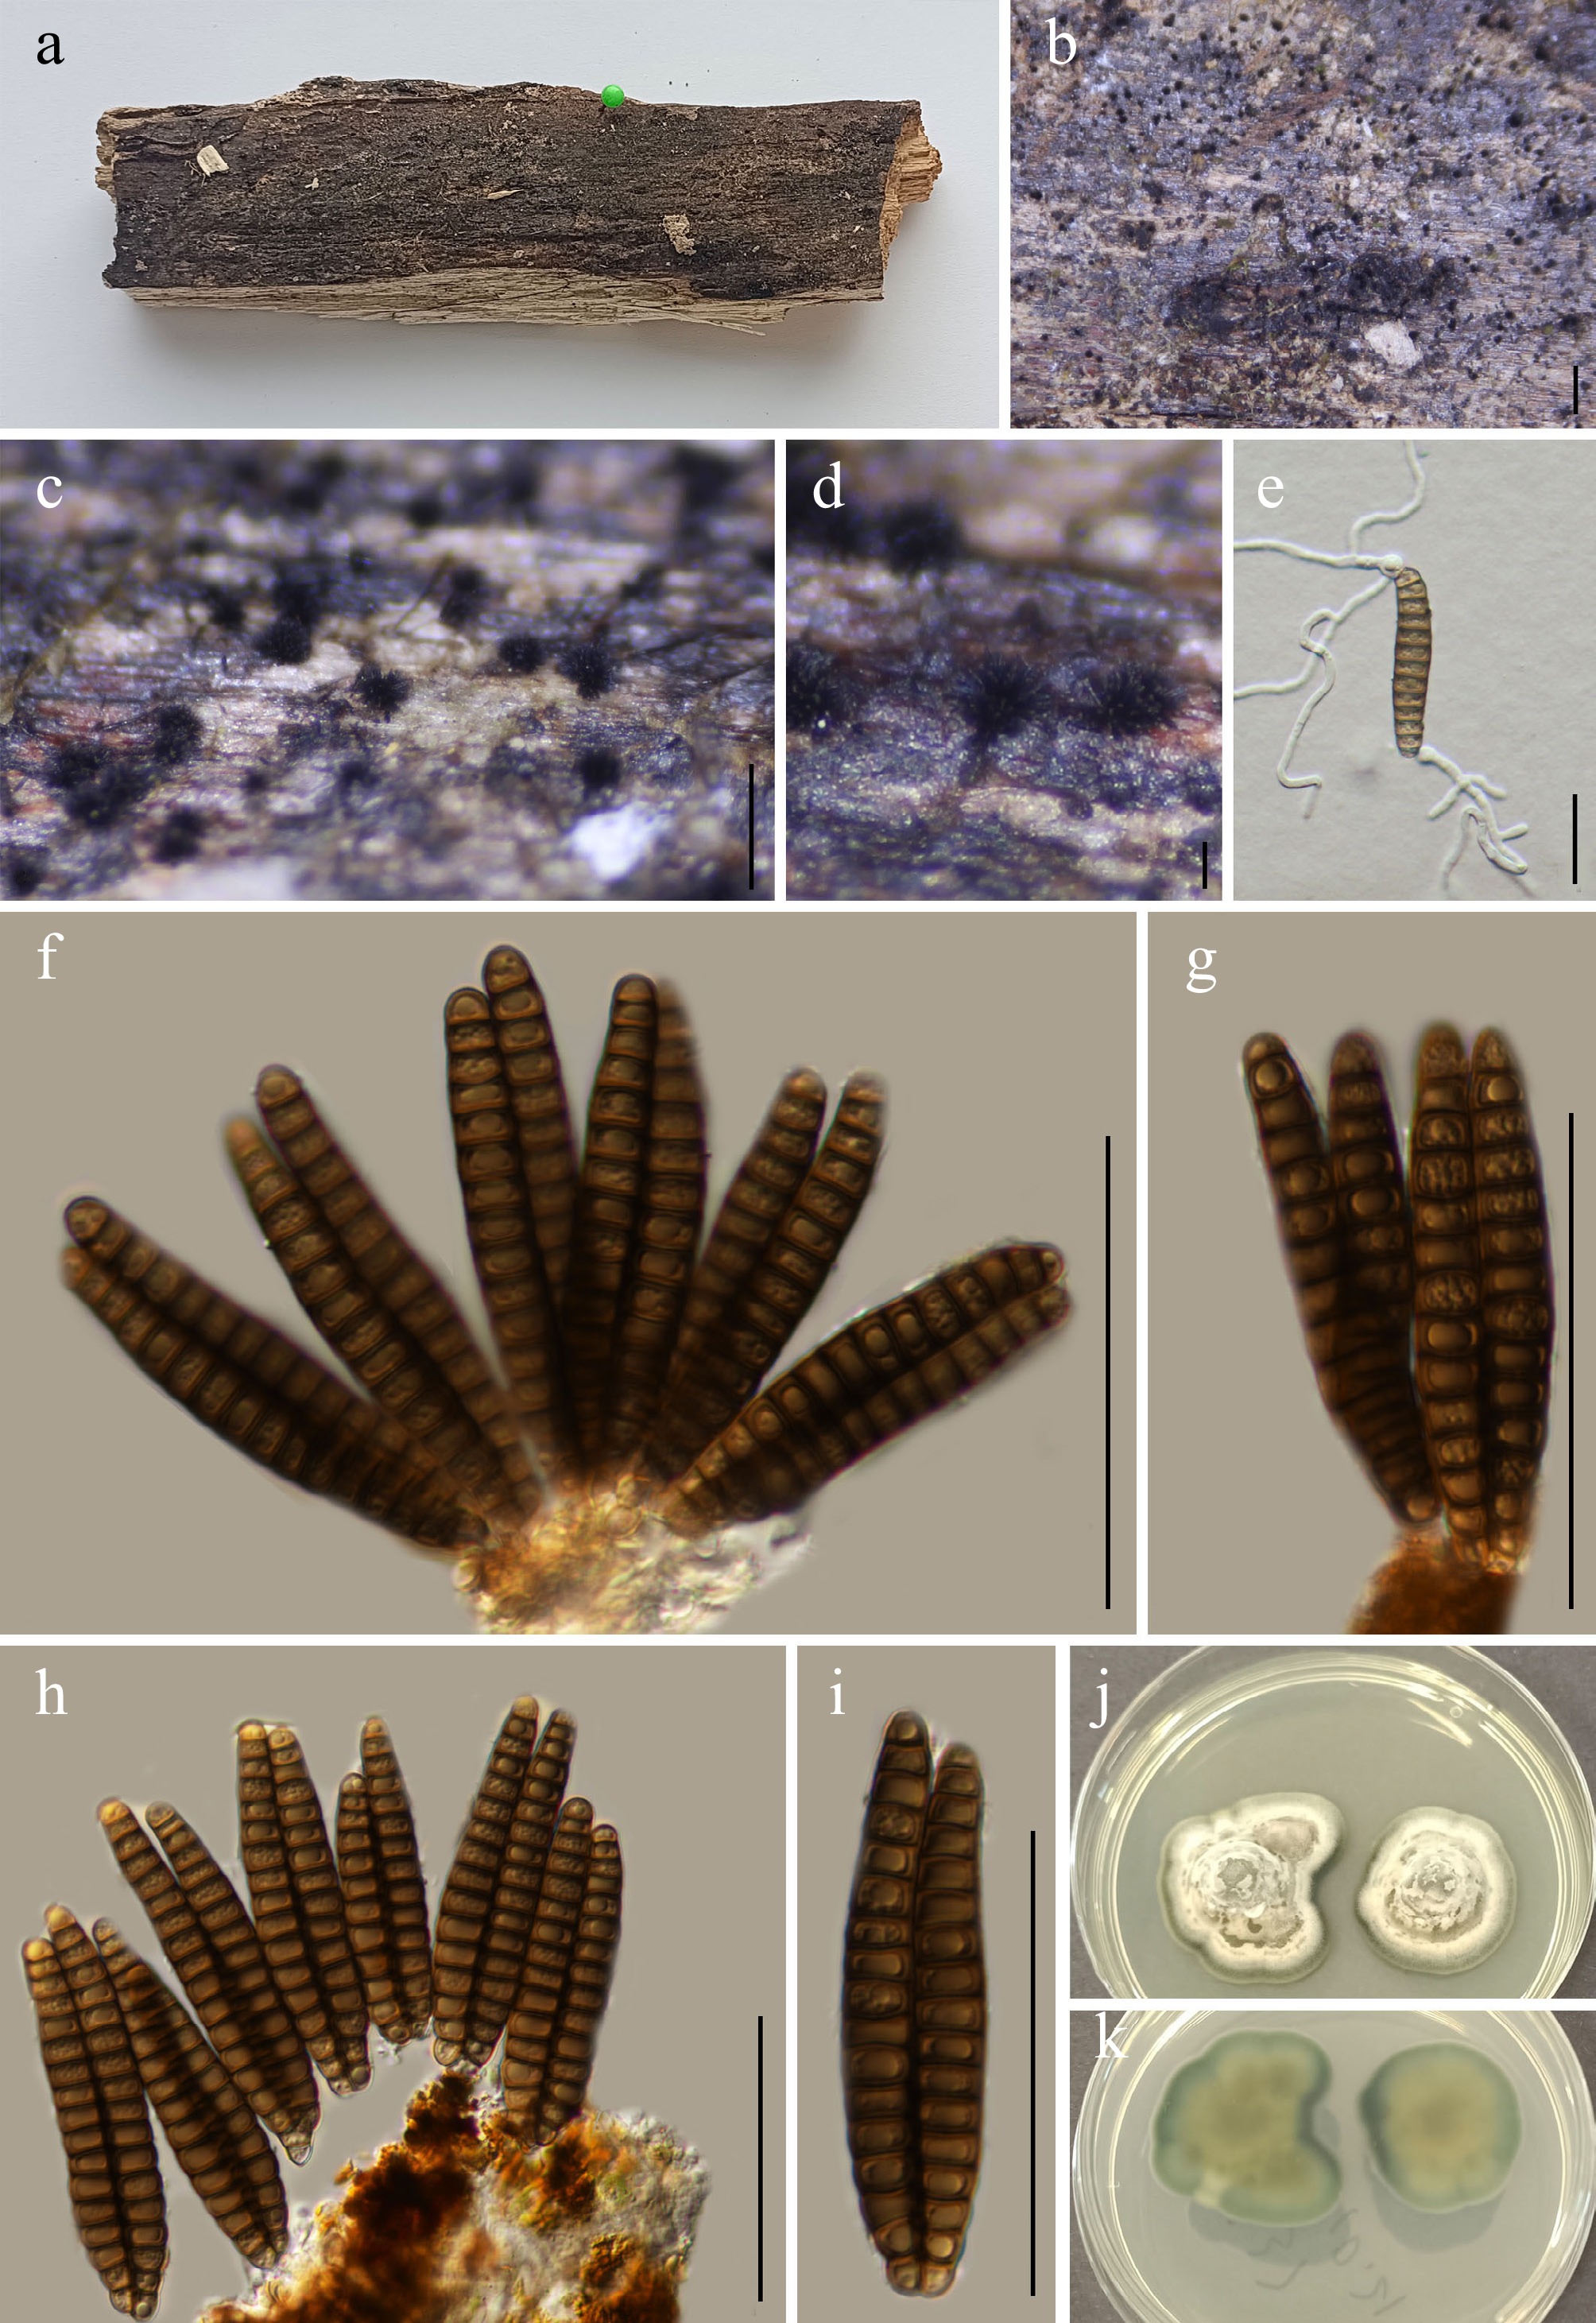
Figure 15.
Gamsomyces guangxiensis (GMB5152 holotype). (a) Host. (b)–(d) Colonies on natural substrate. (e) Germinating conidium. (f)–(i) Conidiophores and conidia. (j), (k) Surface and reverse view of culture on PDA. Scale bars: b = 1 mm, c = 0.5 mm, d = 0.1 mm, e–i = 50 μm.
-
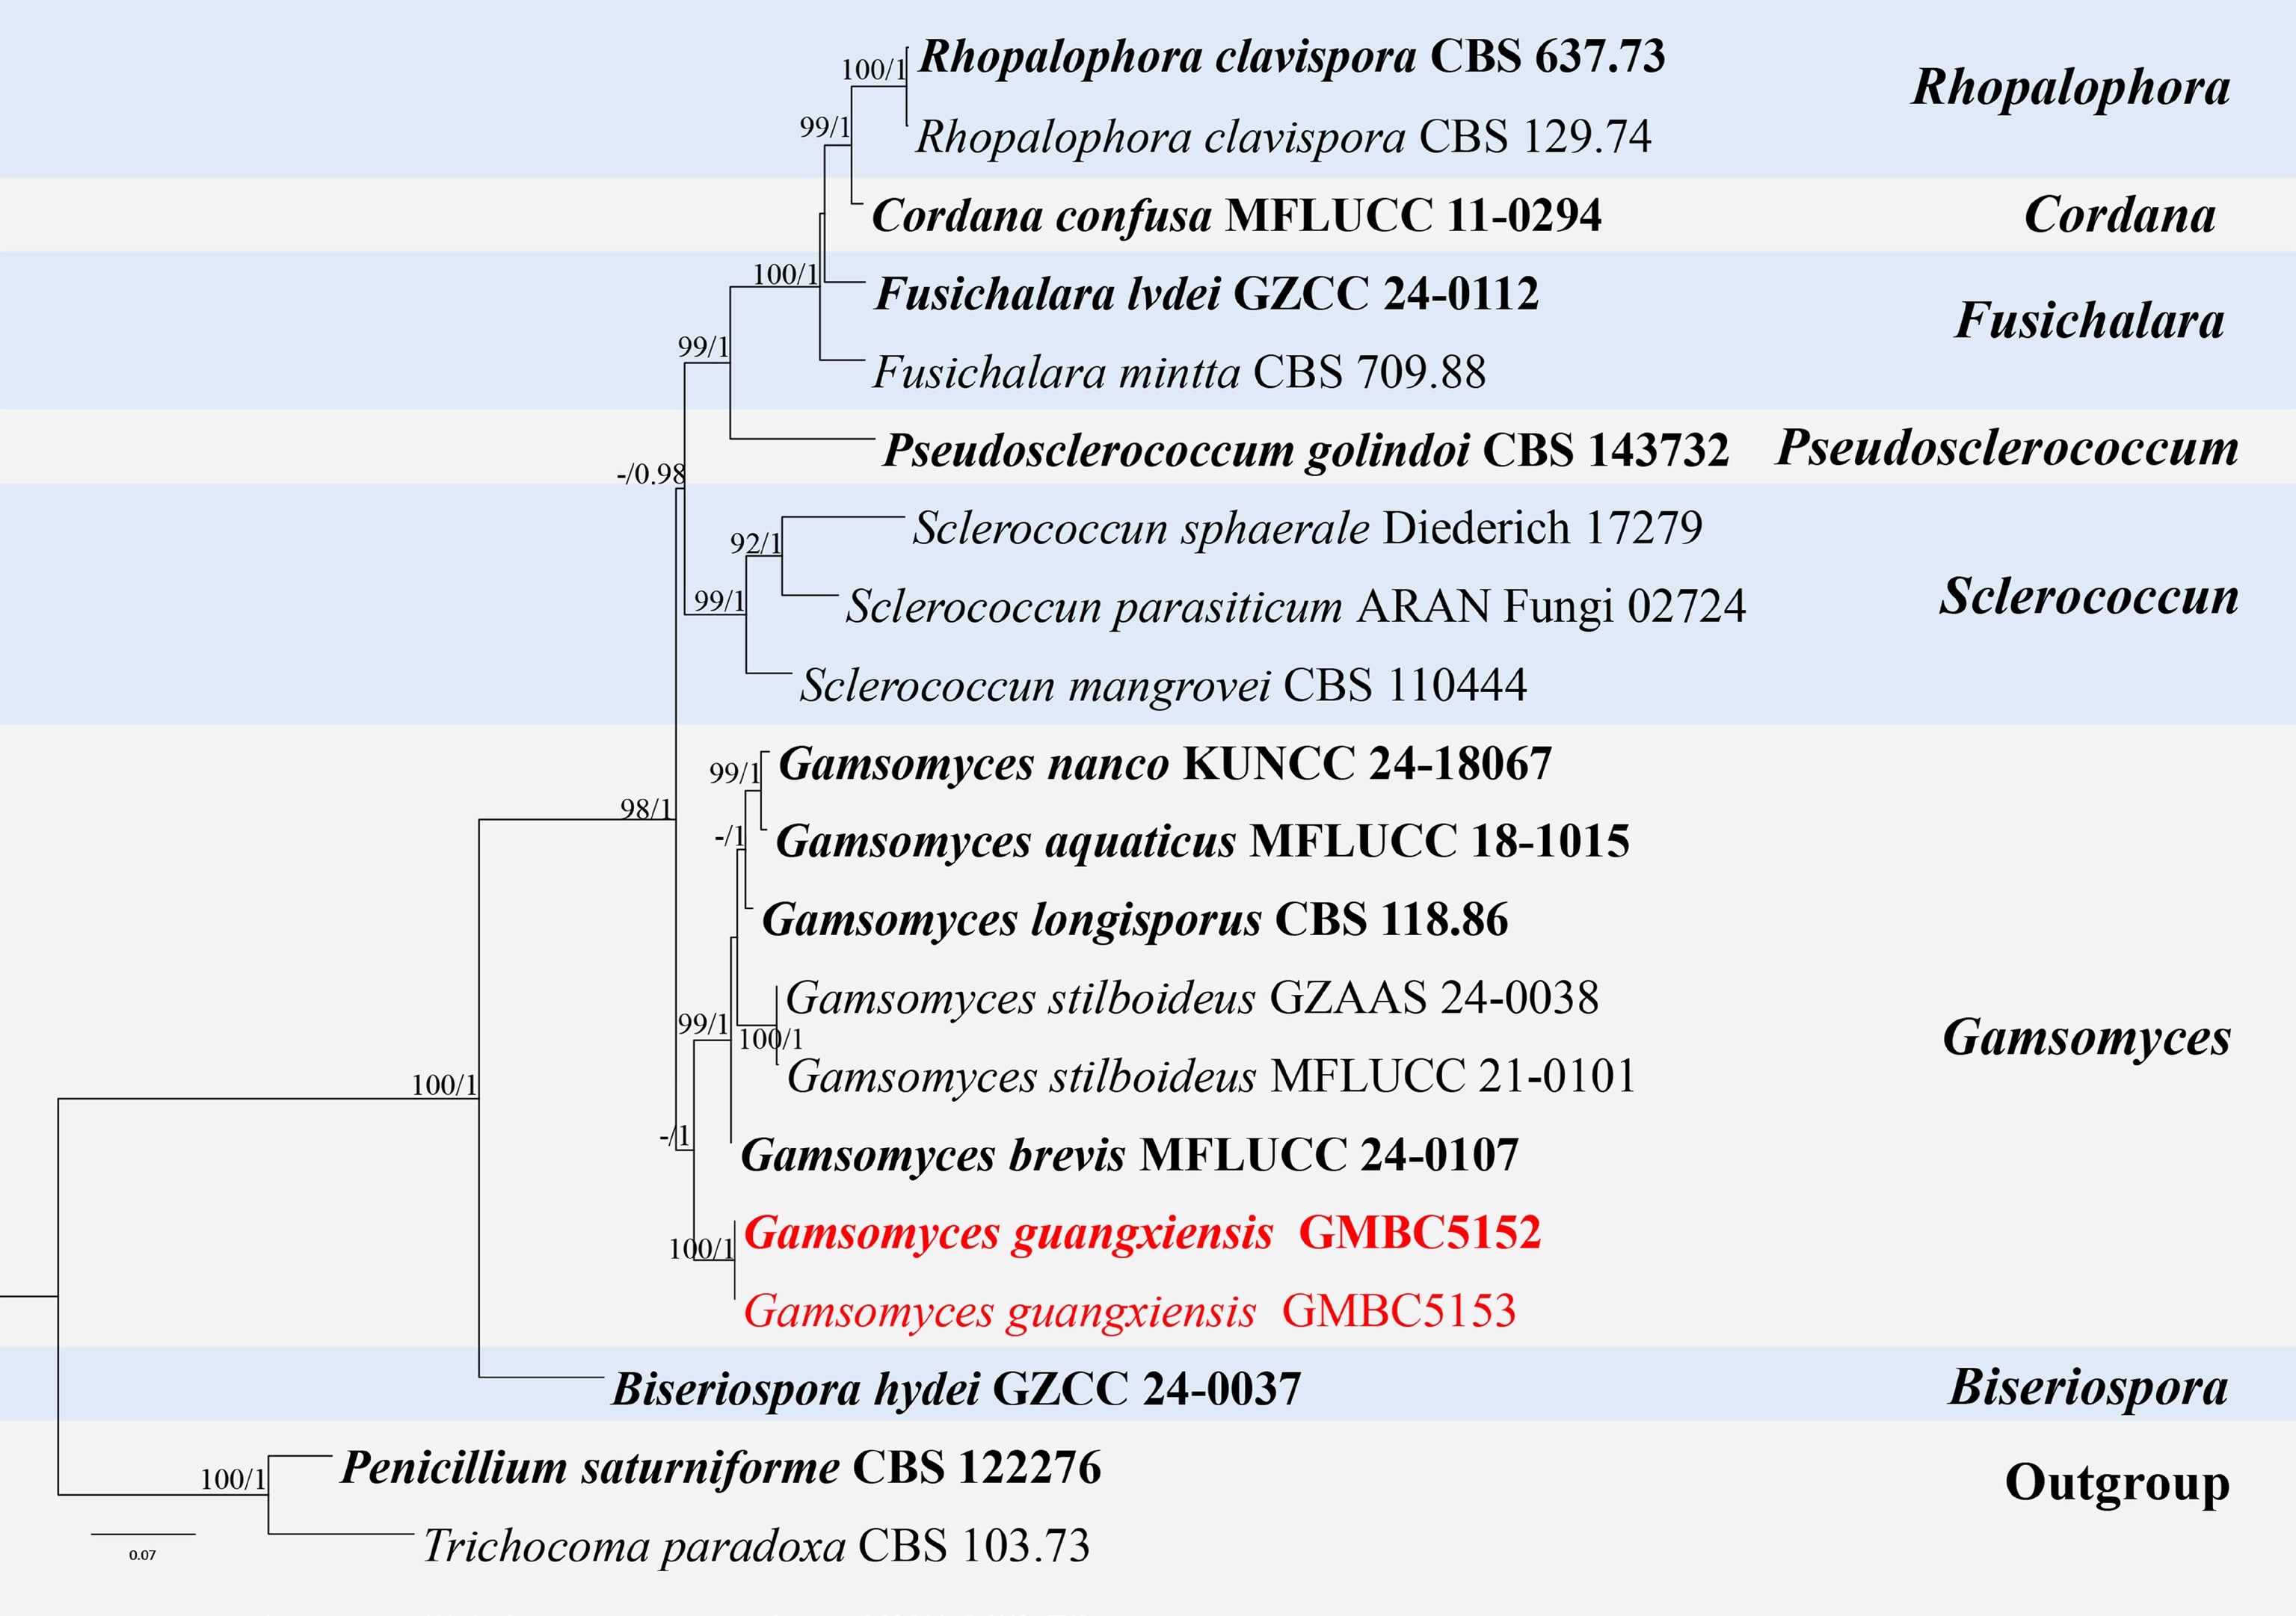
Figure 16.
ML tree of selected species of Gamsomyces and related genera inferred from a combined ITS-LSU dataset. The combined dataset comprised 20 taxa and 1,355 characters (ITS: 1–492 bp; LSU: 493–1,355 bp), including indel regions. Maximum likelihood (lnL = −6,073.633839) and Bayesian analyses produced consistent tree topologies. Penicillium saturniforme (CBS 122276) and Trichocoma paradoxa (CBS 103.73) were selected as the outgroup taxa. Bayesian posterior probabilities (PP) ≥ 0.90 and RAxML bootstrap support values ≥ 70 % are shown on the branches. The newly described species is marked in red. Ex-type/type strains are indicated in bold.
-
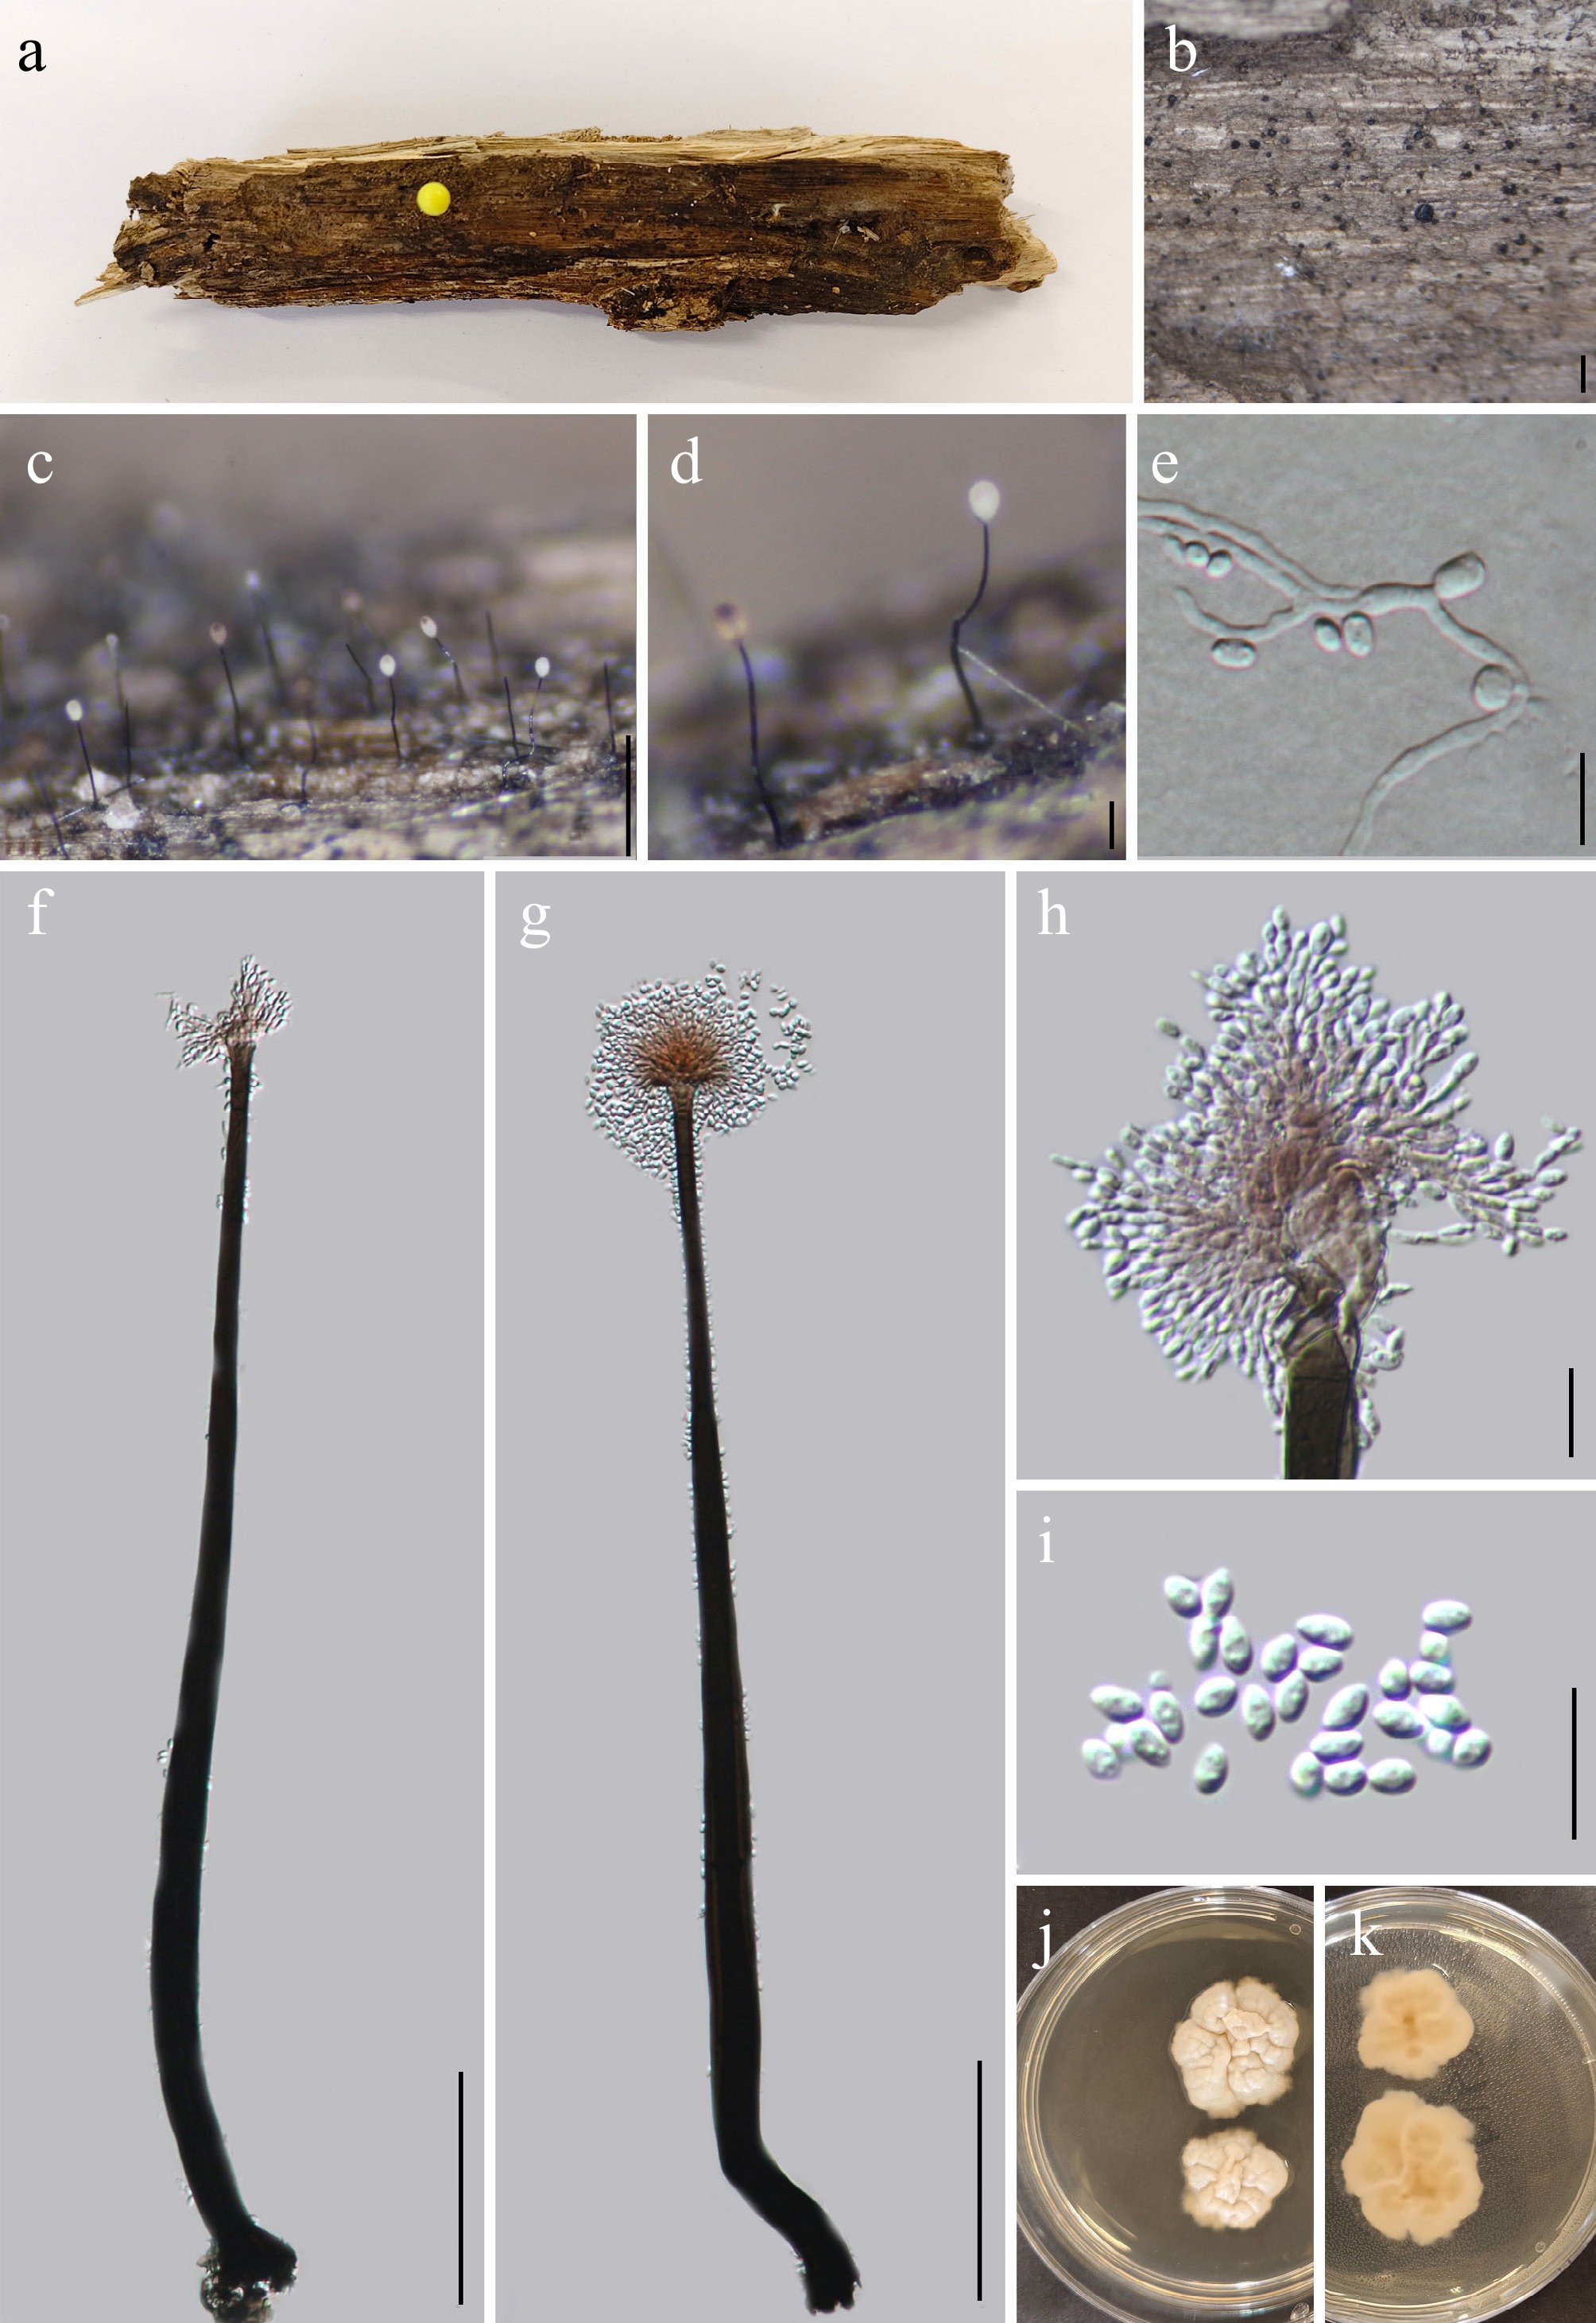
Figure 17.
Dematioscypha aquaticum (GMB5150 holotype). (a) Host. (b)–(d) Colonies on natural substrate. (e) Germinating conidium. (f), (g) Conidiophores and conidia. (h) Conidiogenous cells. (i) Conidia. (j), (k) Surface and reverse view of culture on PDA. Scale bars: b = 1 mm, c = 0.5 mm, d = 0.1 mm, f, g = 100 μm, e, h, i = 10 μm.
-
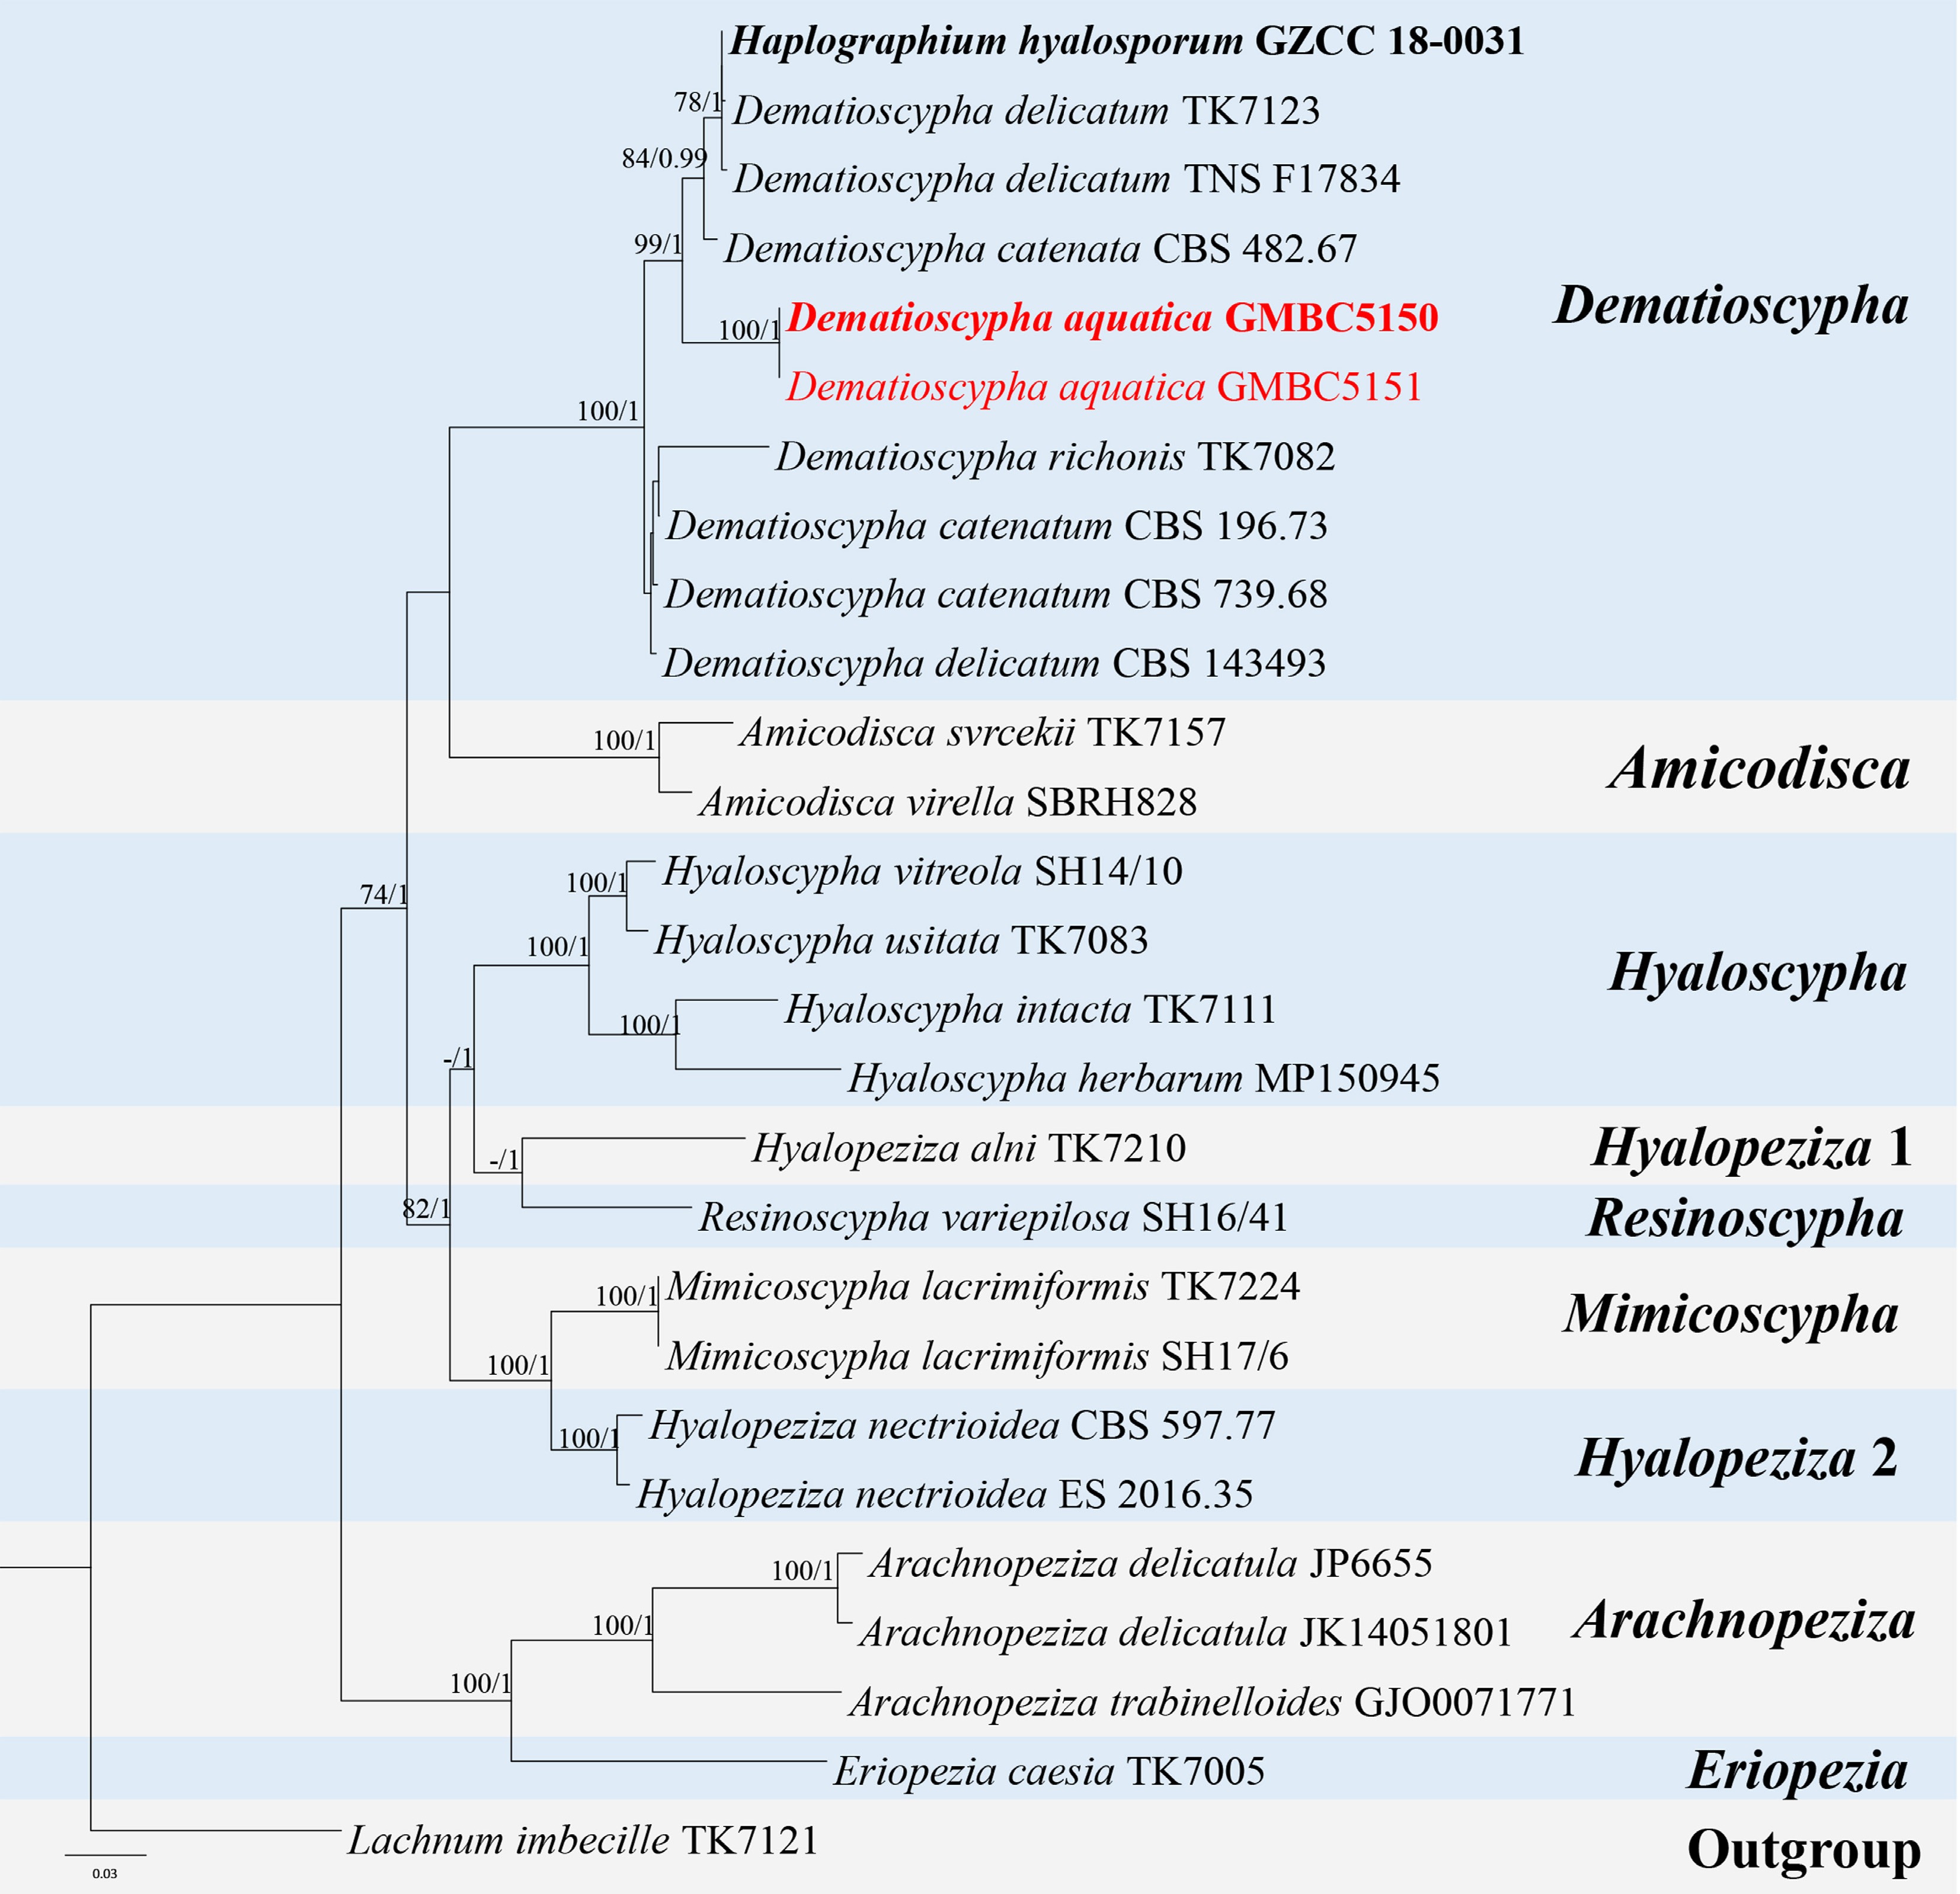
Figure 18.
ML tree of Dematioscypha and related genera inferred from a combined ITS-LSU-tef1-α-rpb2 dataset. The combined dataset comprised 27 taxa, 3,365 characters (ITS: 1–547 bp; LSU: 548–1,493 bp; tef1-α: 1,394–2,313 bp; rpb2: 2,314–3,365 bp) including indel regions. Maximum likelihood (lnL= −16,013.685762) and Bayesian analyses produced consistent tree topologies. Lachnum imbecille (TK7121) was selected as the outgroup taxon. Bayesian posterior probabilities (PP) ≥ 0.90 and RAxML bootstrap support values ≥ 70 % are shown on the branches. The newly described species is marked in red. Ex-type/type strains are indicated in bold.
-
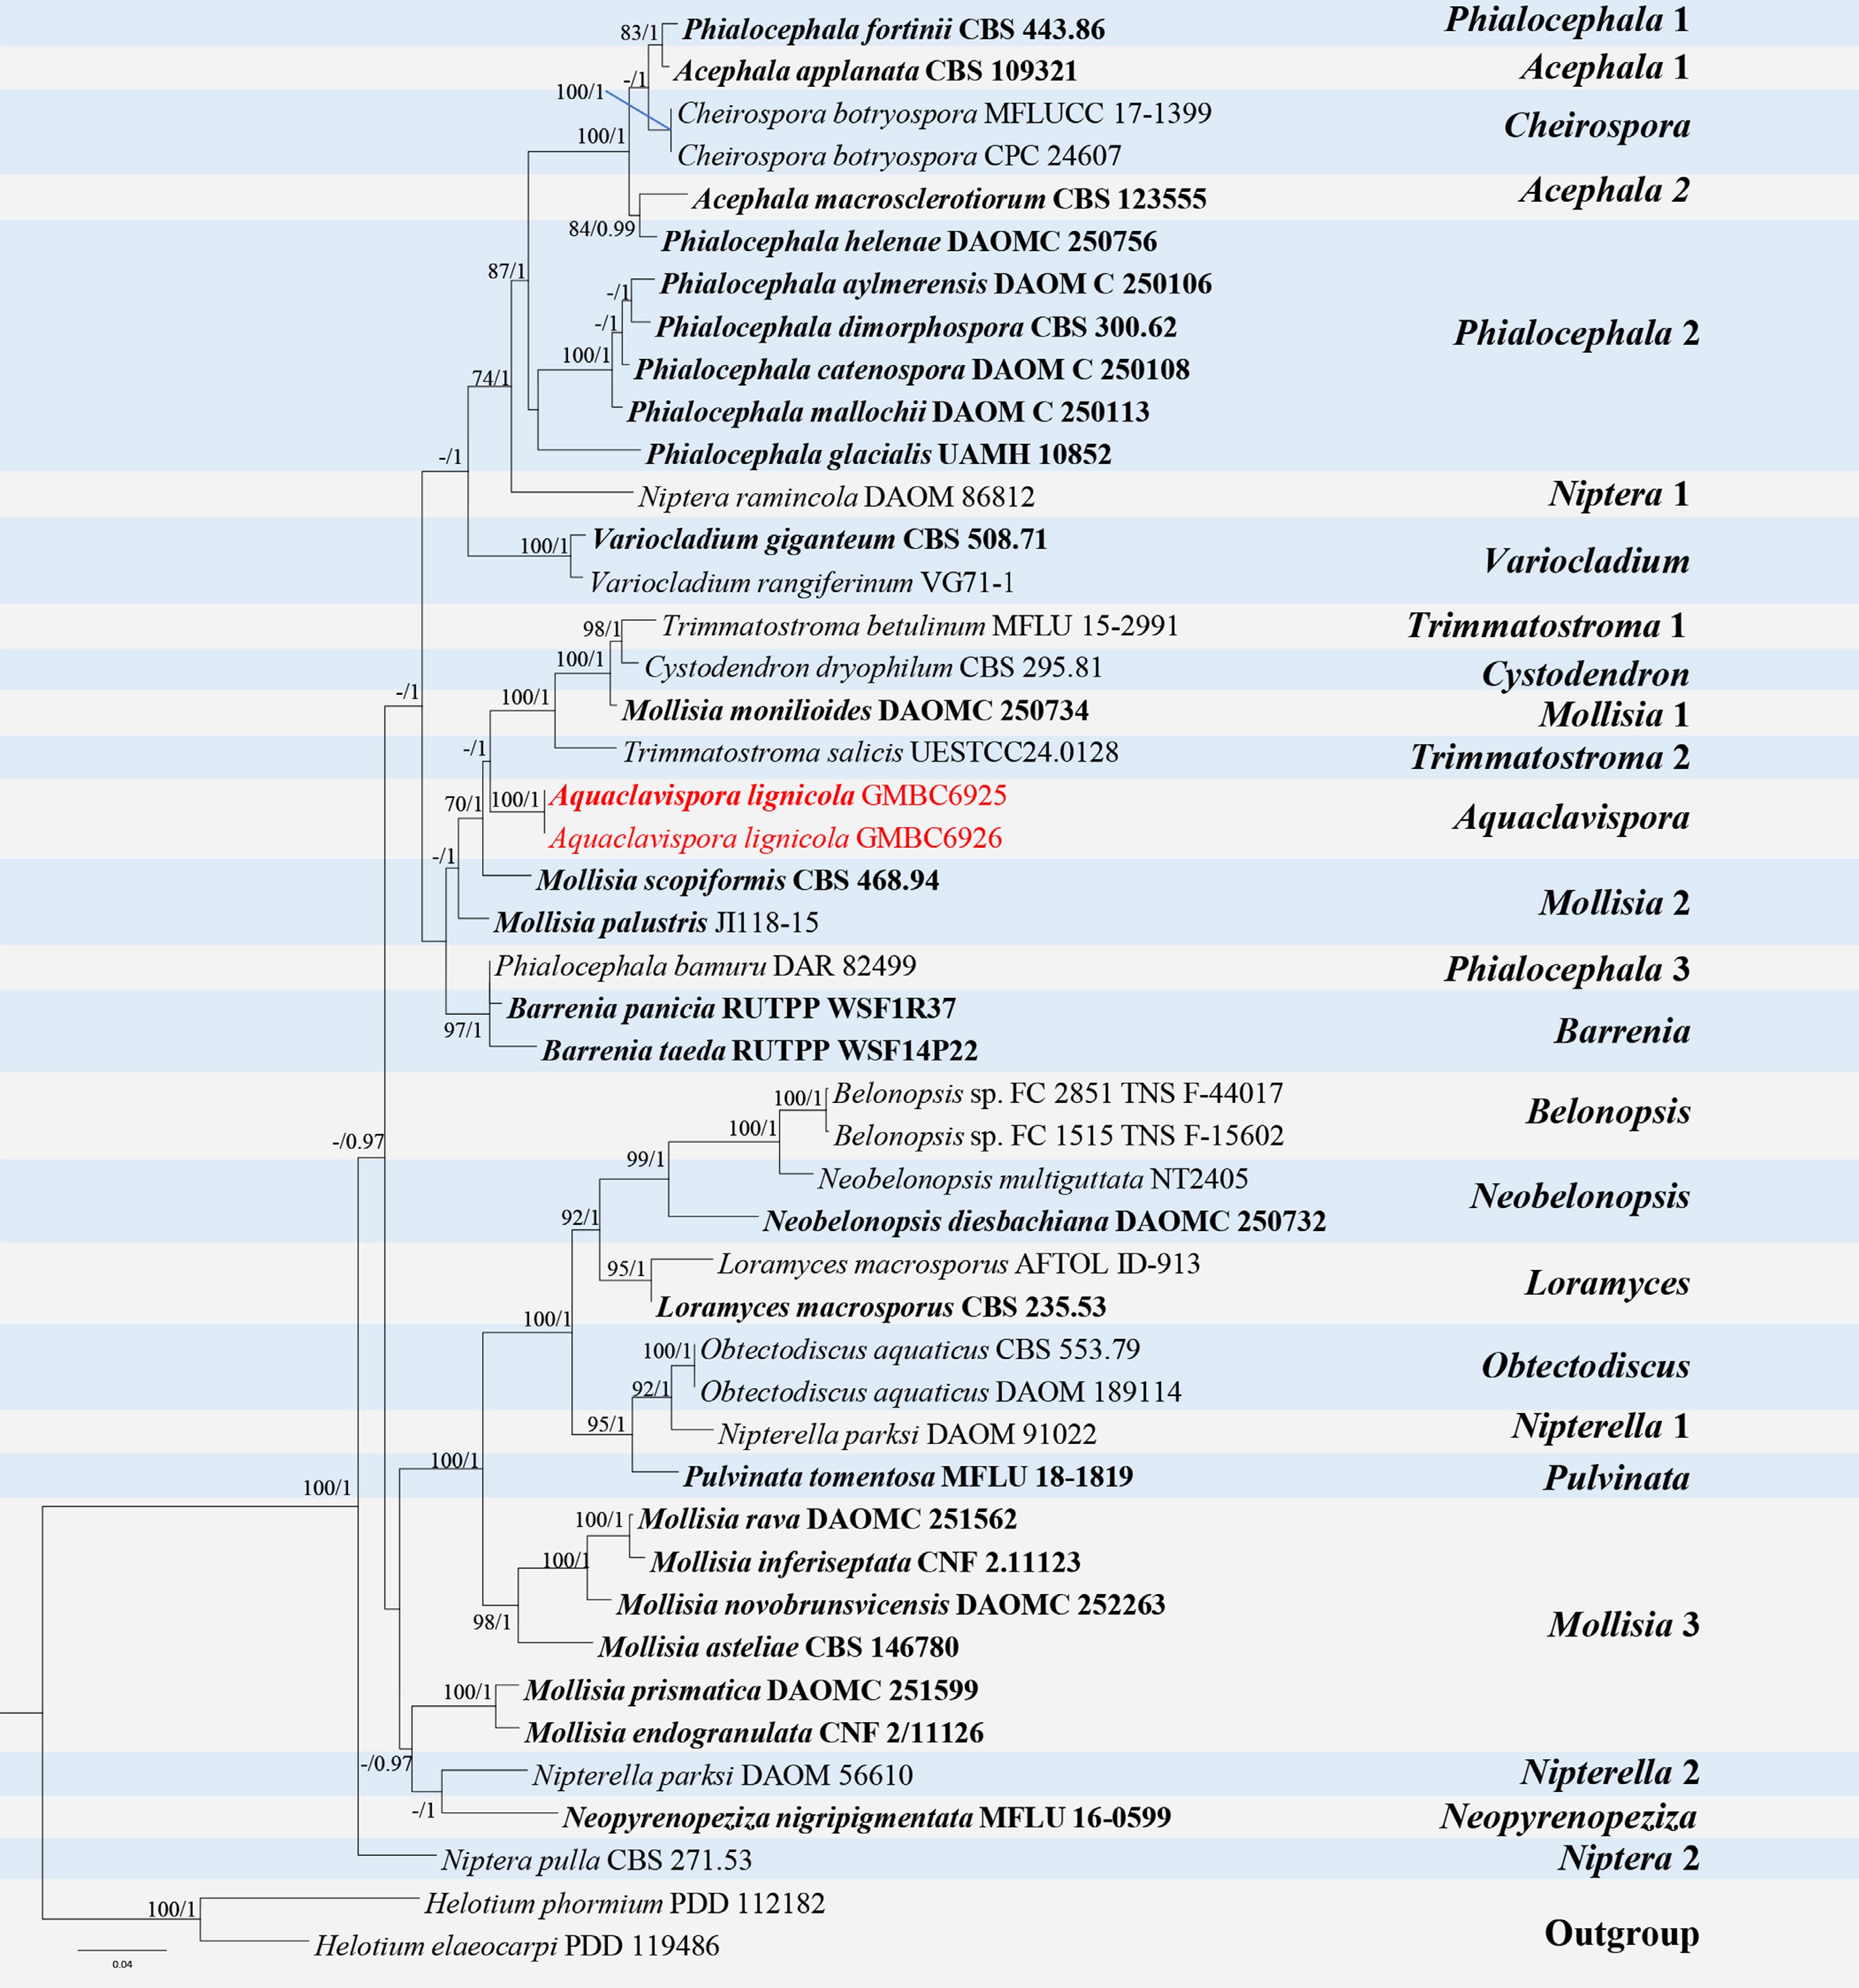
Figure 19.
ML tree of selected Mollisiaceae species based on the ITS-LSU dataset. The combined dataset comprised 43 taxa, 1,398 characters (ITS: 1–551 bp; LSU: 552–1,398 bp), including indel regions. Maximum likelihood (lnL = −8,494.851348) and Bayesian analyses produced consistent tree topologies. Helotium elaeocarpi (PDD 119486) and H. phormium (PDD 112182) were selected as the outgroup taxa. Bayesian posterior probabilities (PP) ≥ 0.90 and RAxML bootstrap support values ≥ 70 % are shown on the branches. Novel species are indicated in red and ex-type/type strains in bold.
-
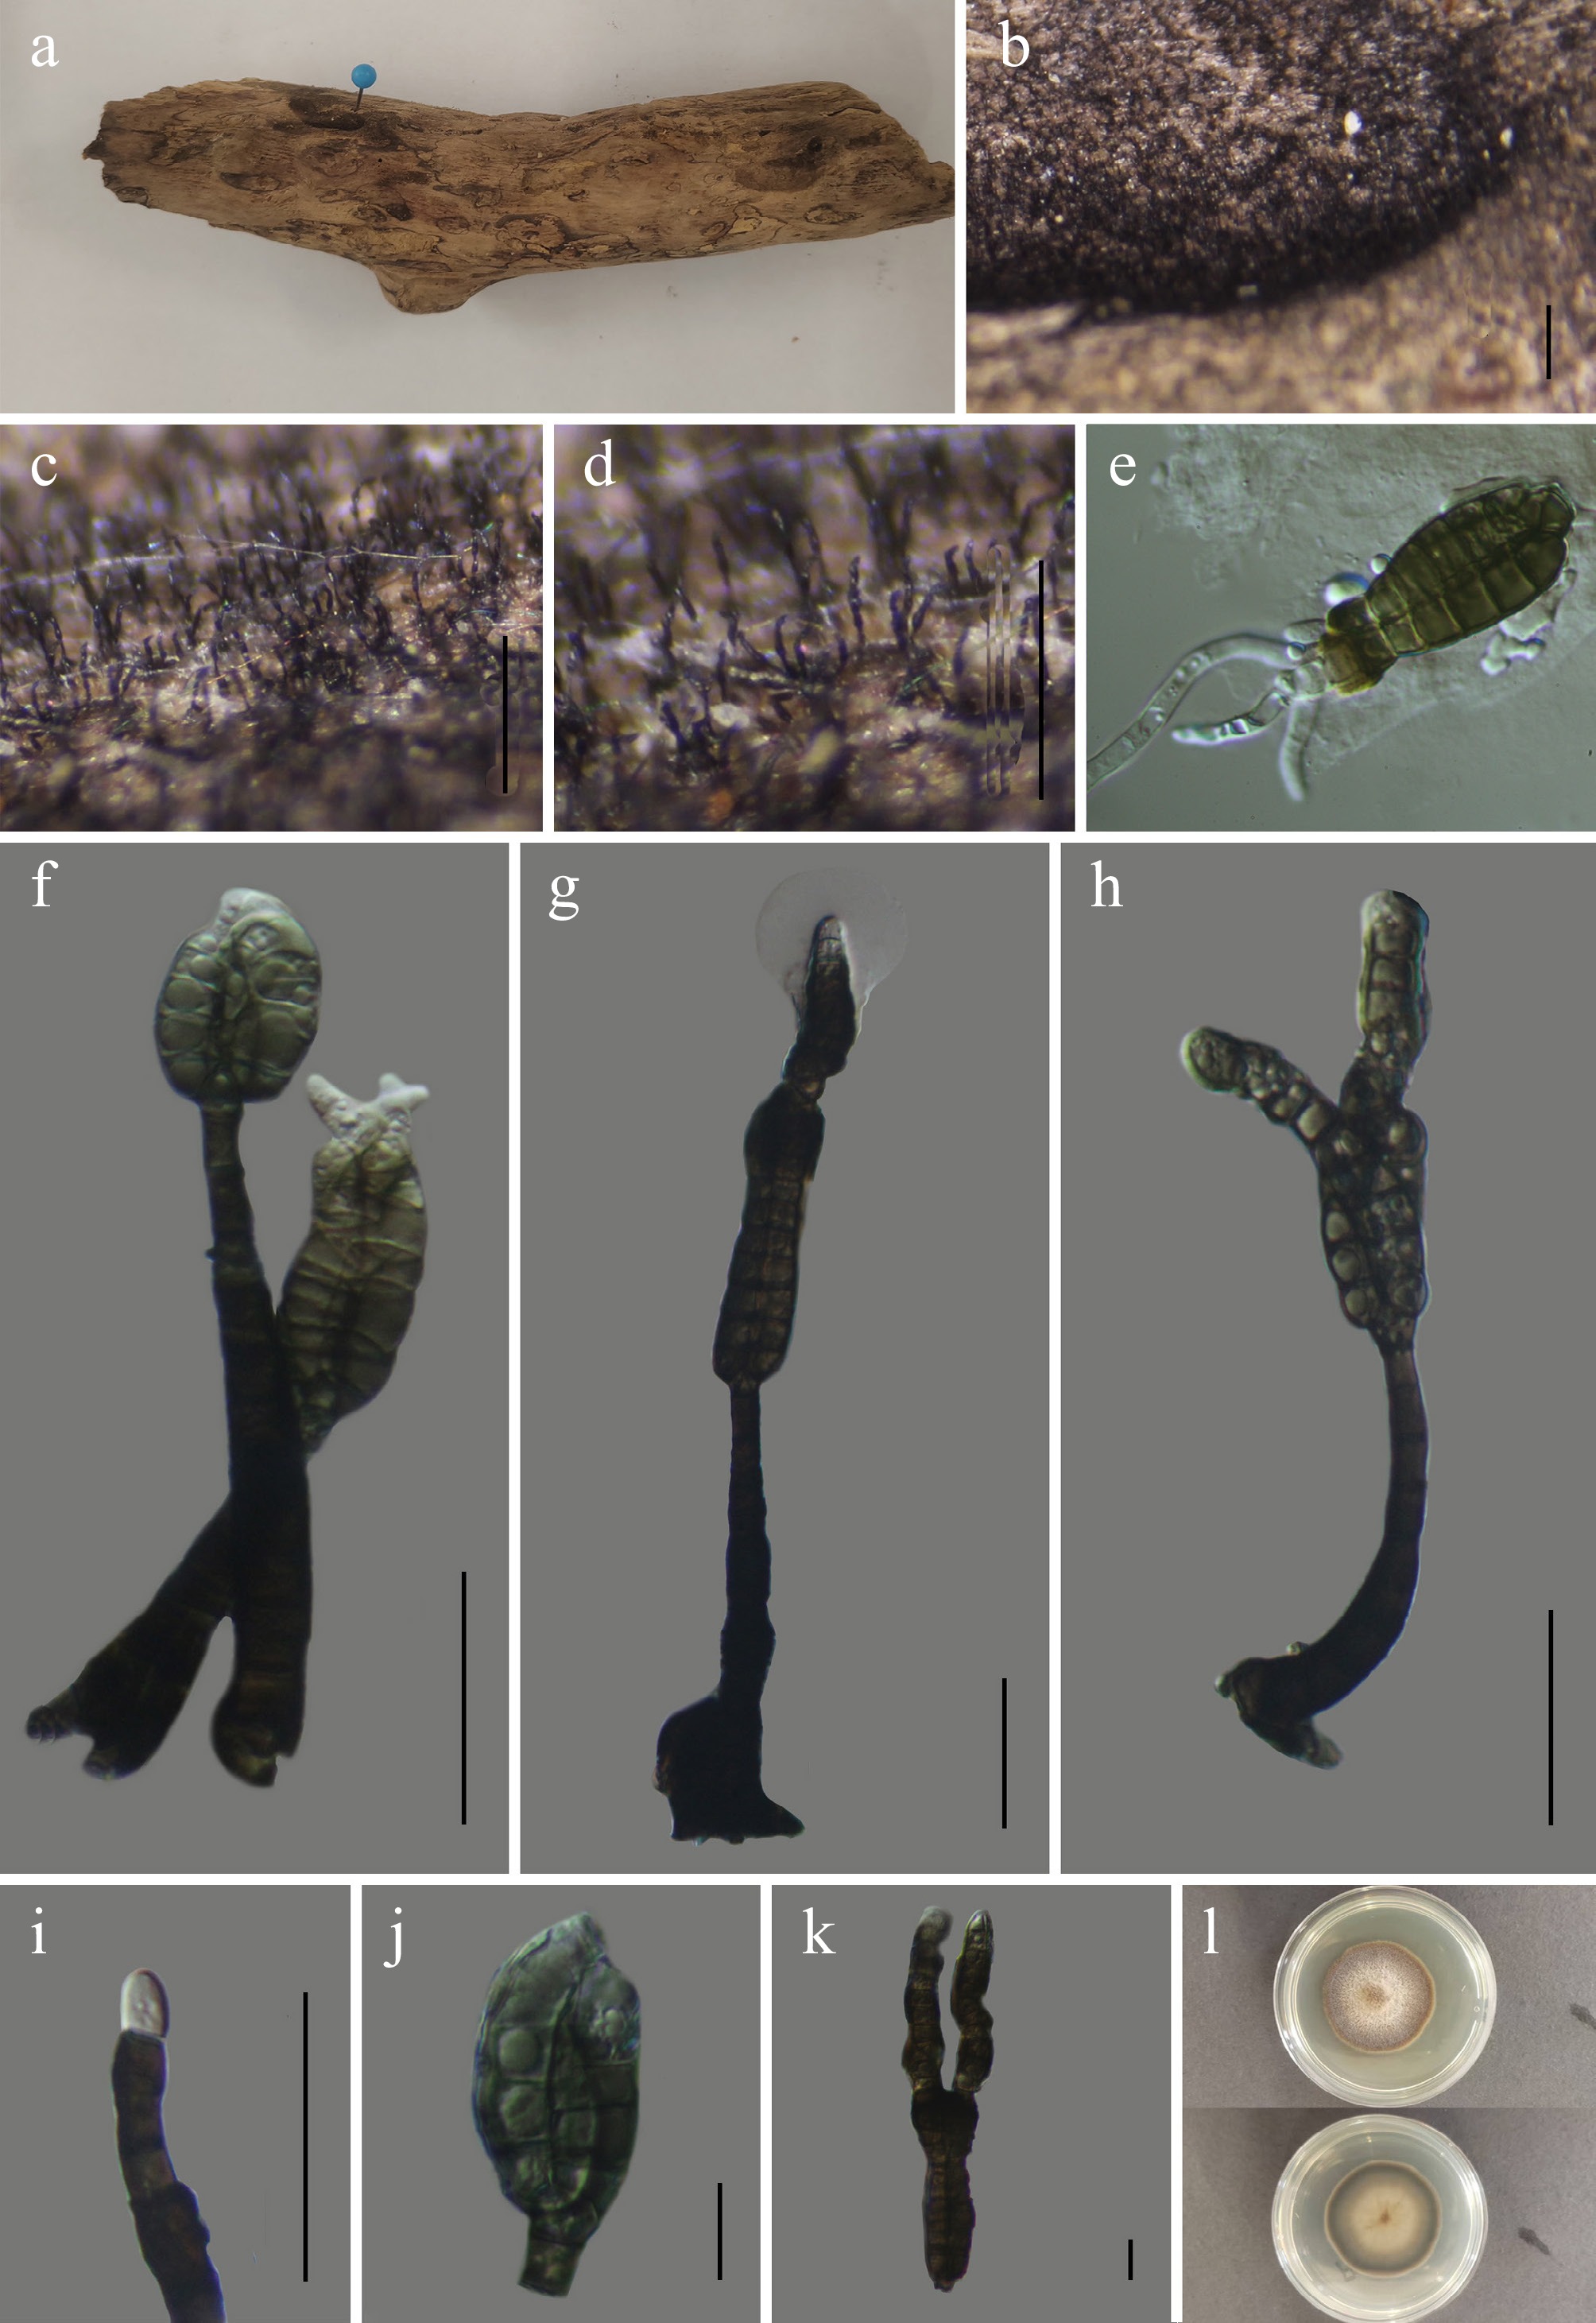
Figure 20.
Aquaclavispora lignicola (GMB6925 holotype). (a) Host. (b)–(d) Colonies on natural substrate. (e) Germinating conidium. (f)–(h) Conidiophores and conidia. (i) Conidiogenous cells with conidia. (j) immature conidia. (k) Mature conidia. (l) Surface and reverse view of culture on PDA. Scale bars: b = 1 mm, c, d = 0.5 mm, f–i = 30 μm, e, j–k = 10 μm.
-
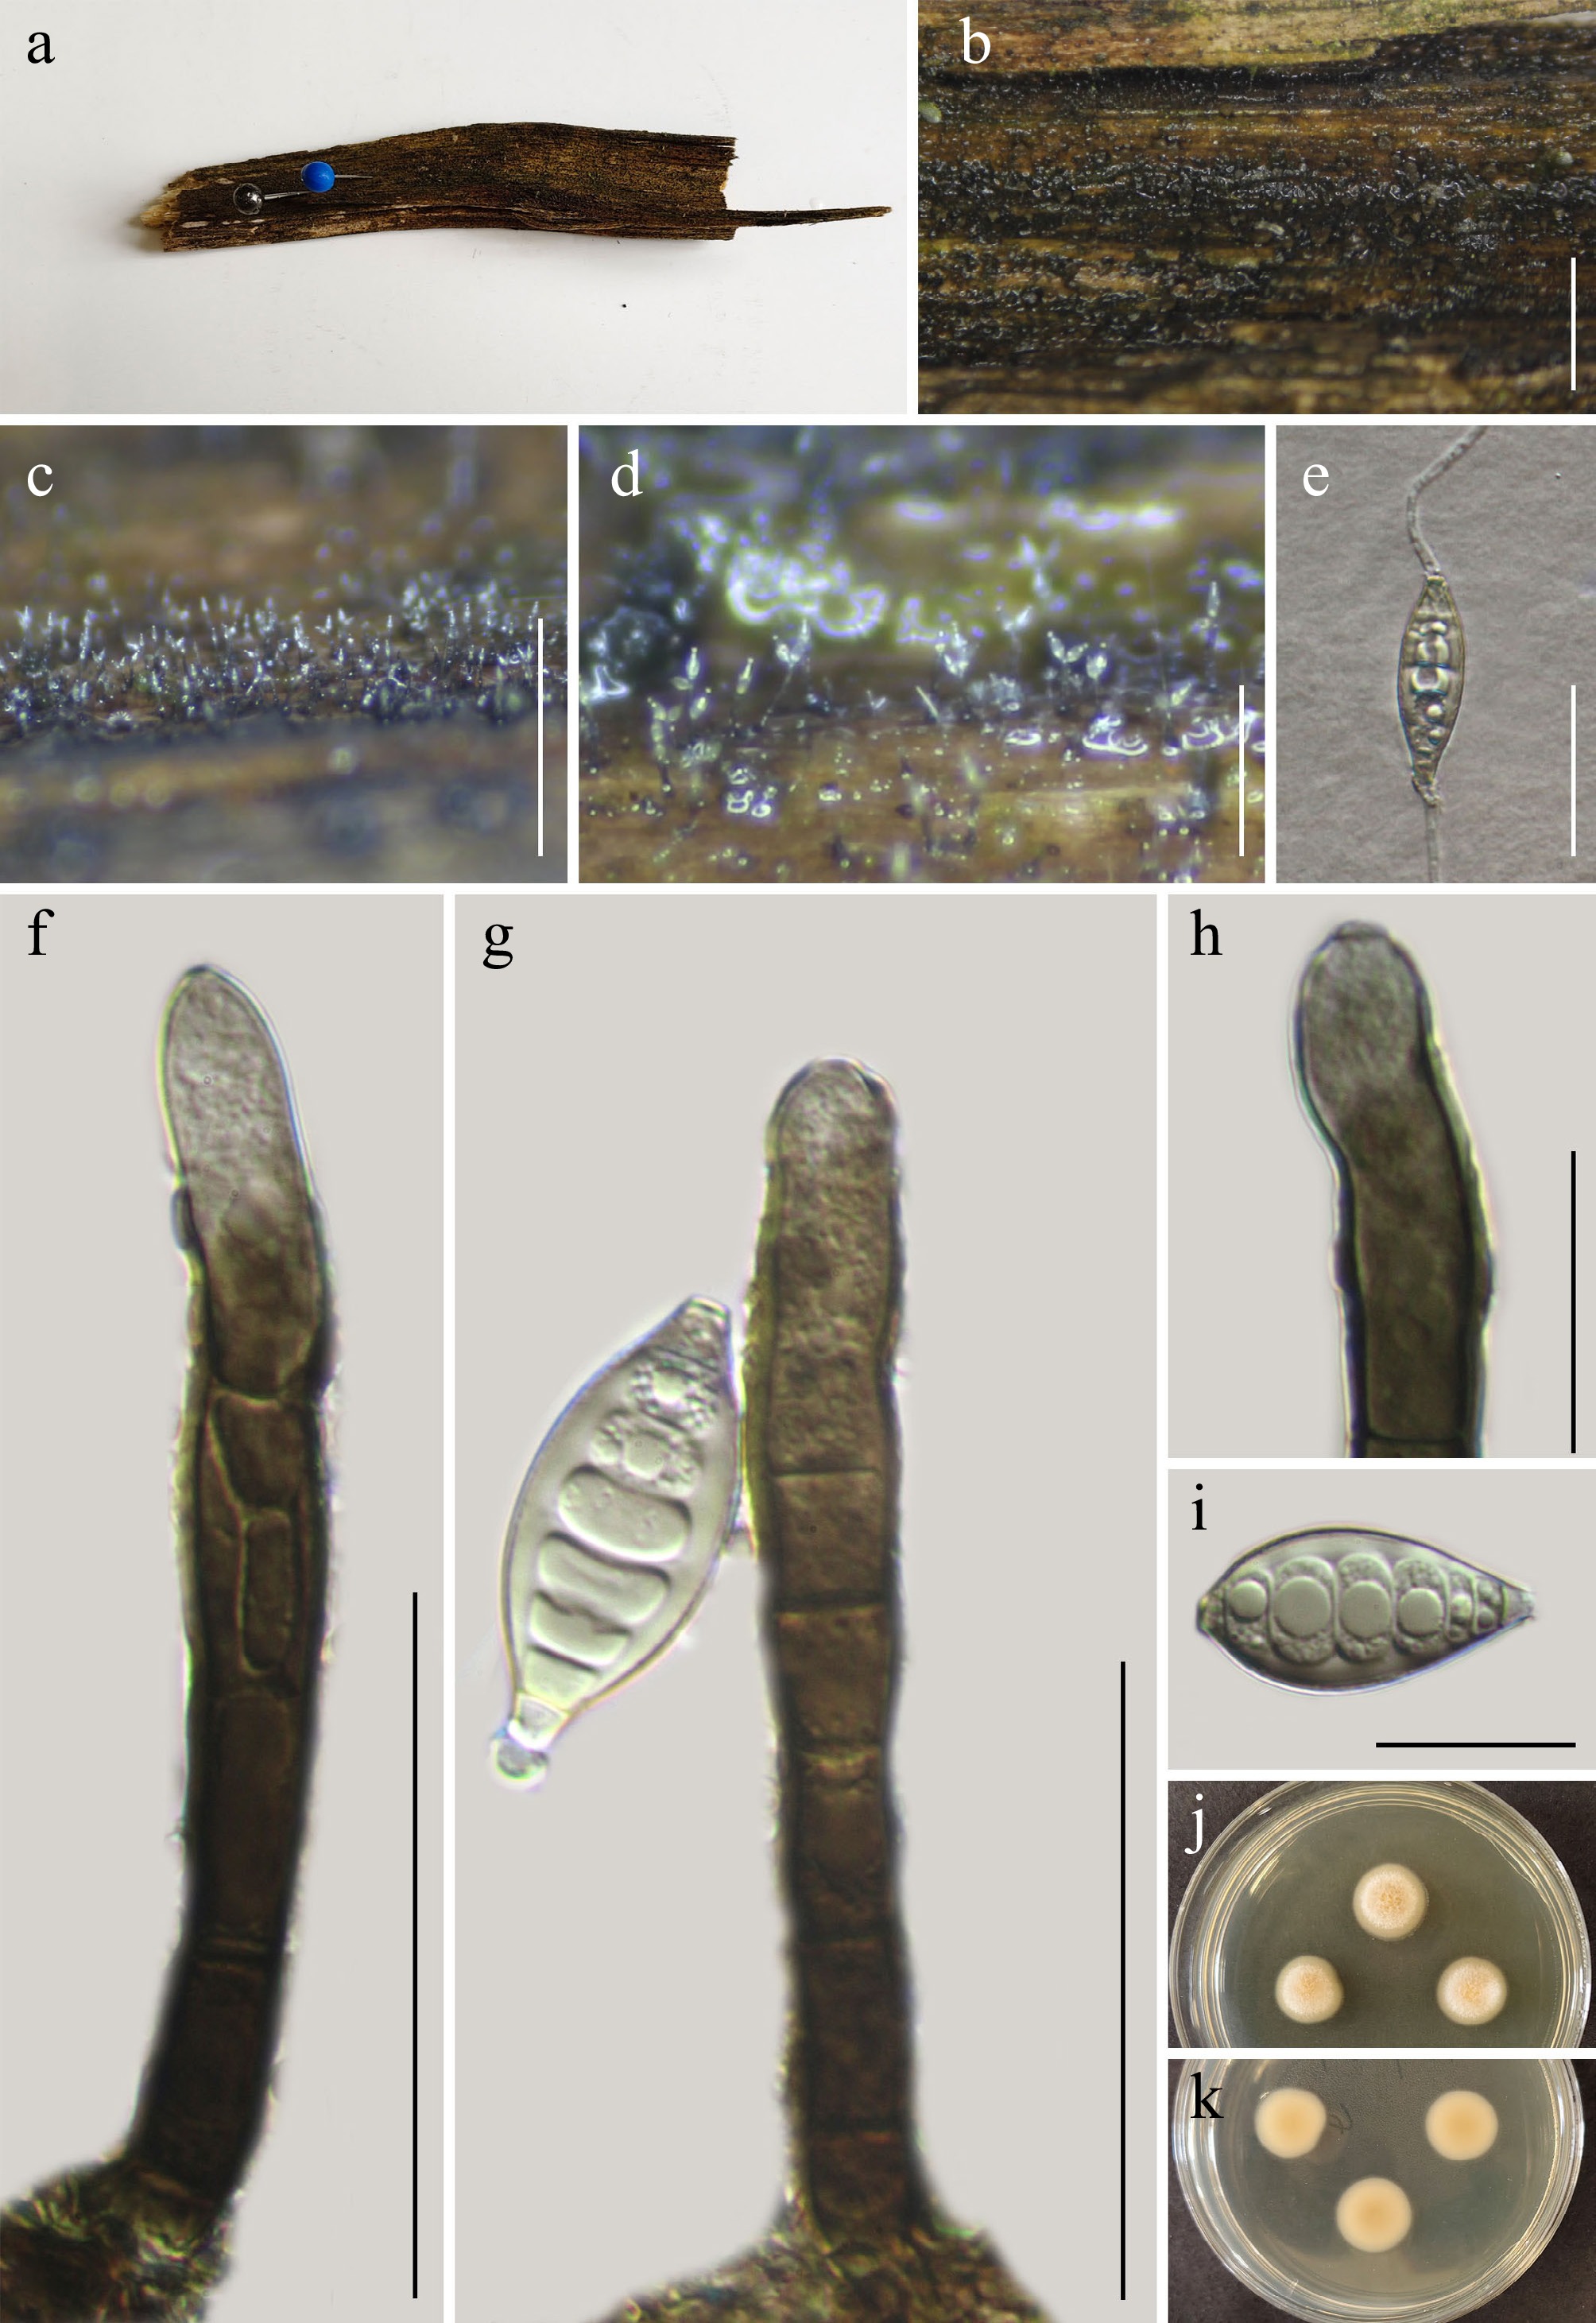
Figure 21.
Strossmayeria multiseptata (GMB5166 holotype). (a) Host. (b)–(d) Colonies on natural substrate. (e) Germinating conidium. (f), (g) Conidiophores and conidia. (h) Conidiogenous cells. (i) Conidia. (j), (k) Surface and reverse view of culture on PDA. Scale bars: b = 3 mm, c =1 mm, d = 0.3 mm, e = 30 μm, f, g = 50 μm, h, i= 20 μm.
-
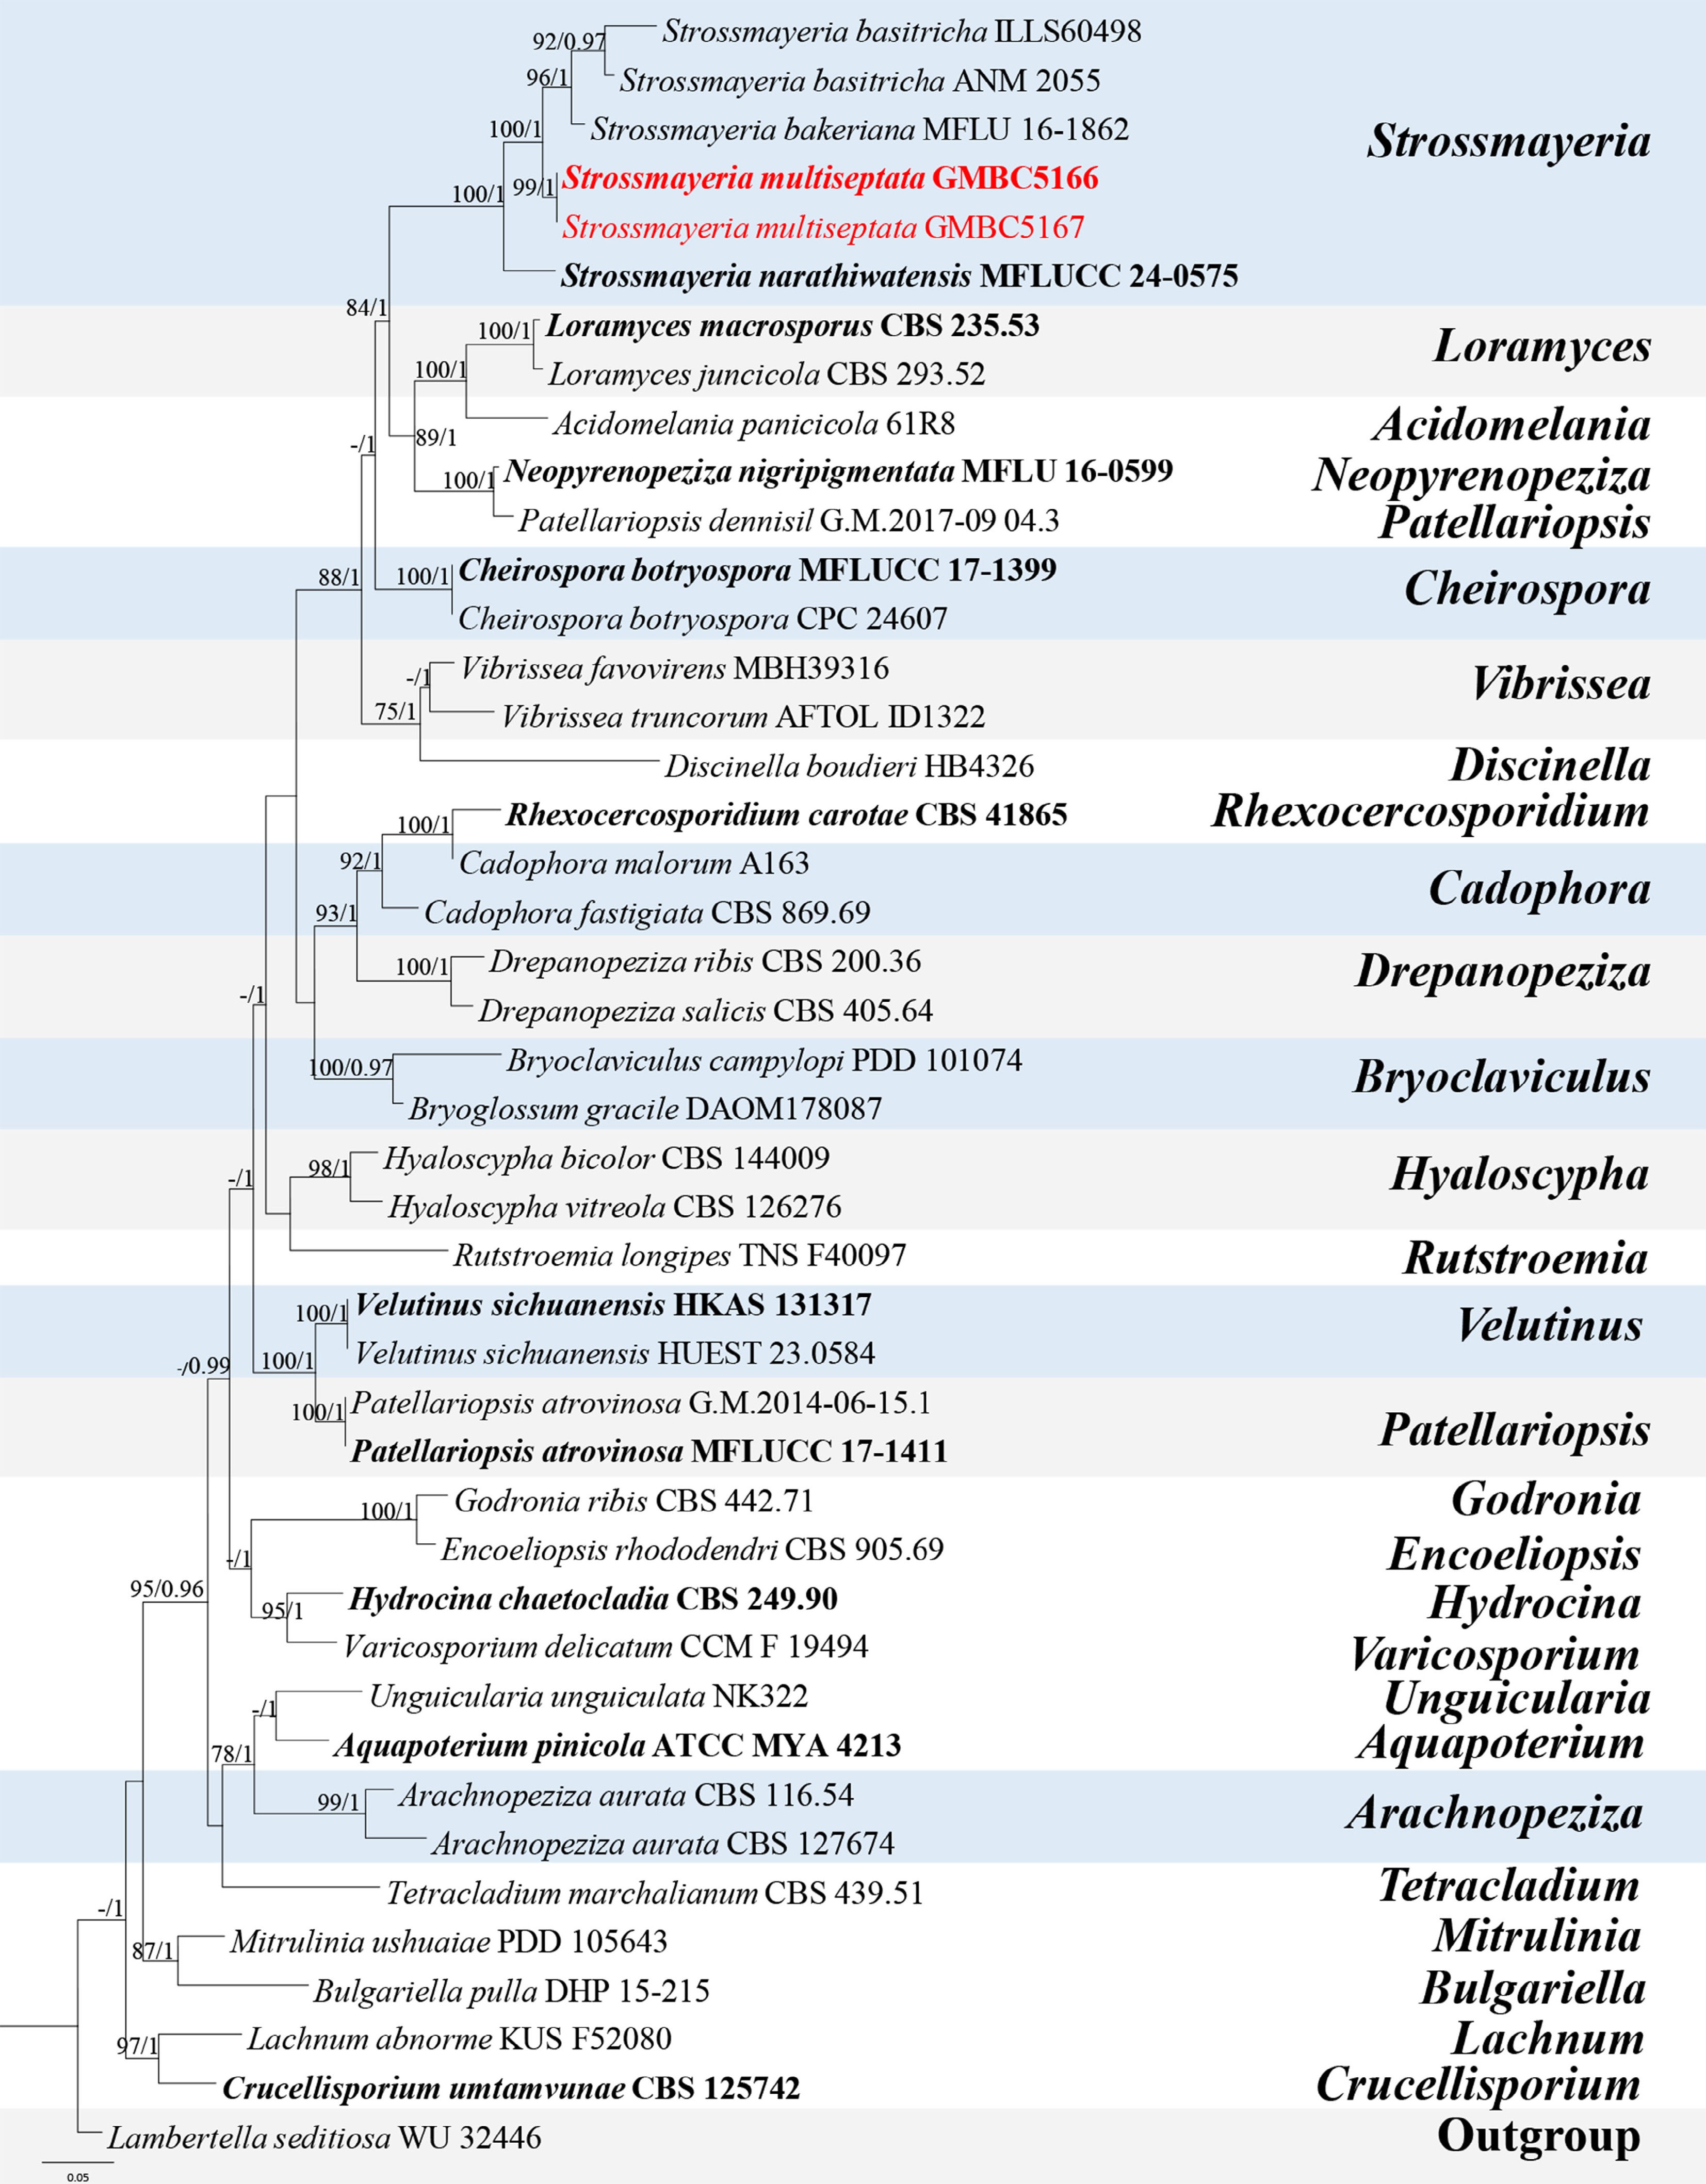
Figure 22.
ML tree of selected species of Strossmayeria and related genera inferred from a combined ITS-LSU dataset. The combined dataset comprised 44 taxa, 1,447 aligned sites (ITS:1–542 bp; LSU: 543–1,447 bp) including indel regions. Maximum likelihood (lnL = −11,968.462866) and Bayesian analyses produced consistent tree topologies. Lambertella seditiosa (WU 32446) was selected as the outgroup taxon. Bayesian posterior probabilities (PP) ≥ 0.90 and RAxML bootstrap support values ≥ 70 % are shown on the branches. The newly described species is marked in red. Ex-type/type strains are indicated in bold.
-
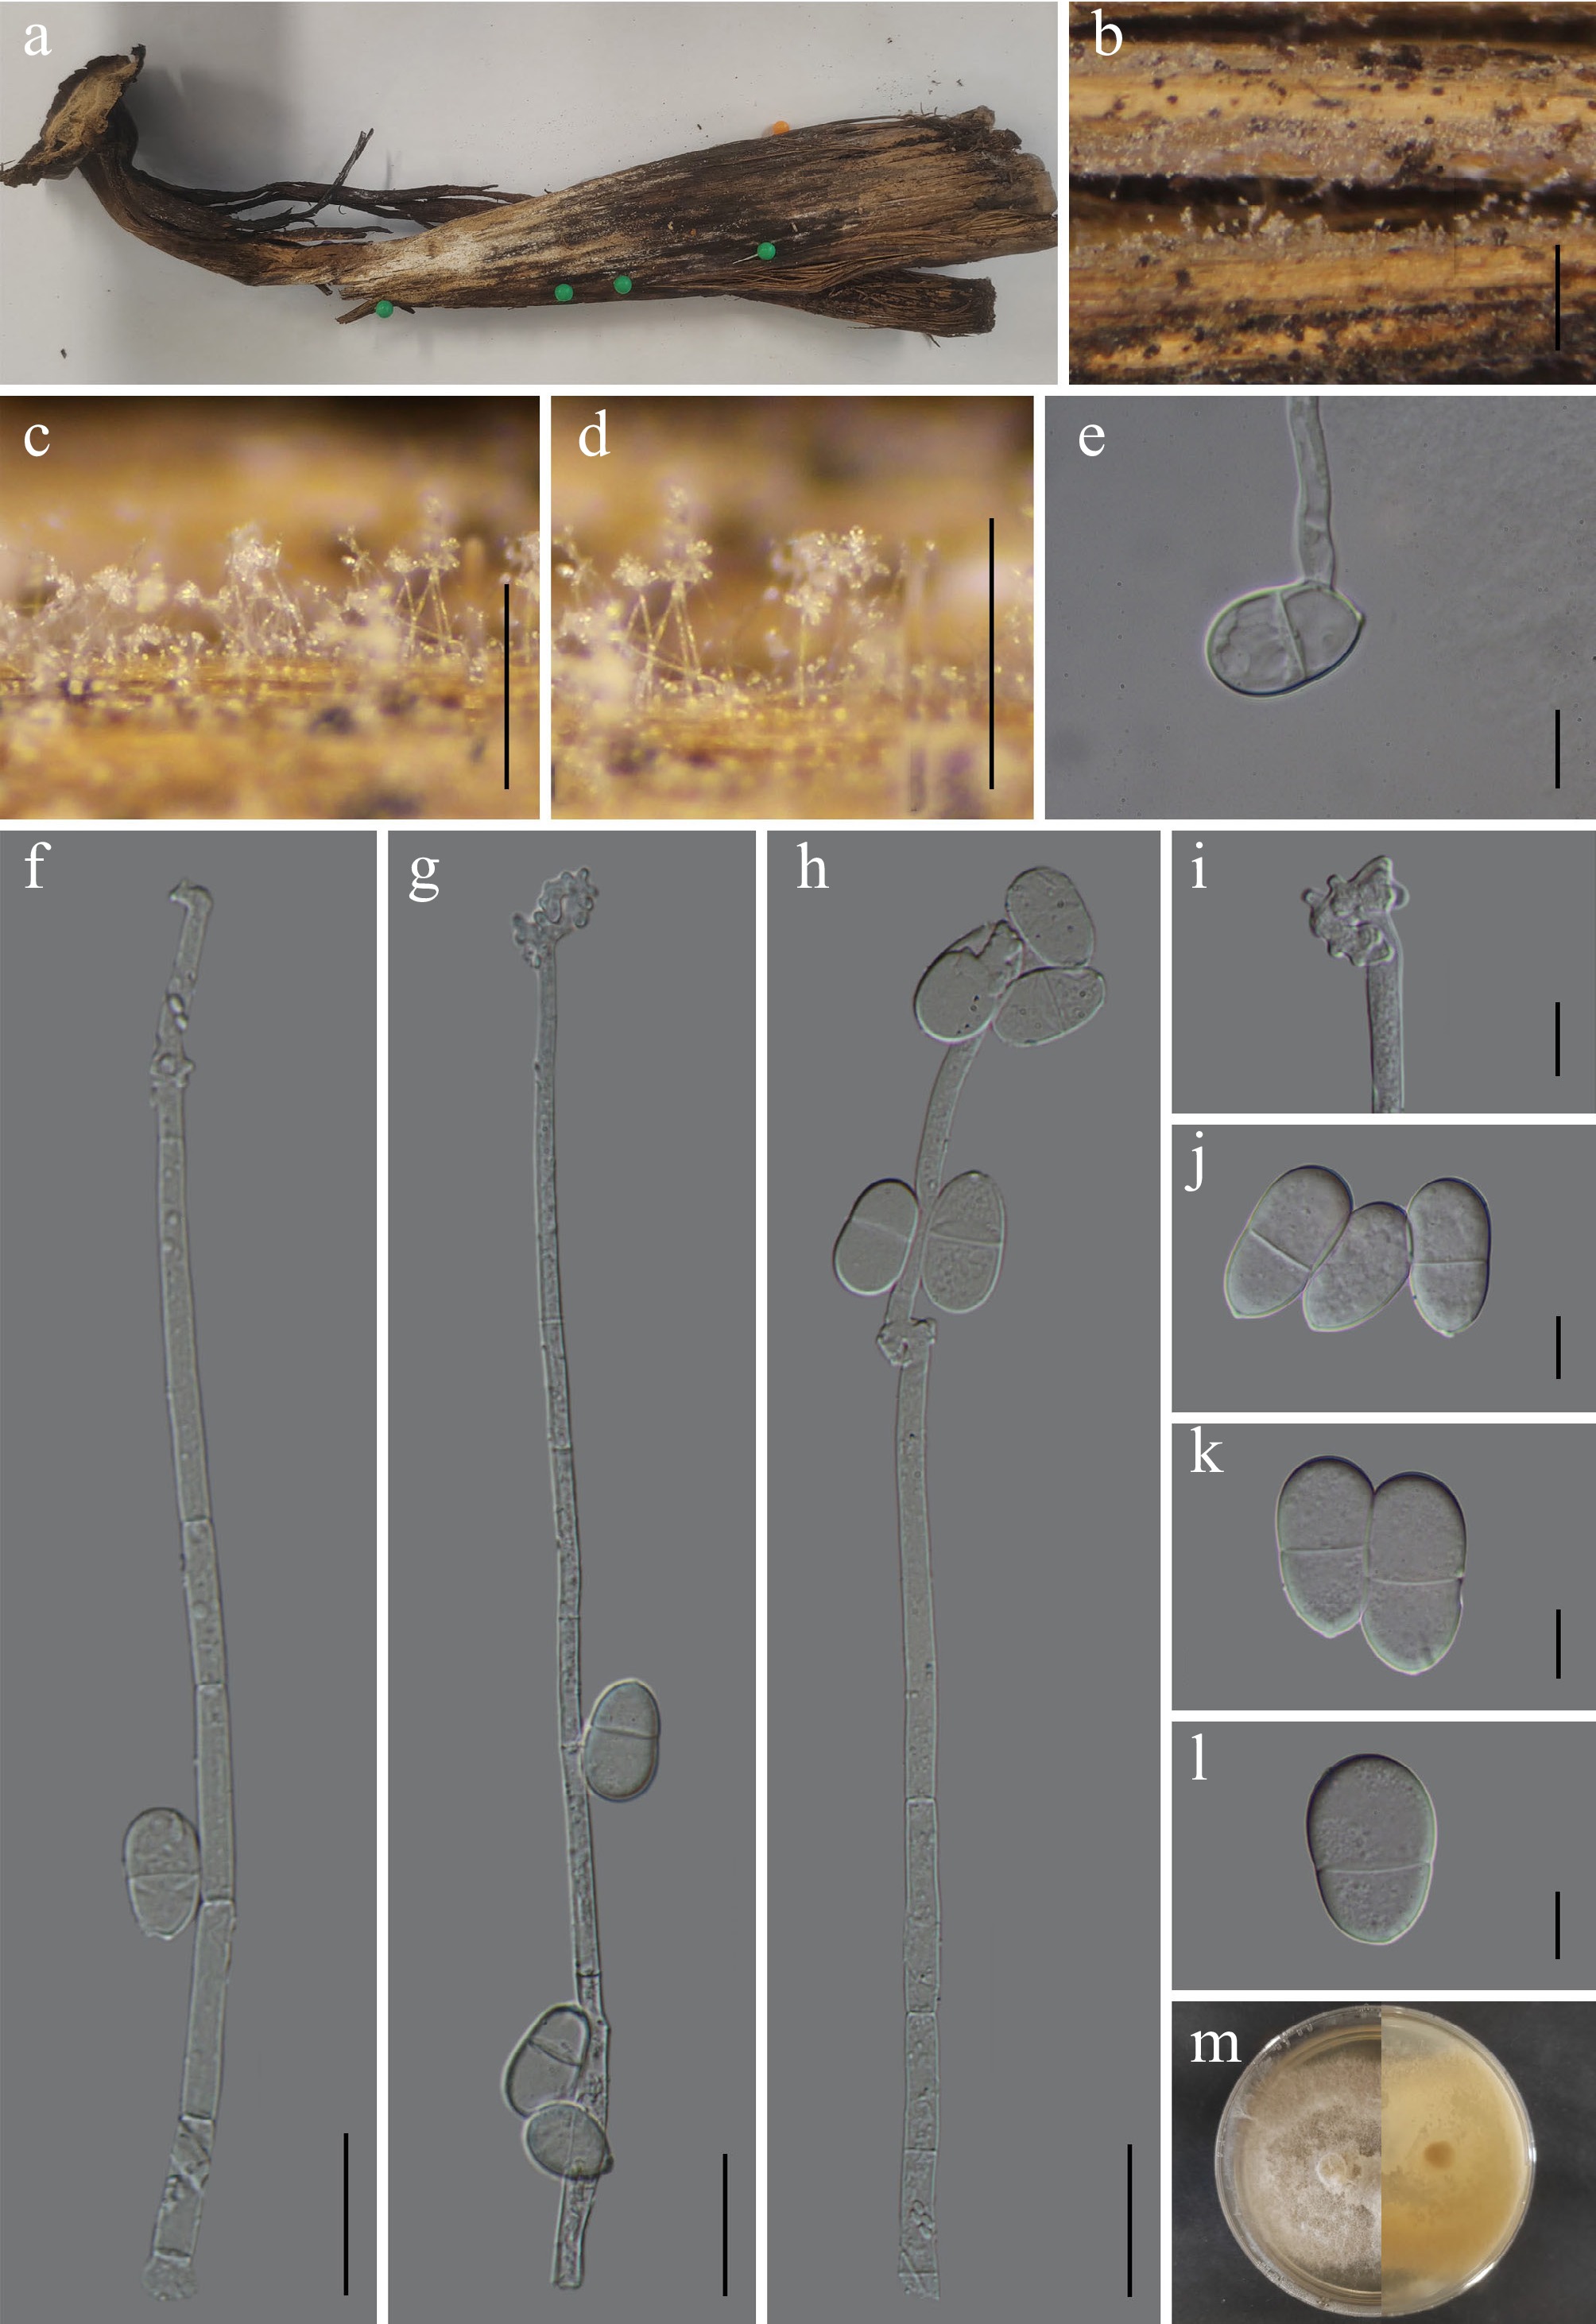
Figure 23.
Arthrobotrys bambusicola (GMB6933 holotype). (a) Host. (b)–(d) Colonies on natural substrate. (e) Germinating conidium. (f)–(h) Conidiophores and conidia. (i) Conidiogenous cells. (j)–(l) Conidia. (m) Surface and reverse view of culture on PDA. Scale bars: b = 1 mm, c, d = 0.5 mm, f– h = 30 μm, e, i–l = 10 μm.
-
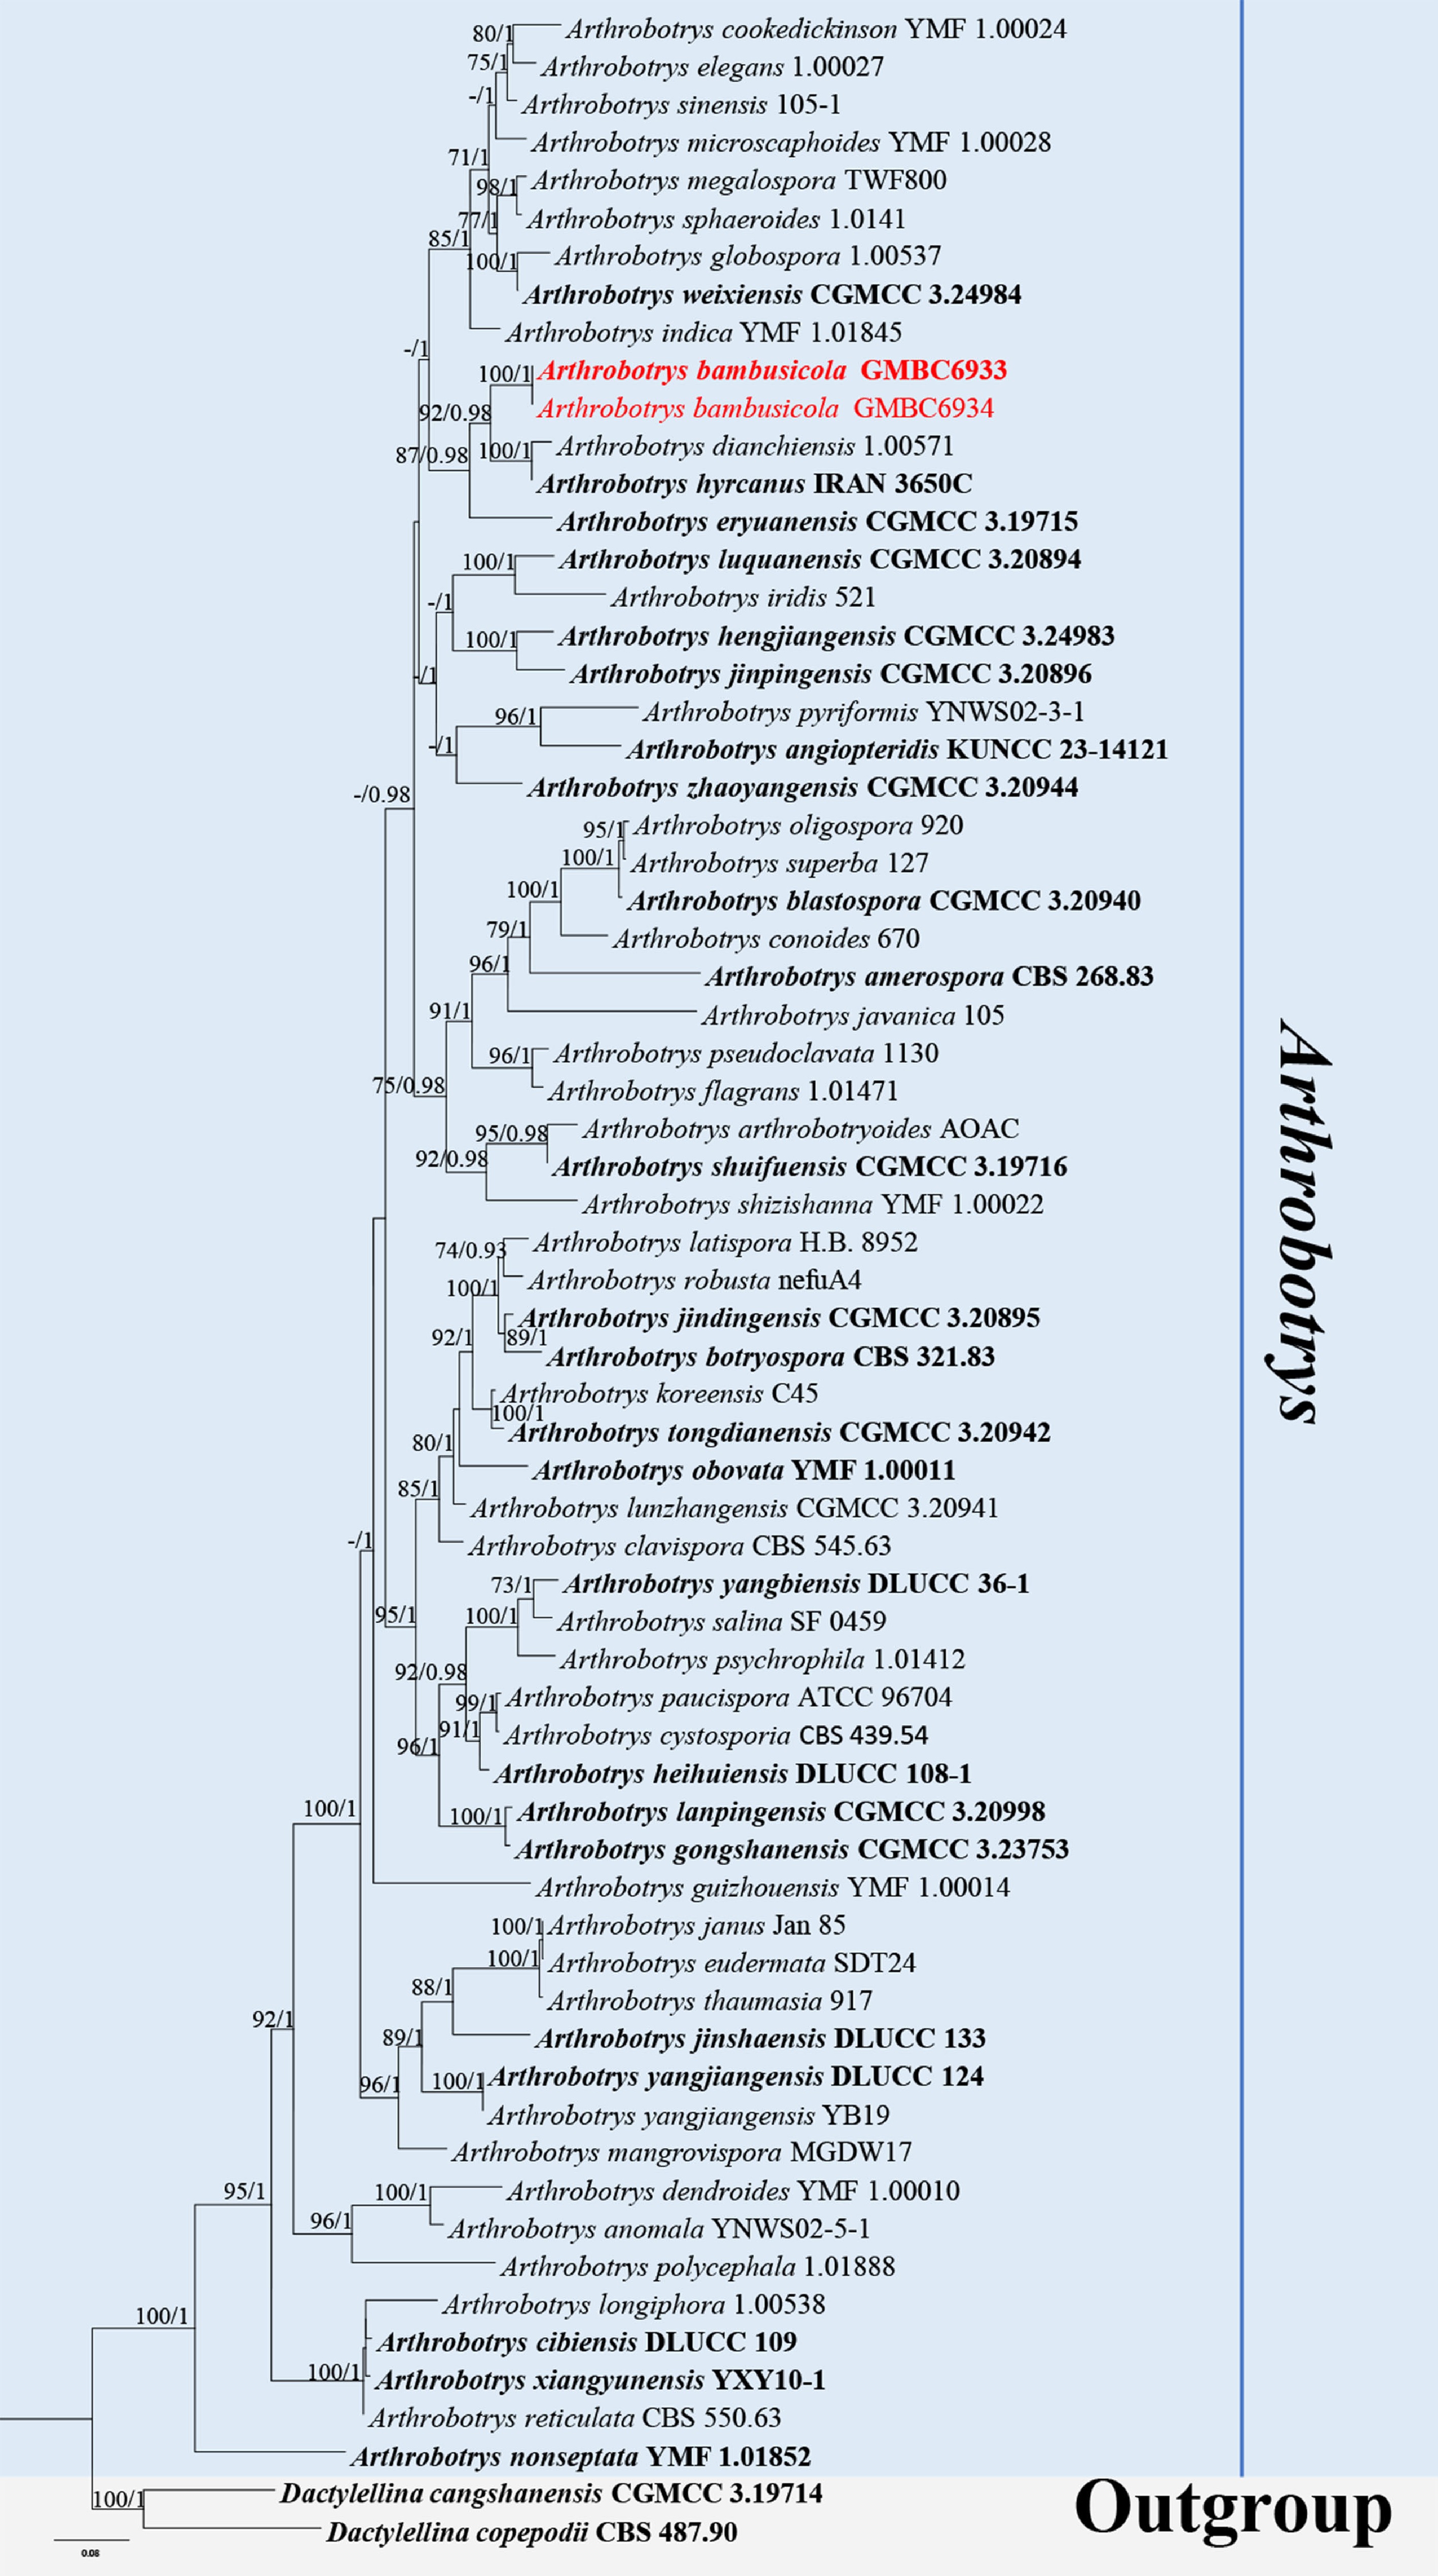
Figure 24.
ML tree of selected Arthrobotrys species based on the ITS -tef1-α-rpb2 dataset. The combined dataset comprised 67 taxa, 2,405 characters (ITS:1–613 bp; tef1-α: 614–1,554 bp; rpb2: 1,555–2,405 bp), including indel regions. Maximum likelihood (lnL = −29,133.876958) and Bayesian analyses produced consistent tree topologies. Dactylellina cangshanensis (CGMCC 3.19714) and D. copepodii (CBS 487.90) were selected as the outgroup taxa. Bayesian posterior probabilities (PP) ≥ 0.90 and RAxML bootstrap support values ≥ 70 % are shown on the branches. The newly described species is marked in red. Ex-type/type strains are indicated in bold.
-
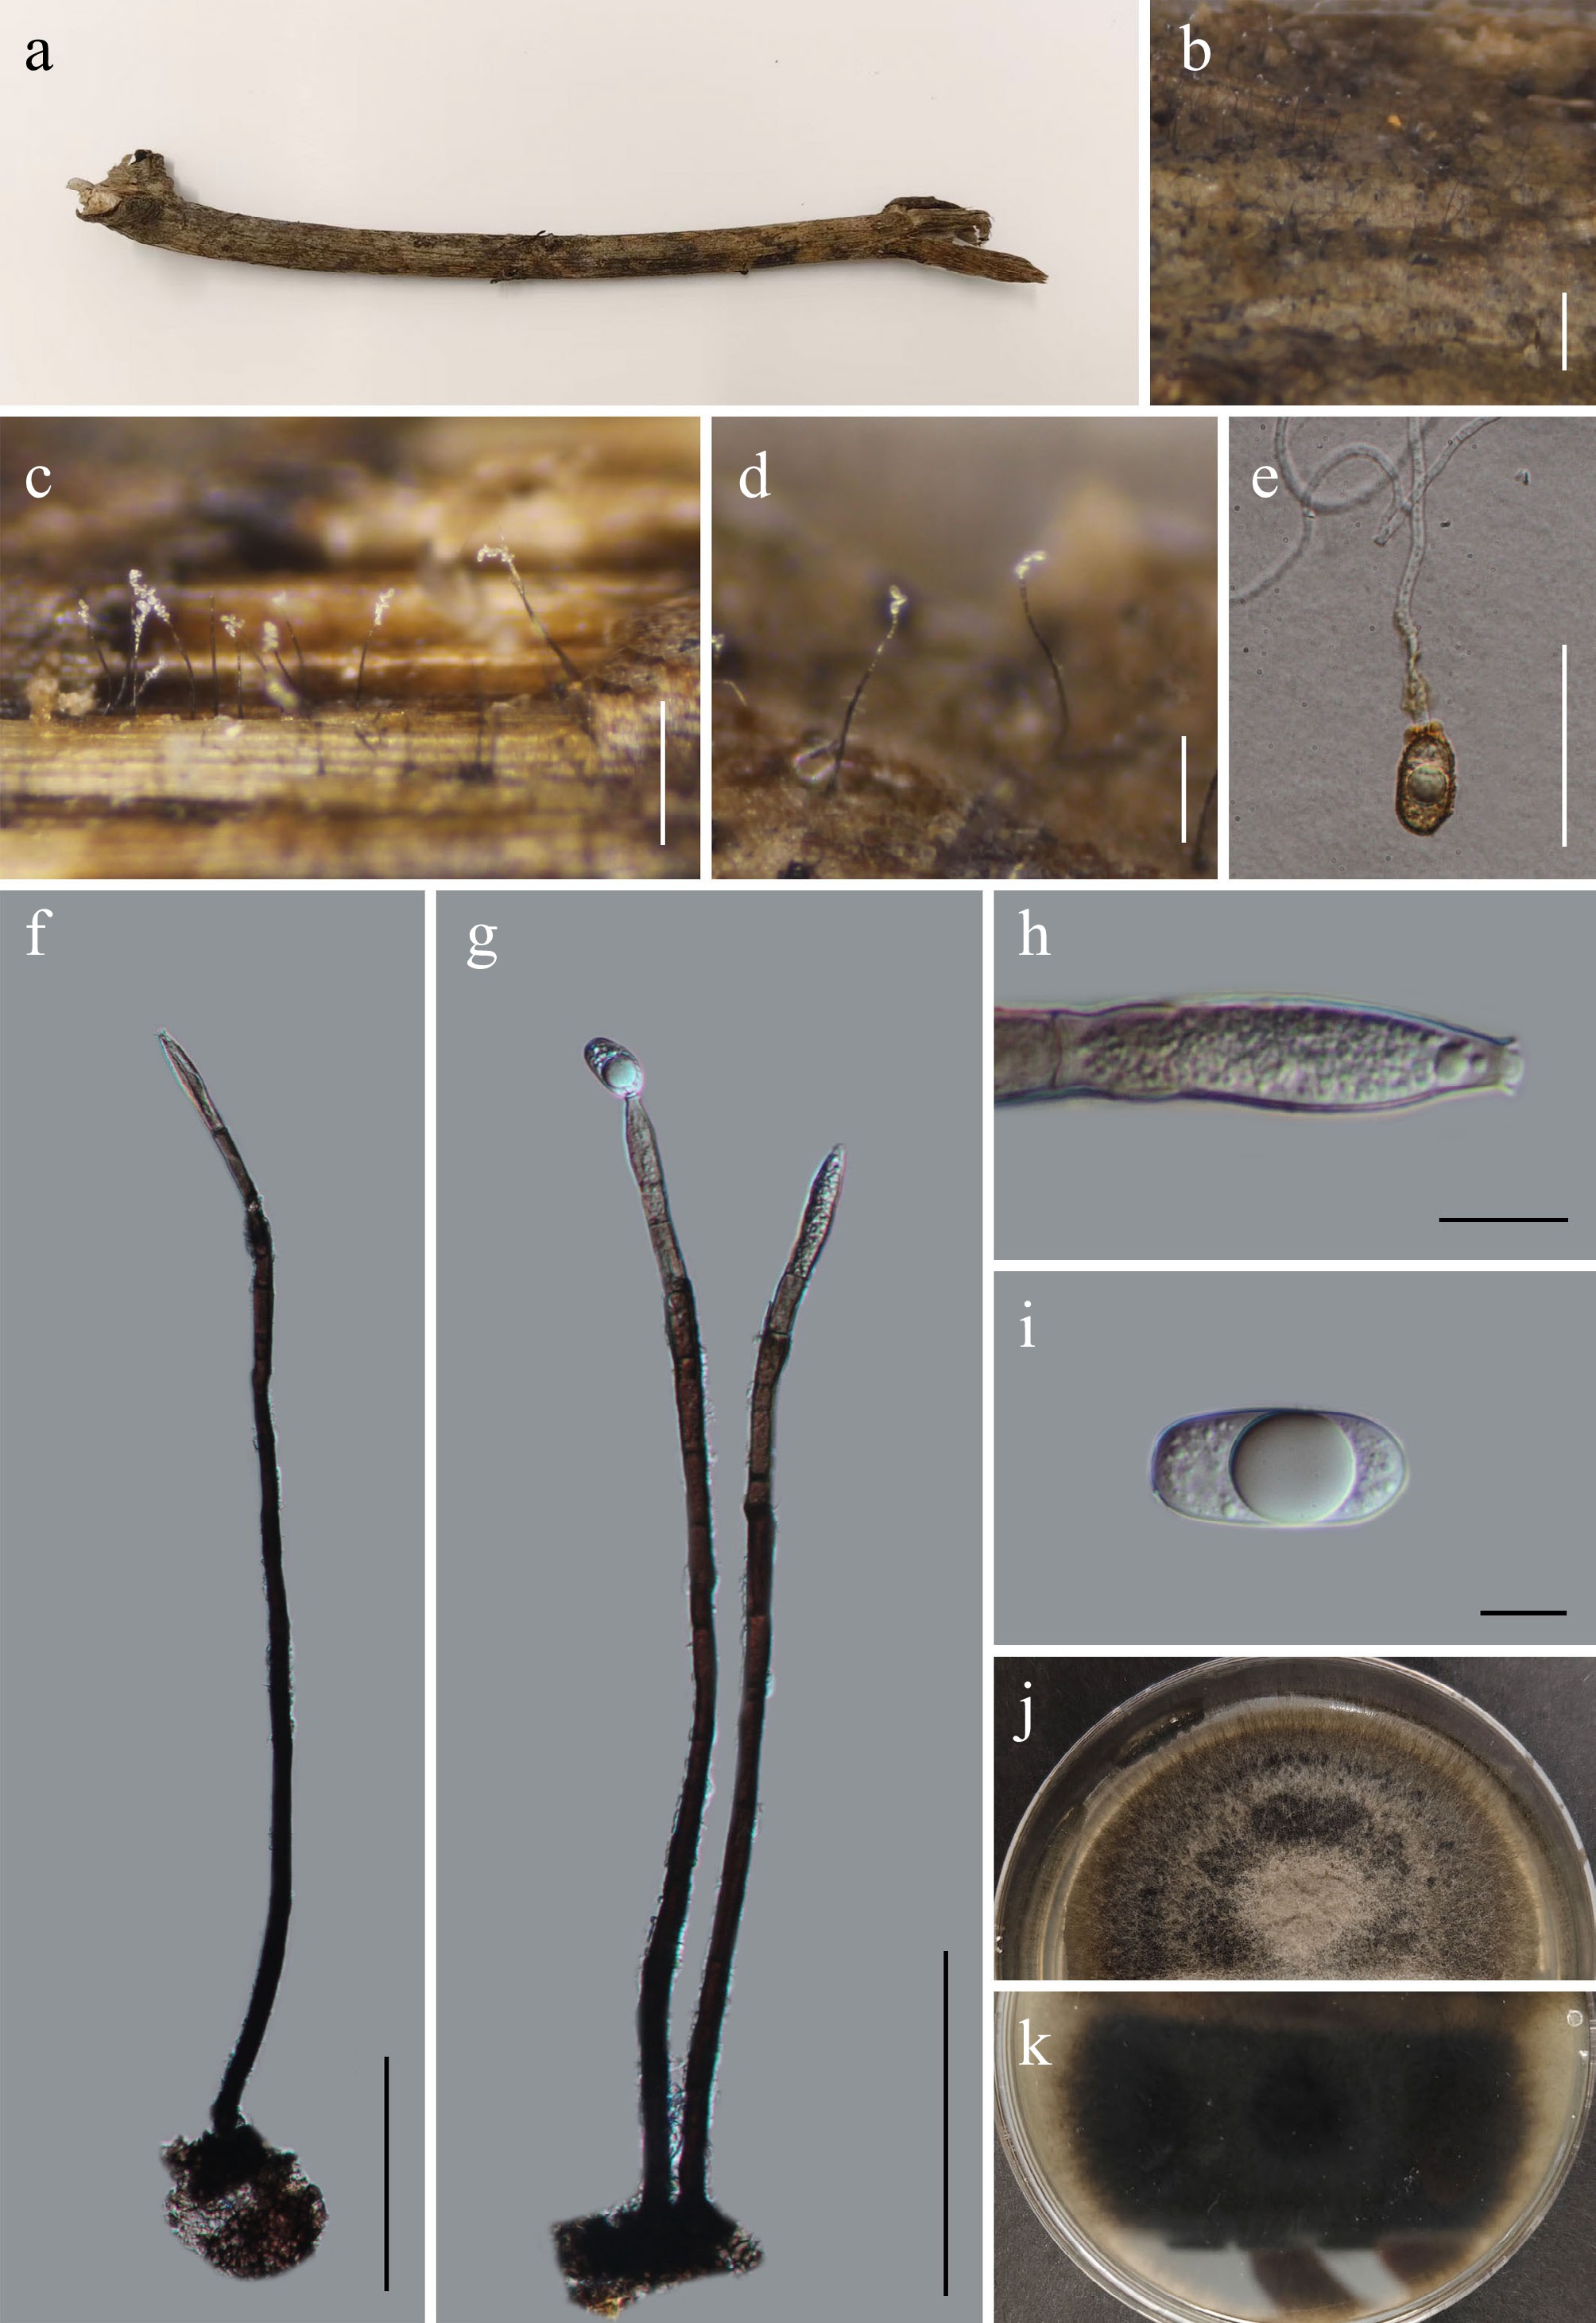
Figure 25.
Monilochaetes camelliae (GMB5170). (a) Host. (b)–(d) Colony on natural substrate. (e) Germinating conidium. (f), (g) Conidiophores and conidia. (h) Conidiogenous cells. (i) Conidium. (j), (k) Surface and reverse view of culture on PDA. Scale bars: b = 1 mm, c = 0.5 mm, d = 0.25 mm, e = 50 μm, f, g = 100 μm, h, i = 10 μm.
-
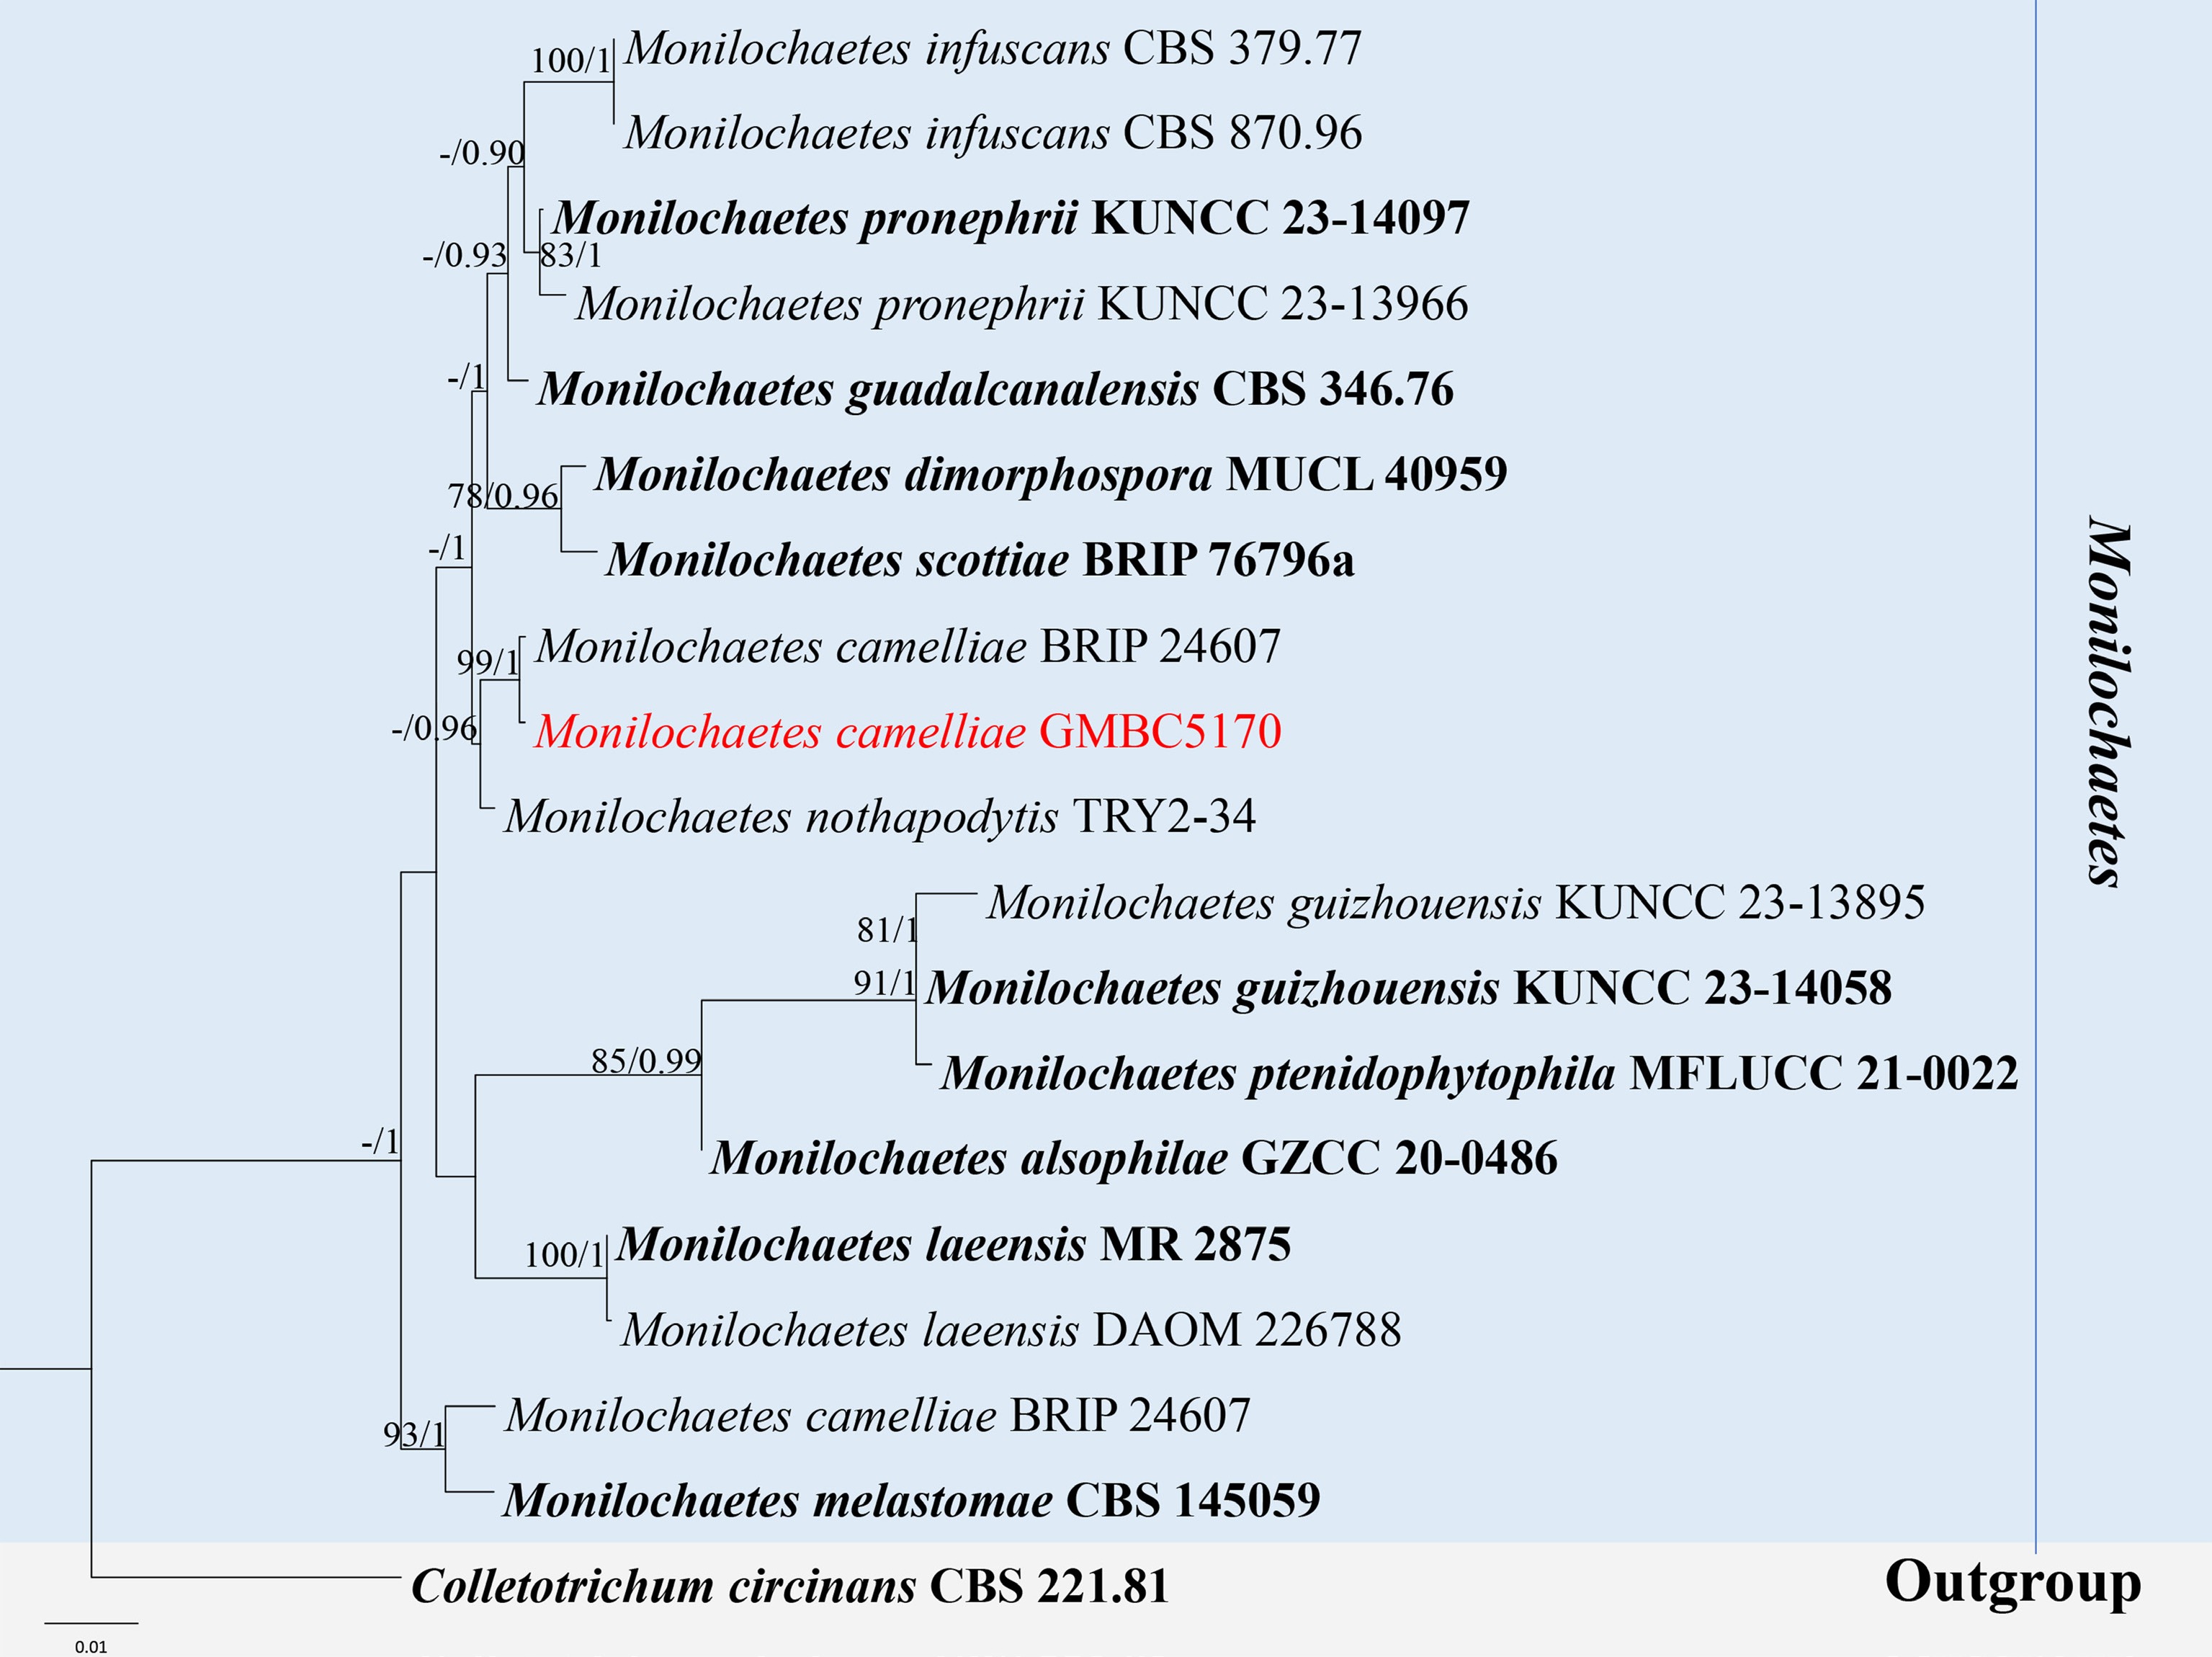
Figure 26.
ML tree of selected Monilochaetes species based on the ITS-LSU-SSU dataset. The combined dataset comprised 19 taxa, 2,435 characters (ITS: 1–505 bp; LSU: 506–1,400 bp; SSU: 1,401–2,435 bp), including indel regions. Maximum likelihood (lnL = −5292.494395) and Bayesian analyses produced consistent tree topologies. Colletotrichum circinans (CBS 221.81) was selected as the outgroup taxon. Bayesian posterior probabilities (PP) ≥ 0.90 and RAxML bootstrap support values ≥ 70 % are shown on the branches. The new record is marked in red. Ex-type/type strains are indicated in bold.
-
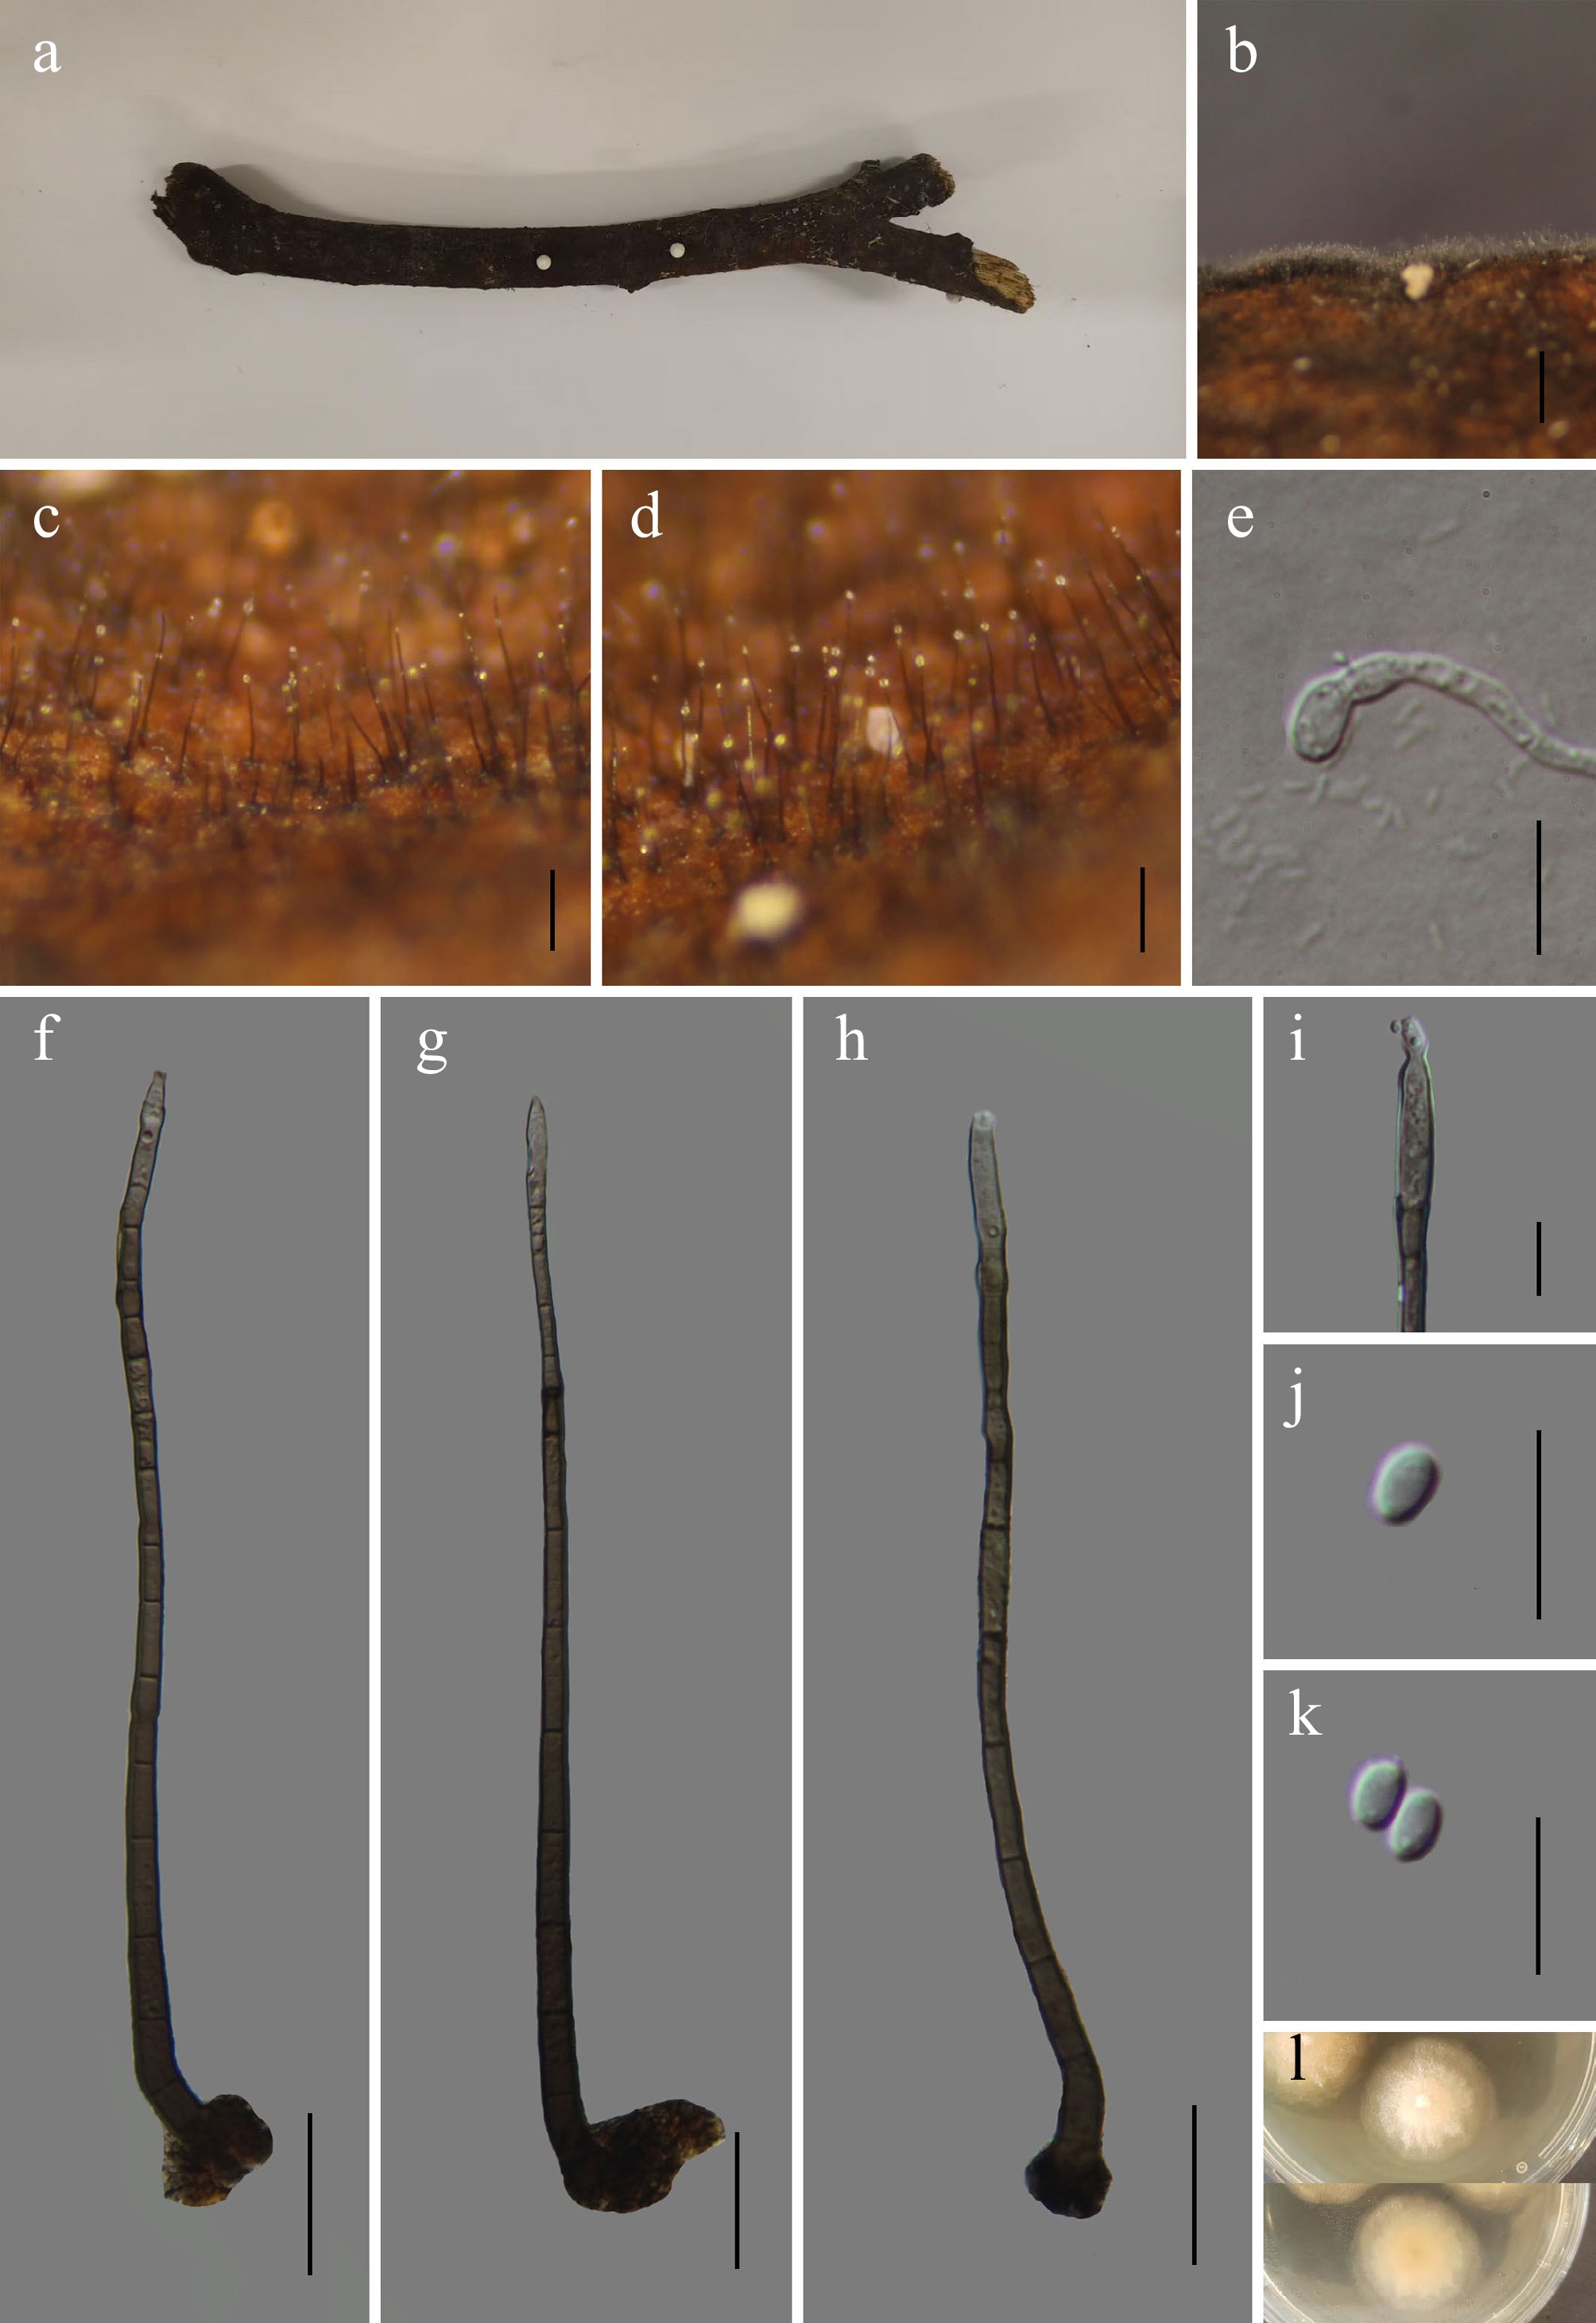
Figure 27.
Chaetosphaeria tongrenensis (GMB6921 holotype). (a) Host. (b)–(d) Colonies on natural substrate. (e) Germinating conidium. (f)–(h) Conidiophores and conidia. (i) Conidiogenous cells. (j), (k) Conidia. (l) Surface and reverse view of culture on PDA. Scale bars: b = 1 mm, c, d = 0.5 mm, f–h = 30 μm, e, i–k = 10 μm.
-
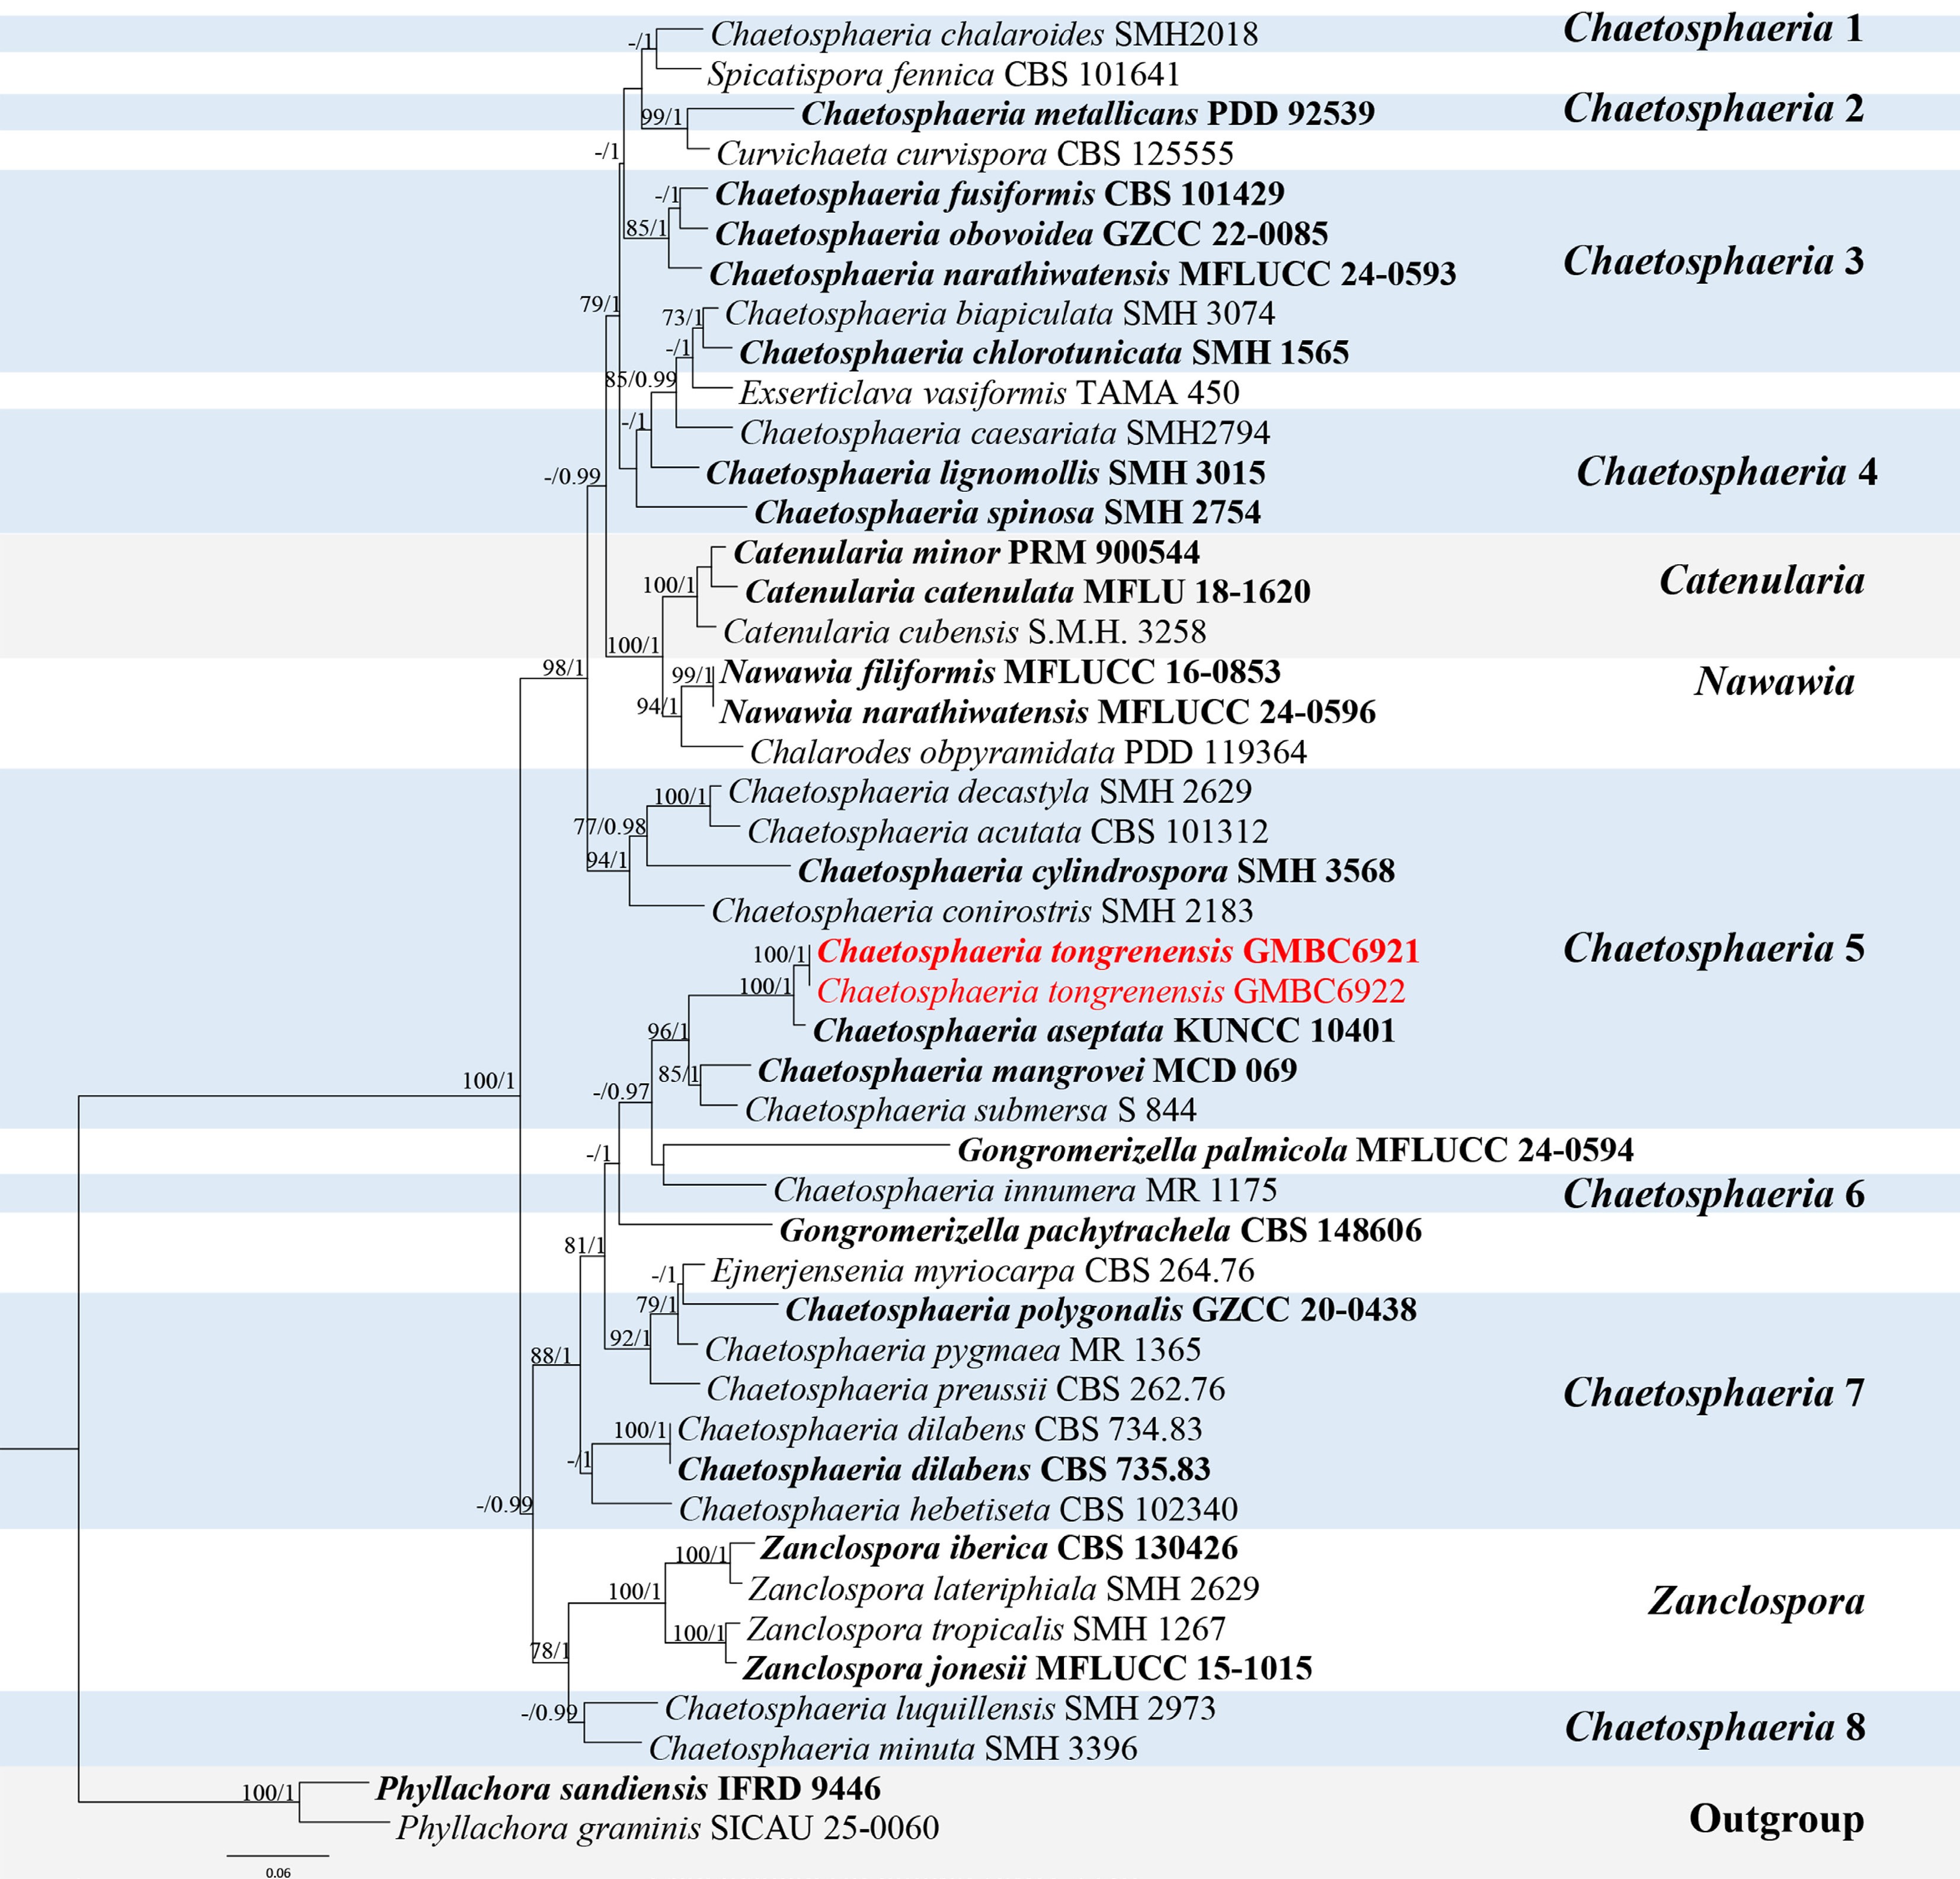
Figure 28.
ML tree of selected species of Chaetosphaeria and related genera in Chaetosphaeriaceae based on the ITS-LSU- tef1-αdataset. The combined dataset comprised 46 taxa, 2,292 characters (ITS: 1–498 bp; LSU: 499–1,383 bp; tef1-α: 1,384–2,292 bp), including indel regions. Maximum likelihood (lnL = −14,251.487607) and Bayesian analyses produced consistent tree topologies. Phyllachora graminis (SICAU 25-0060) and P. sandiensis (IFRD 9446) were selected as the outgroup taxa. Bayesian posterior probabilities (PP) ≥ 0.90 and RAxML bootstrap support values ≥ 70 % are shown on the branches. The novel species is marked in red, and ex-type/type strains are in bold.
-
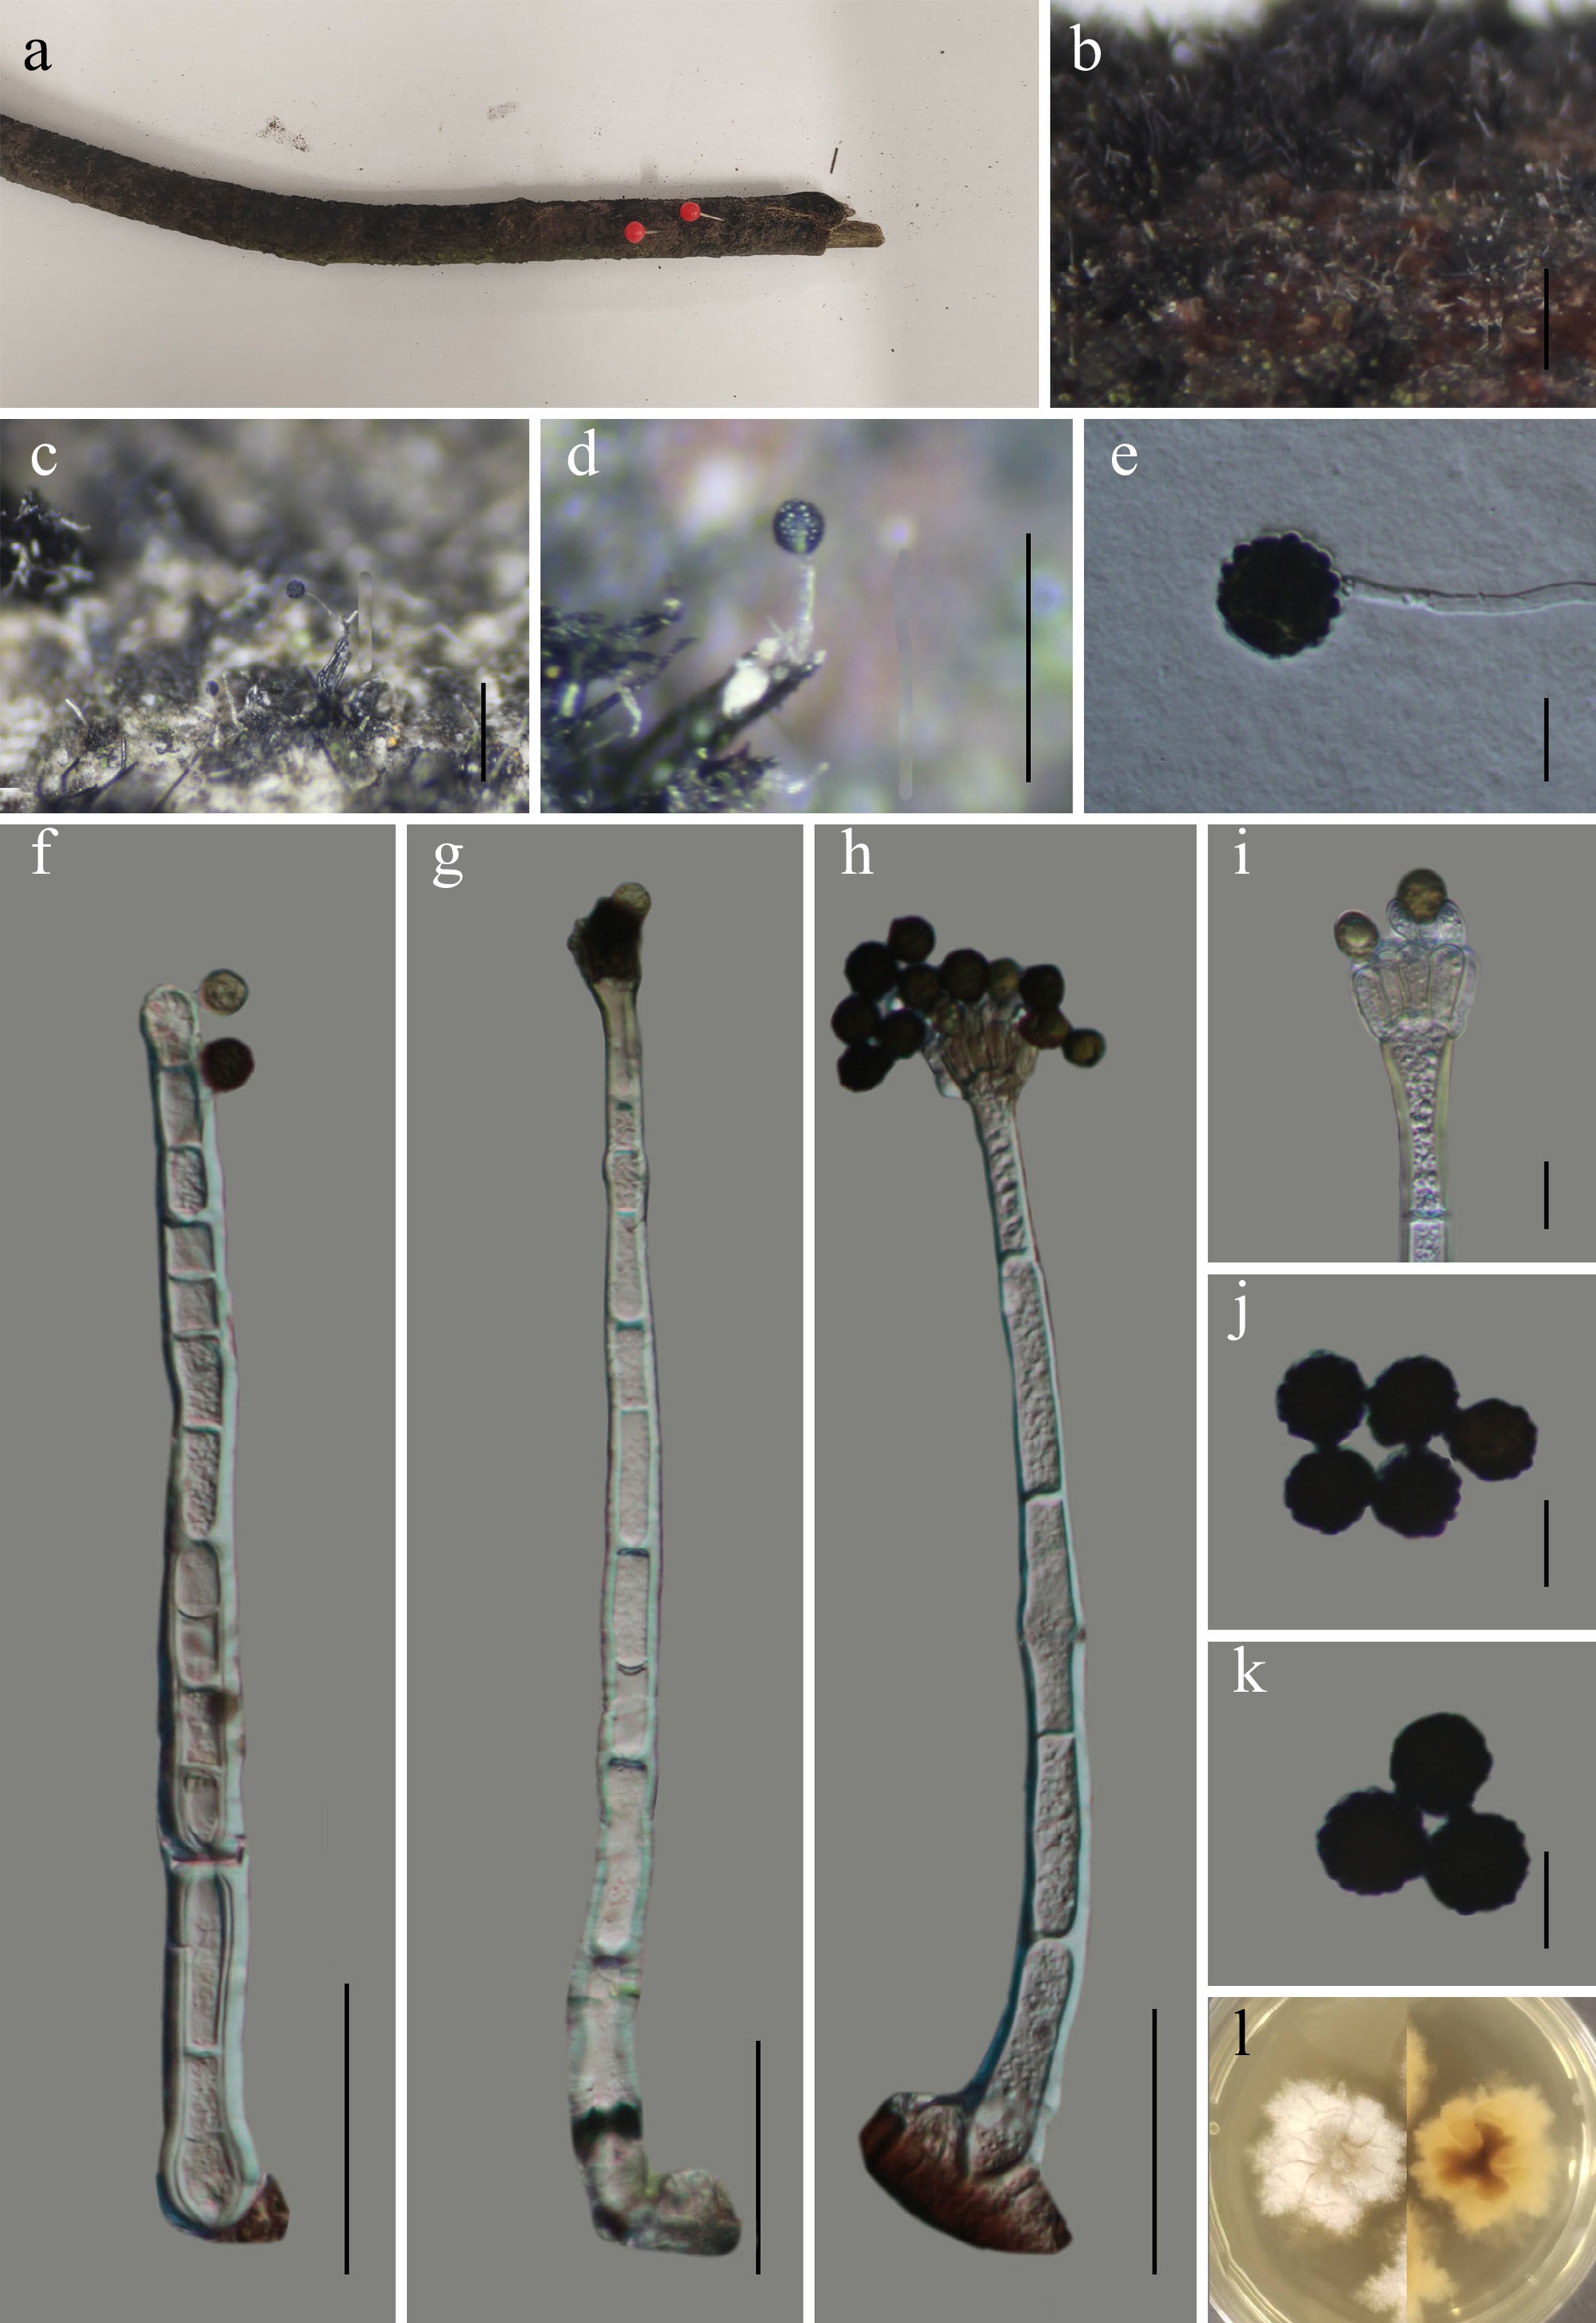
Figure 29.
Melanopsamma wumengshanense (GMB6943 holotype). (a) Host. (b)–(d) Colonies on natural substrate. (e) Germinating conidium. (f)–(h) Conidiophores and conidia. (i) Conidiogenous cells with conidia. (j), (k) Conidia. (l) Surface and reverse view of culture on PDA. Scale bars: b = 1 mm, c, d = 0.5 mm, f–h = 30 μm, e, i–k = 10 μm.
-
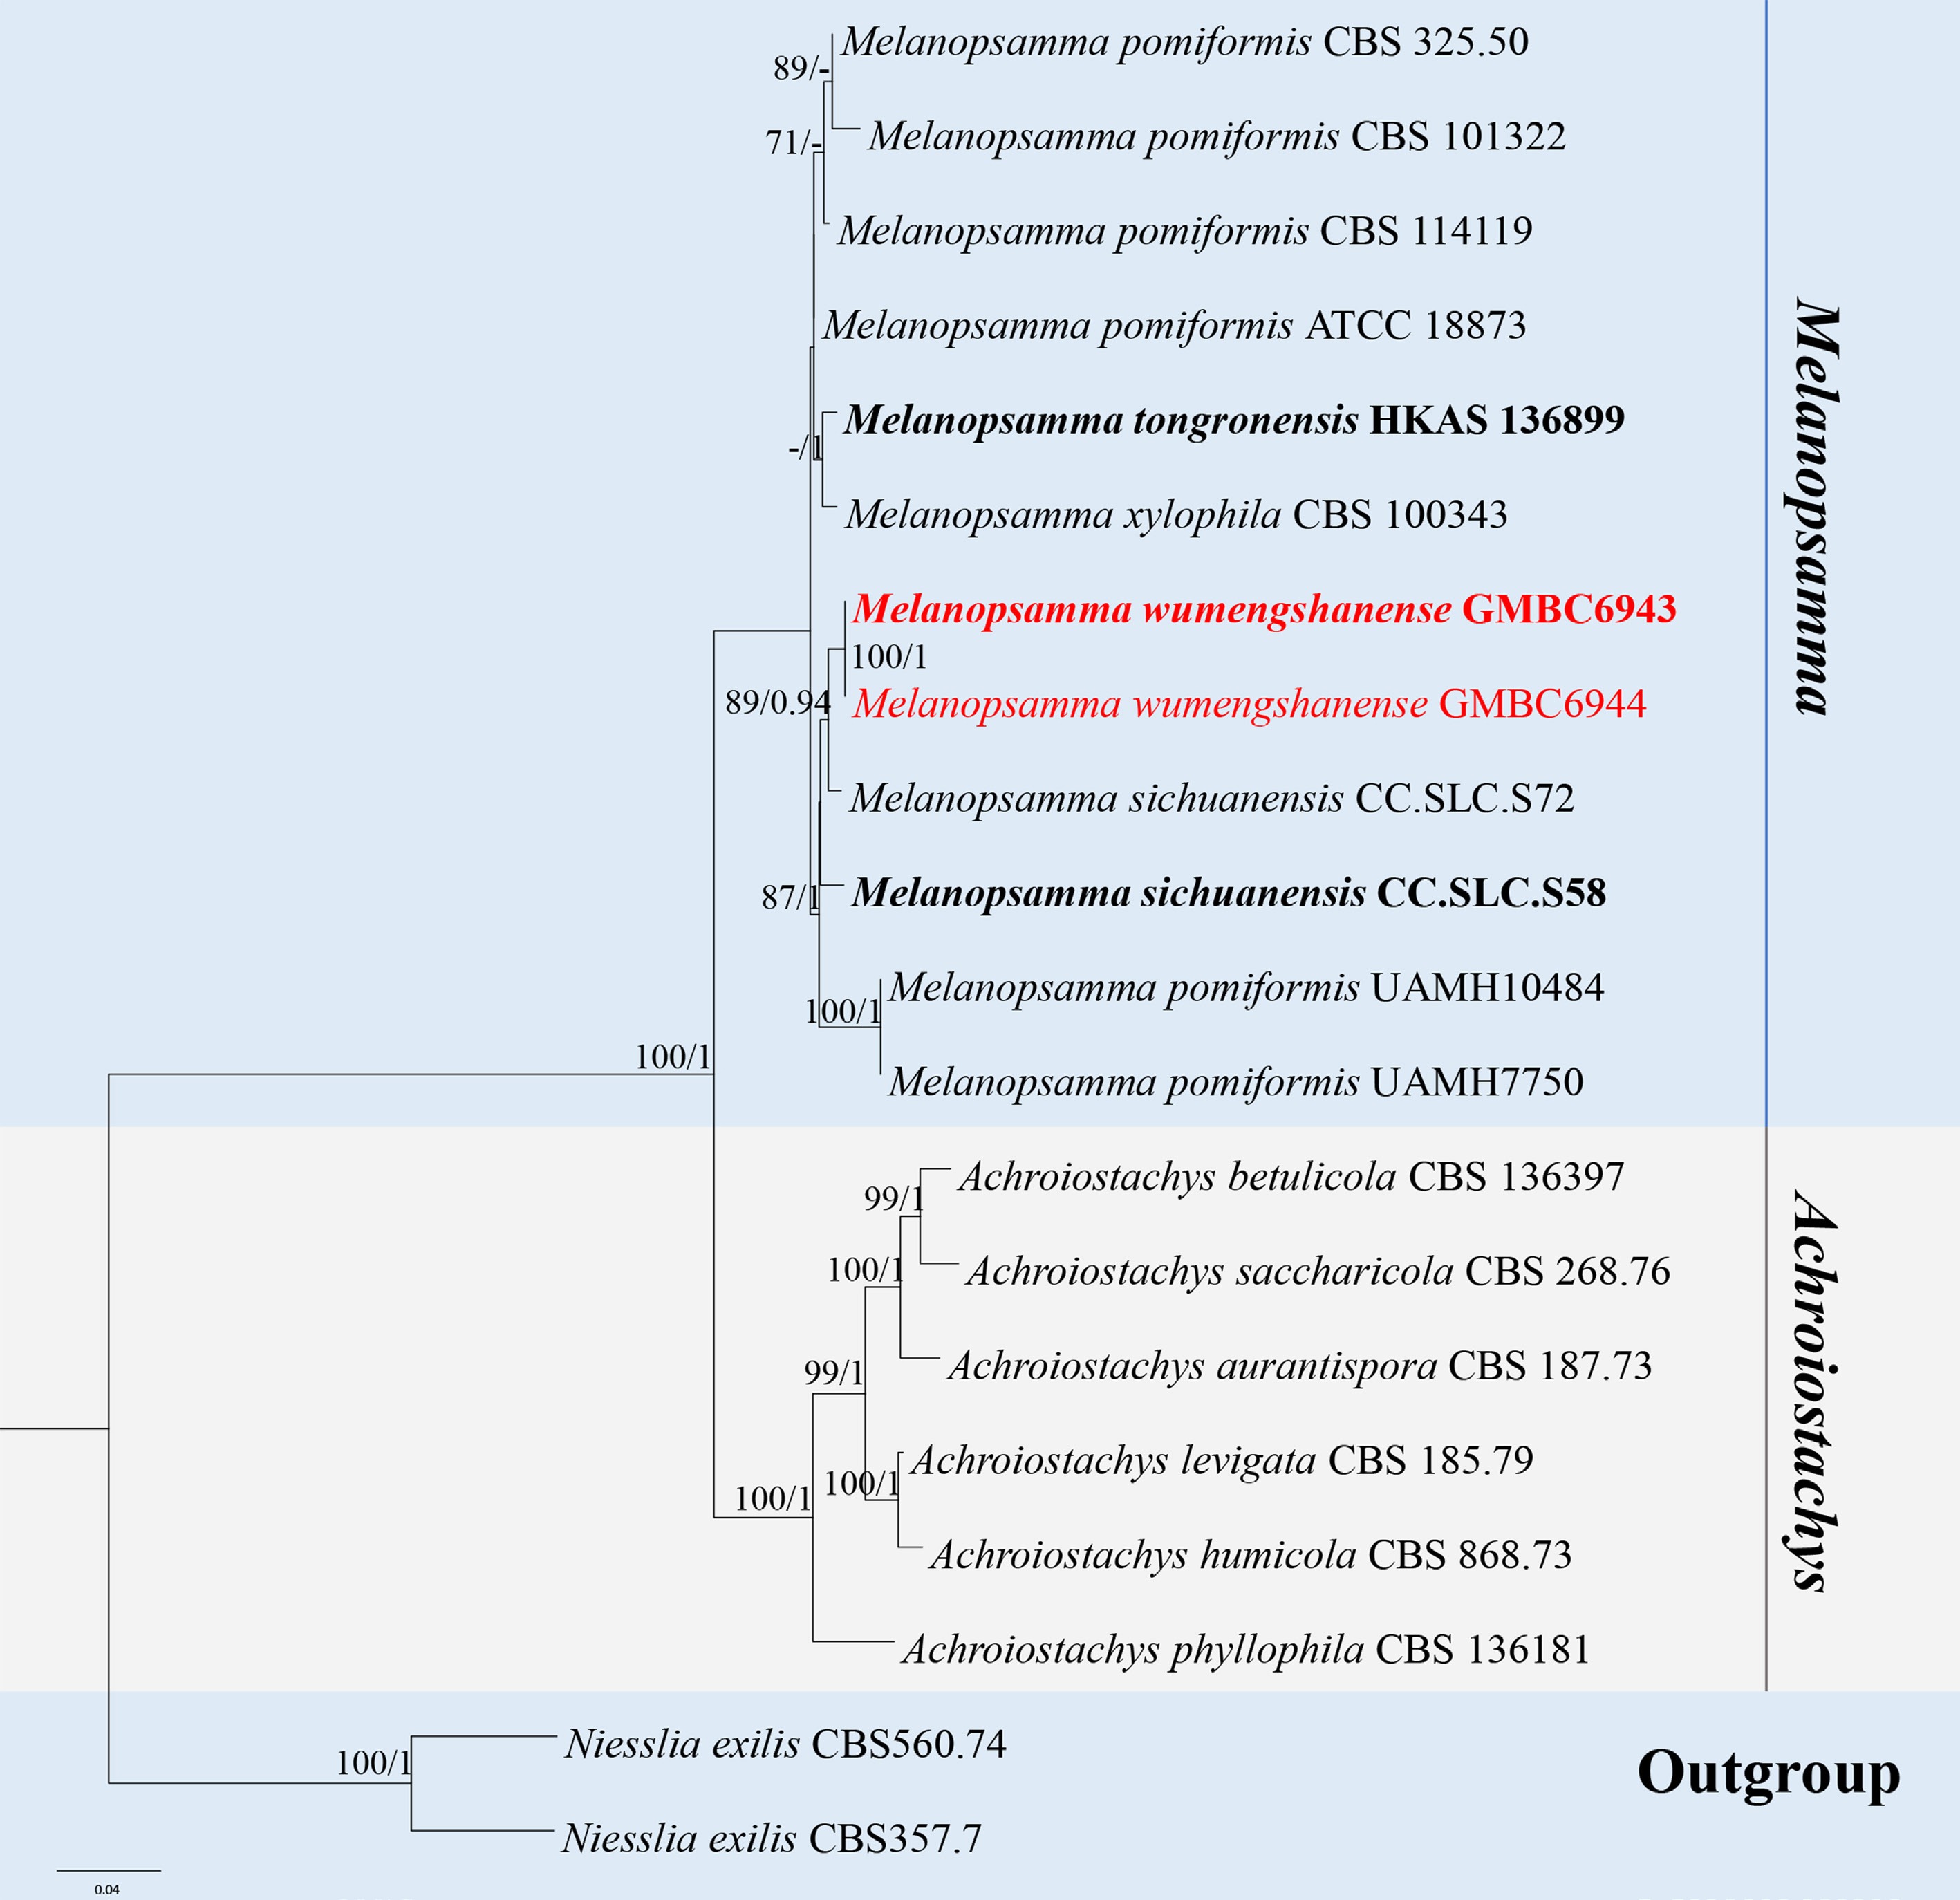
Figure 30.
ML tree of selected species of Melanopsamma and Achroiostachys inferred from a combined ITS-LSU-rpb2 dataset. The combined dataset comprised 20 taxa, 2,174 characters (ITS: 1–574 bp; LSU: 575–1,415 bp; rpb2: 1,416–2,174 bp), including indel regions. Maximum likelihood (lnL = –6686.302130) and Bayesian analyses produced consistent tree topologies. Niesslia exilis (CBS 560.74) and N. exilis (CBS 357.7) were selected as the outgroup taxa. Bayesian posterior probabilities (PP) ≥ 0.90 and RAxML bootstrap support values ≥ 70 % are shown on the branches. The novel described species is indicated in red and ex-type/type strains in bold.
-
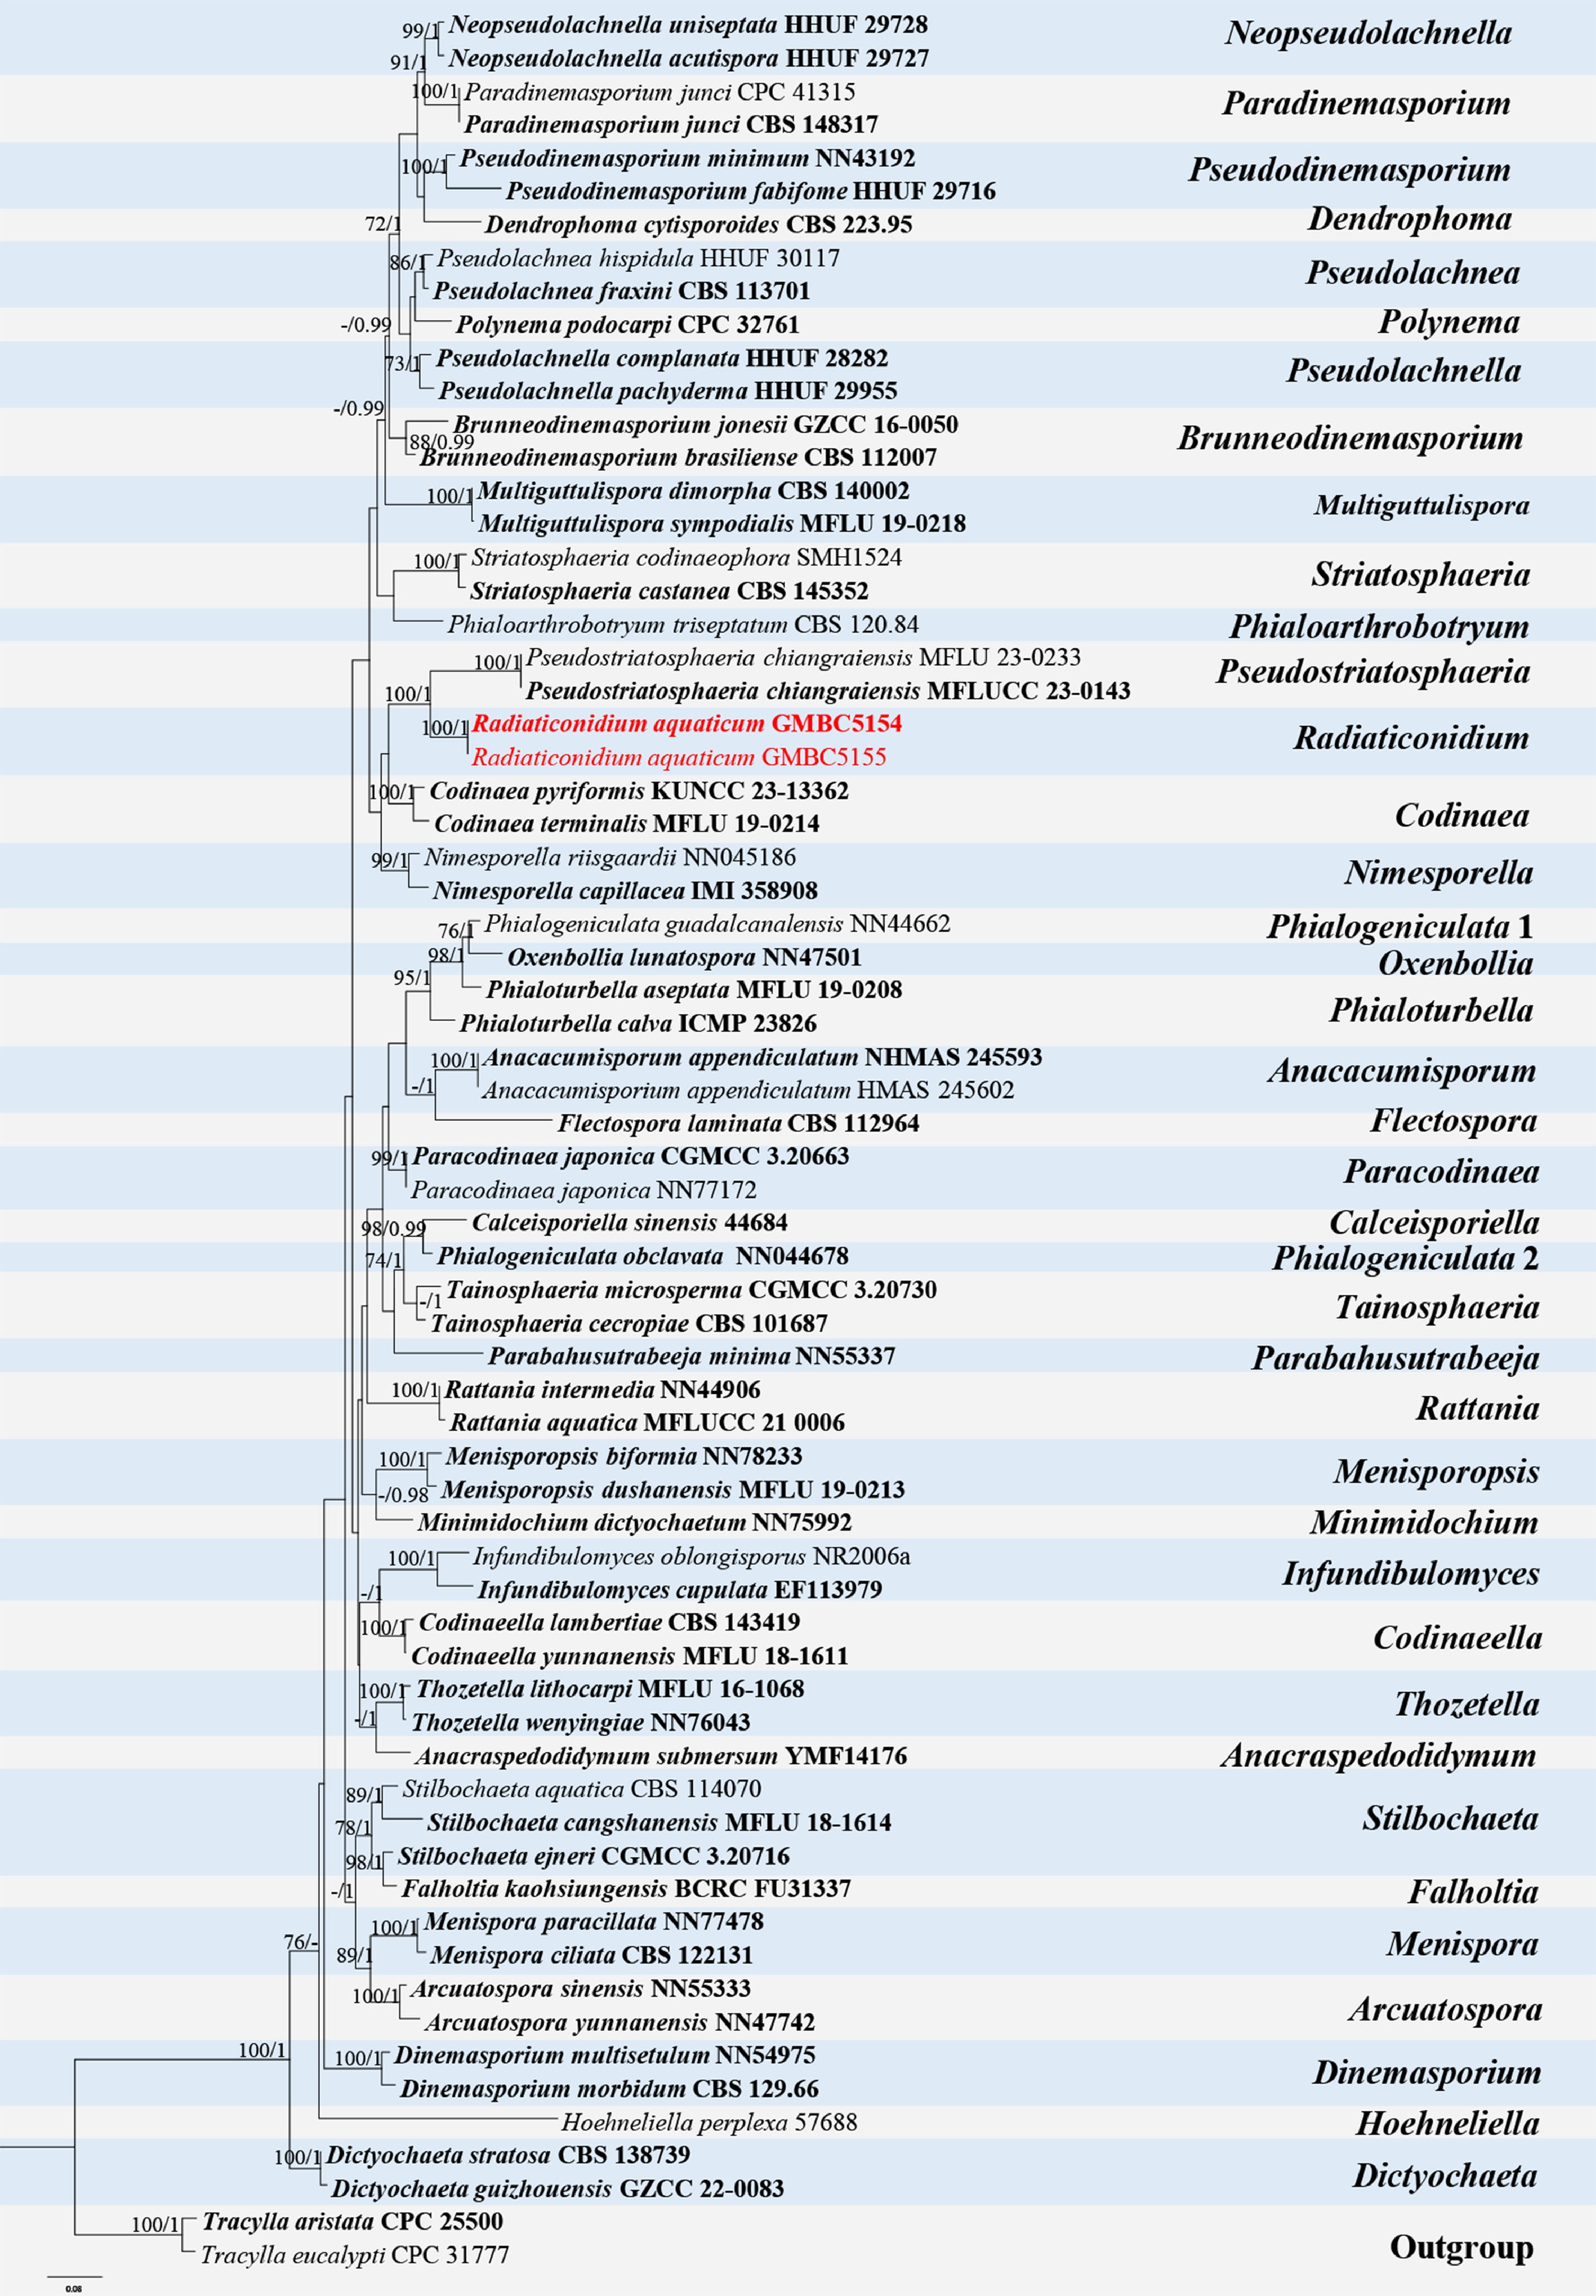
Figure 31.
ML tree of selected Chaetosphaeriaceae species based on the ITS-LSU dataset. The combined dataset comprised 68 taxa, 1,371 characters (ITS: 1–512 bp; LSU: 513–1,371 bp), including indel regions. Maximum likelihood (lnL = −15,747.664593) and Bayesian analyses produced consistent tree topologies. Tracylla aristata (CPC 25500) and T. eucalypti (CPC 31777) were selected as the outgroup taxa. Bayesian posterior probabilities (PP) ≥ 0.90 and RAxML bootstrap support values ≥ 70 % are shown on the branches. The newly described species is marked in red. Ex-type/type strains are indicated in bold.
-
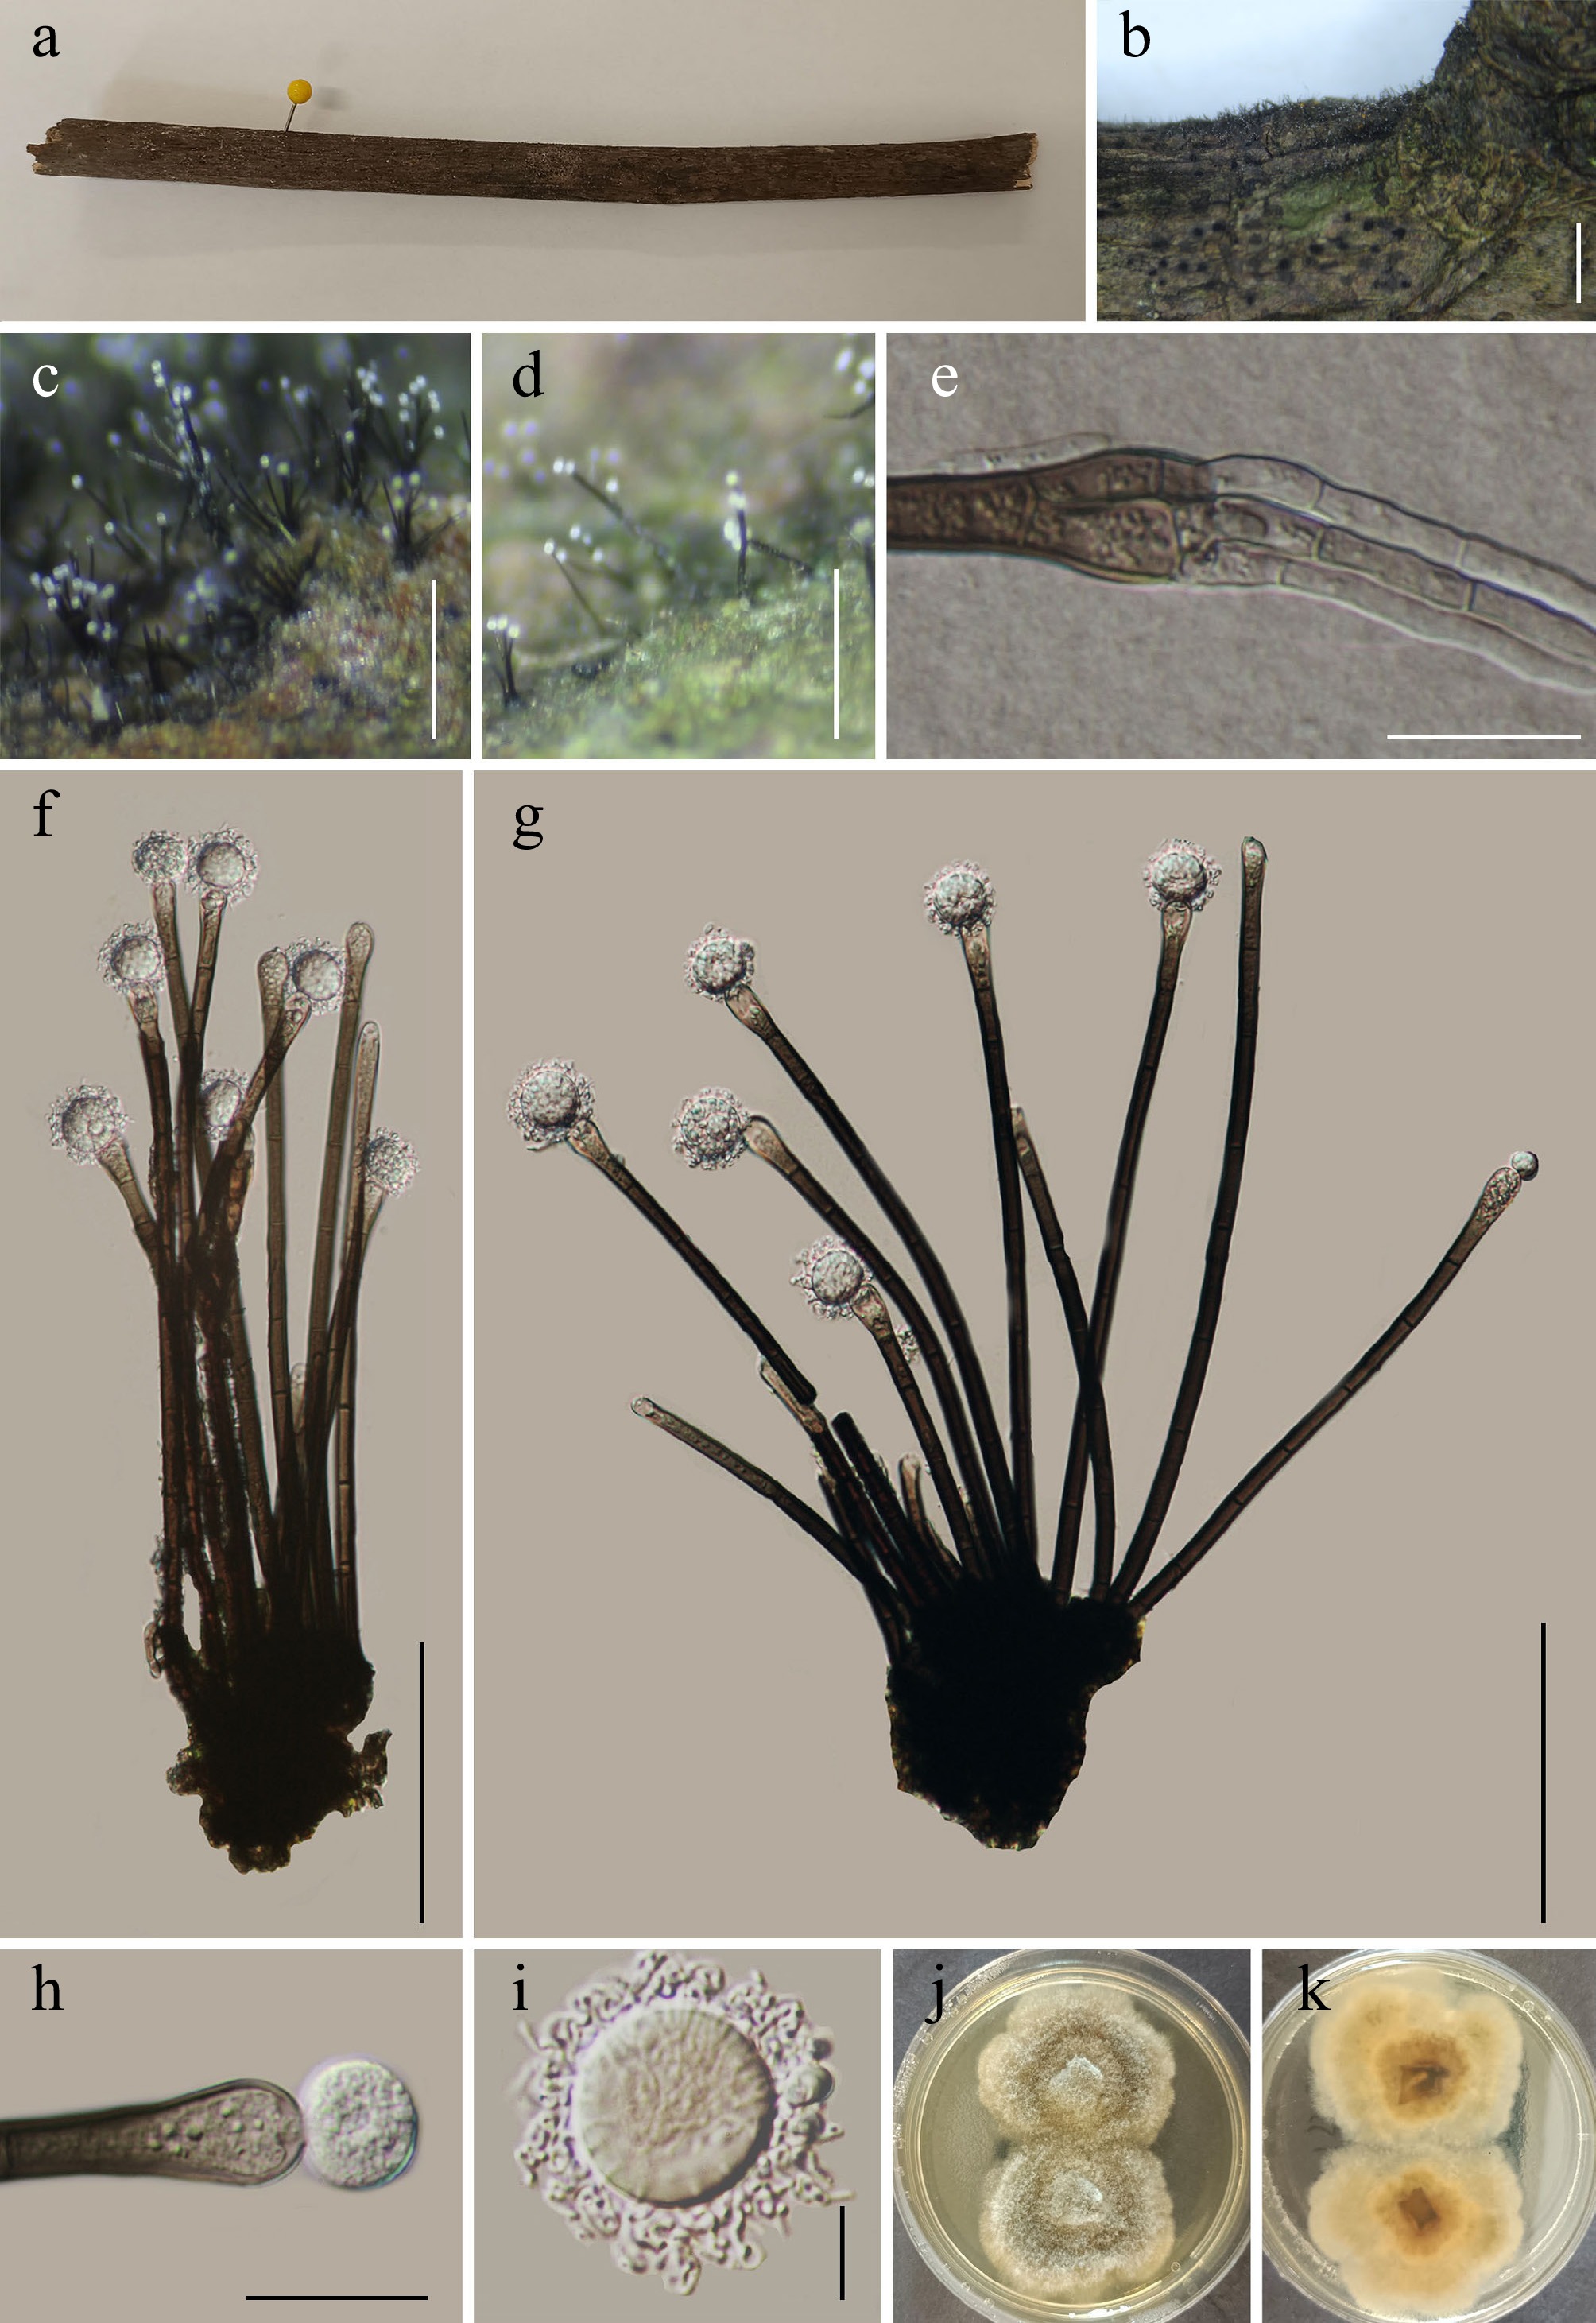
Figure 32.
Radiaticonidium aquaticum (GMB5154 holotype). (a) Host. (b)–(d) Colonies on natural substrate. (e) Germinating conidiophore. (f), (g) Conidiophores and conidia. (h) Conidiogenous cells and conidium. (i) Conidium. (j), (k) Surface and reverse view of culture on PDA. Scale bars: b = 1 mm, c, d = 2.5 mm, e–g = 20 μm, h = 20 μm, i = 10 μm.
-
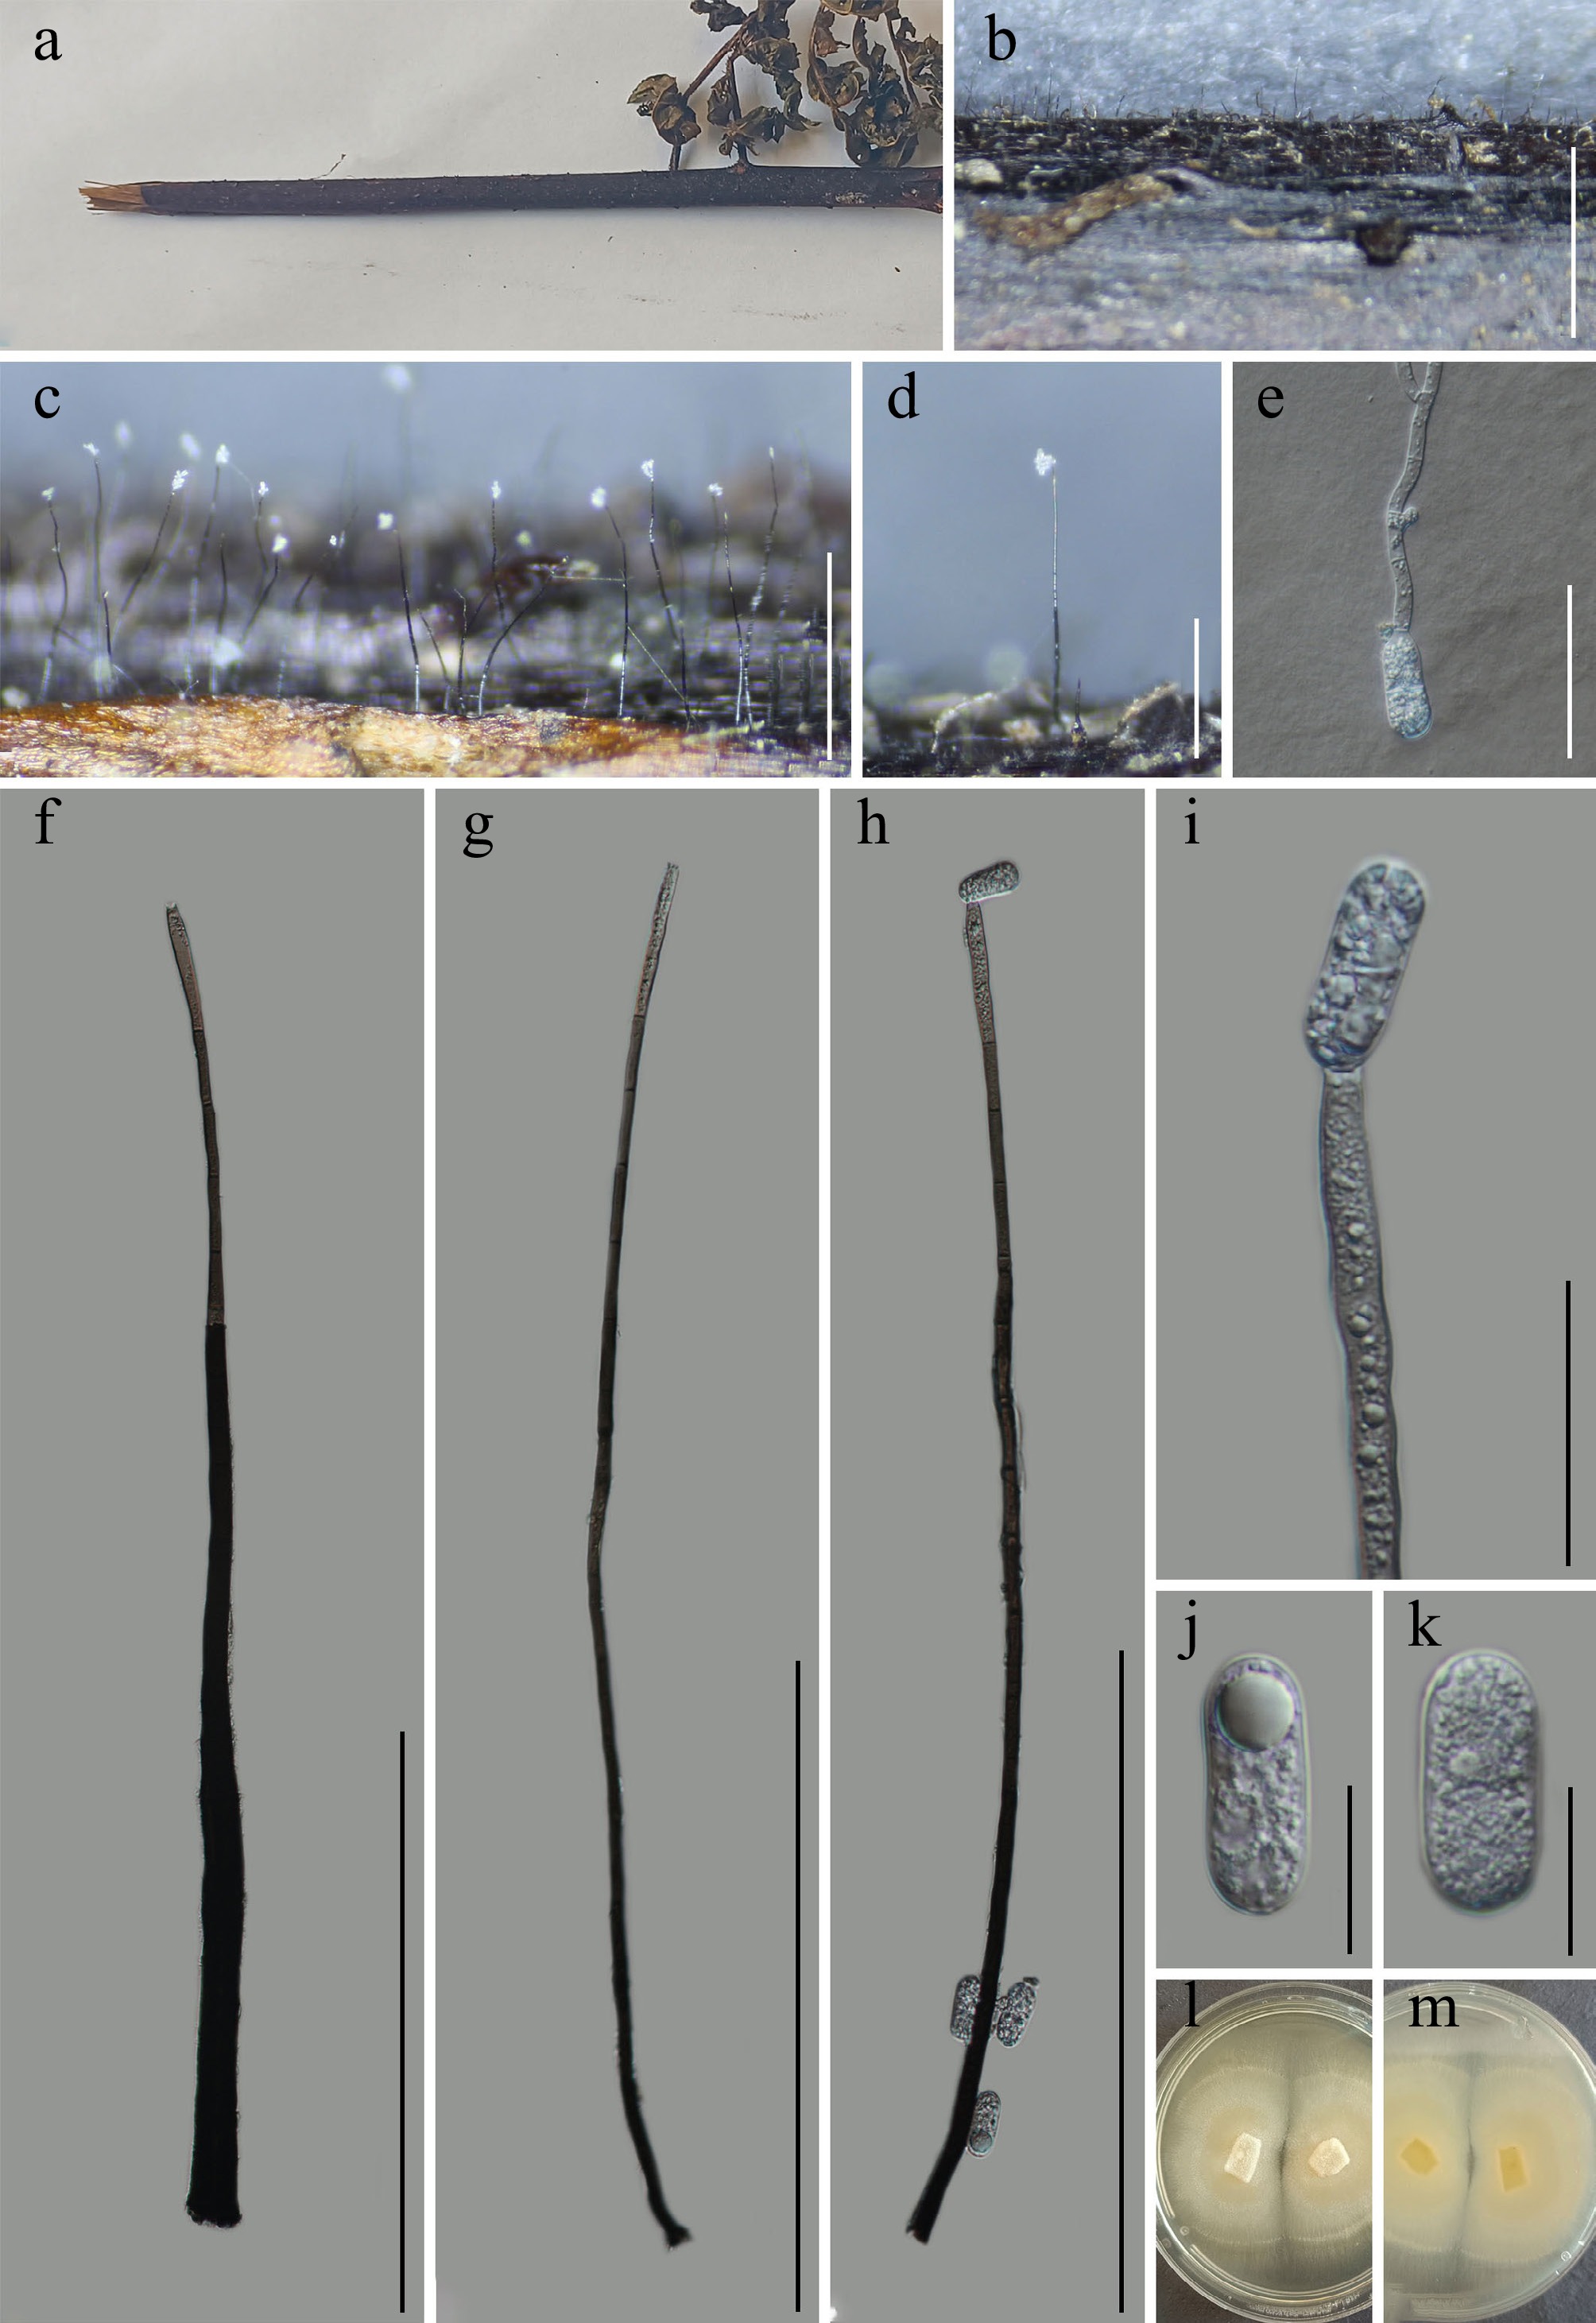
Figure 33.
Plectosphaerella guangxiensis (GMB5156 holotype). (a) Host. (b)–(d) Colonies on natural substrate. (e) Germinating conidium. (f)–(h) Conidiophores and conidia. (i) Conidiogenous cells. (j), (k) Conidia. (l), (m) Surface and reverse view of culture on PDA. Scale bars: b = 1 mm, c, d = 2.5 mm, e = 50 μm, f–h = 300 μm, i = 40 μm, j, k = 20 μm.
-
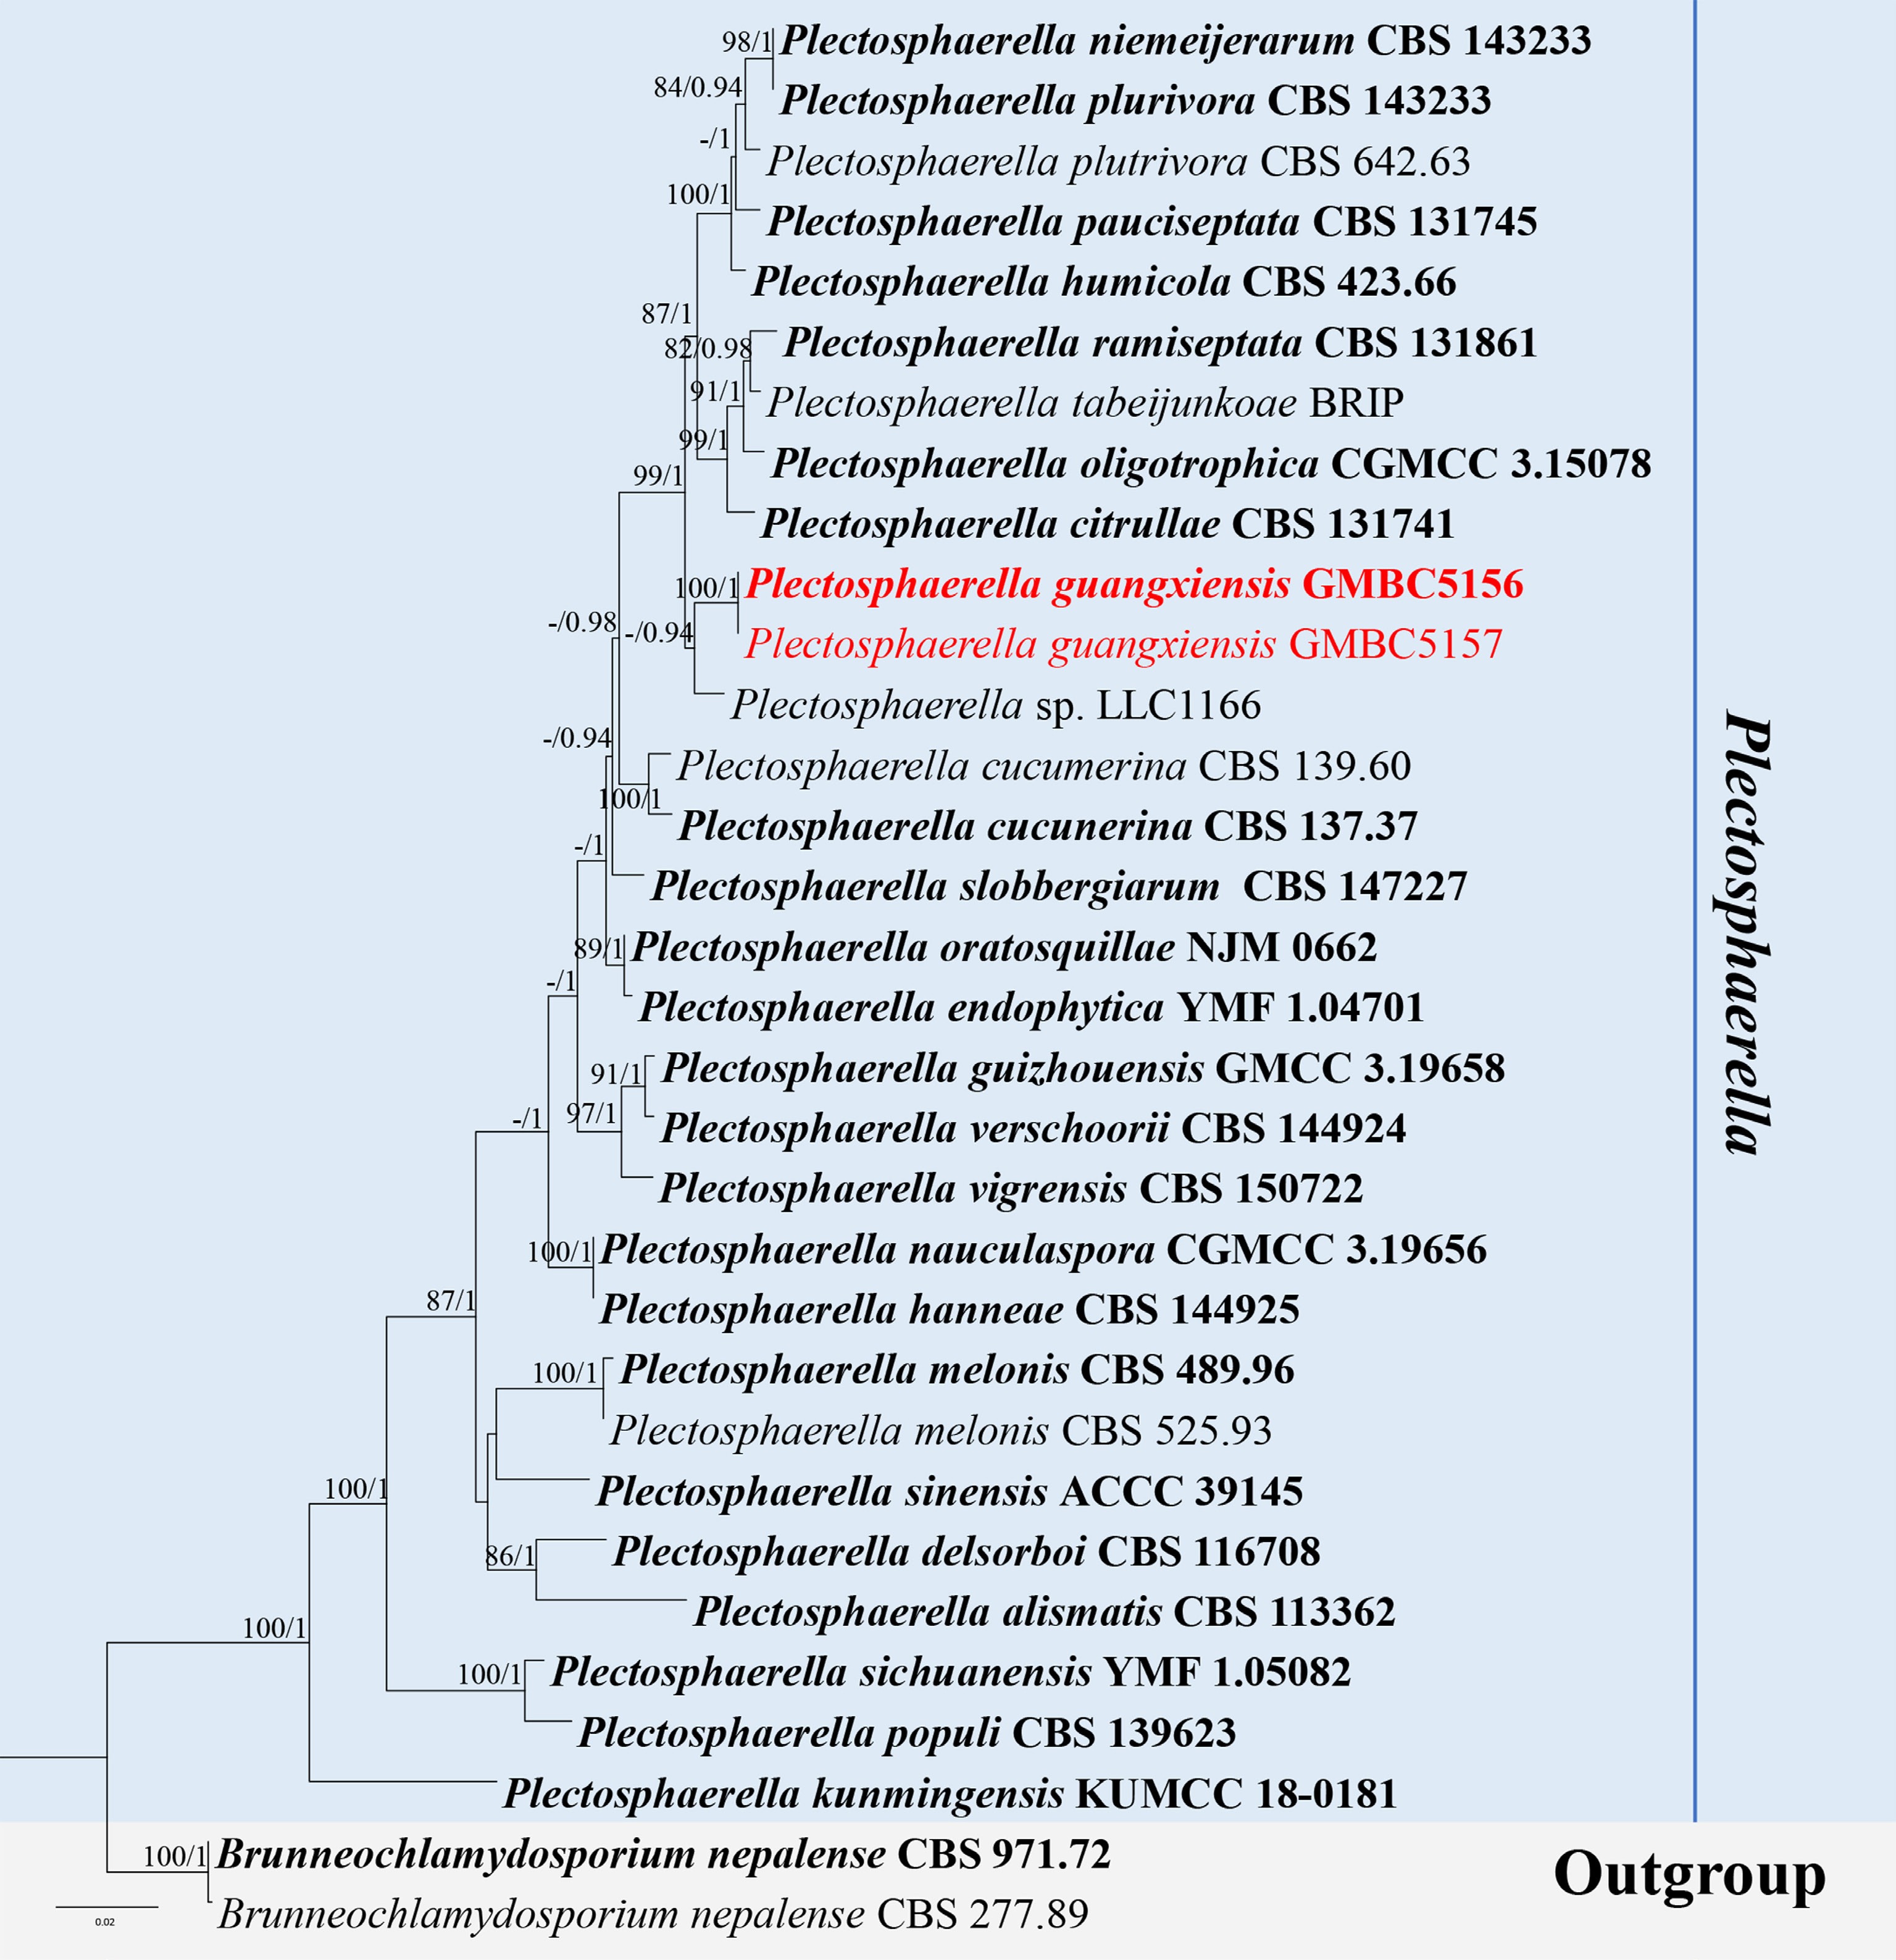
Figure 34.
ML tree of selected Plectosphaerella species based on the ITS-LSU-tef1-α-rpb2 dataset. The combined dataset comprised 32 taxa, 2,944 characters (ITS: 1–503 bp; LSU: 504–1,360 bp; tef1-α: 1,361–2,201 bp; rpb2: 2,201–2,944 bp), including indel regions. Maximum likelihood (lnL = −8,548.505177) and Bayesian analyses produced consistent tree topologies. Brunneochlamydosporium nepalense (CBS 277.89) and B. nepalense (CBS 971.72) were selected as the outgroup taxa. Bayesian posterior probabilities (PP) ≥ 0.90 and RAxML bootstrap support values ≥ 70 % are shown on the branches. The novel species is indicated in red, and ex-type/type strains in bold.
-
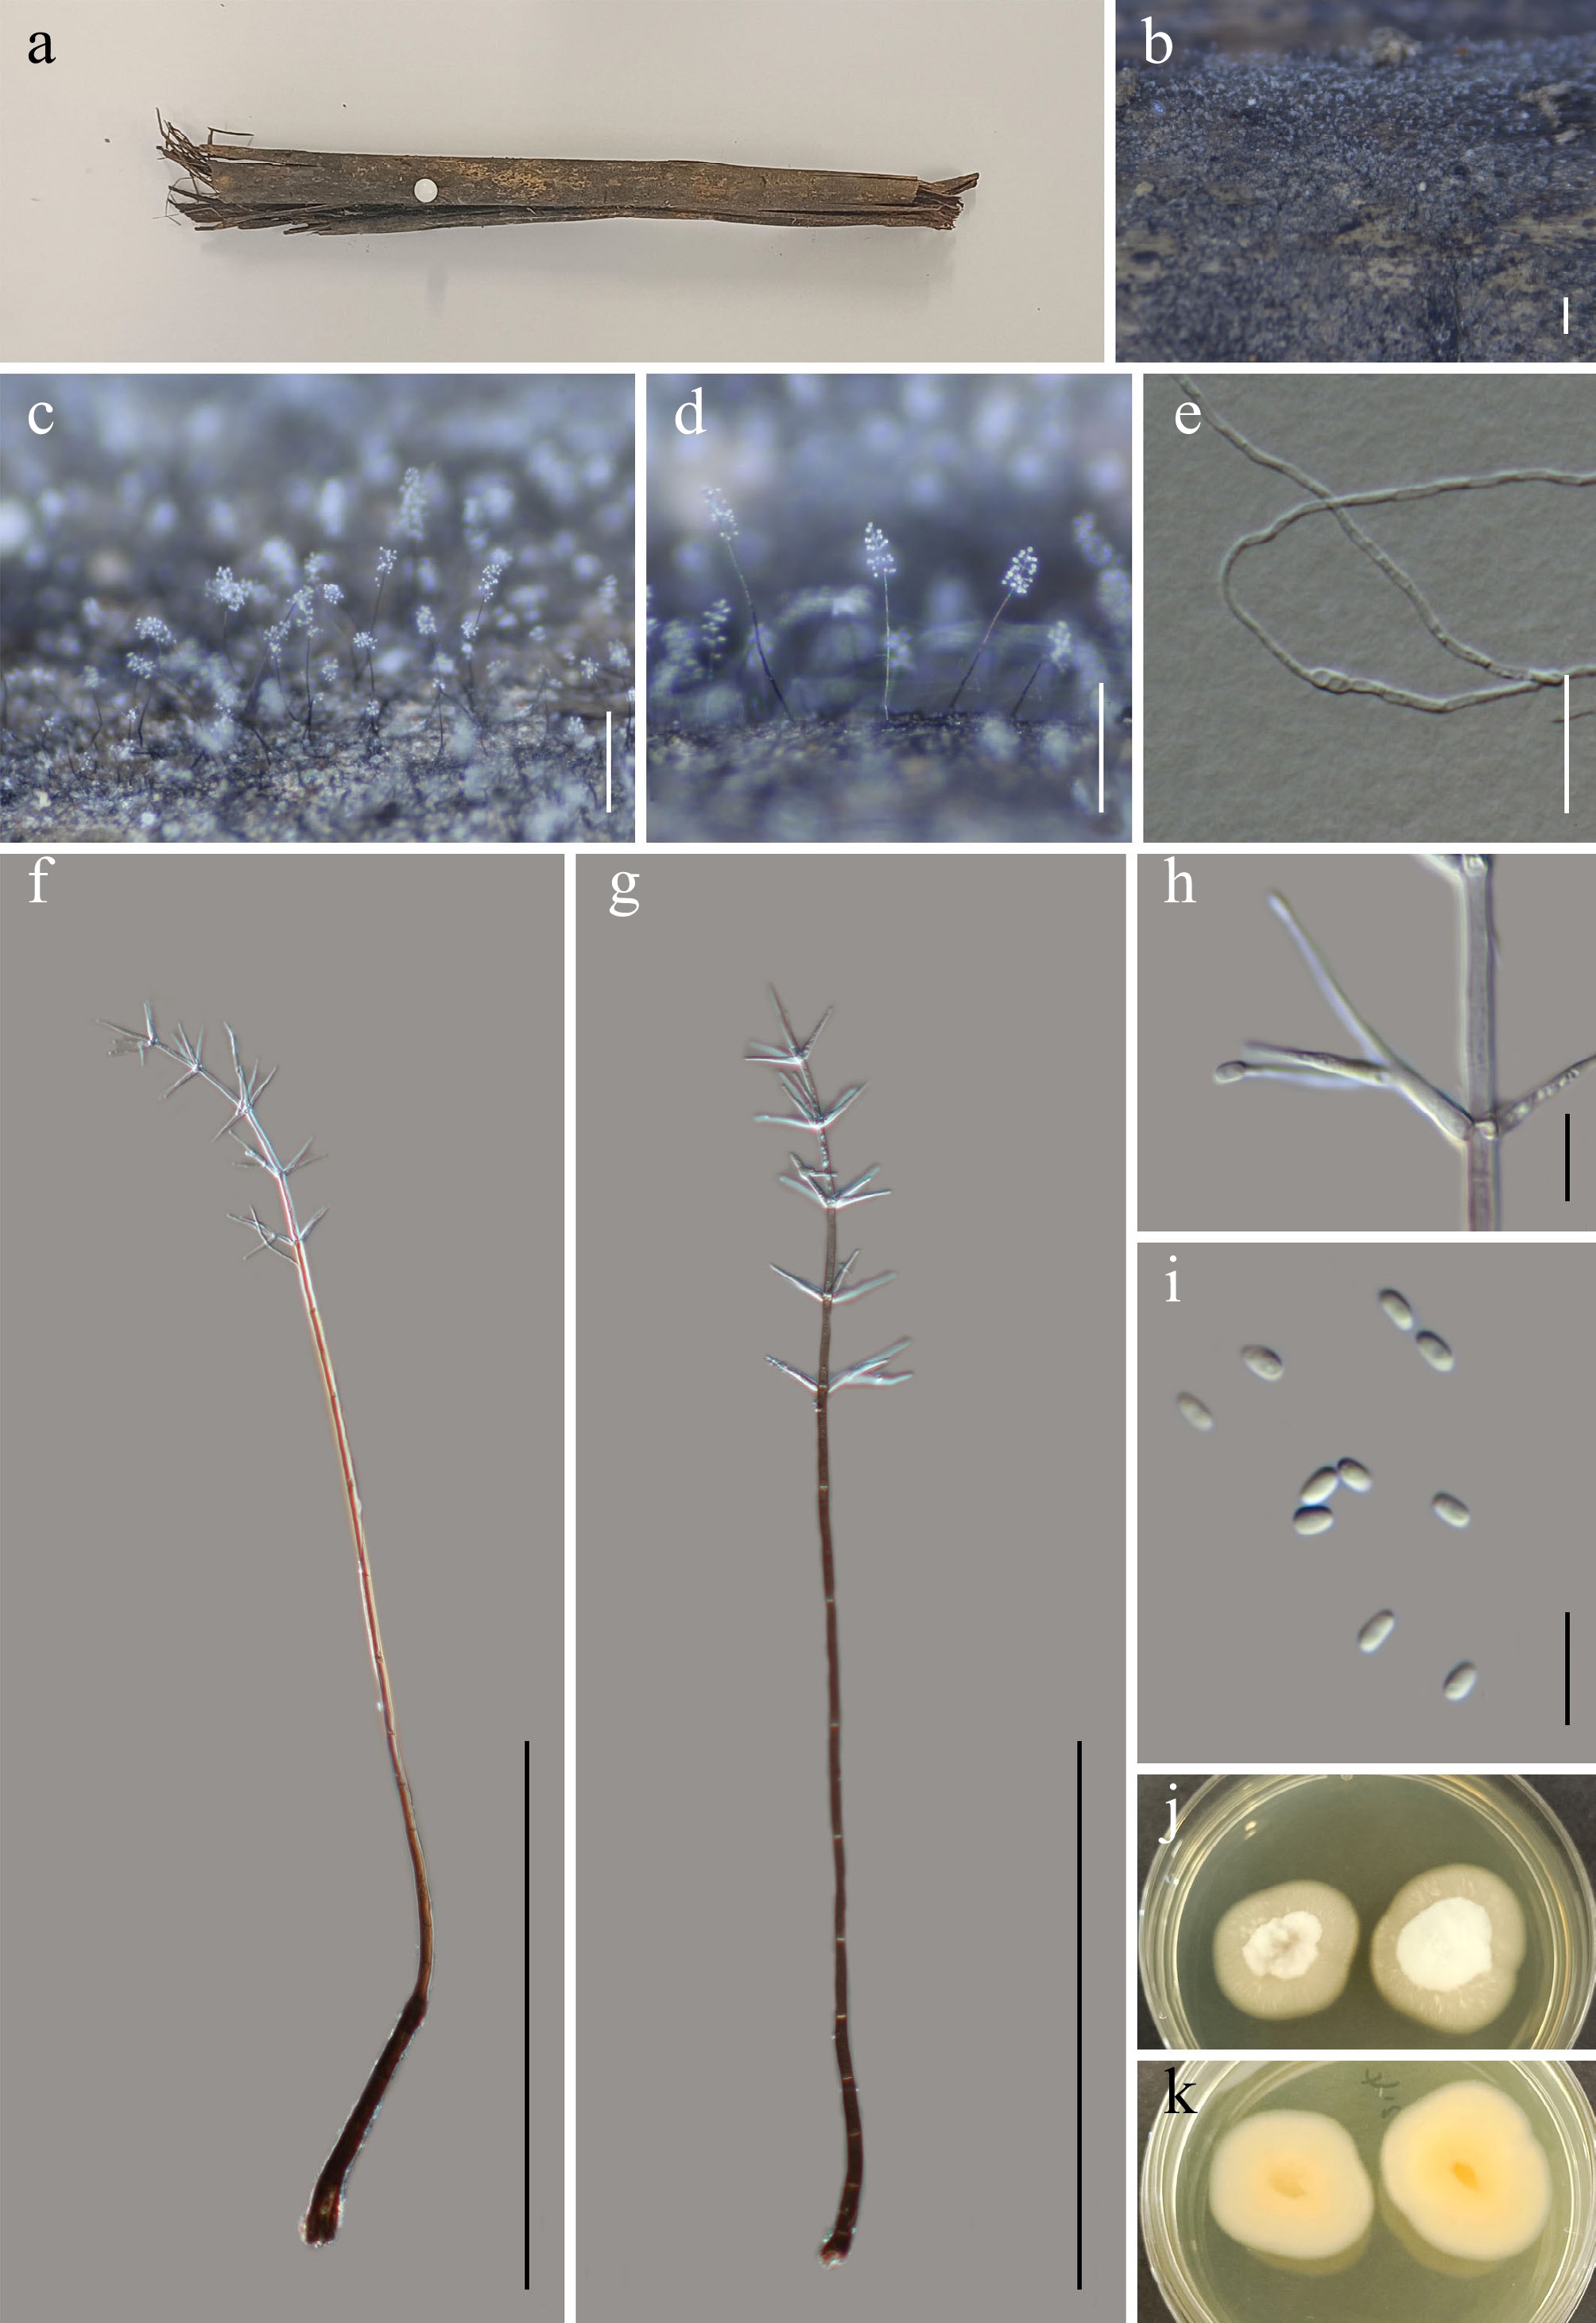
Figure 35.
Musicillium verticillatum (GMB5180 holotype). (a) Host. (b)–(d) Colonies on natural substrate. (e) Germinating conidium. (f), (g) Conidiophores and conidia. (h) Conidiogenous cells with conidia. (i) Conidia. (j), (k) Surface view of culture on PDA. Scale bars: b = 1 mm, c, d = 0.5 mm, f, g = 50 μm, e = 20 μm, h, i = 10 μm.
-
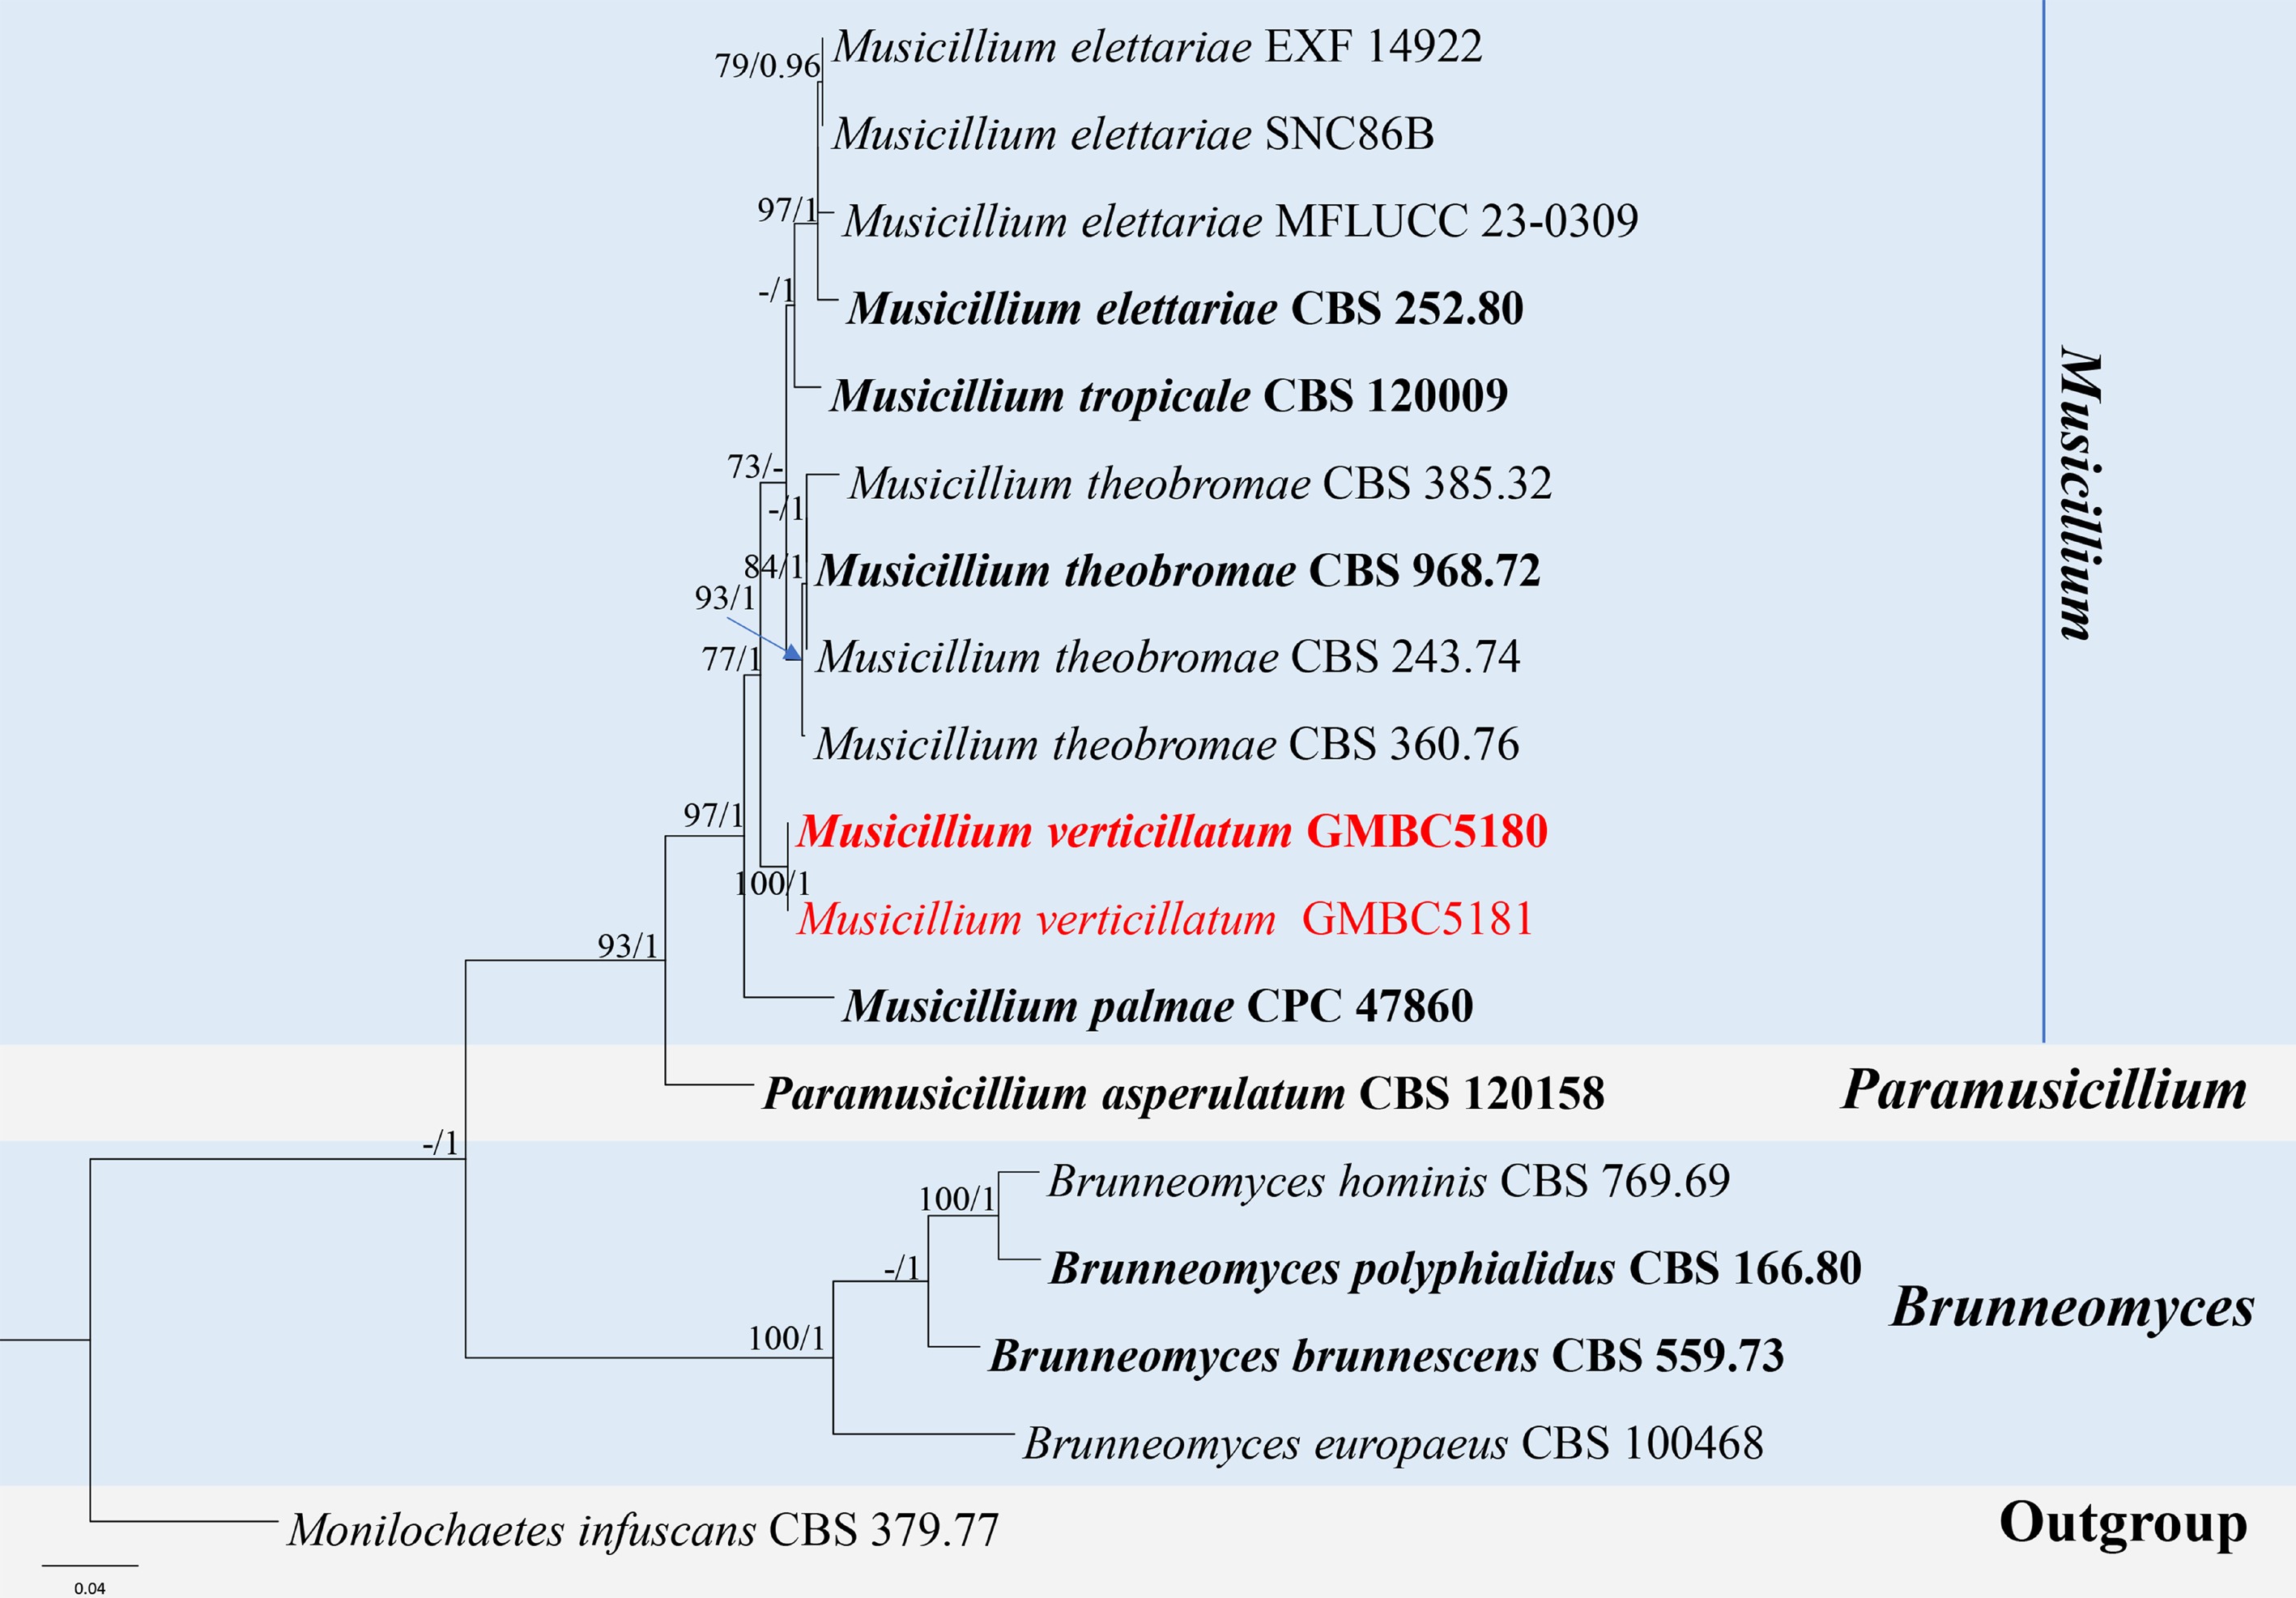
Figure 36.
ML tree of selected Musicillium species based on the ITS-LSU-rpb2 dataset. The combined dataset comprised 18 taxa, 2,086 characters (ITS:1–515 bp; LSU: 516–1,340 bp; rpb2: 1,341–2,086 bp), including indel regions. Maximum likelihood (lnL = −7,061.024465) and Bayesian analyses produced consistent tree topologies. Monilochaetes infuscans (CBS 379.77) was selected as the outgroup taxon. Bayesian posterior probabilities (PP) ≥ 0.90 and RAxML bootstrap support values ≥ 70 % are shown on the branches. The novel species is indicated in red and ex-type/type strains in bold.
-
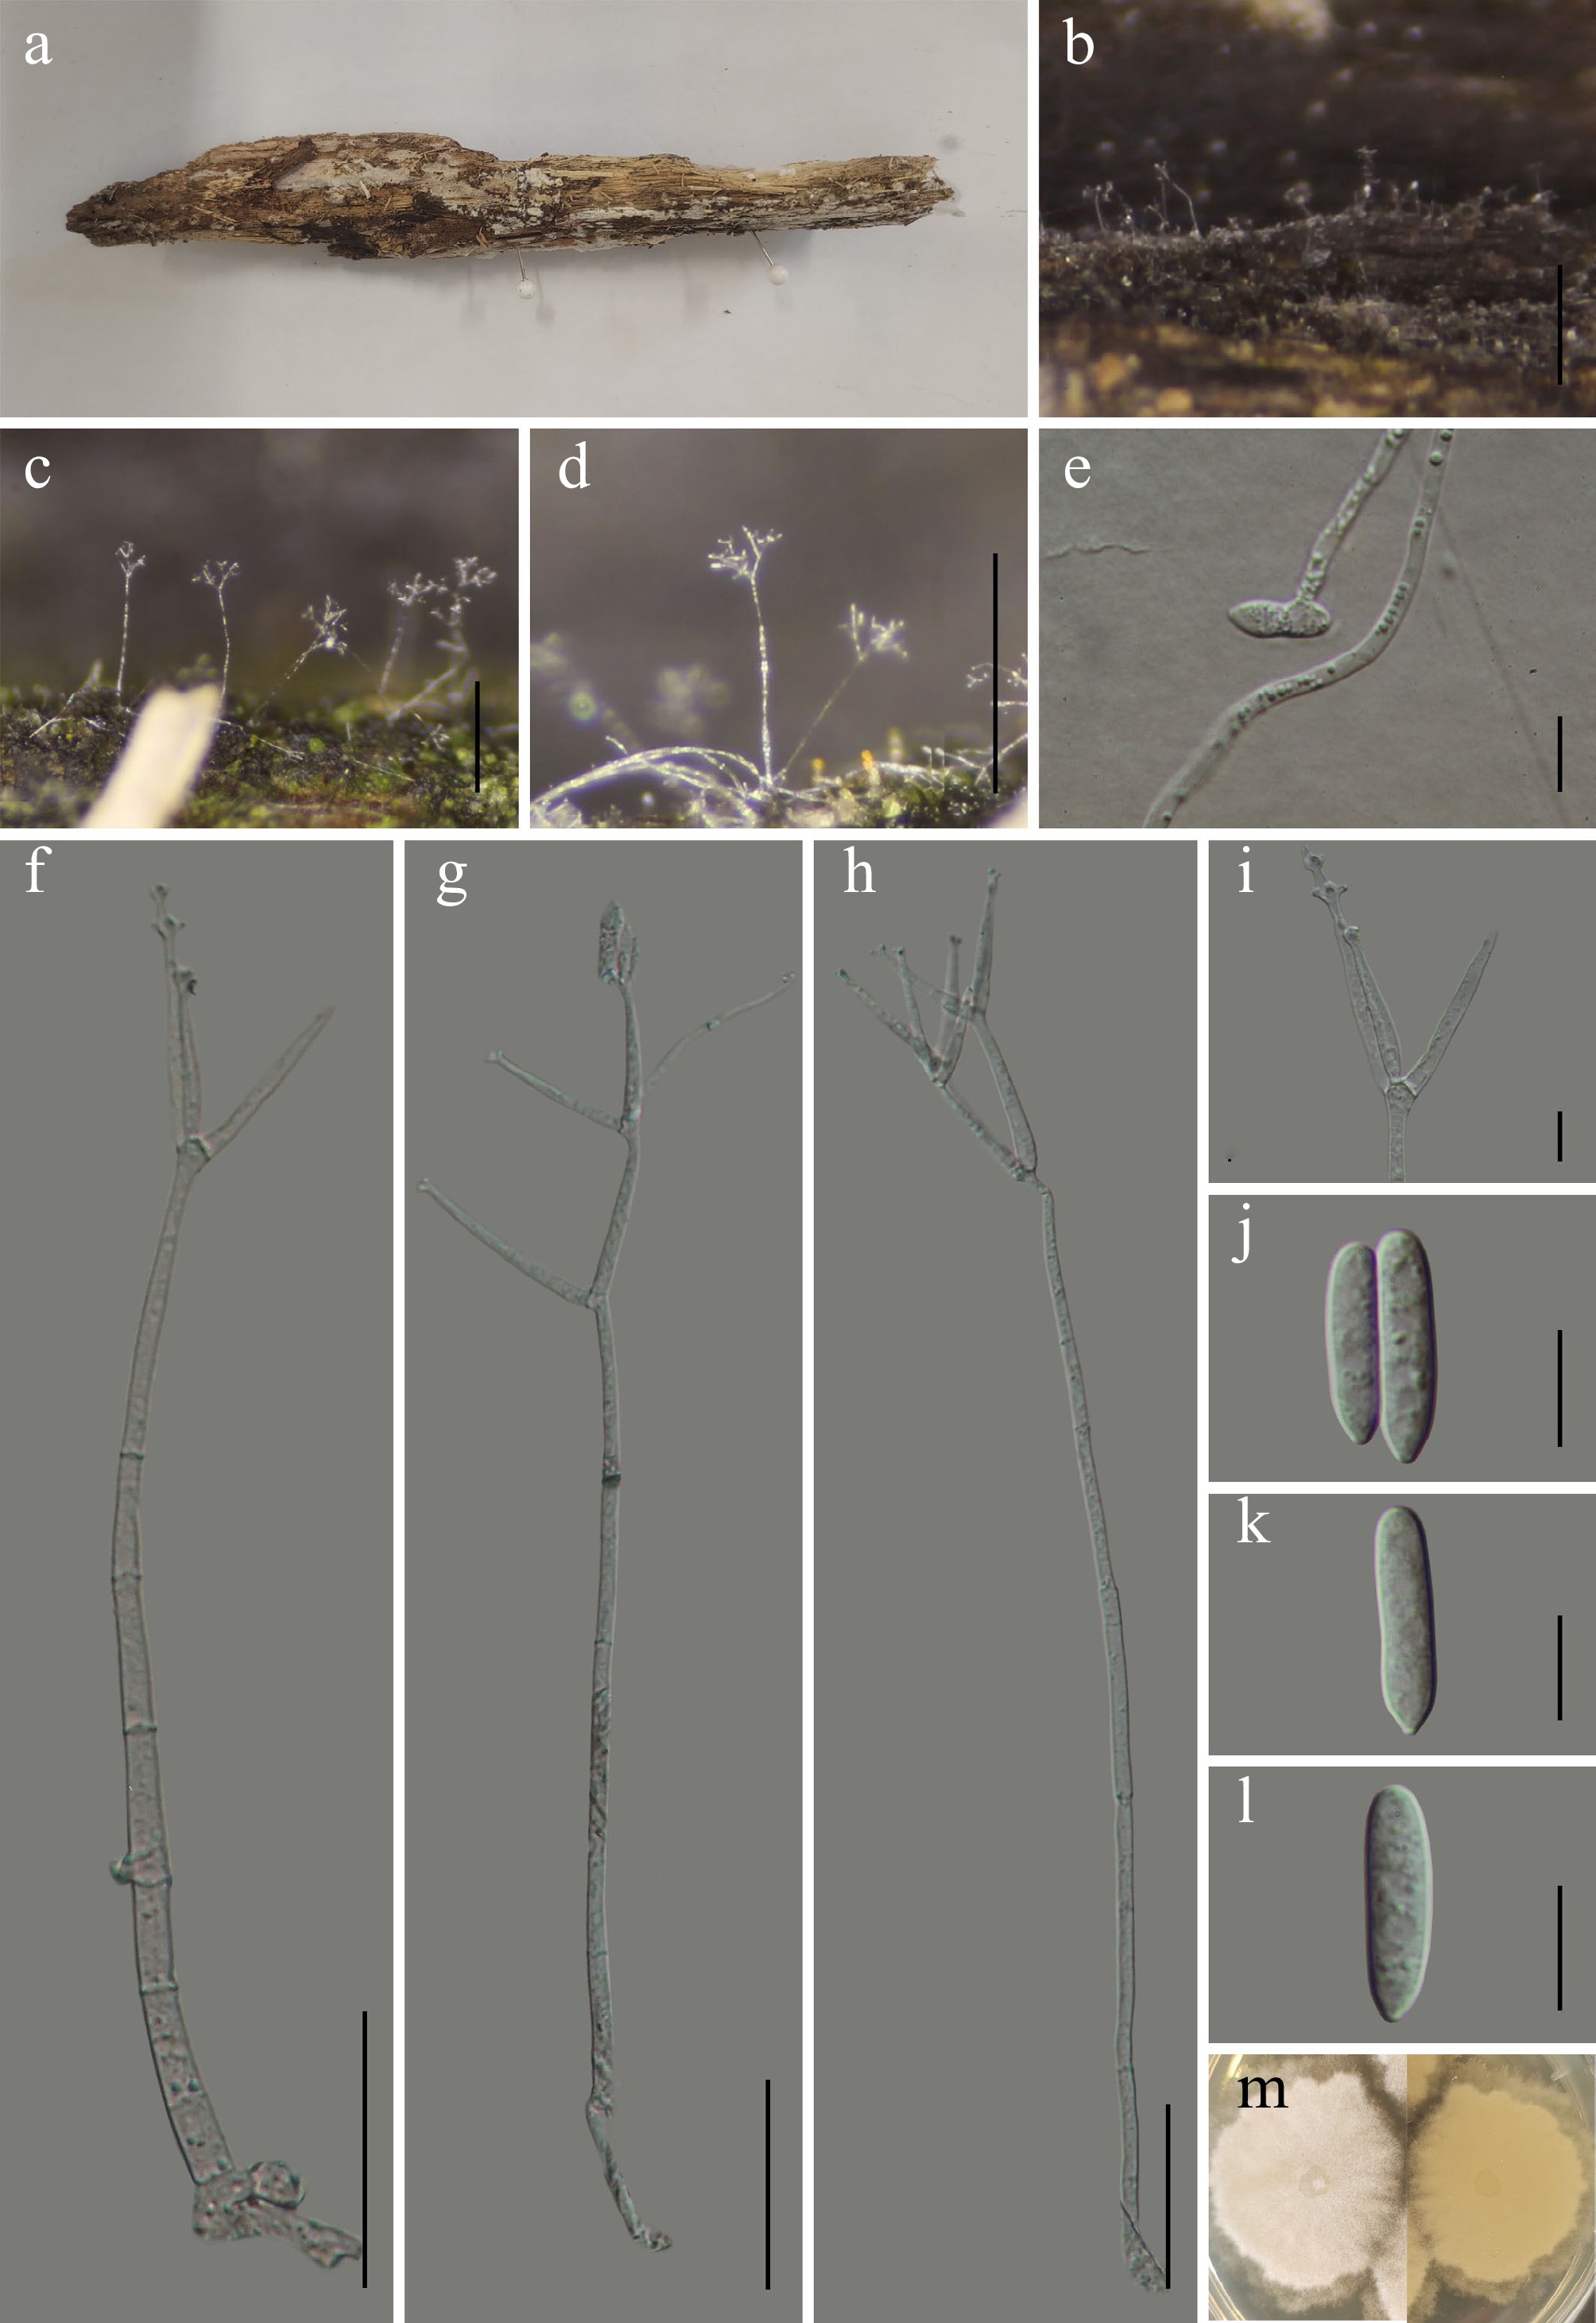
Figure 37.
Hypomyces aquatilis (GMB6929 holotype). (a) Host. (b)–(d) Colonies on natural substrate. (e) Germinating conidium. (f)–(h) Conidiophores and conidia. (i) Conidiogenous cells. (j)–(l) Conidia. (m) Surface and reverse view of culture on PDA. Scale bars: b = 1 mm, c, d = 0.5 mm, f–h = 50 μm, e, i–l= 10 μm.
-
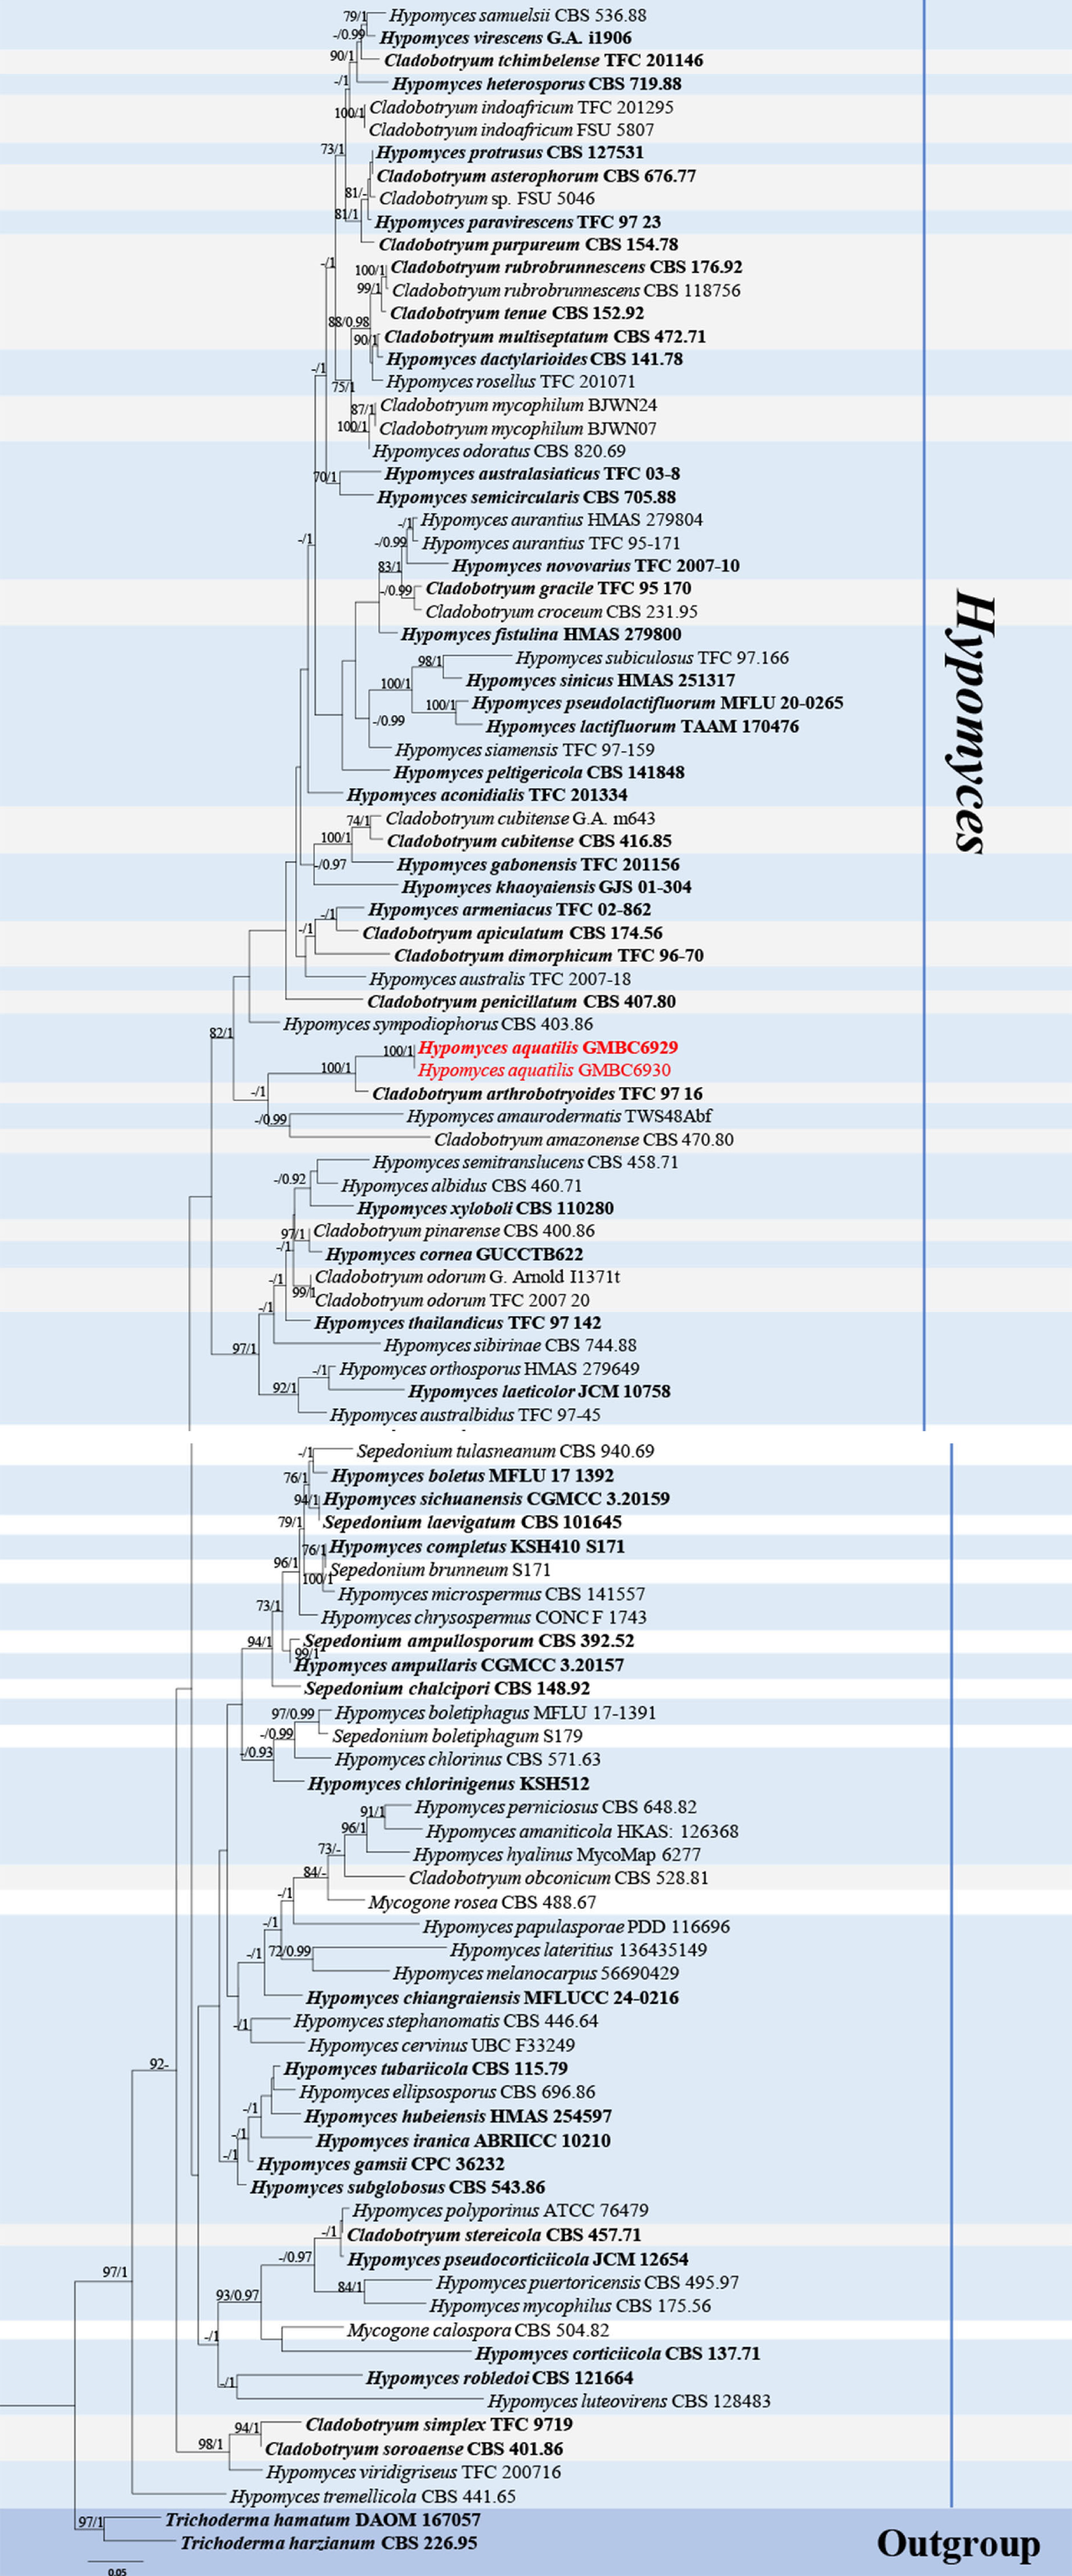
Figure 38.
ML tree of selected Hypomyces species based on a combined ITS-LSU-tef1-α-rpb2 dataset. The combined dataset comprised 109 taxa, 3,383 characters (ITS:1–537 bp; LSU: 538–1,390 bp; tef1-α: 1,391–2,314 bp; rpb2: 2,315–3,383 bp), including indel regions. Maximum likelihood (lnL = −31,431.265333) and Bayesian analyses produced consistent tree topologies. Trichoderma harzianum (CBS 226.95) and T. hamatum (DAOM 167057) were selected as the outgroup taxa. Values of the Bayesian PP ≥ 0.90 and bootstrap support RAxML ≥ 70% are shown on the branches. The novel species is indicated in red and ex-type/type strains in bold.
-
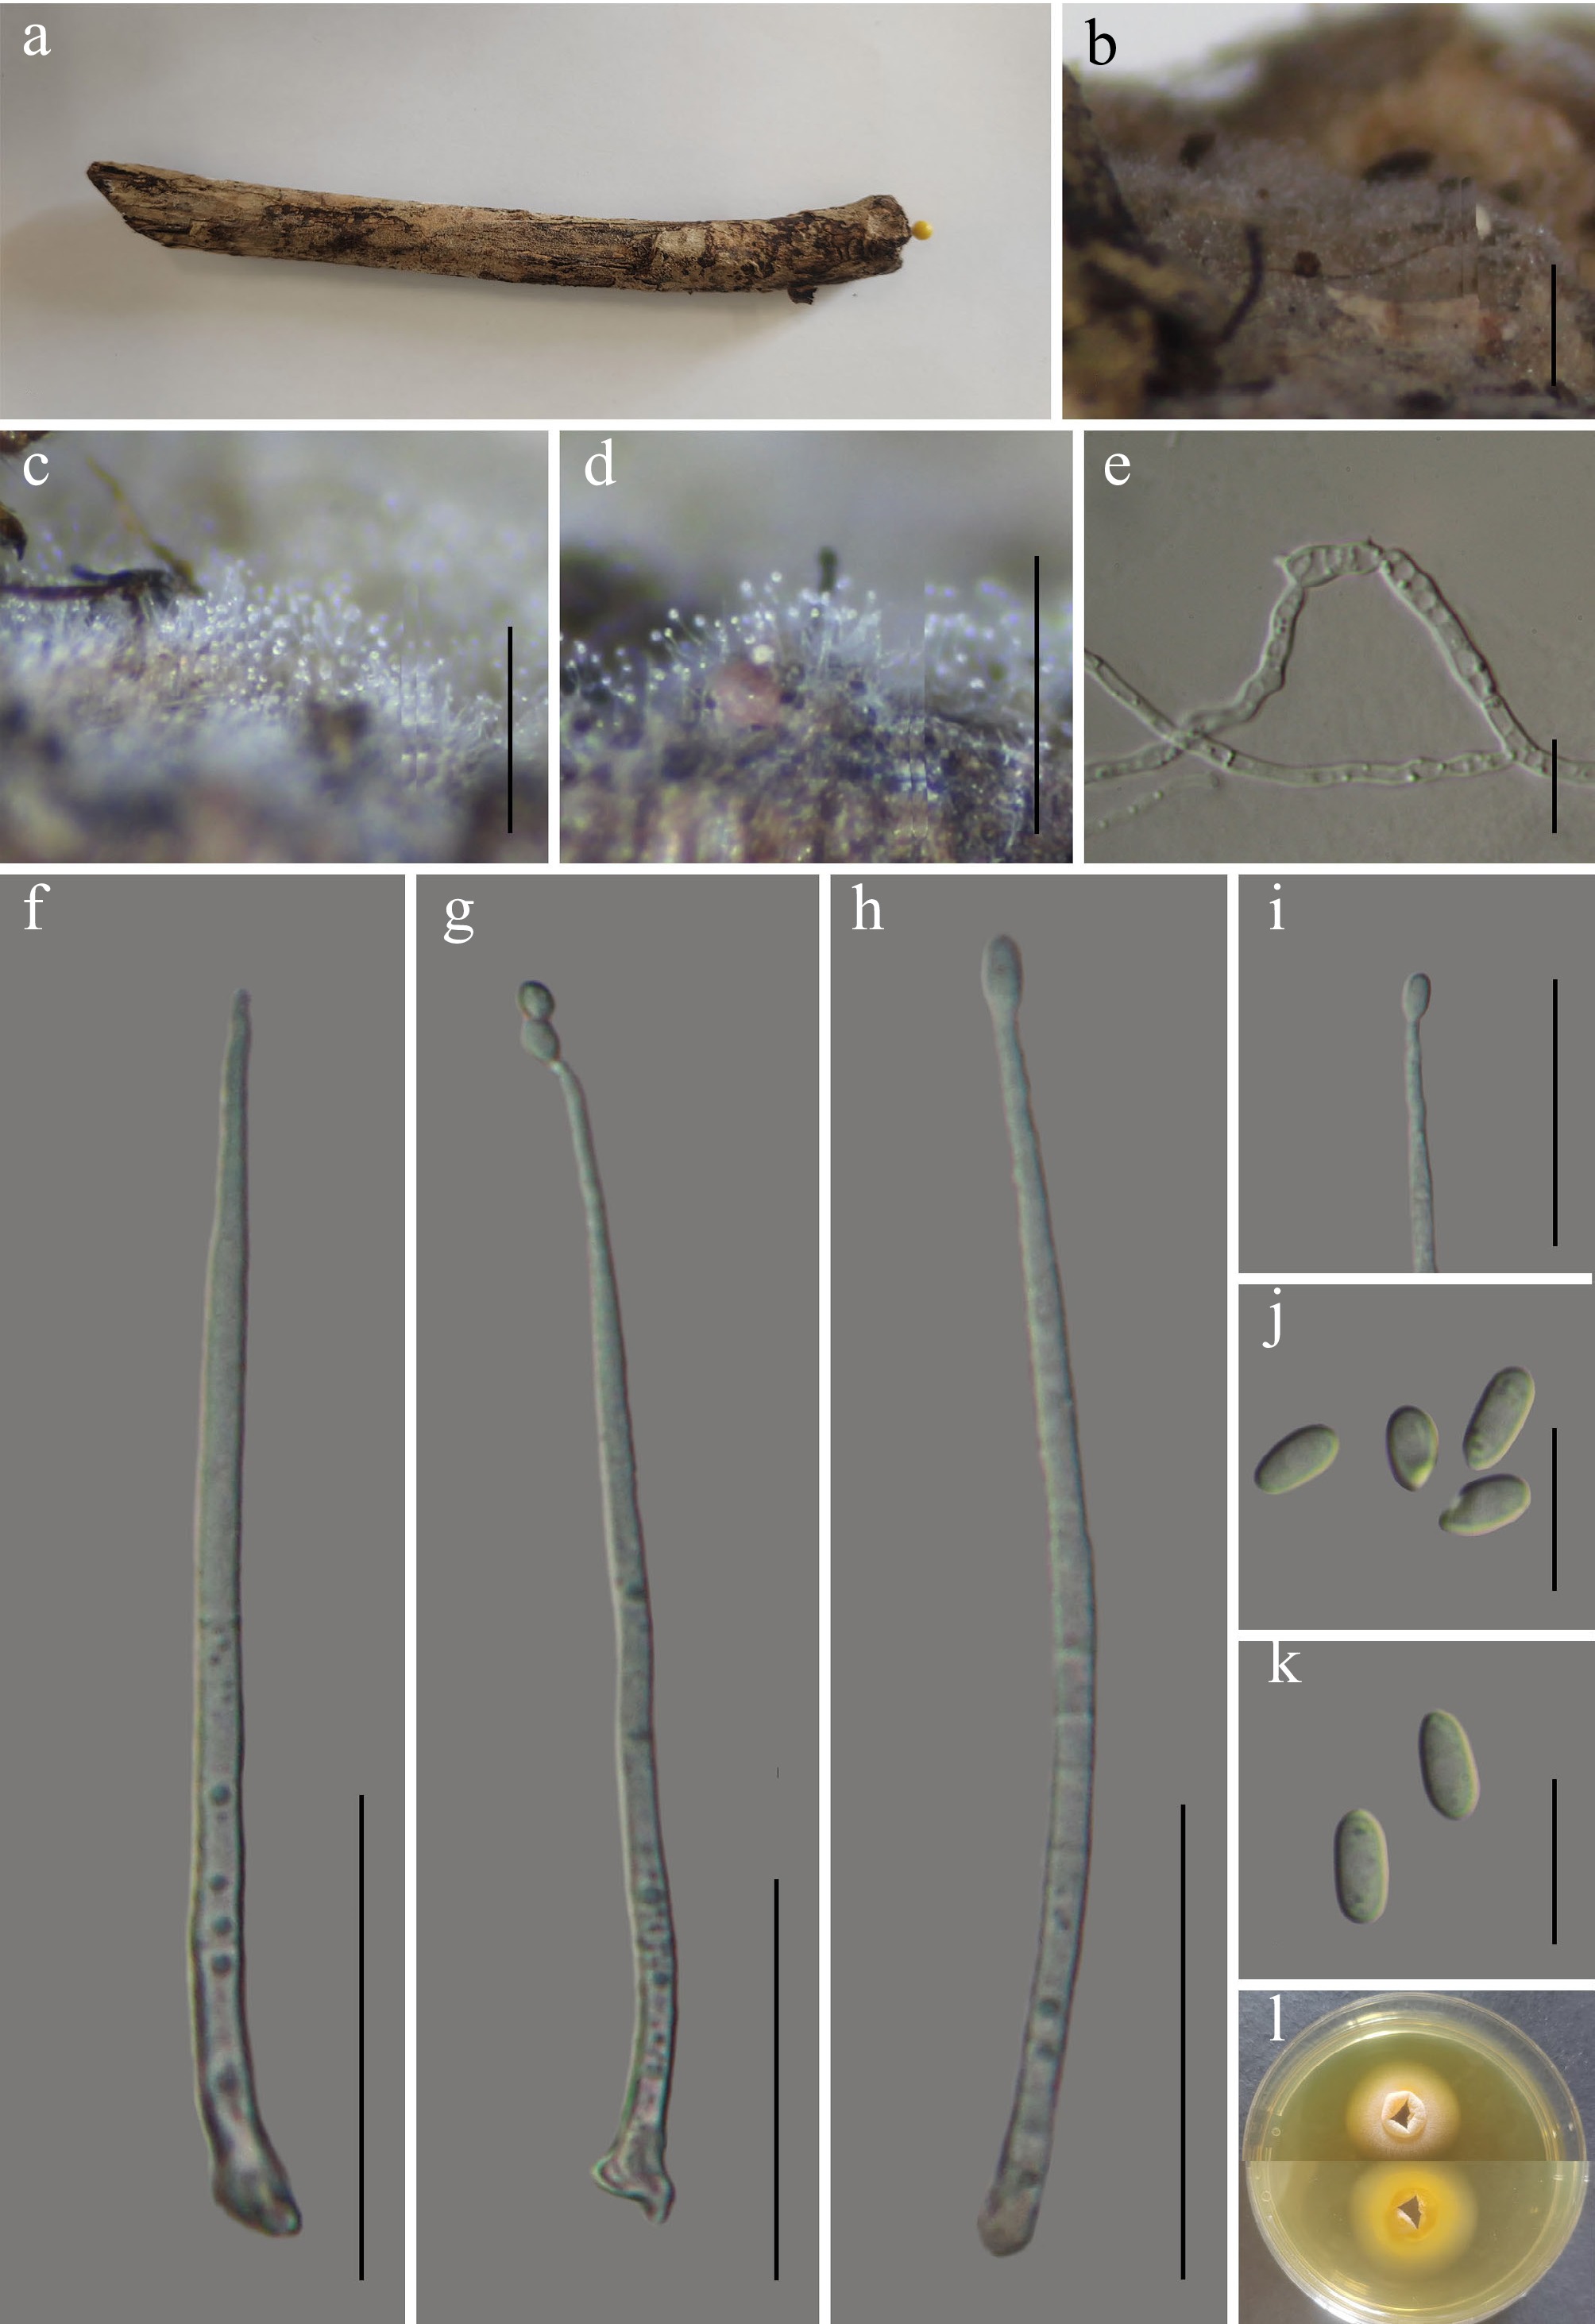
Figure 39.
Niesslia waitemataensis (GMB6949). (a) Host. (b)–(d) Colonies on natural substrate. (e) Germinating conidium. (f)–(h) Conidiophores and conidia. (i) Conidiogenous cells and conidium. (j), (k) Conidia. (l) Surface and reverse view of culture on PDA. Scale bars: b = 1 mm, c, d = 0.5 mm, f–h = 30 μm, e, i–k = 10 μm.
-
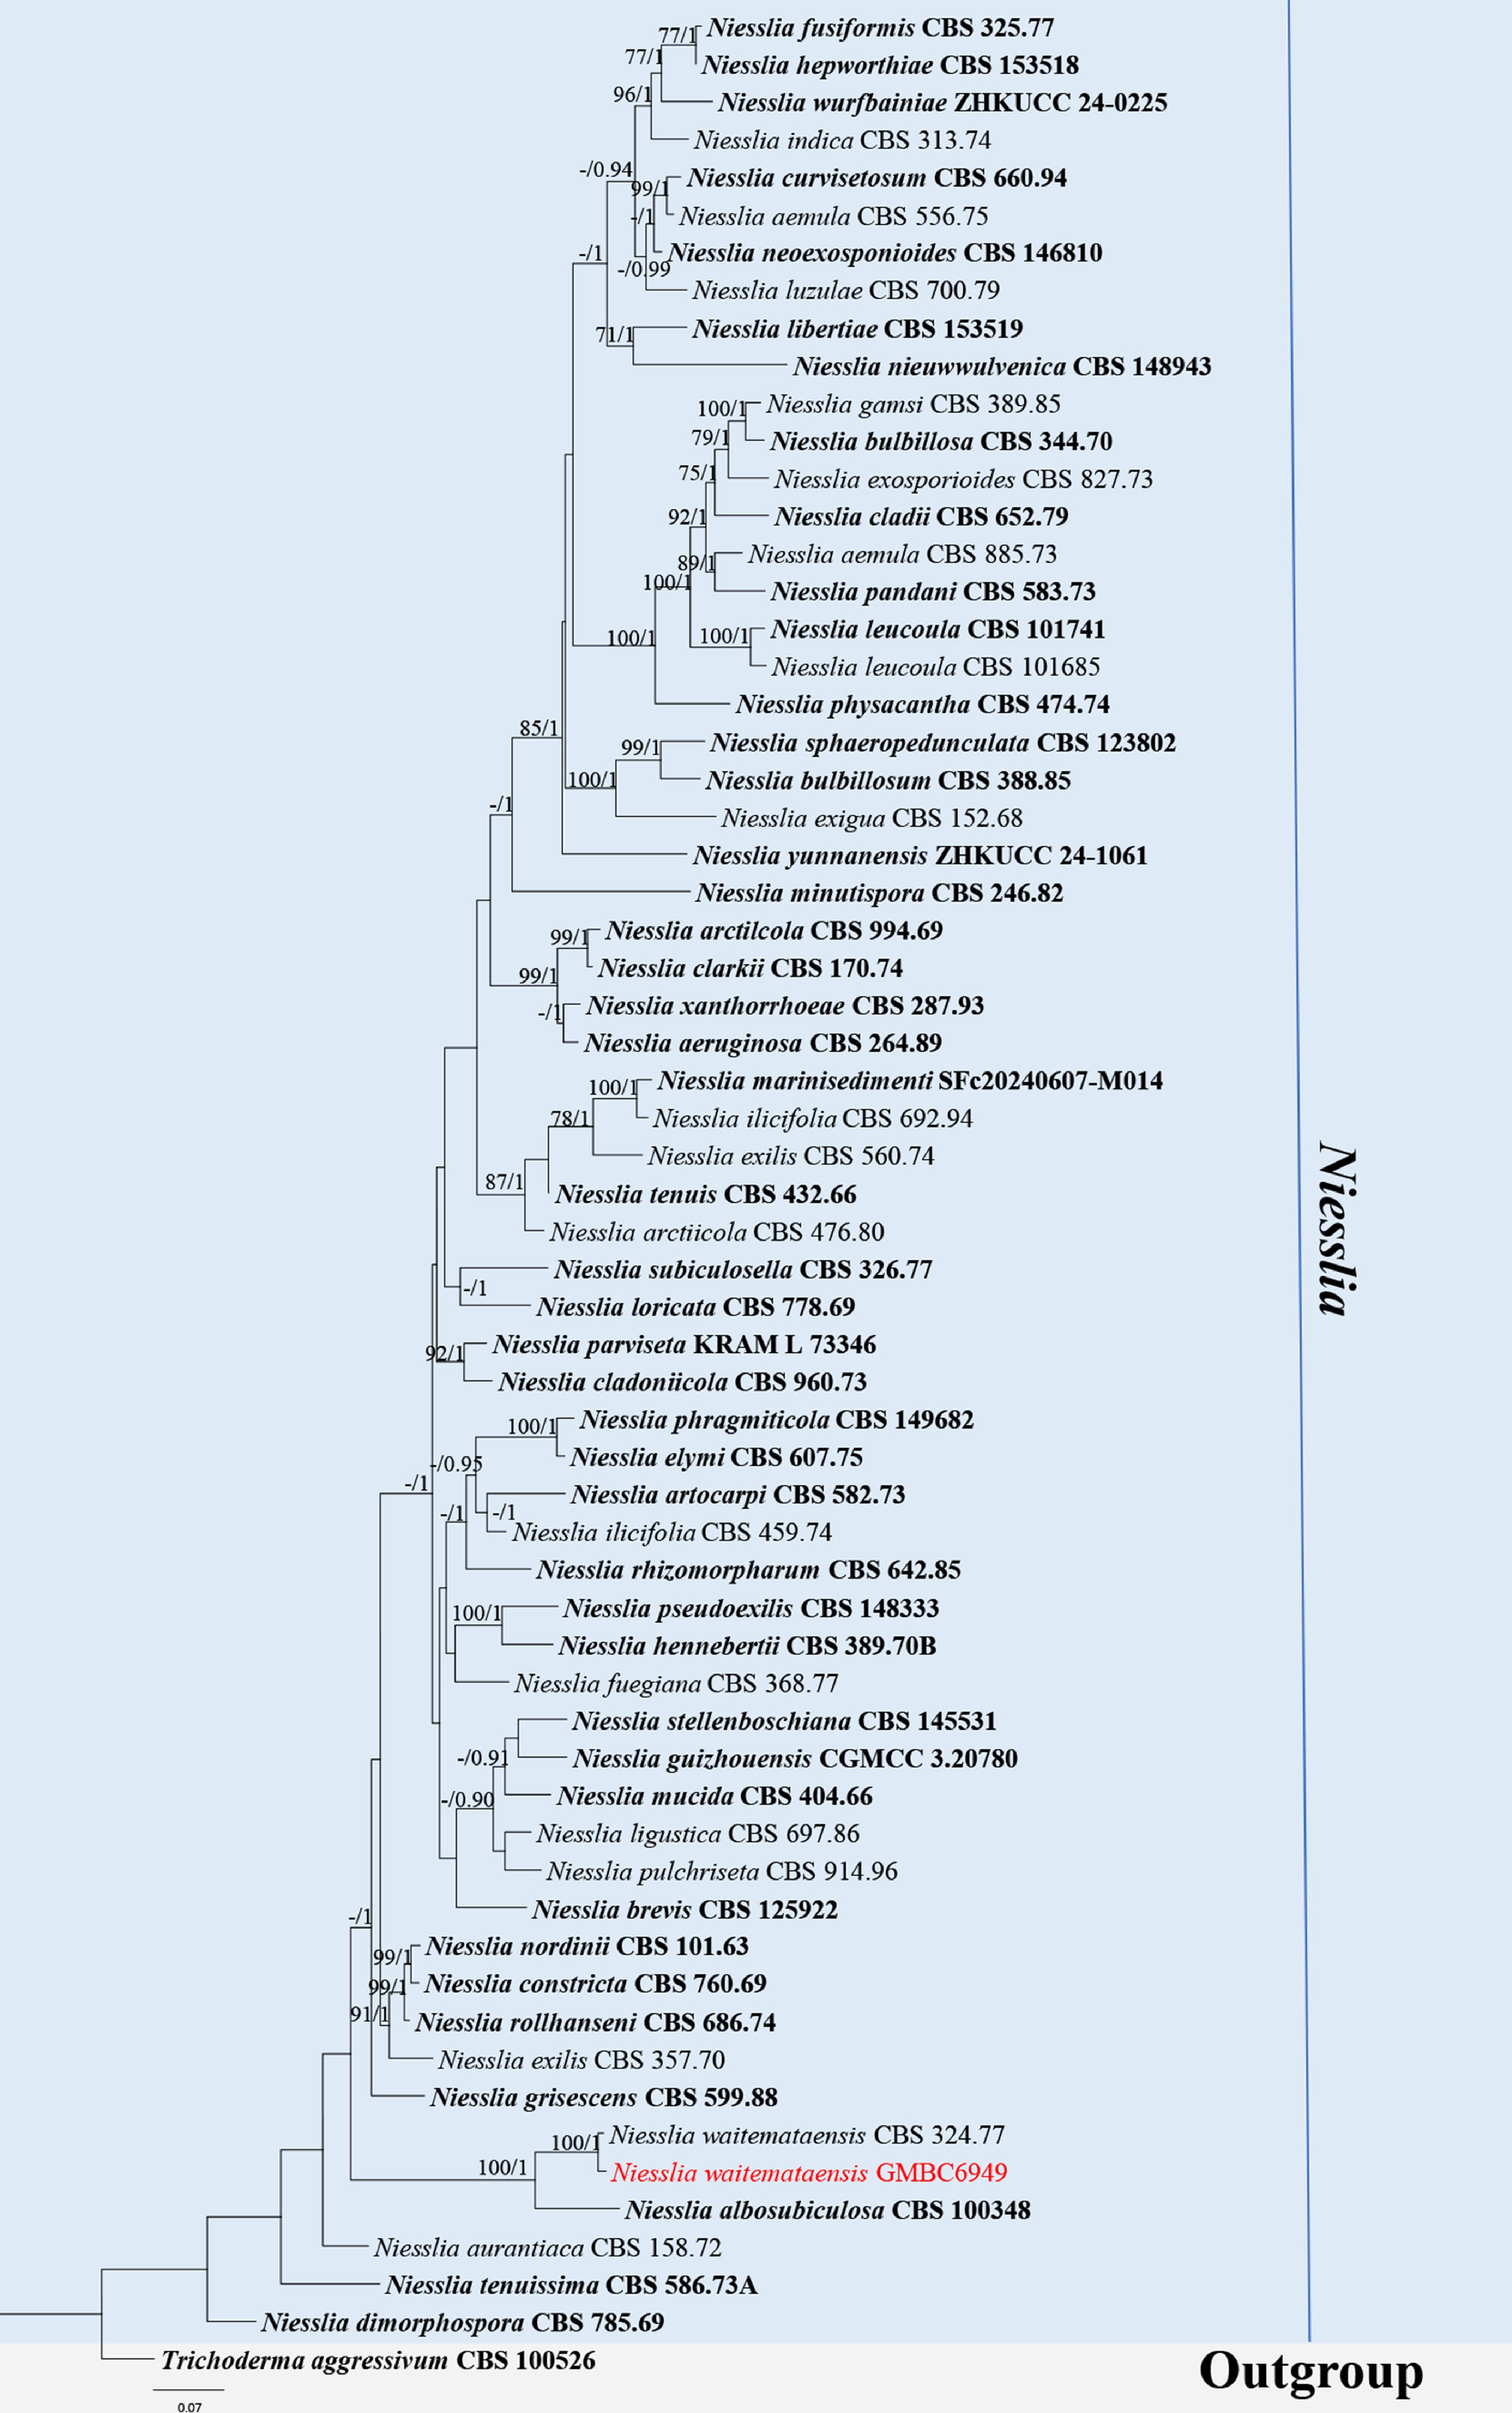
Figure 40.
ML tree of selected Niesslia species based on the ITS-LSU- tef1-α-tub2 dataset. The combined dataset comprised 63 taxa, 2,330 characters (ITS:1–533 bp; LSU: 534–1,416 bp; tef1-α: 1,417–1,899 bp; tub2: 1,900–2,330 bp), including indel regions. Maximum likelihood (lnL = −25,543.032496) and Bayesian analyses produced consistent tree topologies. Trichoderma aggressivum (CBS 100526) was selected as the outgroup taxon. Bayesian posterior probabilities (PP) ≥ 0.90 and RAxML bootstrap support values ≥ 70 % are shown on the branches. The new record is marked in red. Ex-type/type strains are indicated in bold.
-
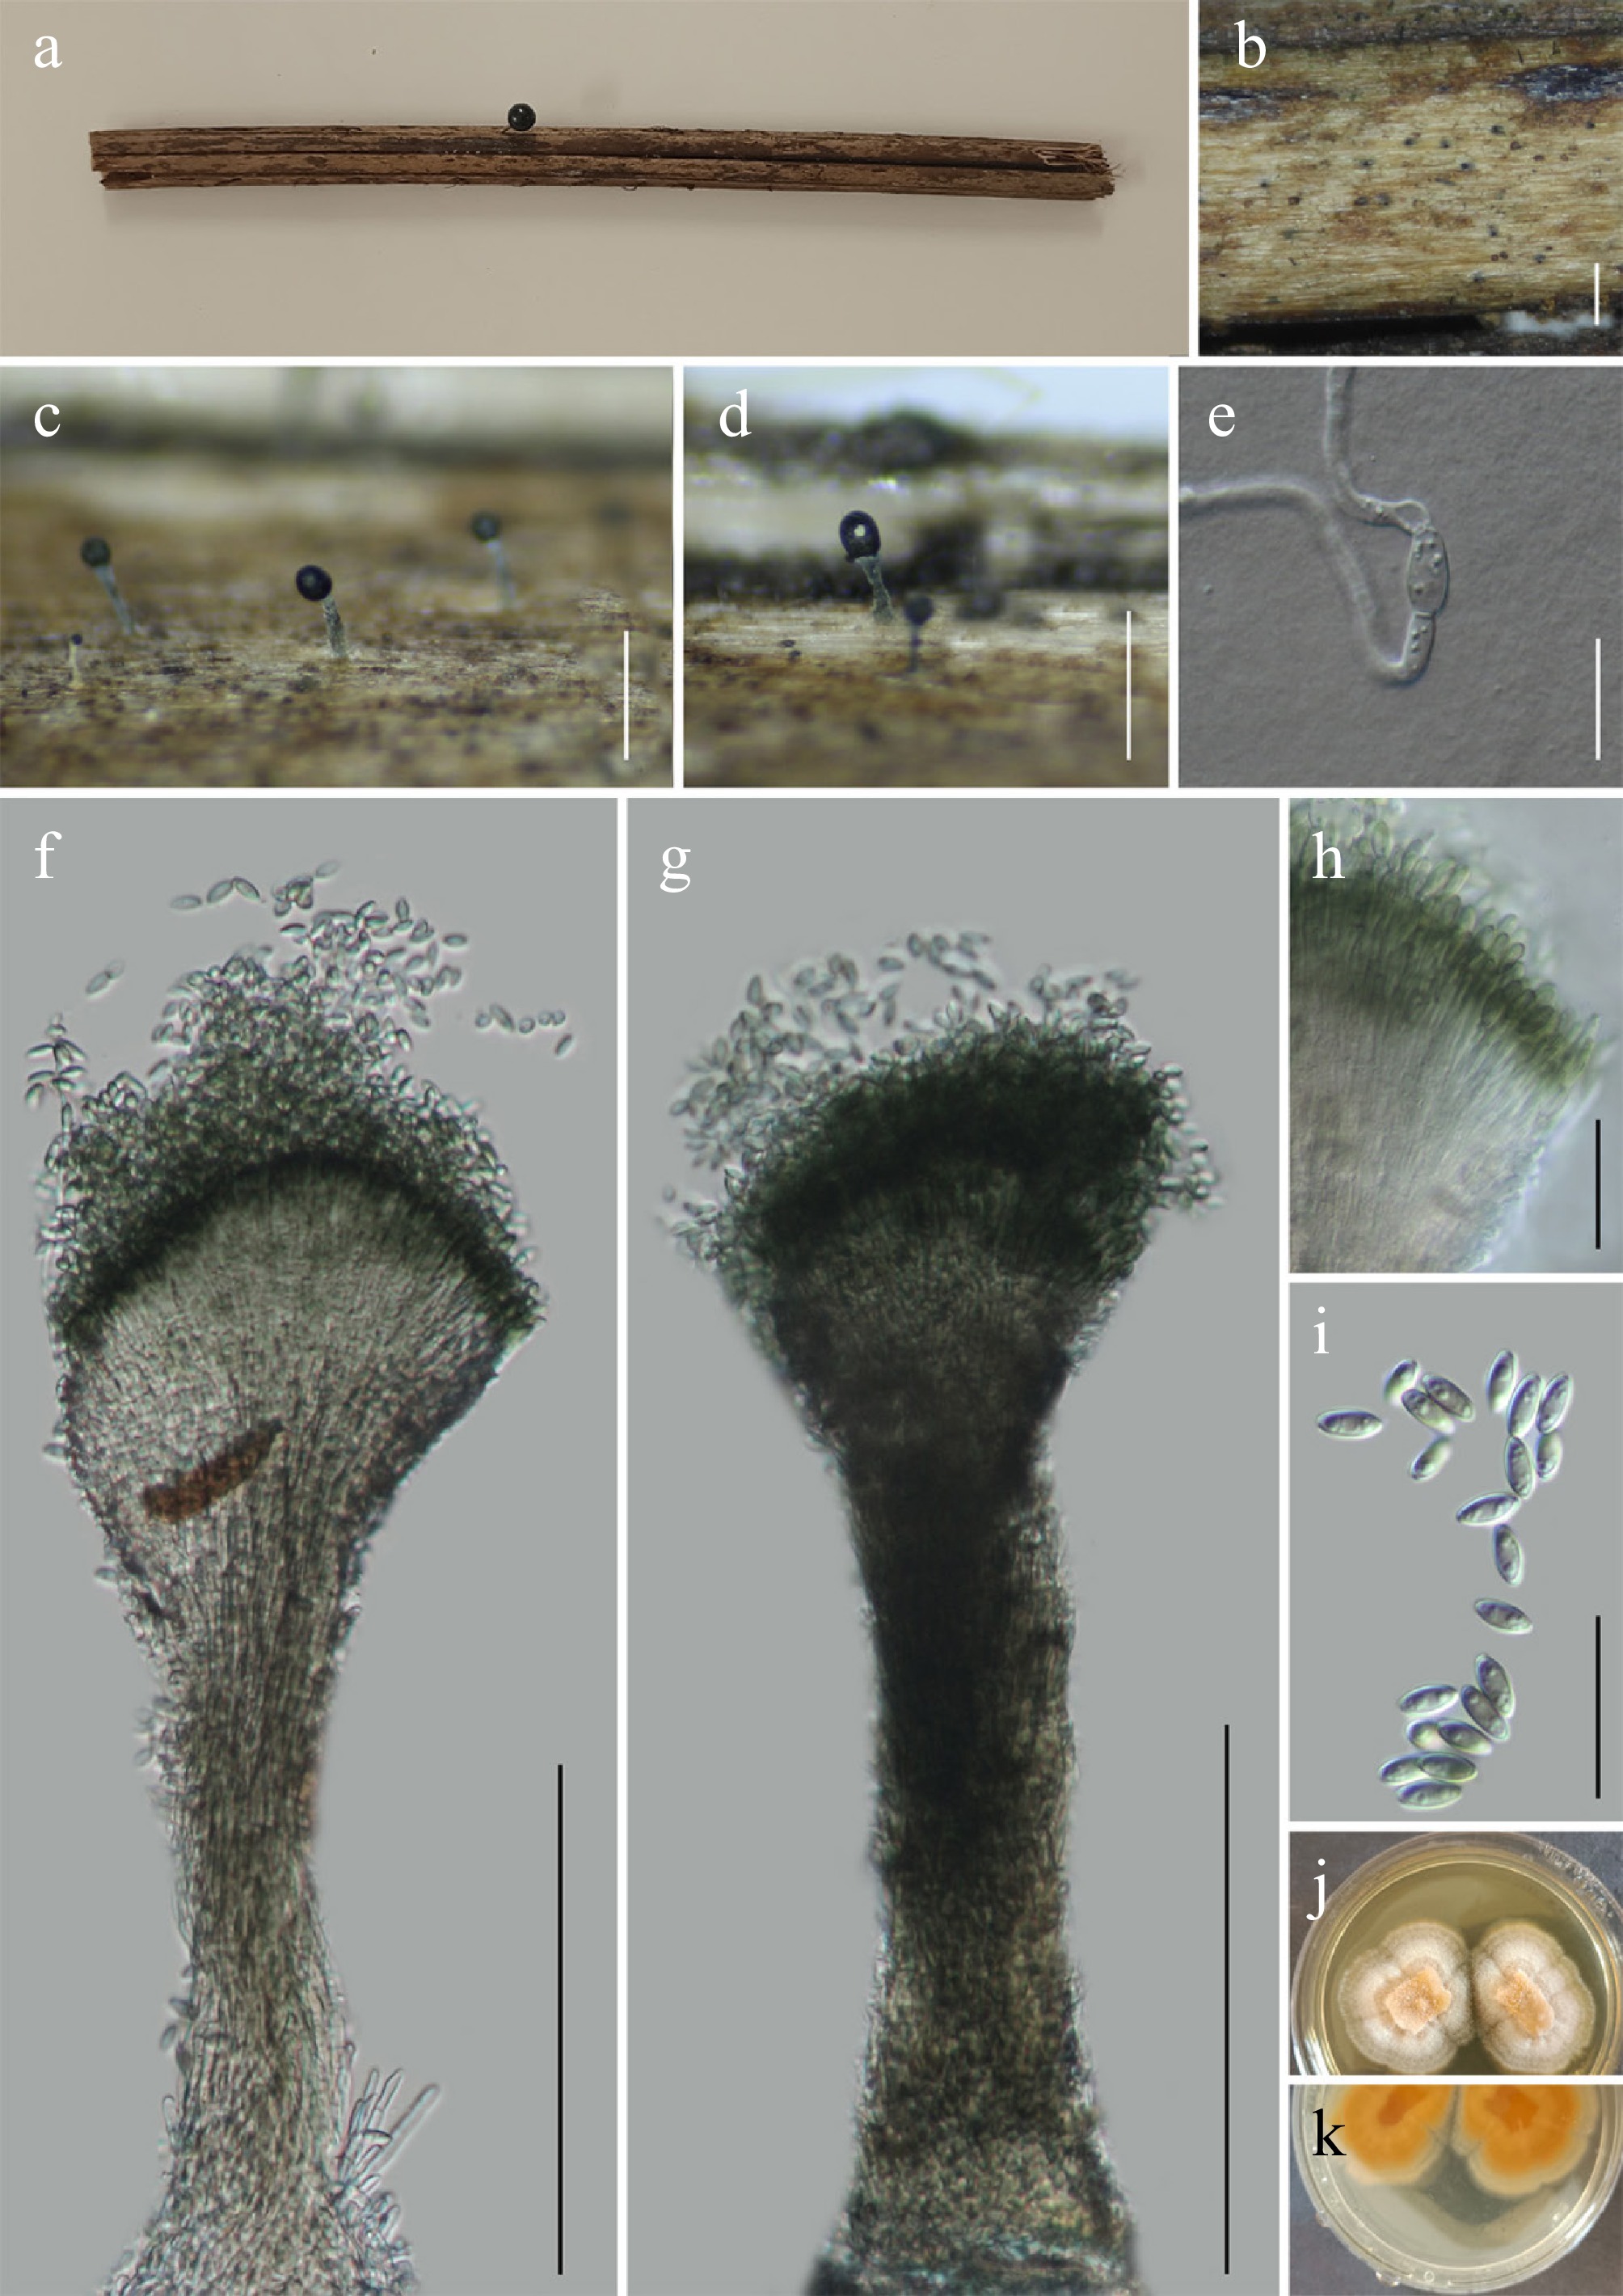
Figure 41.
Myxospora aquatica (GMB5158 holotype). (a) Host. (b)–(d) Colonies on natural substrate. (e) Germinating conidium. (f), (g) Conidiophores and conidia. (h) Conidiogenous cells. (i) Conidia. (j), (k) Surface and reverse view of culture on PDA. Scale bars: b = 1 mm, c, d = 0.5 mm, f, g = 120 μm, e, h, i = 20 μm.
-
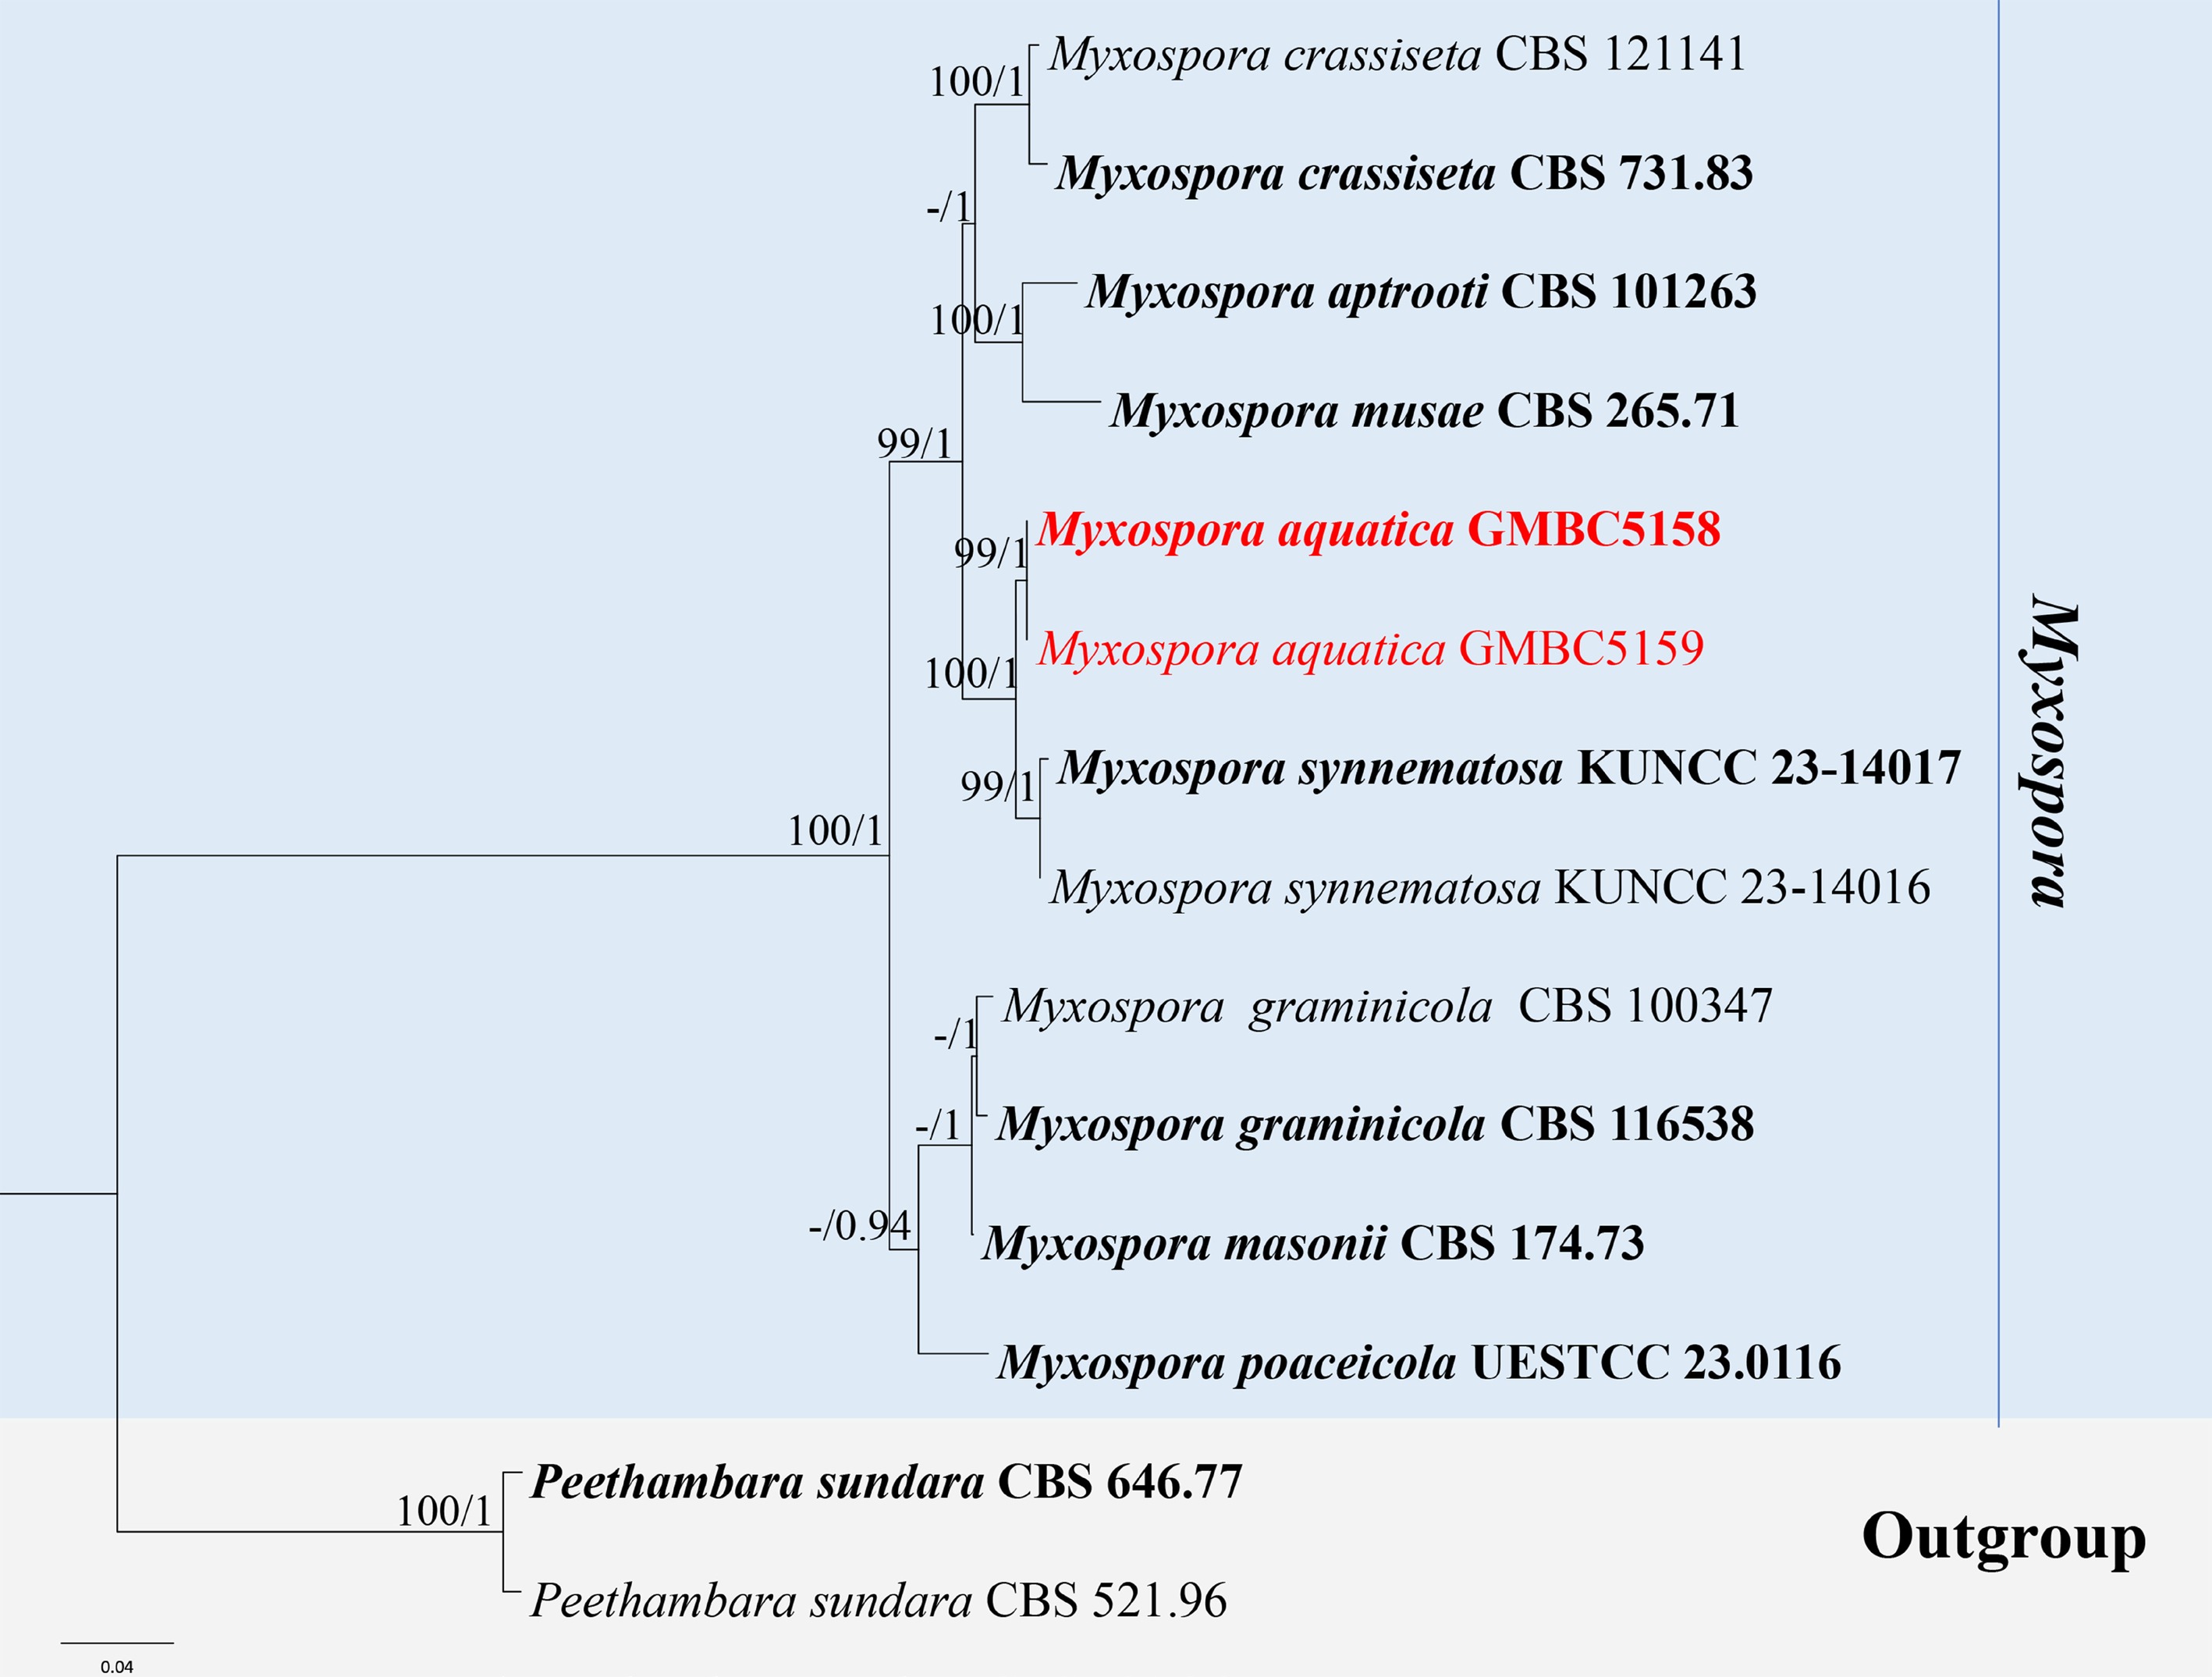
Figure 42.
ML tree of selected Myxospora species based on the ITS-LSU-tef1-α-rpb2-tub2 dataset. The combined dataset comprised 14 taxa, 2,895 characters (ITS:1–531 bp; LSU: 532–1,360 bp; tef1-α: 1,361–1,839 bp; rpb2: 1,840–2,618 bp; tub2: 2,619–2,895 bp), including indel regions. Maximum likelihood (lnL = −7,963.613215) and Bayesian analyses produced consistent tree topologies. Peethambara sundara (CBS 521.96) and P. sundara (CBS 646.77) were selected as the outgroup taxa. Bayesian posterior probabilities (PP) ≥ 0.90 and RAxML bootstrap support values ≥ 70 % are shown on the branches. The novel species is indicated in red and ex-type/type strains in bold.
-
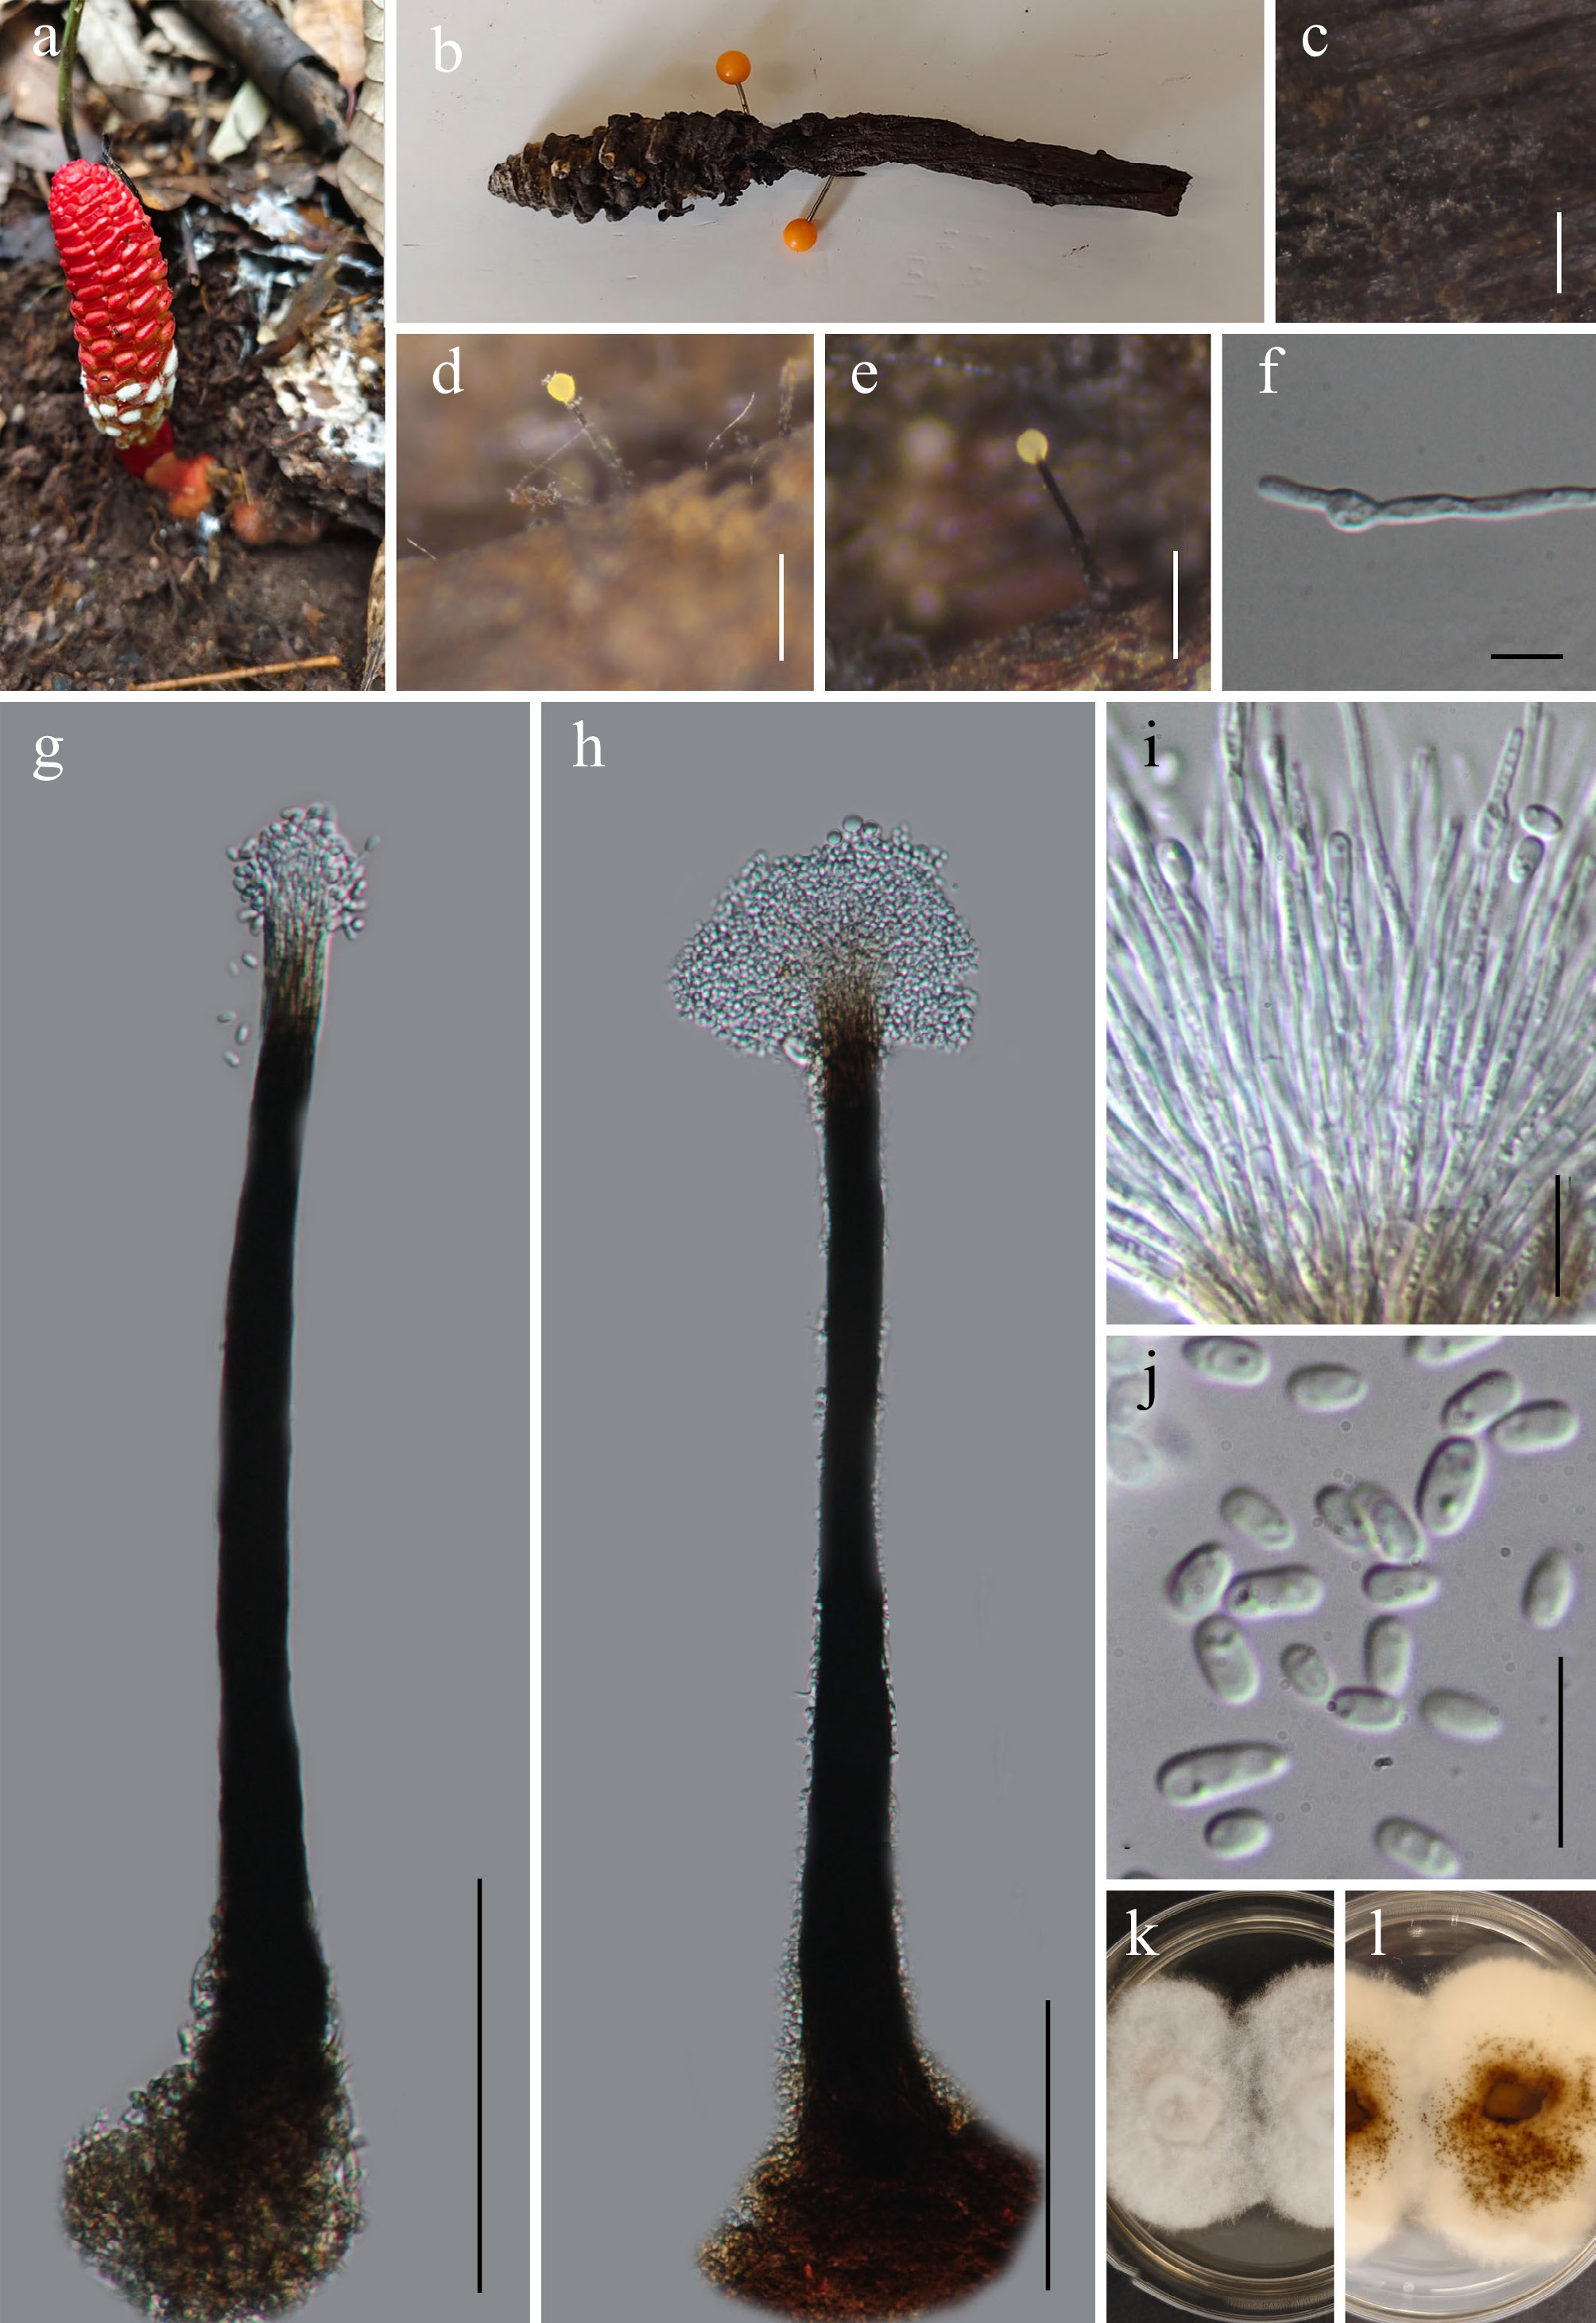
Figure 43.
Ophiostoma balanophorae (GMB5176 holotype). (a), (b) Host. (c)–(e) Synnemata on natural substrate. (f) Germinating conidium. (g), (h) Conidiophores and conidia. (i) Conidiogenous cells. (j) Conidia. (k), (l) Surface and reverse view of culture on PDA. Scale bars: b =1 mm, c = 0.5 mm; d = 0.25 mm; g, h= 100 μm; e, i, j = 10 μm.
-
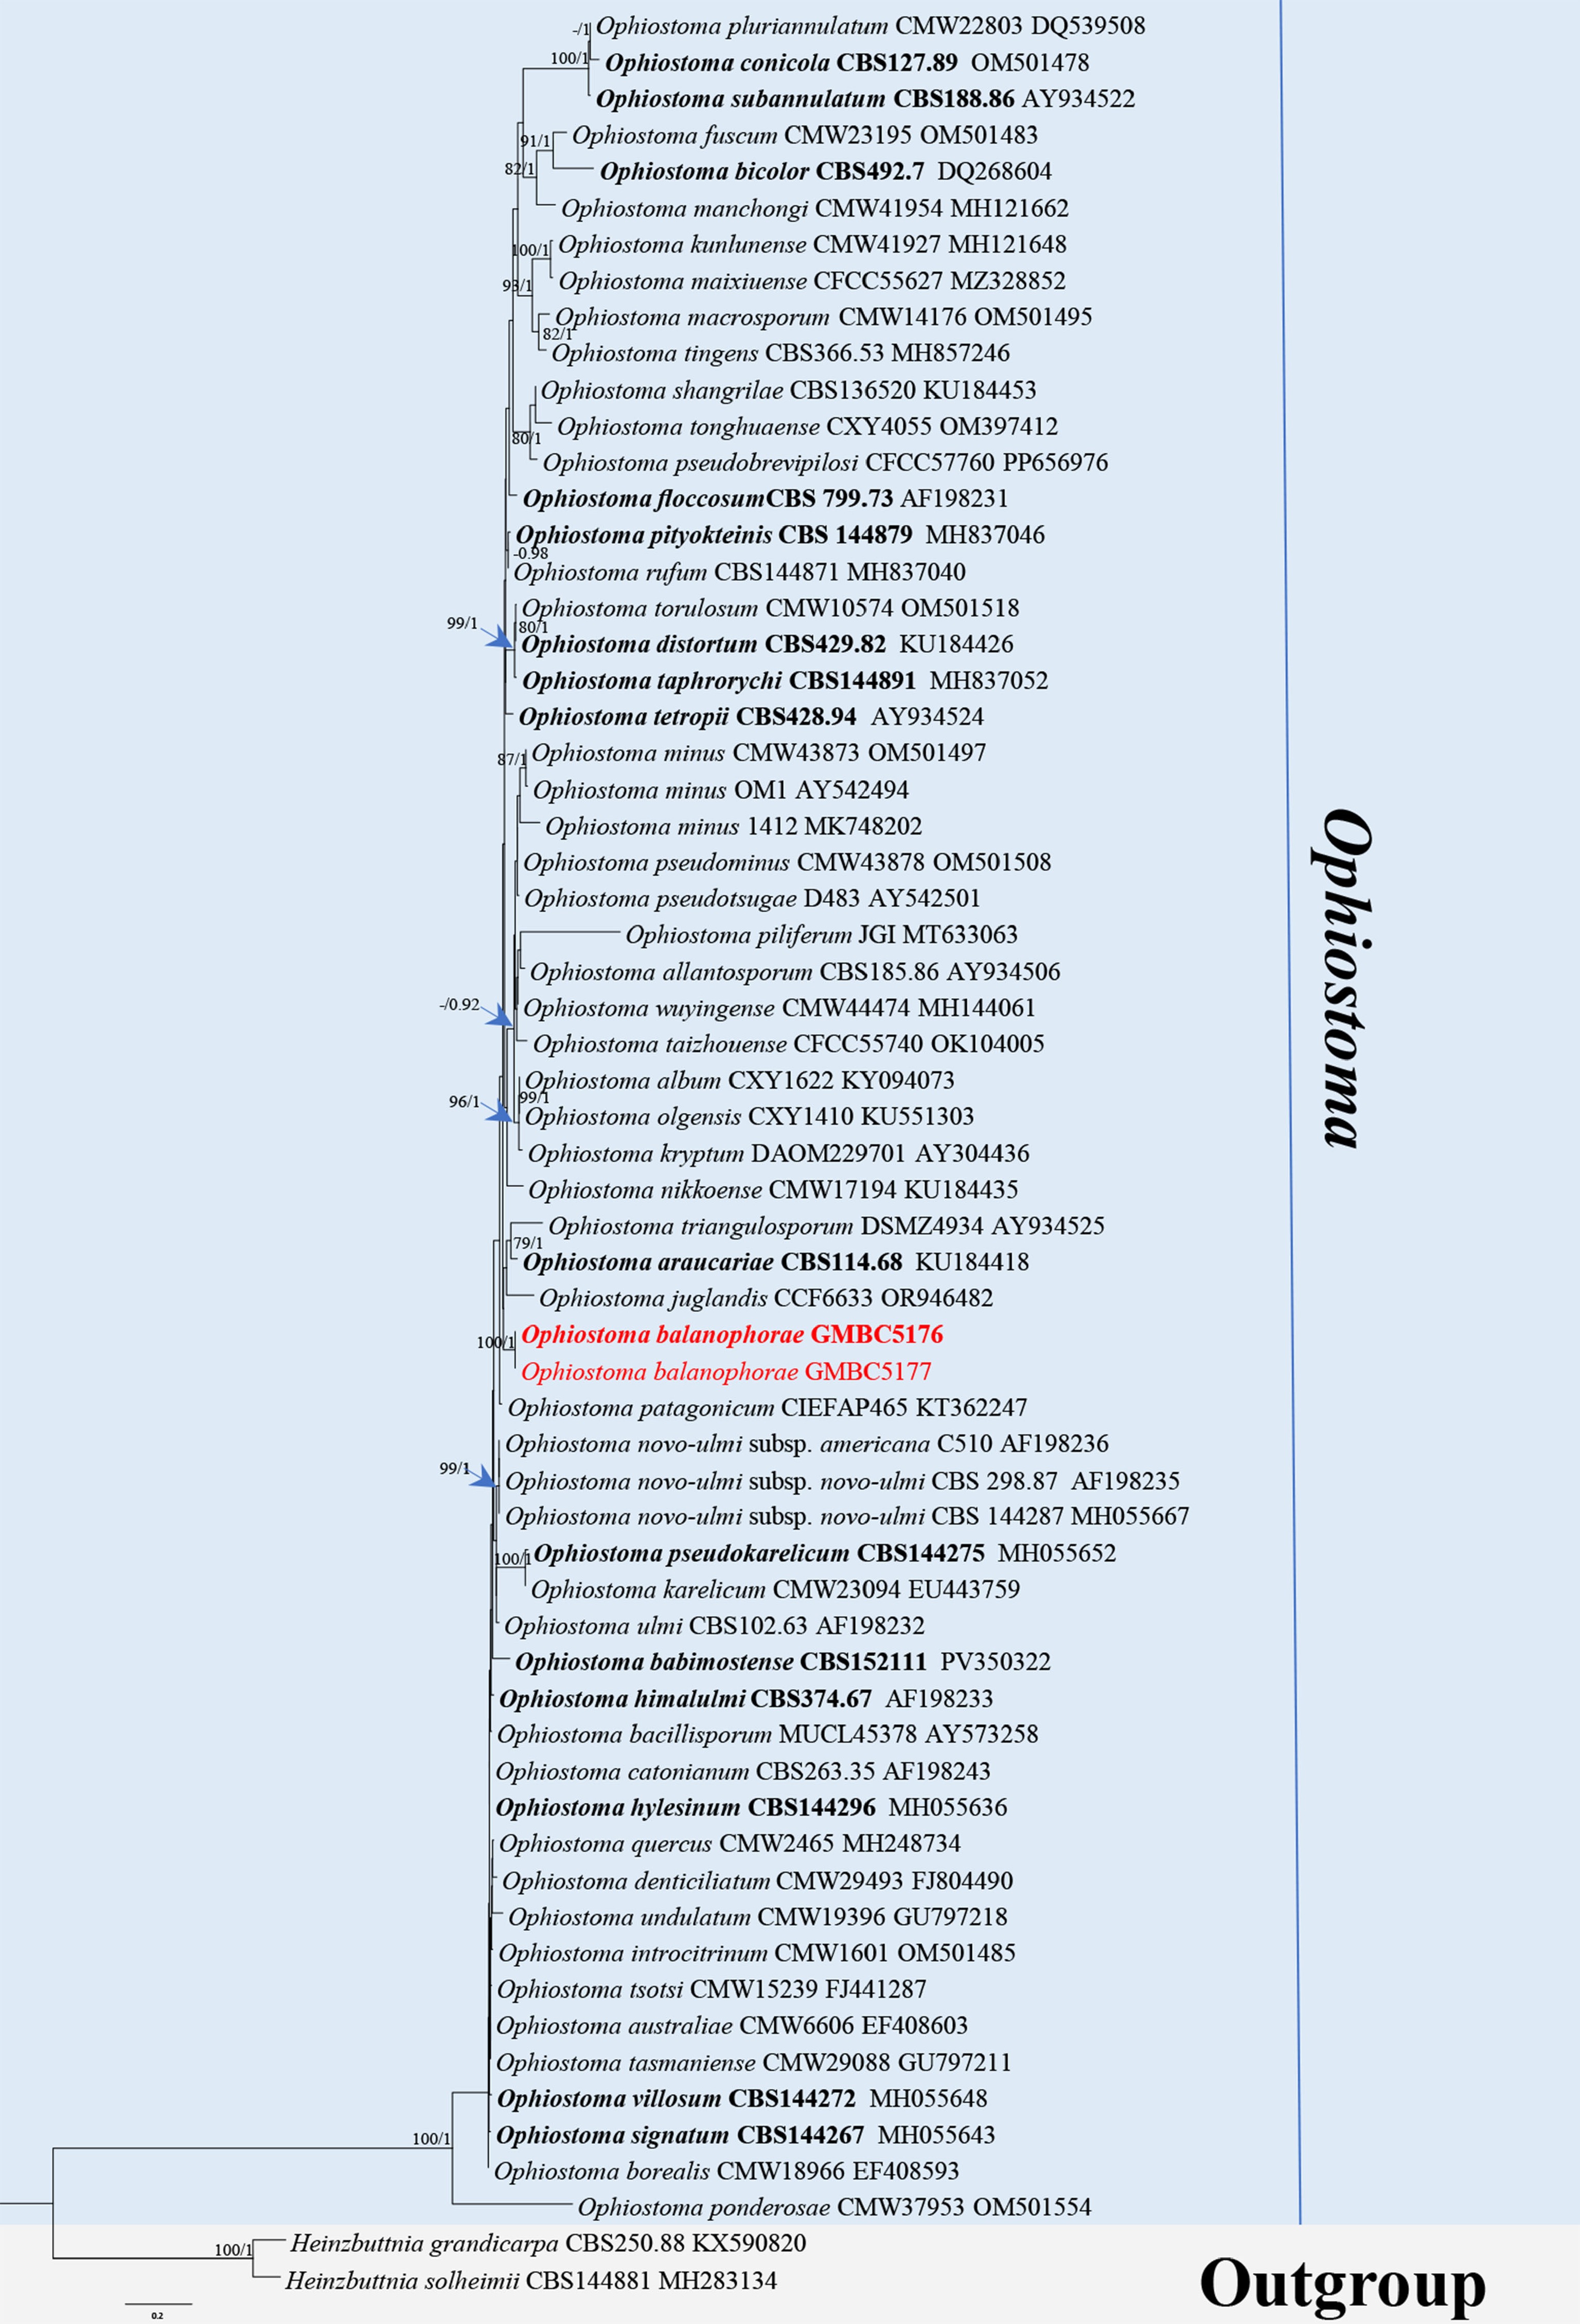
Figure 44.
ML tree of selected Ophiostoma species based on ITS. The combined dataset comprised 63 taxa, 573 characters, including indel regions. Maximum likelihood (lnL = −5,167.162764) and Bayesian analyses produced consistent tree topologies. Heinzbuttnia solheimii (CBS144881) and H. grandicarpa (CBS250.88) were selected as the outgroup taxa. Bayesian posterior probabilities (PP) ≥ 0.90 and RAxML bootstrap support values ≥ 70 % are shown on the branches. The novel species is indicated in red and ex-type/type strains in bold.
-
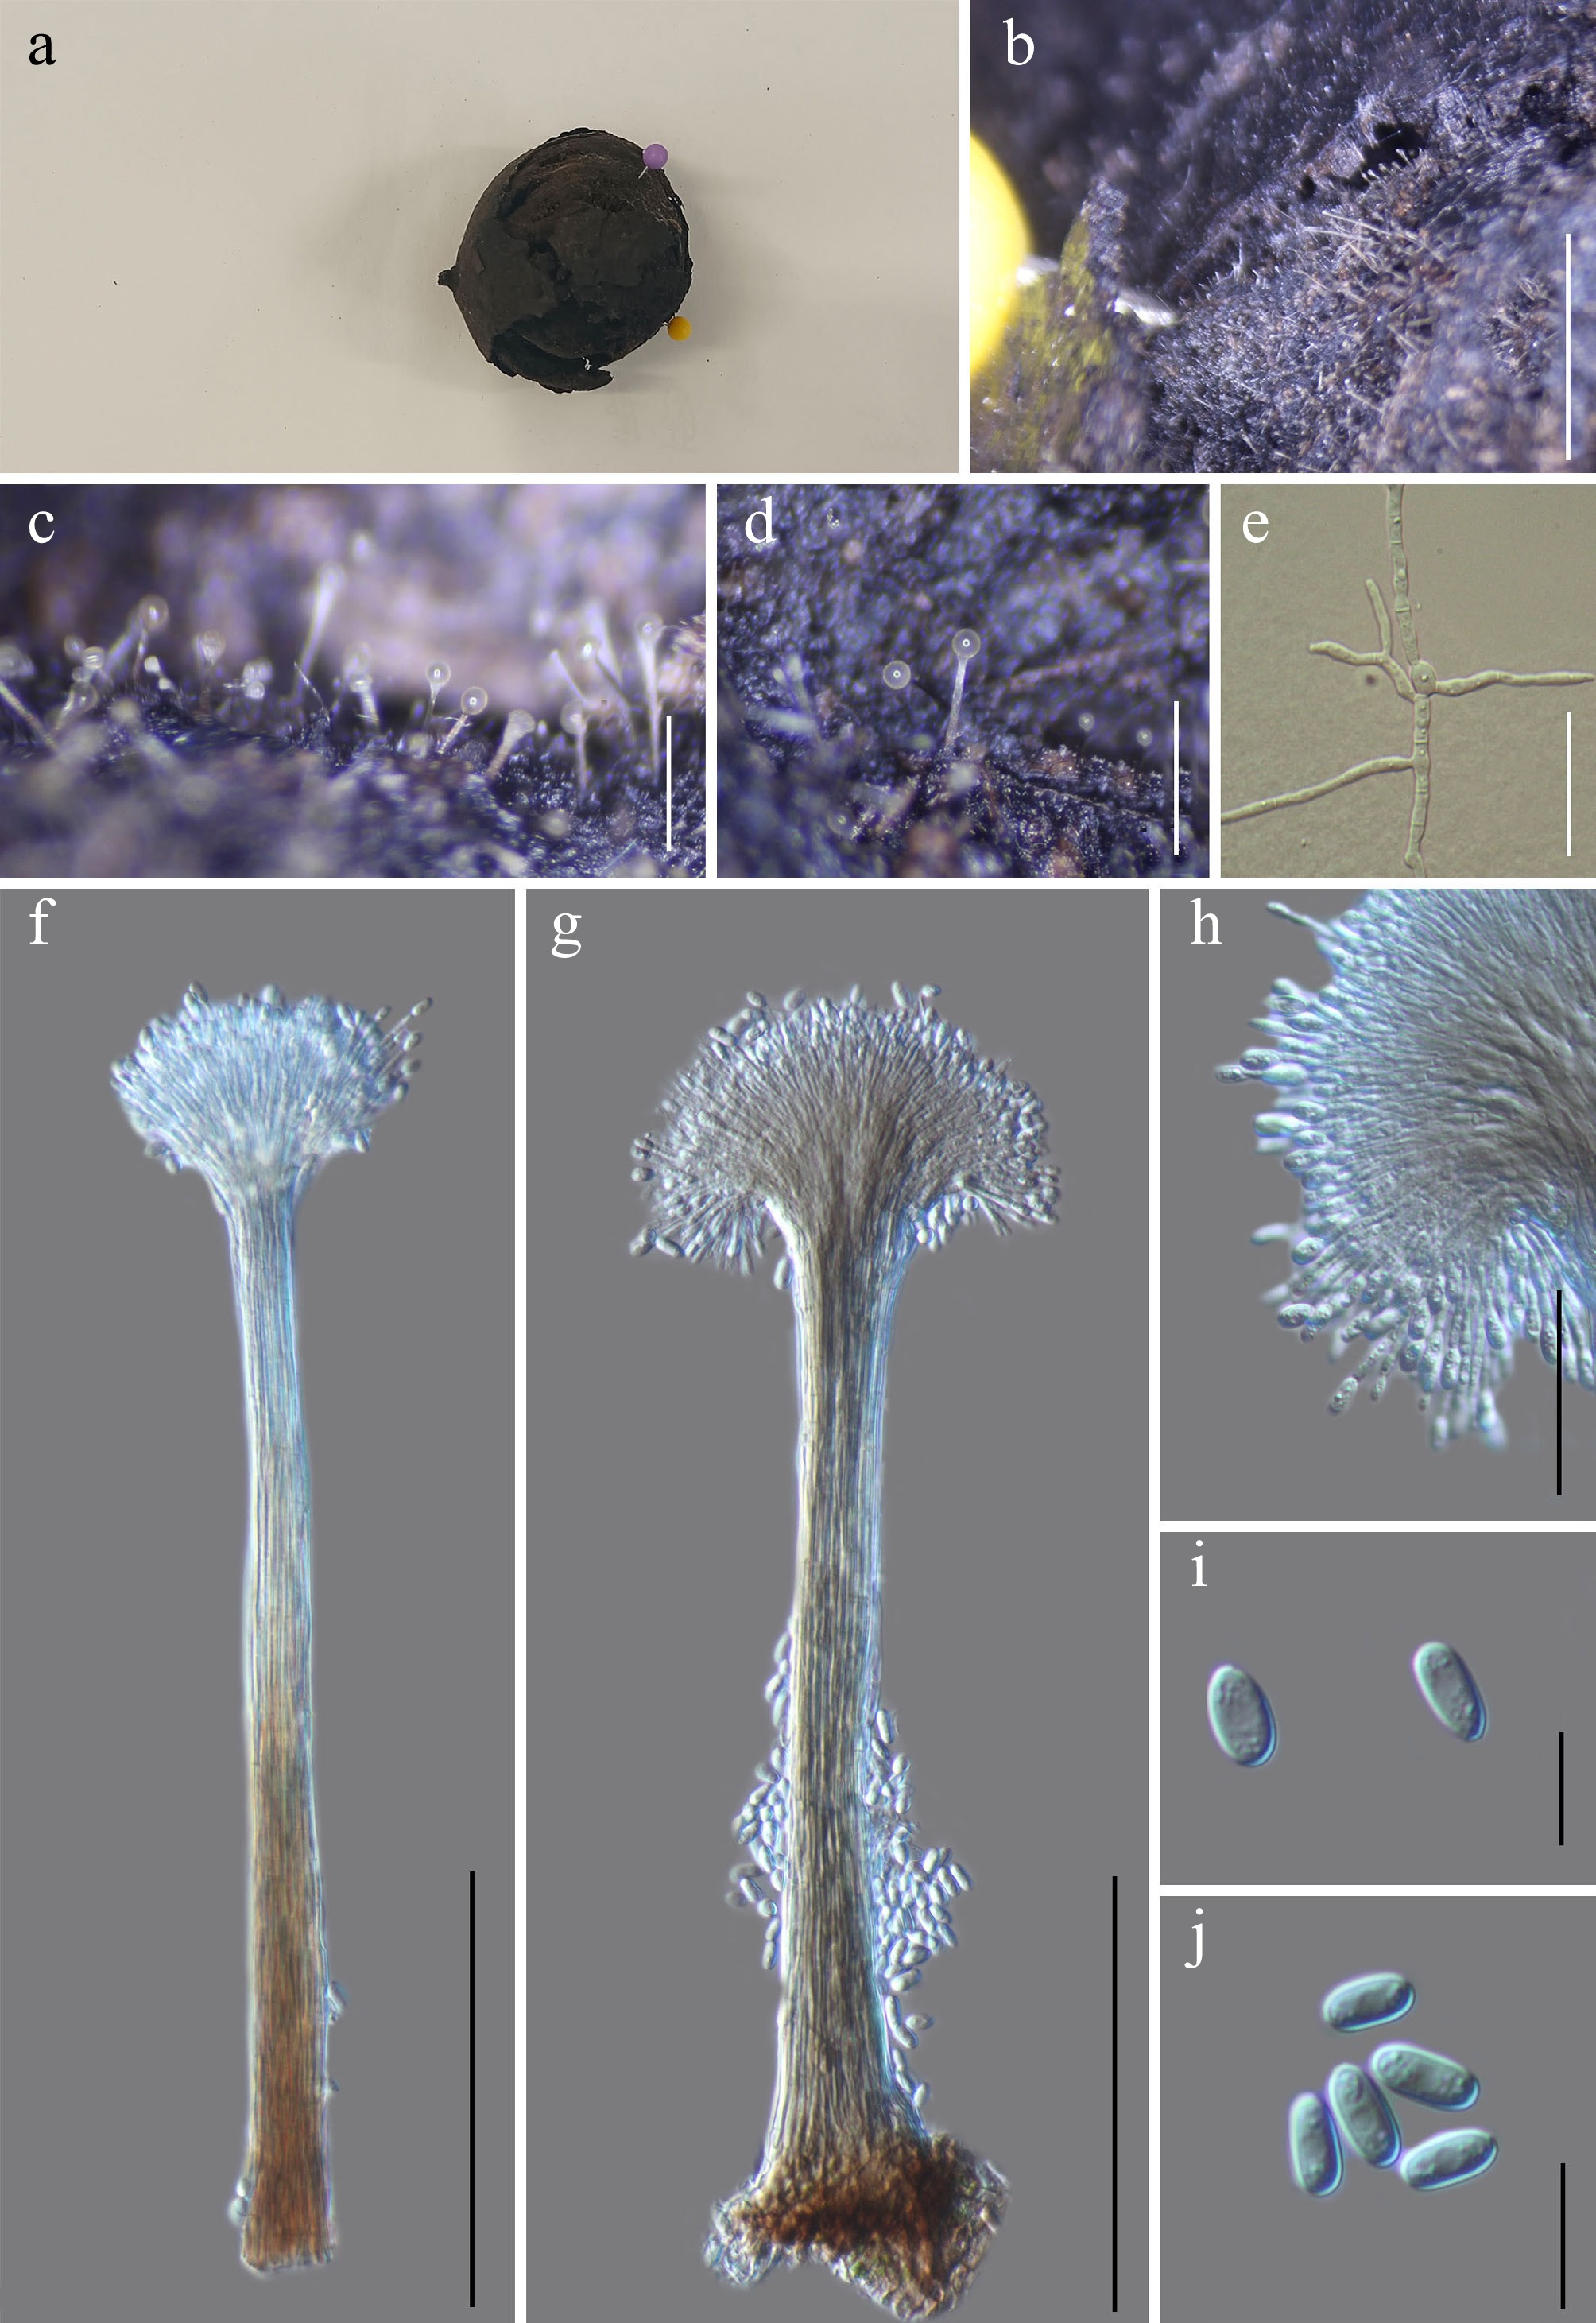
Figure 45.
Parascedosporium juglandicola (GMB5160 holotype). (a) Decaying walnut fruit. (b)–(d) Colonies on natural substrate. (e) Germinating conidium. (f), (g) Conidiophores and conidia. (h) Conidiogenous cells. (i), (j) Conidia. Scale bars: b = 3 mm, c = 4 mm, d = 0.5 mm, e, h = 30 μm, f, g = 100 μm, i, j = 10 μm.
-
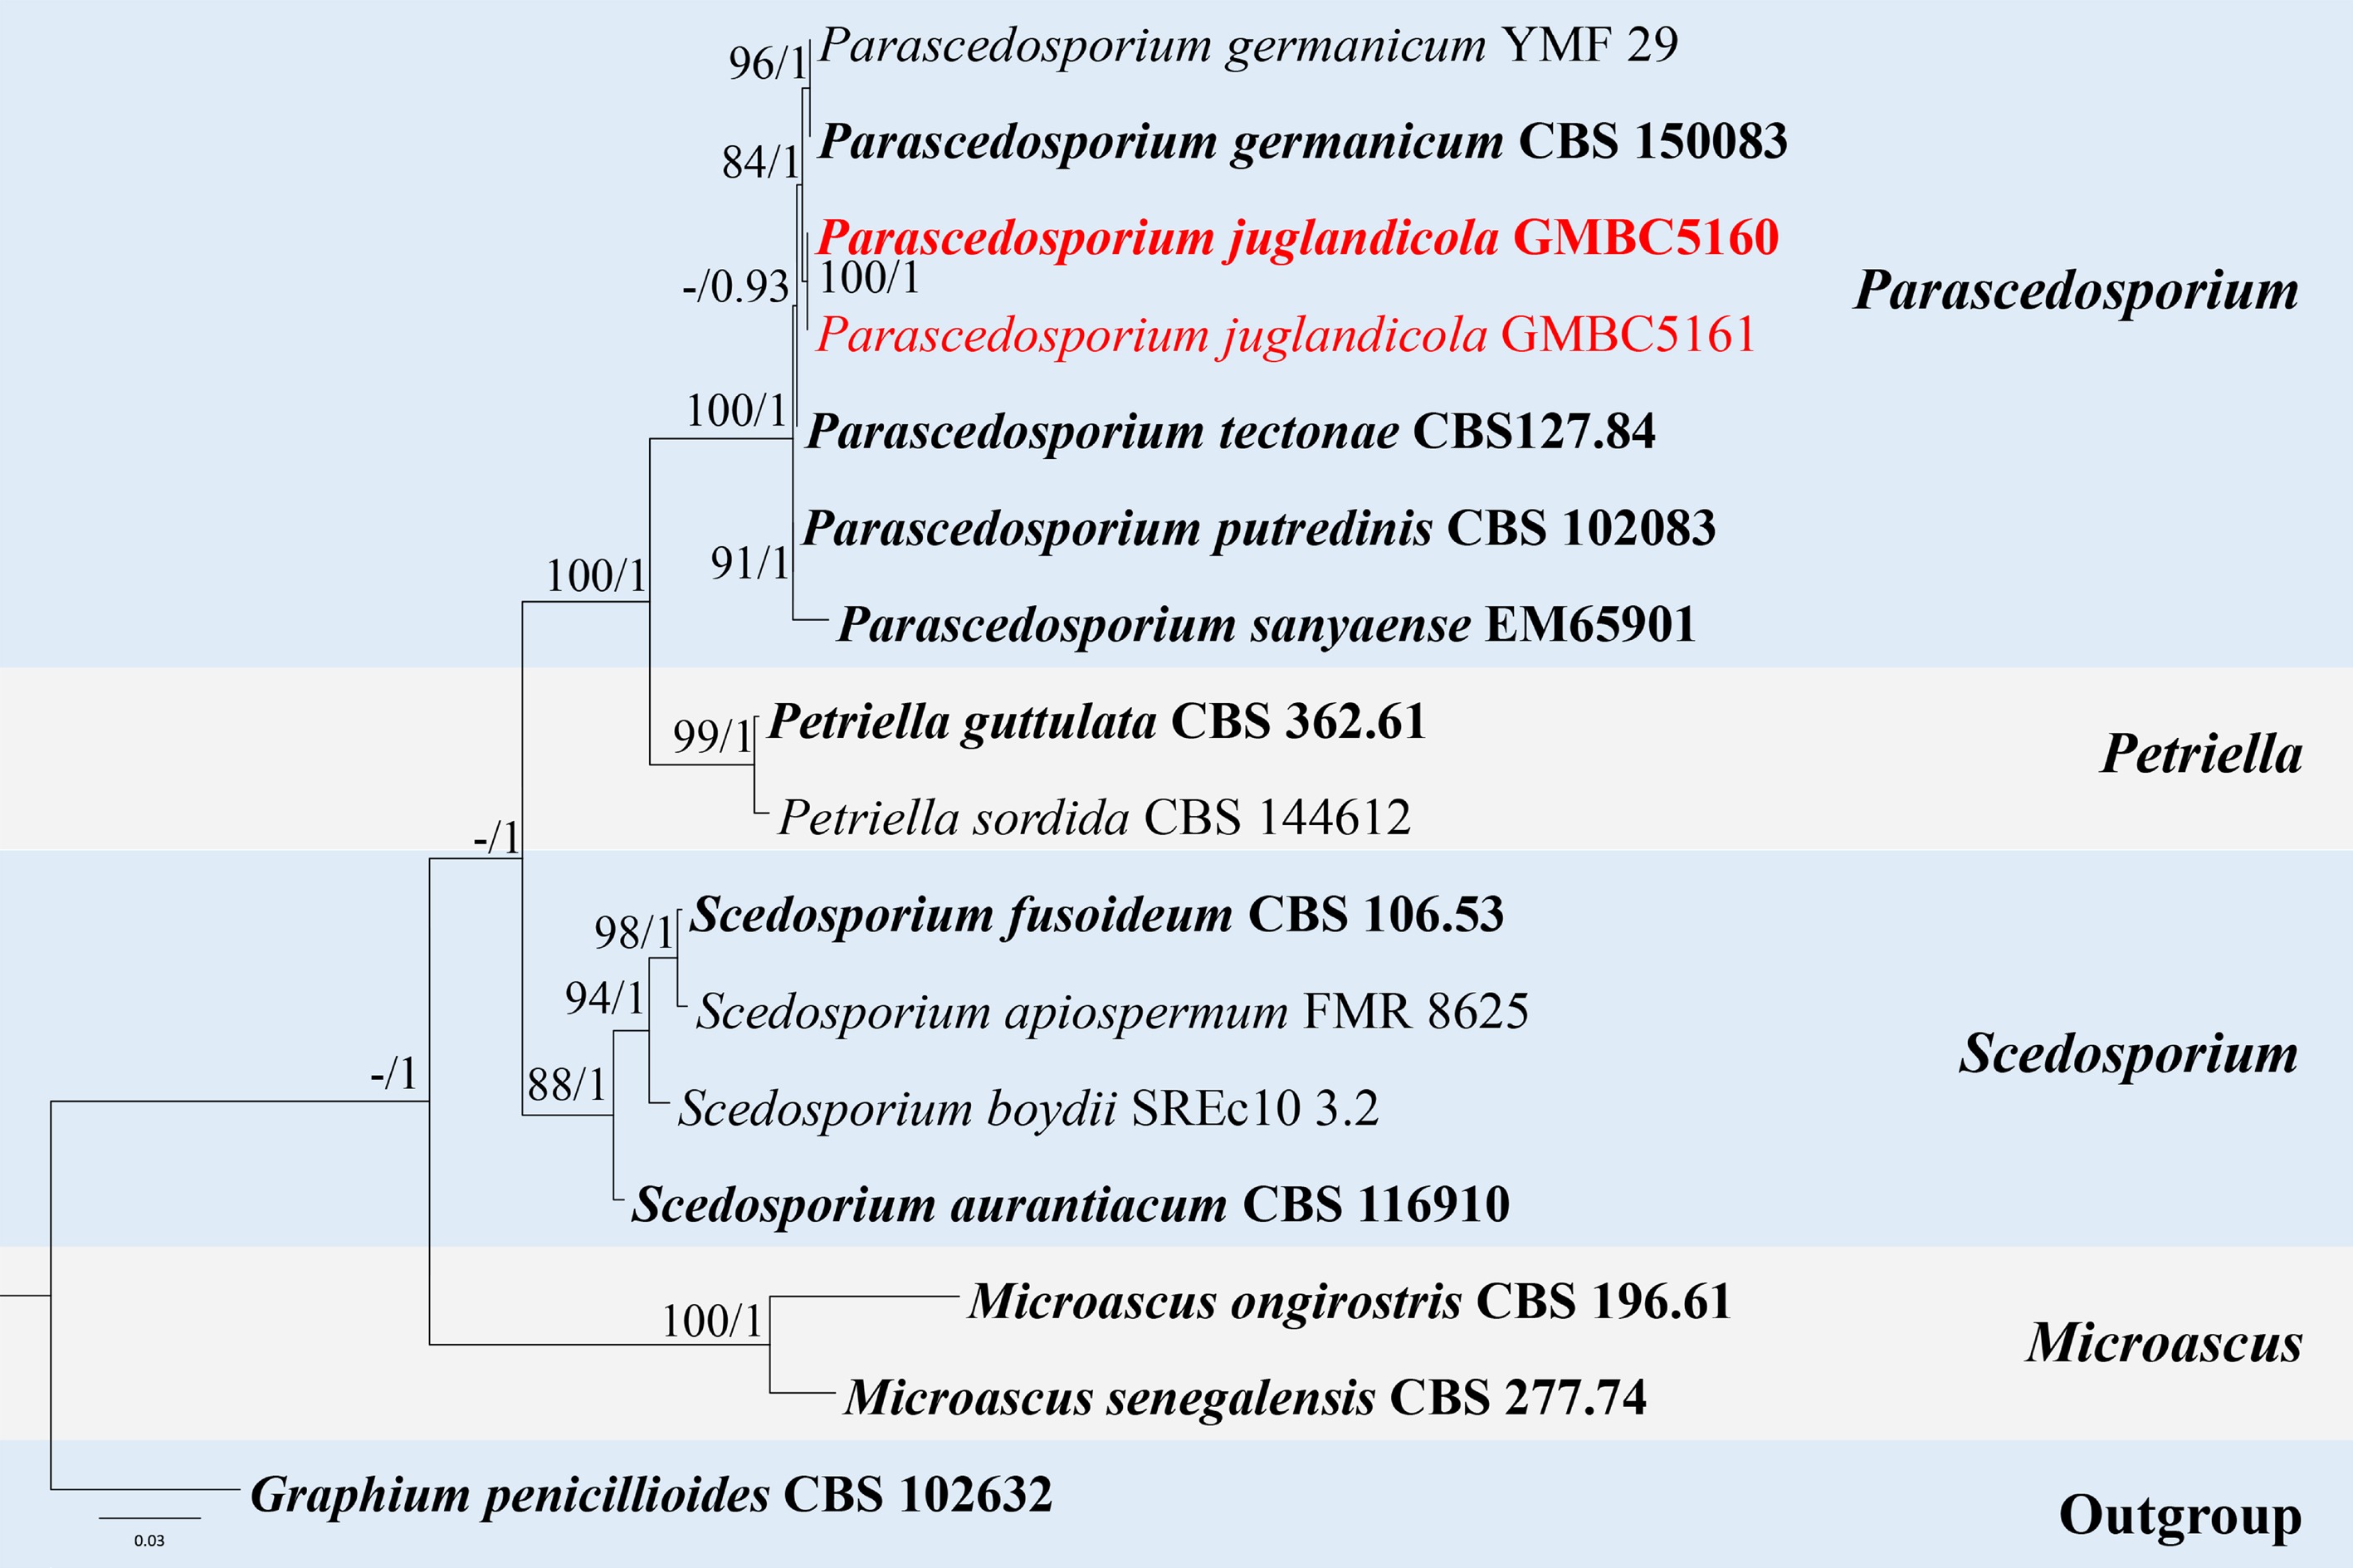
Figure 46.
ML tree of selected species of Parascedosporium and related genera based on the ITS-LSU dataset. The combined dataset comprised 14 taxa, 1,329 characters (ITS: 1–523 bp; LSU: 524–1,329 bp), including indel regions. Maximum likelihood (lnL = −4076.672862) and Bayesian analyses produced consistent tree topologies. Graphium penicillioides (CBS 102632) was selected as the outgroup taxon. Bayesian posterior probabilities (PP) ≥ 0.90 and RAxML bootstrap support values ≥ 70 % are shown on the branches. The novel species is indicated in red and ex-type/type strains in bold.
-
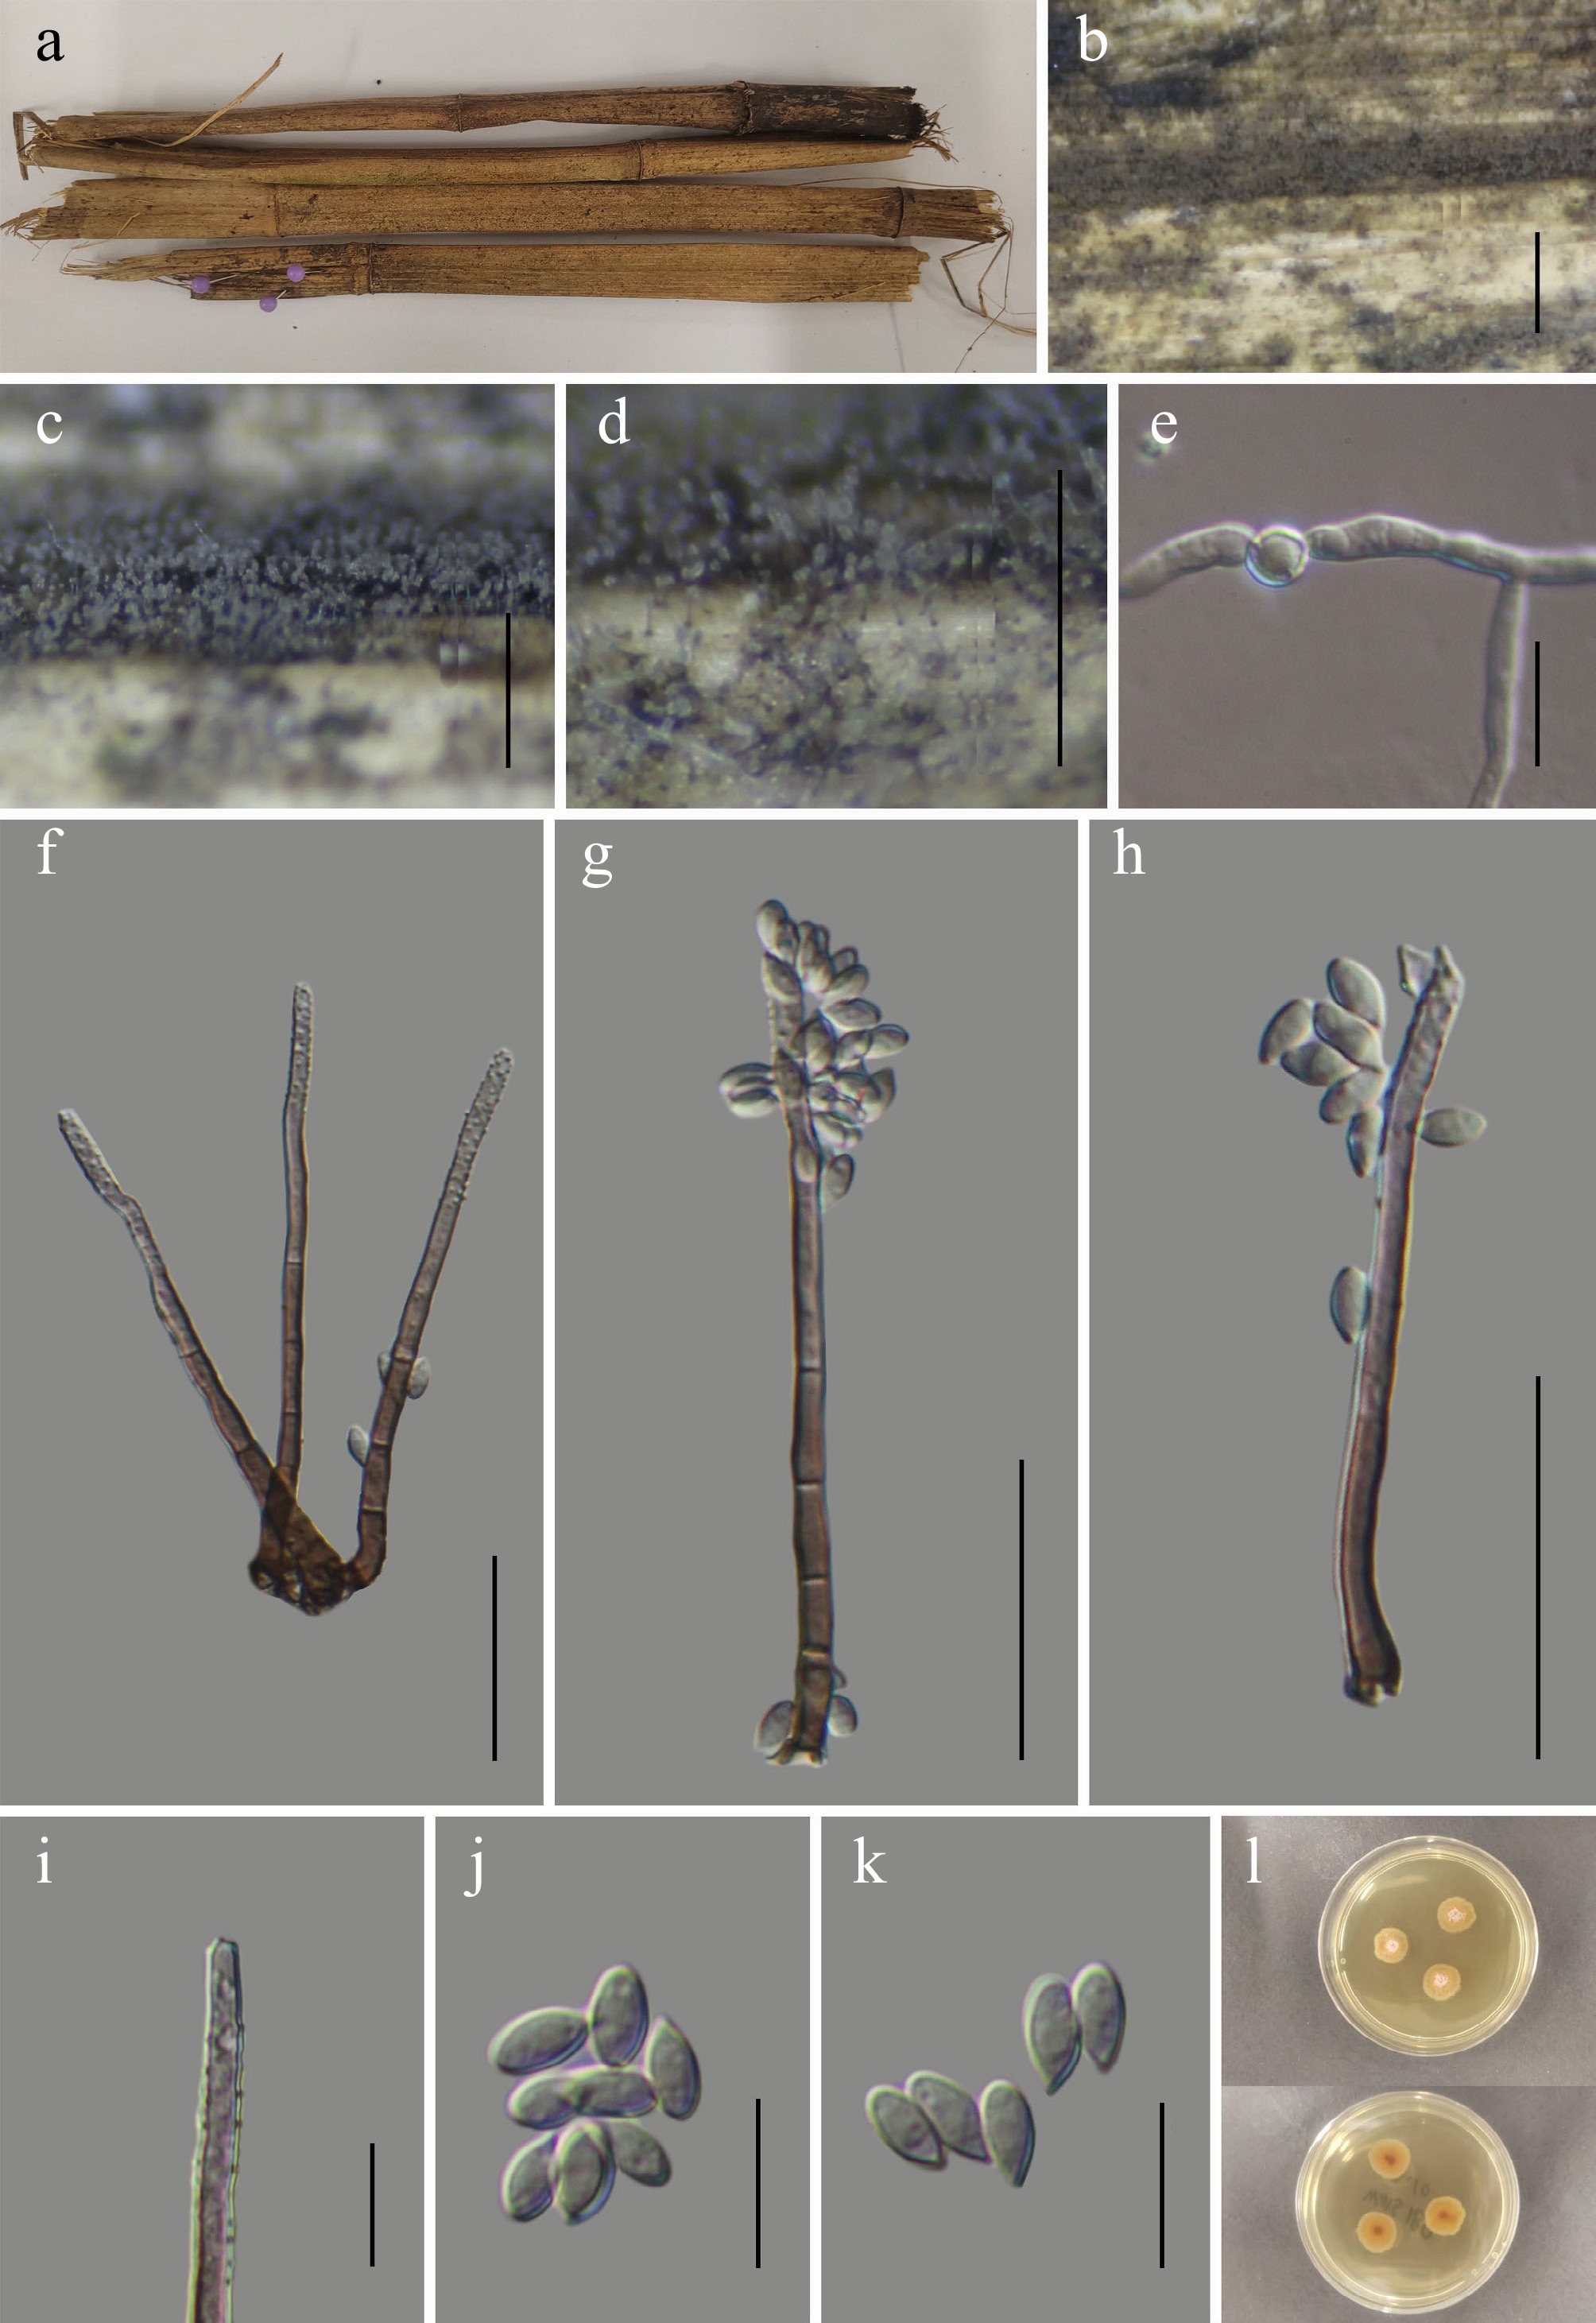
Figure 47.
Myrmecridium bambusicola (GMB6939 holotype). (a) Decaying bamboo host. (b)–(d) Colonies on natural substrate. (e) Germinating conidium. (f)–(h) Conidiophores and conidia. (i) Conidiogenous cells. (j), (k) Conidia. (l) Surface and reverse view of culture on PDA. Scale bars: b = 1 mm, c, d = 0.5 mm, f–h = 30 μm, e, i–k = 10 μm.
-
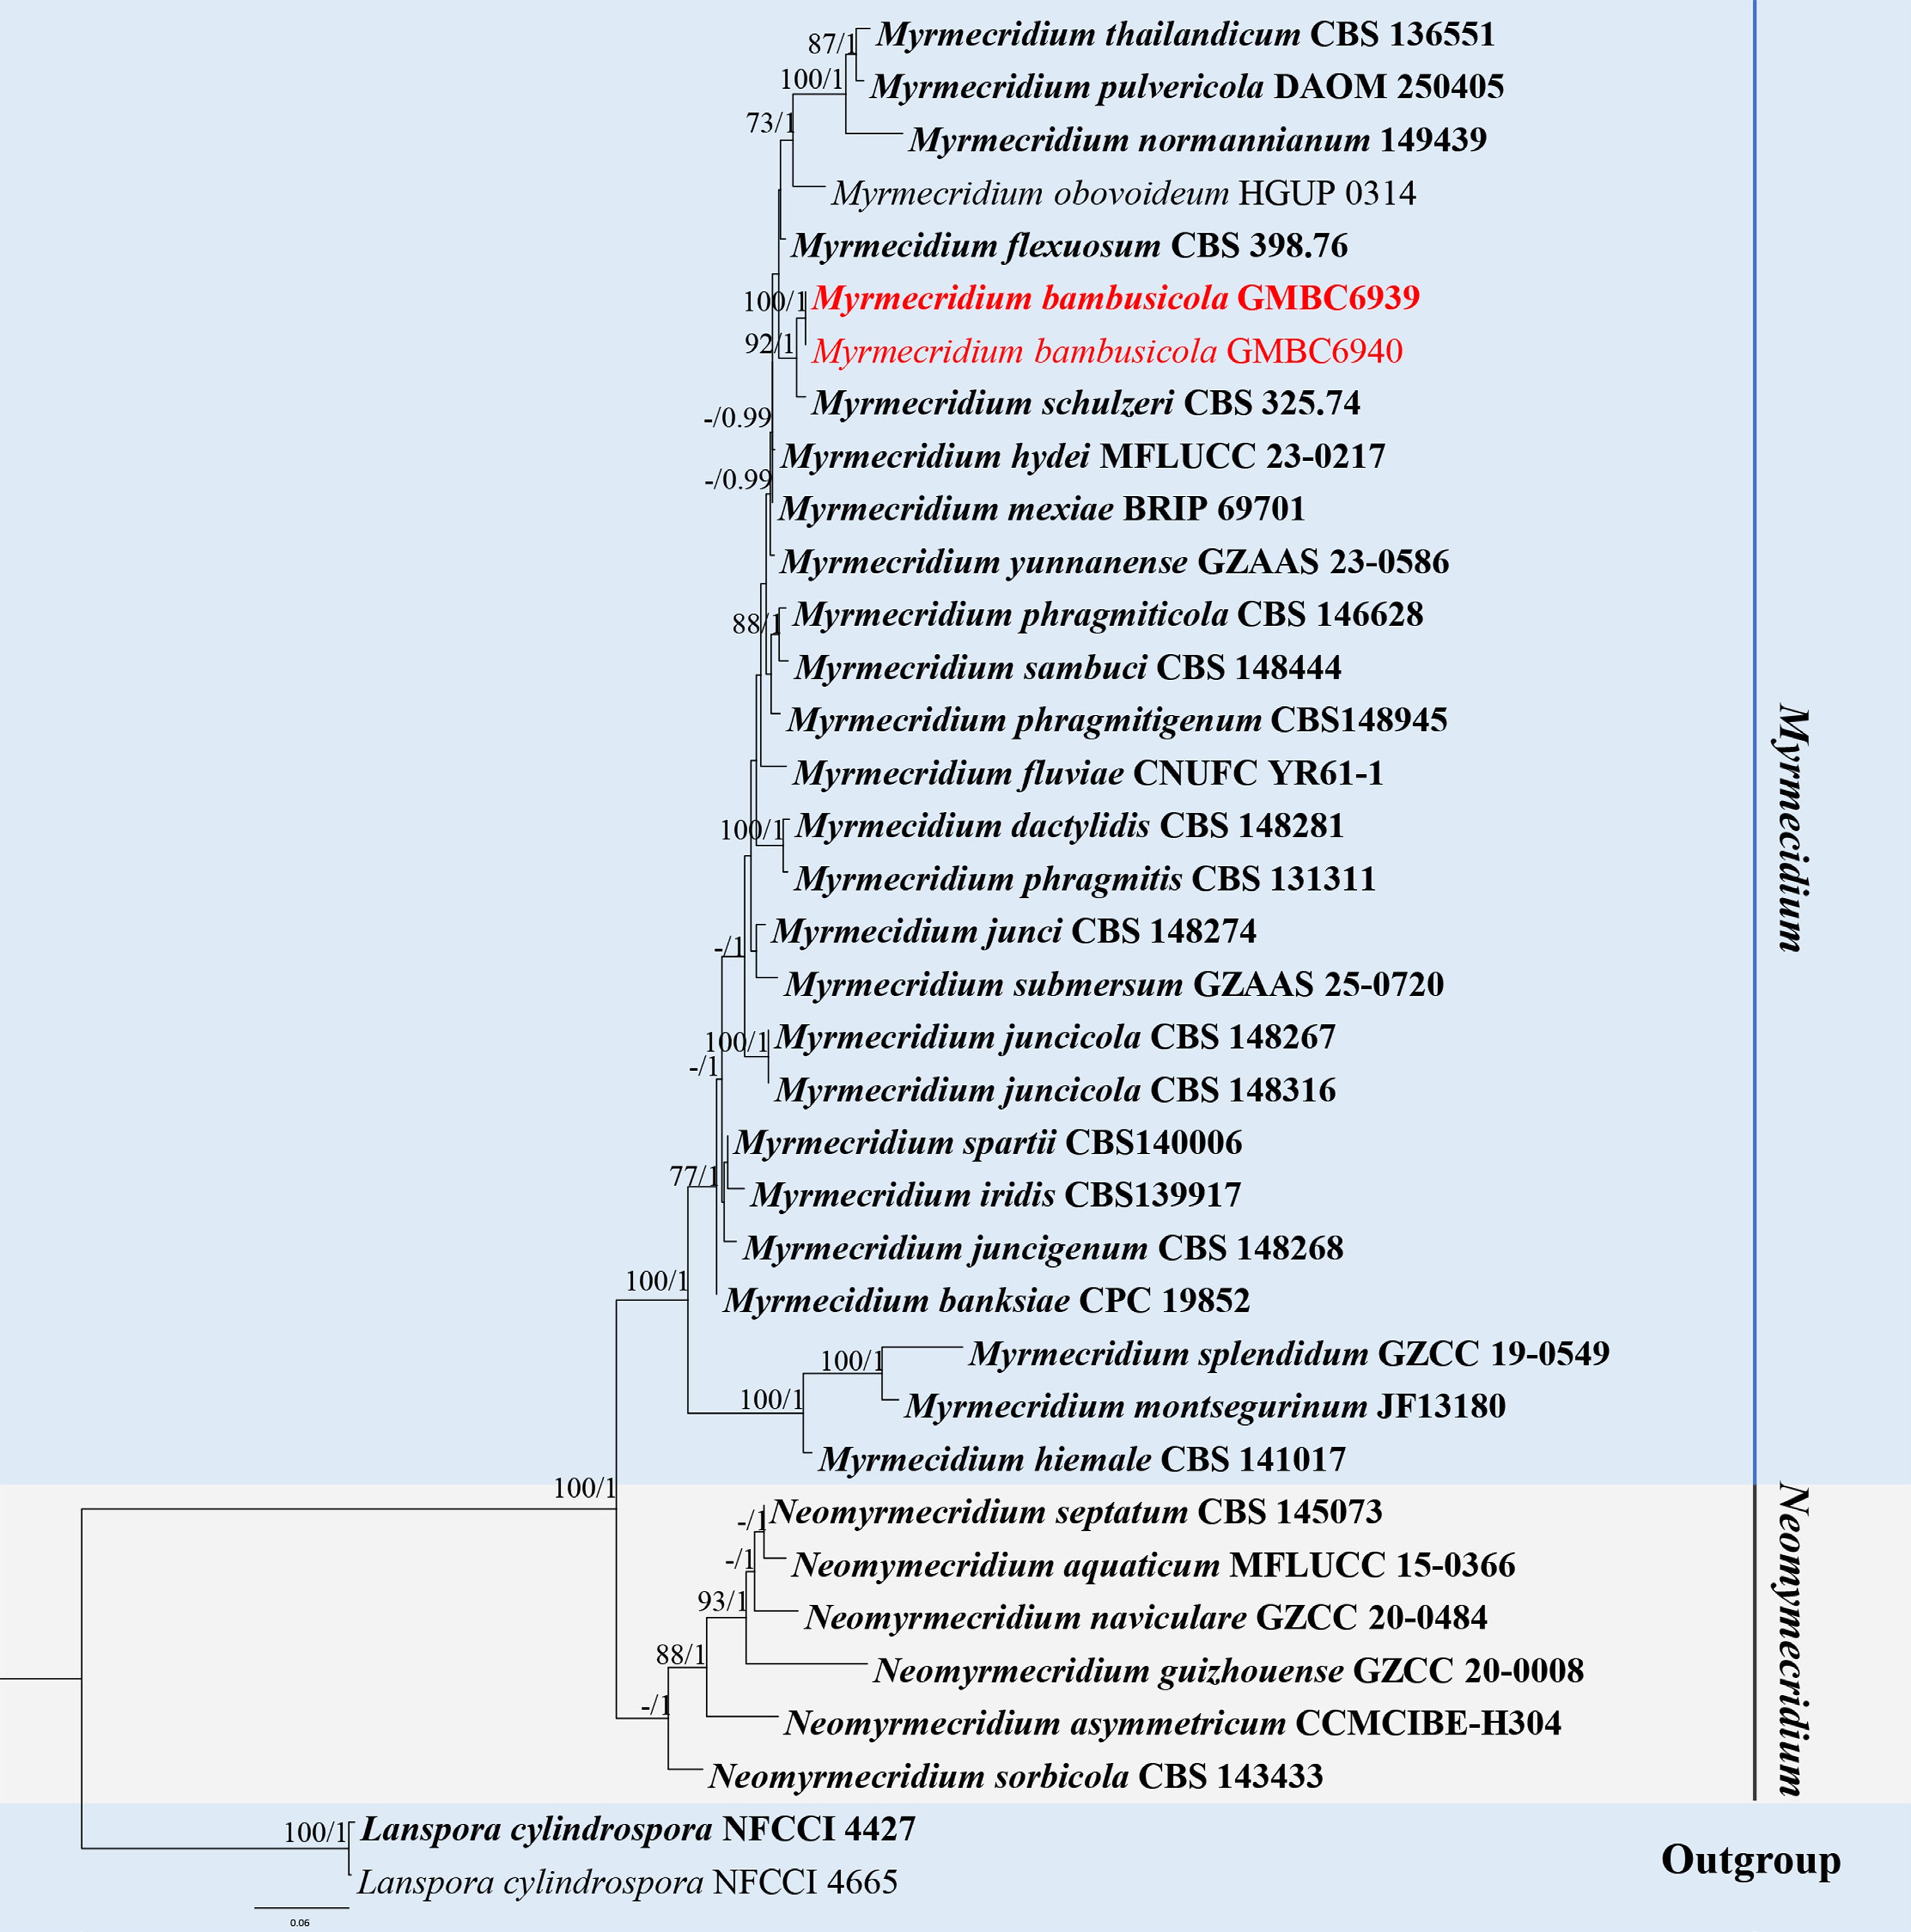
Figure 48.
ML tree of selected species of Myrmecridium and related genera inferred from a combined ITS-LSU dataset. The combined dataset comprised 36 taxa, 1,329 characters (ITS: 1–491 bp; LSU: 491–1,329 bp), including indel regions. Maximum likelihood (lnL = –6,247.180591) and Bayesian analyses produced consistent tree topologies. Lanspora cylindrospora (NFCCI 4427) and L. cylindrospora (NFCCI 4665) were selected as the outgroup taxa. Bayesian posterior probabilities (PP) ≥ 0.90 and RAxML bootstrap support values ≥ 70 % are shown on the branches. The novel species is indicated in red and ex-type/type strains in bold.
-
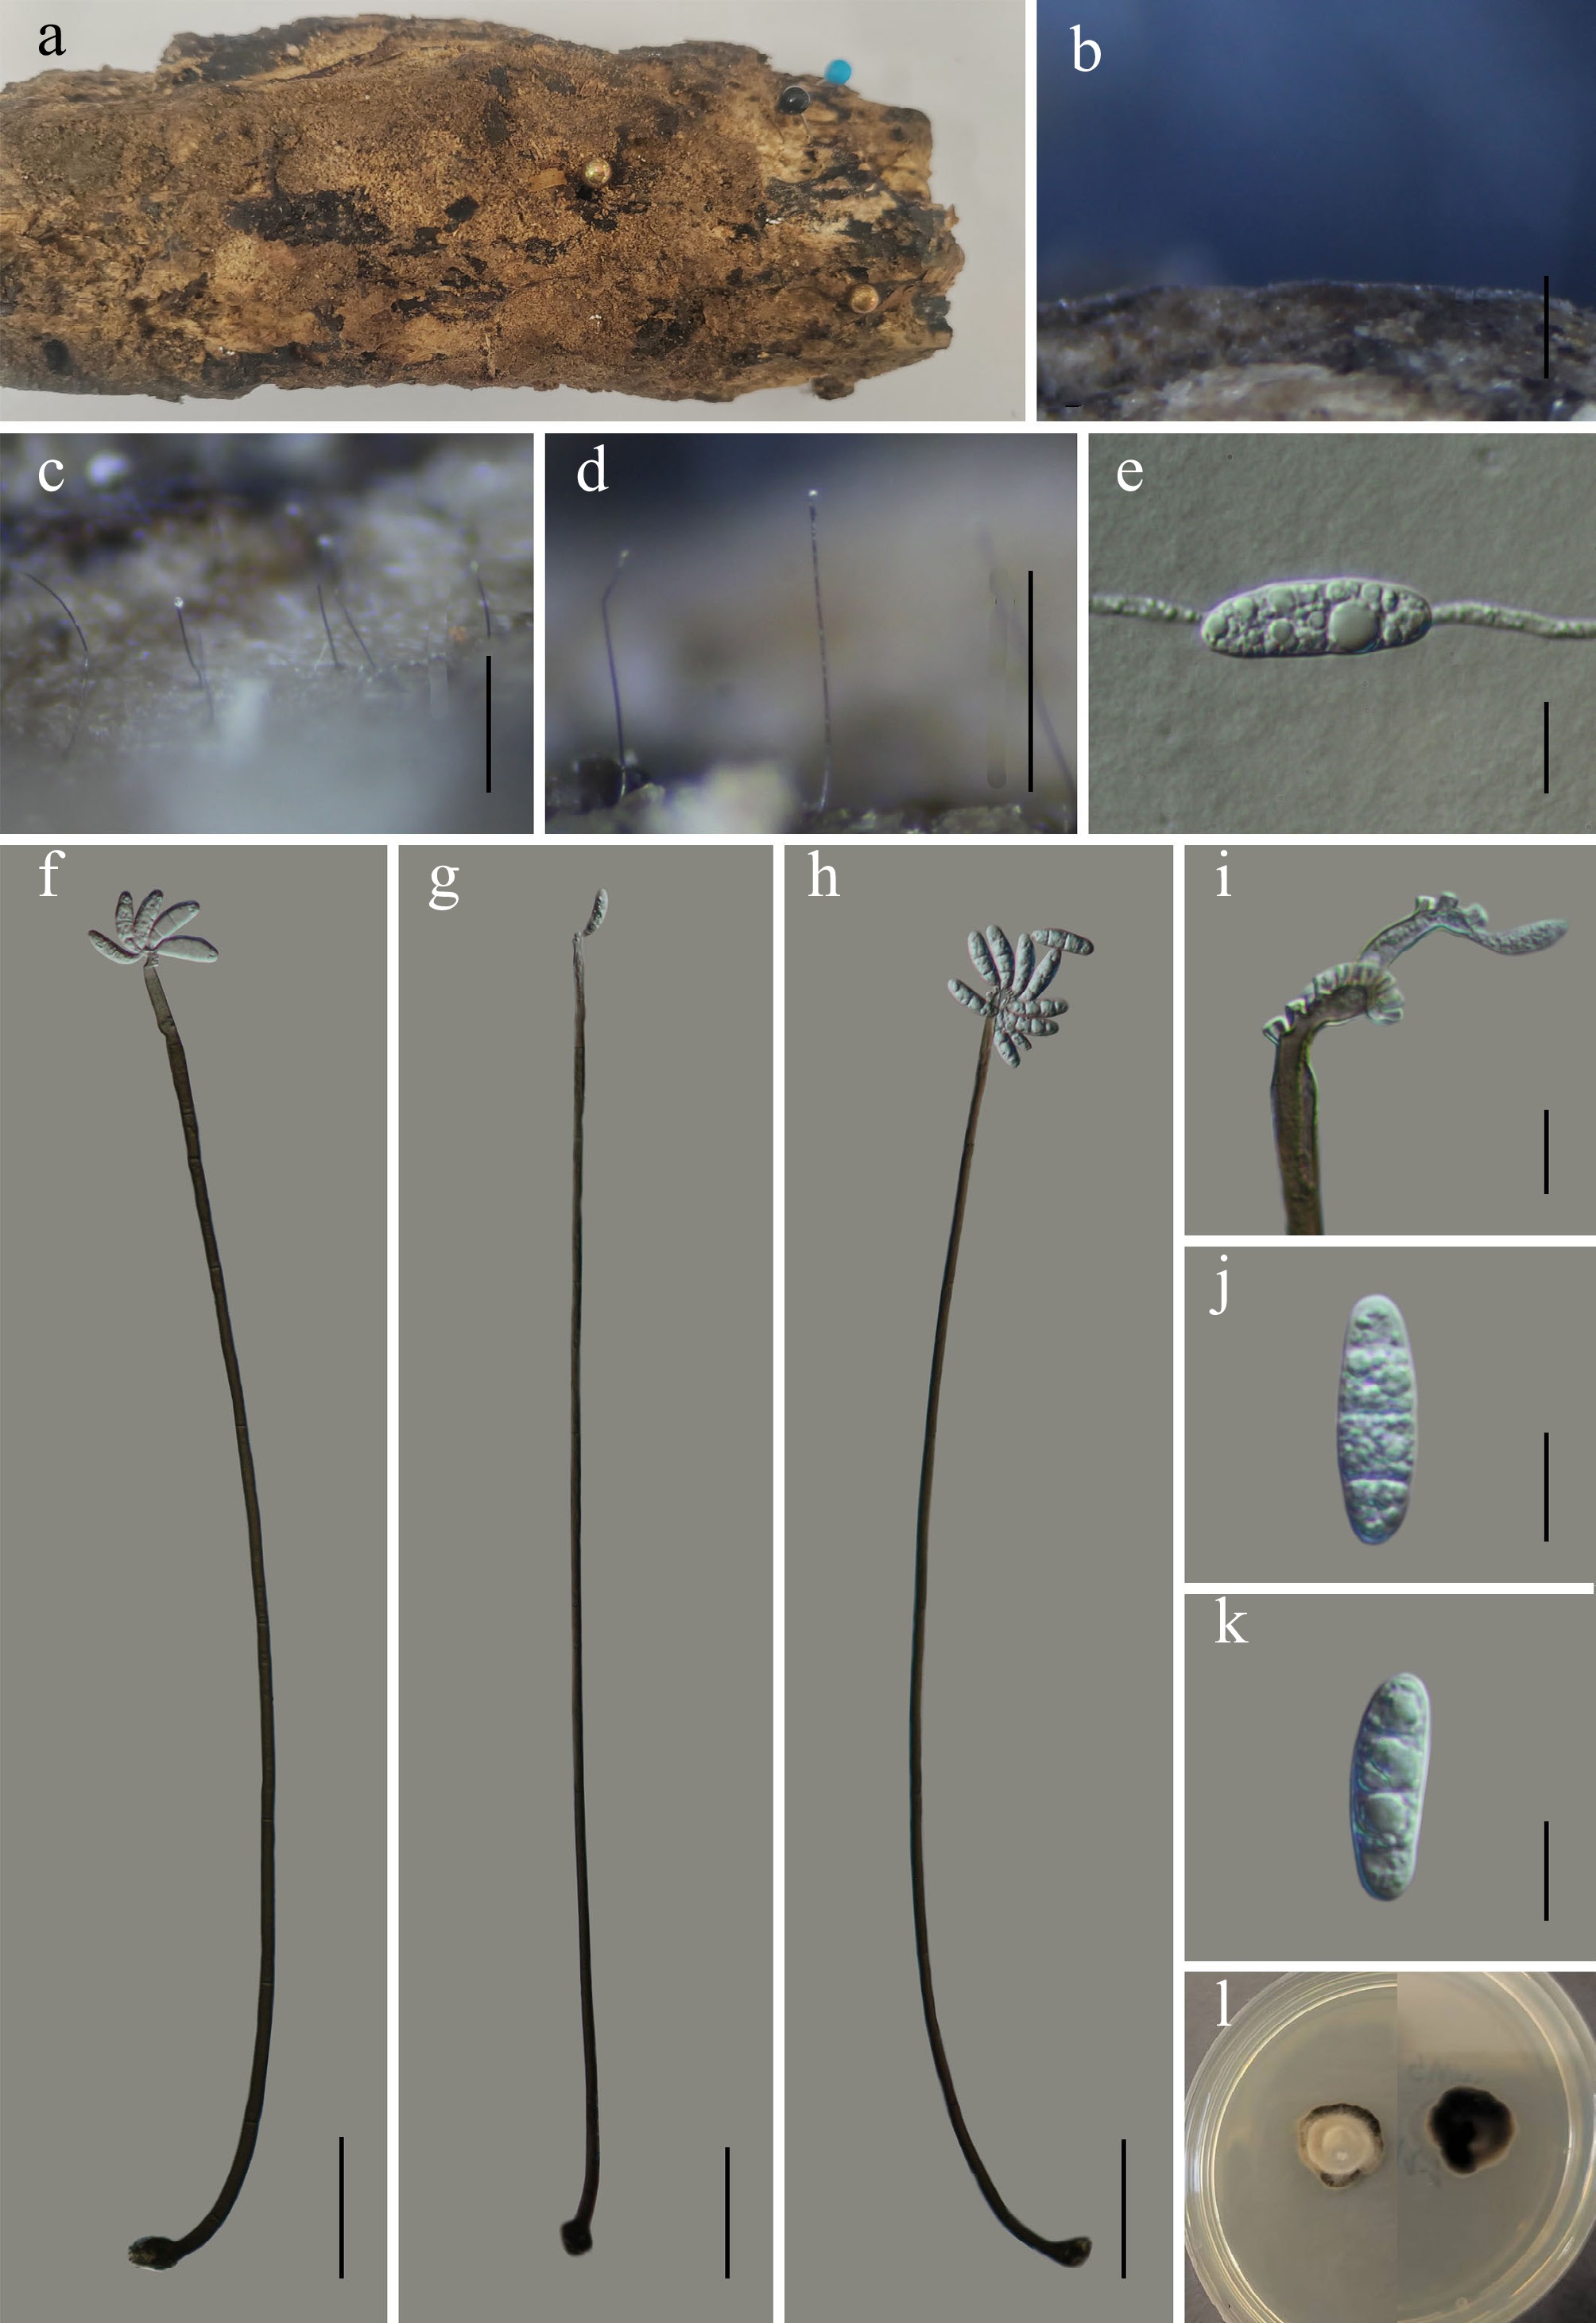
Figure 49.
Pleurothecium longisetosum (GMB6937 holotype). (a) Host. (b)–(d) Colonies on natural substrate. (e) Germinating conidium. (f)–(h) Conidiophores and conidia. (i) Conidiogenous cells. (j), (k) Conidia. (l) Surface and reverse view of culture on PDA. Scale bars: b = 1 mm, c, d = 0.5 mm, f–h = 50 μm, e, i–k = 10 μm.
-
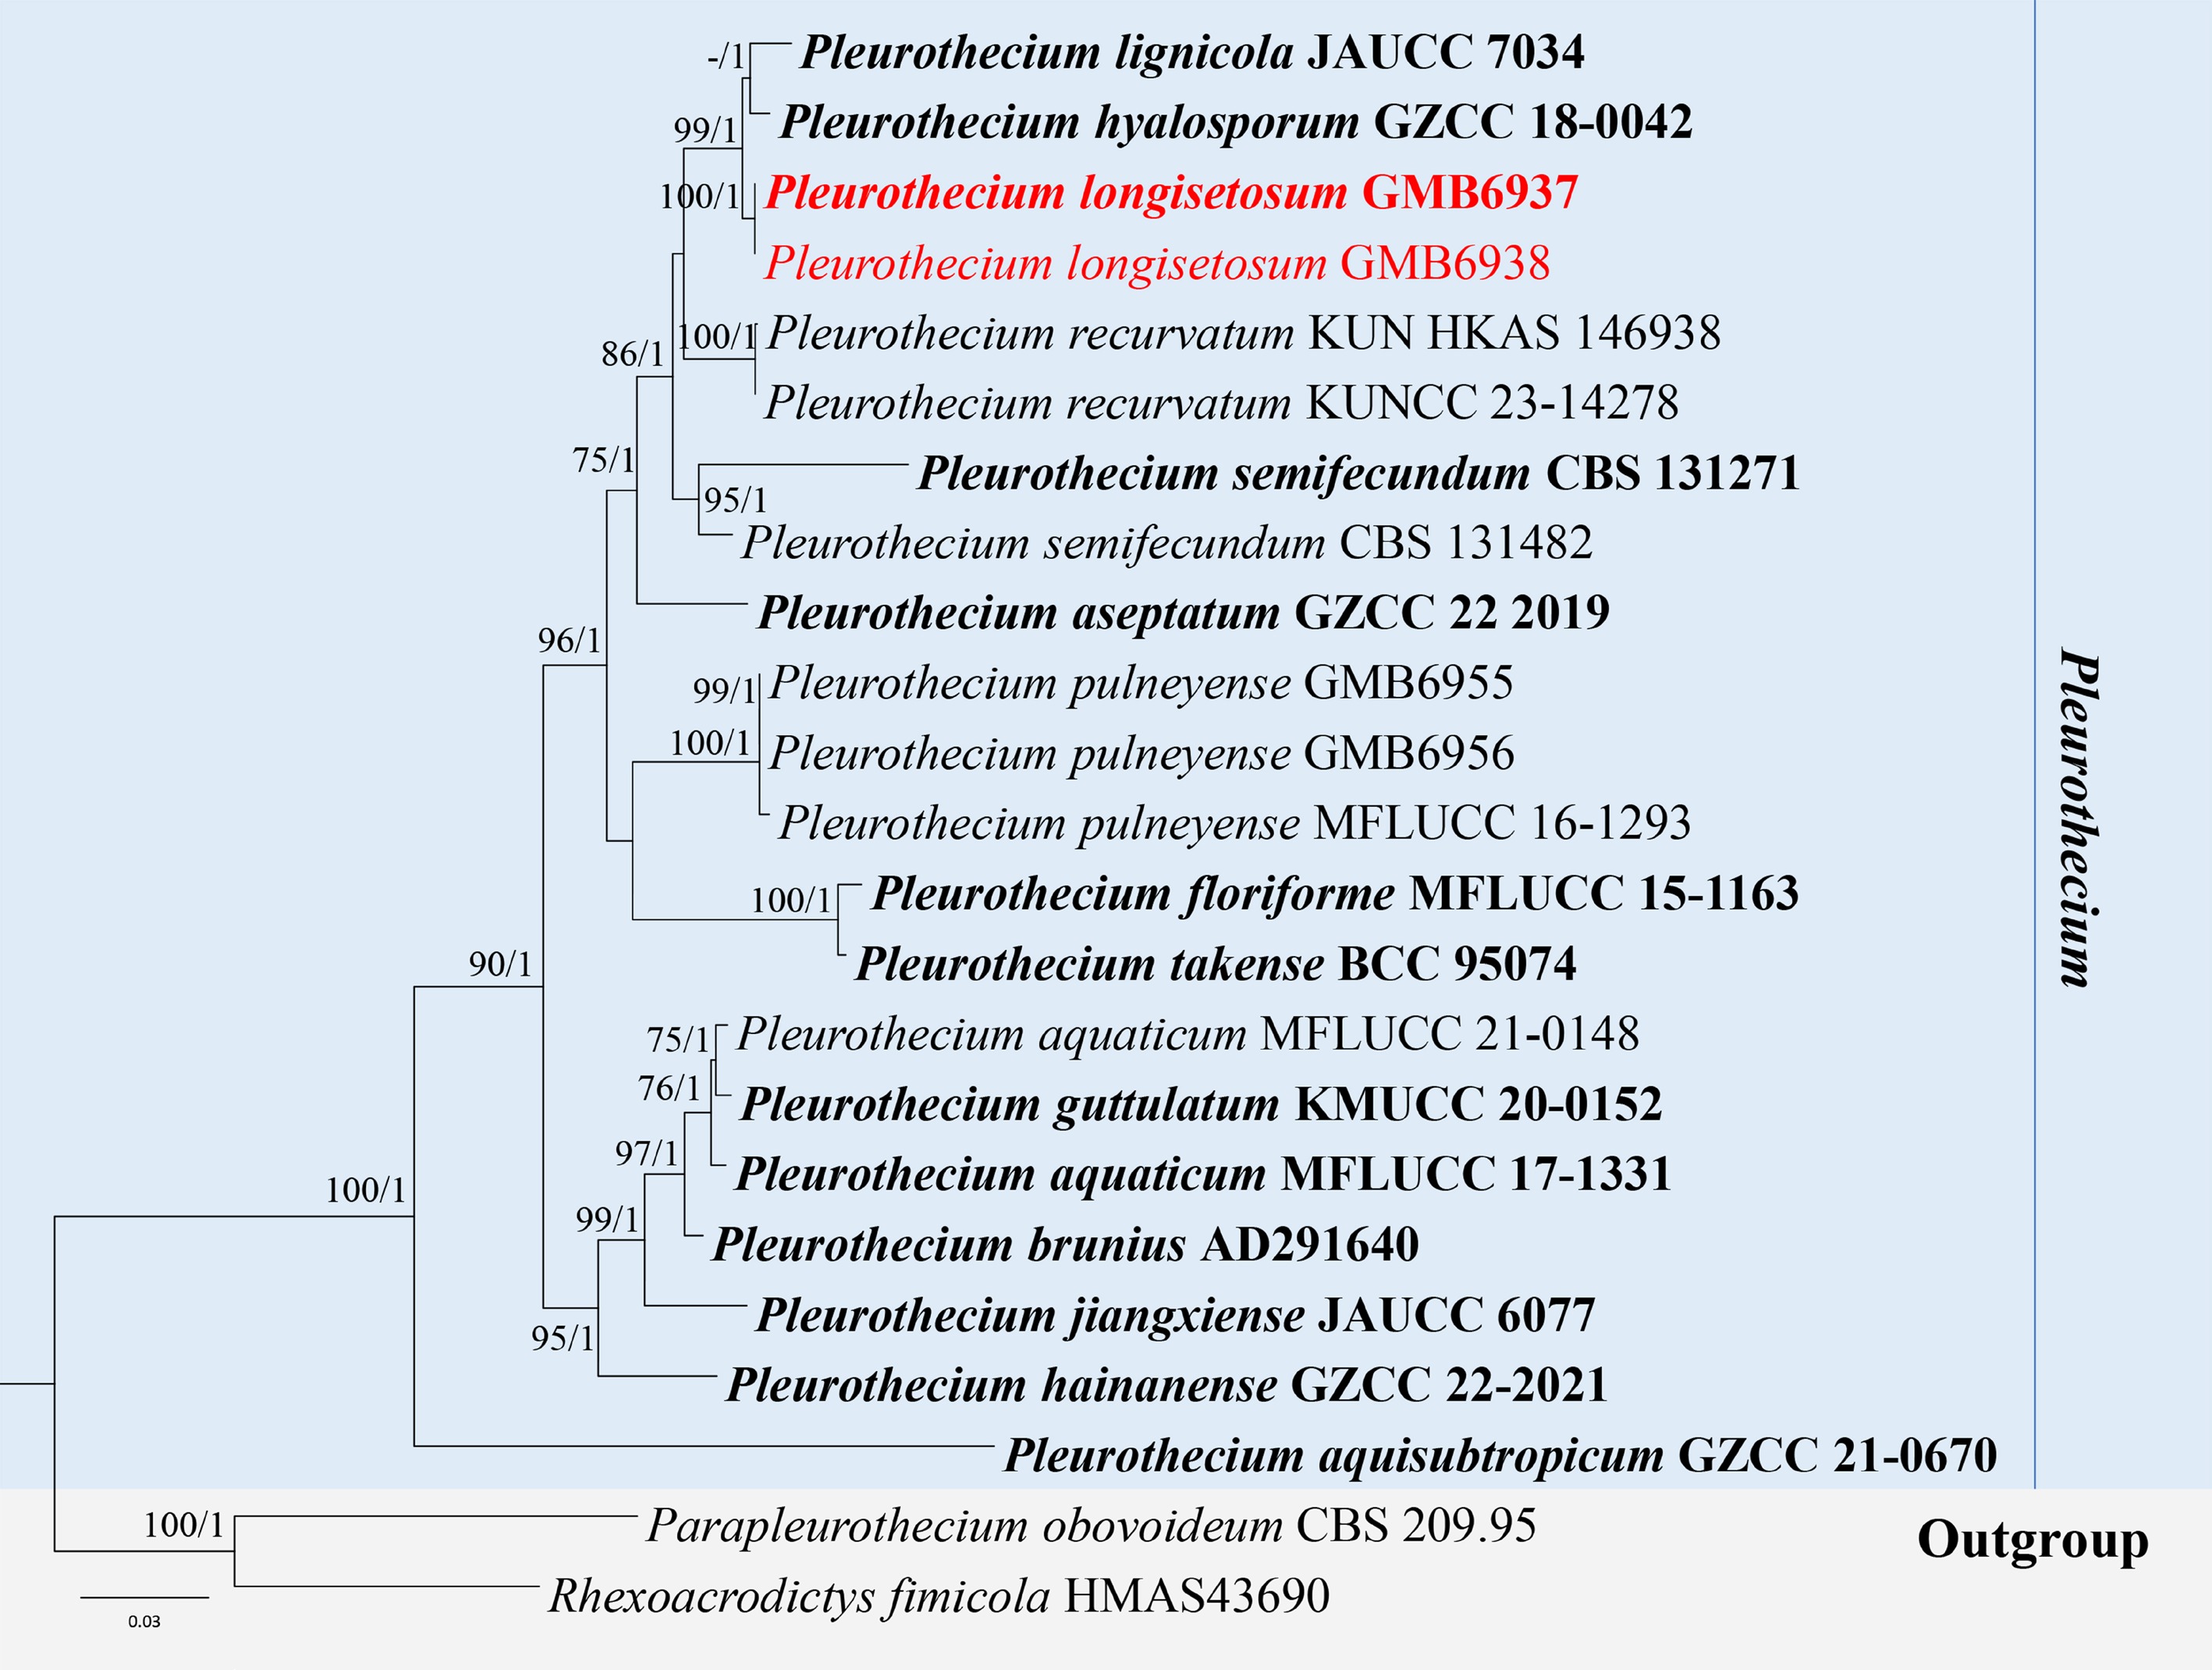
Figure 50.
ML tree of selected Pleurothecium species based on the ITS-LSU-SSU dataset. The combined dataset comprised 23 taxa, 2,442 characters (ITS: 1–555 bp; LSU: 556–1,425 bp; SSU: 1,426–2,442 bp), including indel regions. Maximum likelihood (lnL = –8,244.303005) and Bayesian analyses produced consistent tree topologies. Parapleurothecium obovoideum (CBS 209.95) and Rhexoacrodictys fimicola (HMAS43690) were selected as the outgroup taxa. Bayesian posterior probabilities (PP) ≥ 0.90 and RAxML bootstrap support values ≥ 70 % are shown on the branches. The novel species is indicated in red and ex-type/type strains in bold.
-
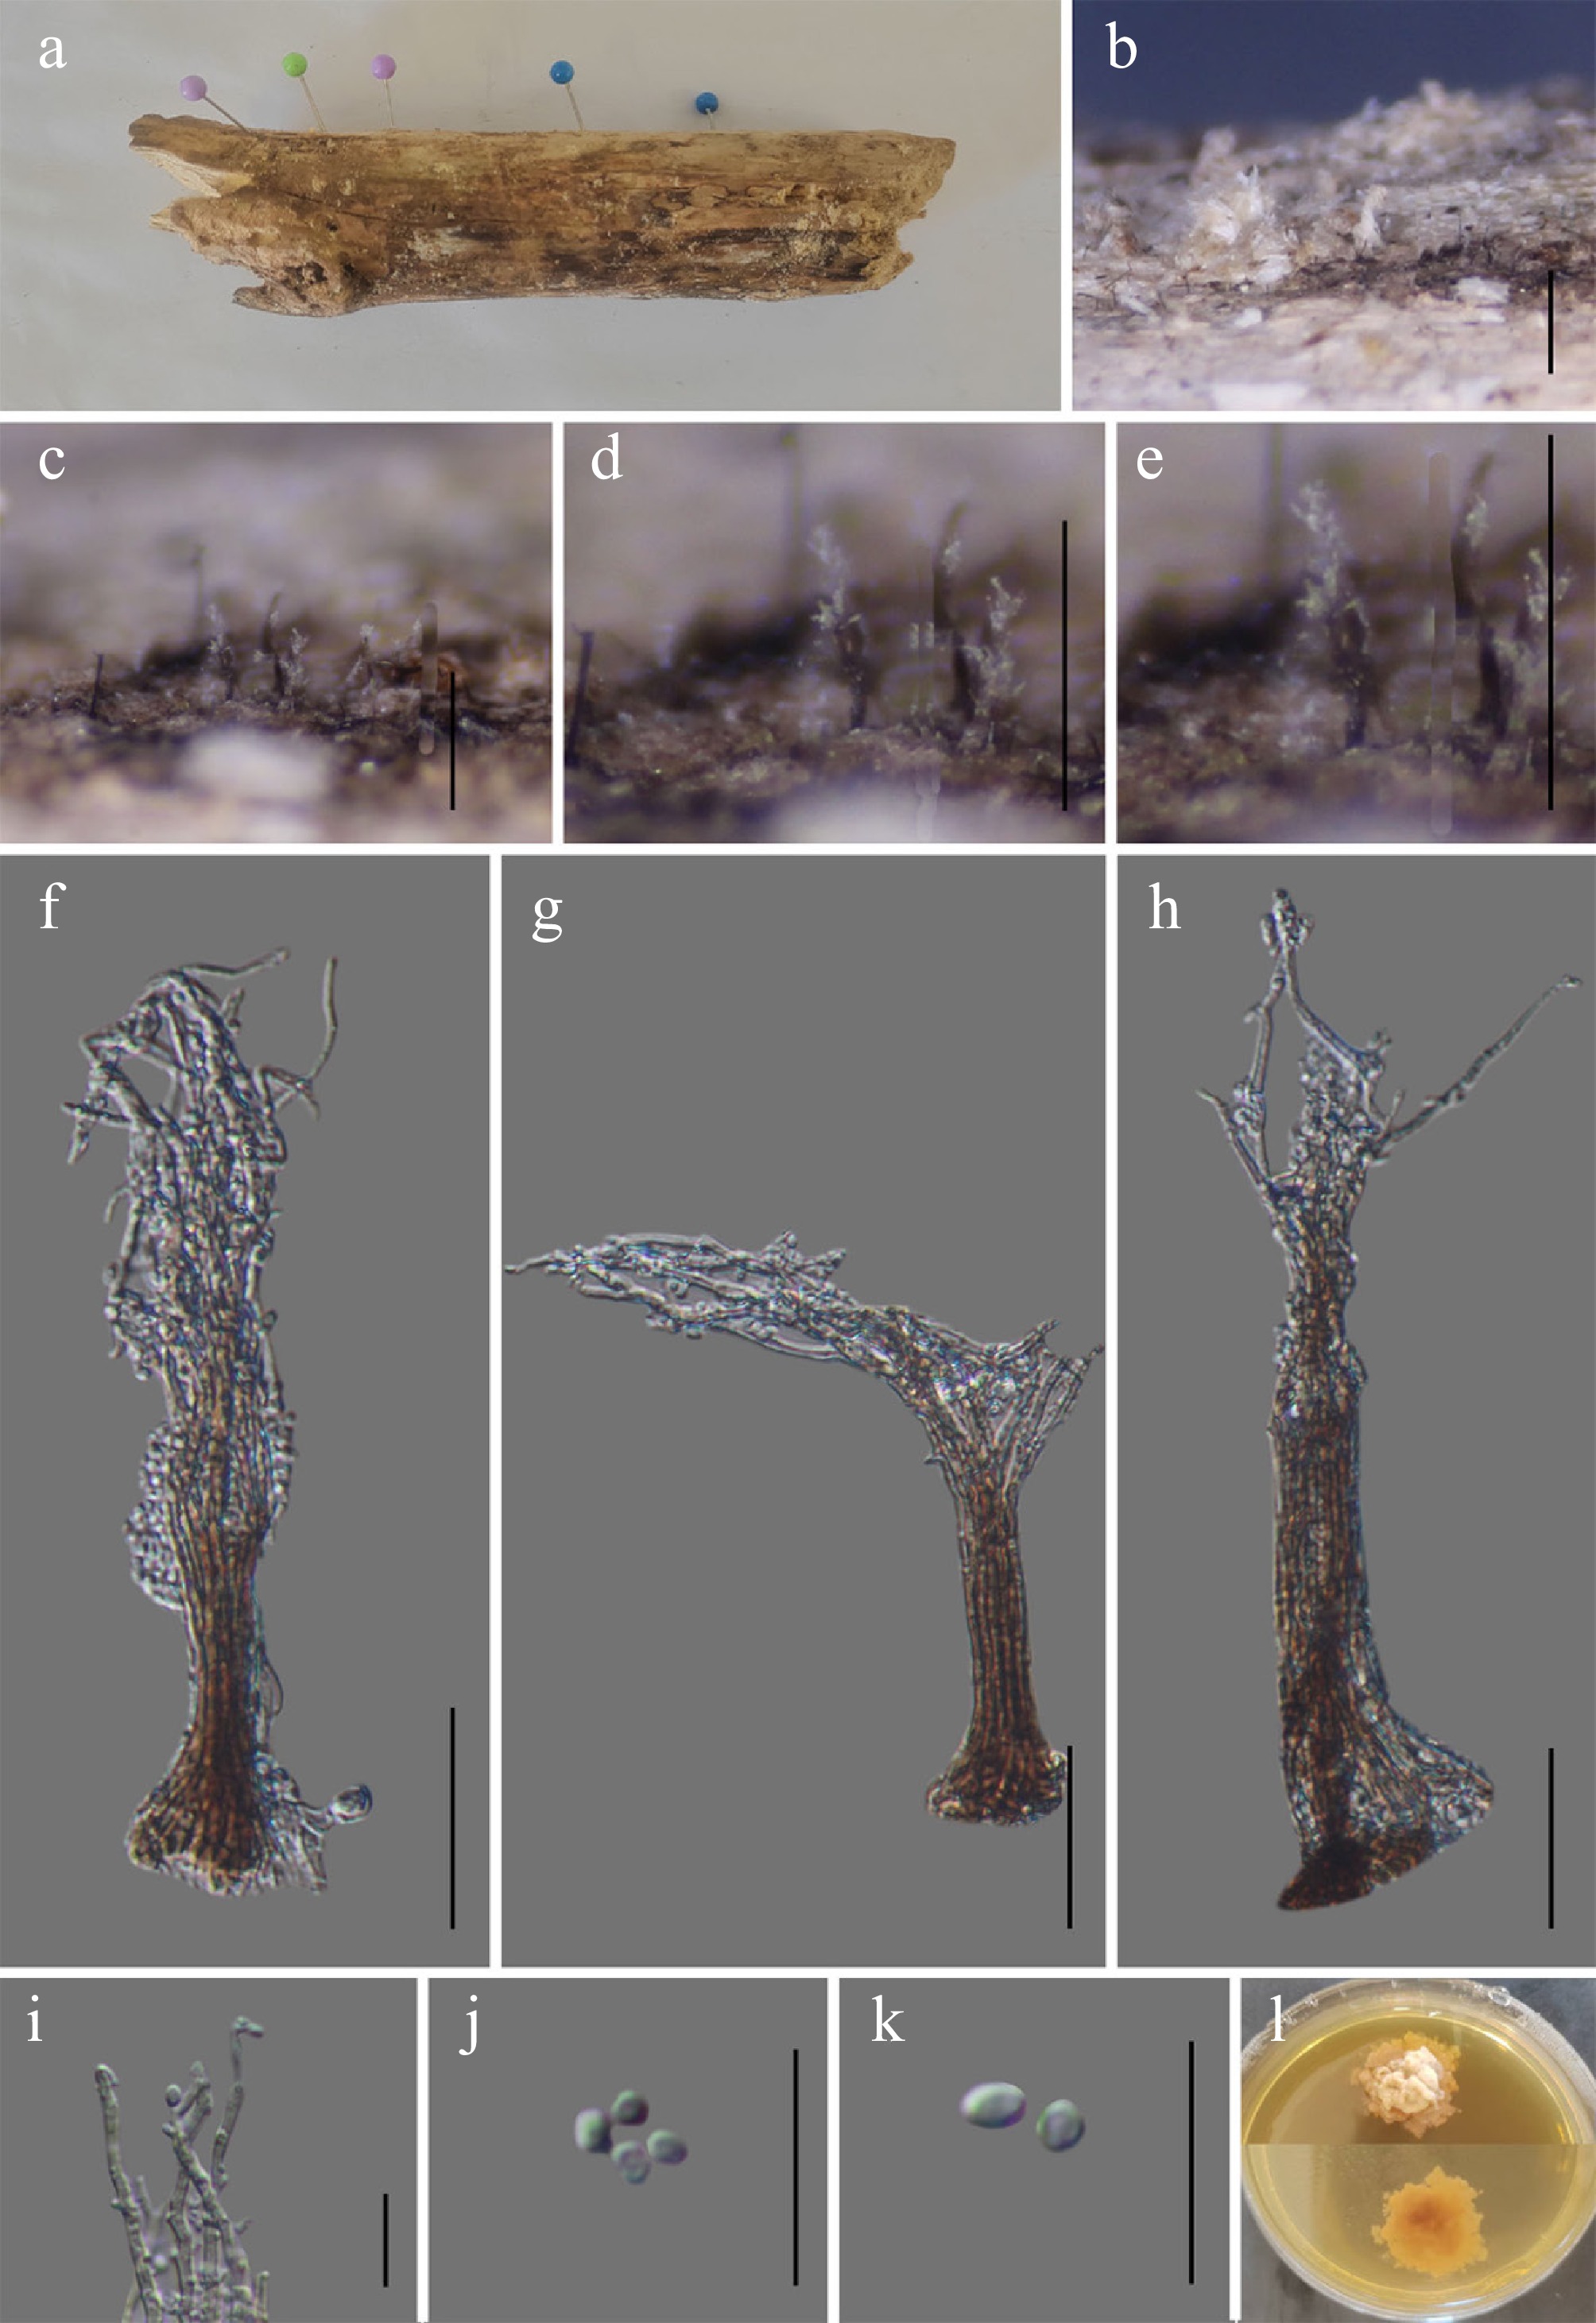
Figure 51.
Rhamphoriopsis flabelliformis (GMB6923 holotype). (a) Host. (b)–(e) Colonies on natural substrate. (f)–(h) Conidiophores and conidia. (i) Conidiogenous cells. (j), (k) Conidia. (l) Surface and reverse view of culture on PDA. Scale bars: b = 1 mm, c, d = 0.5 mm, f–h = 30 μm, i–k = 10 μm.
-
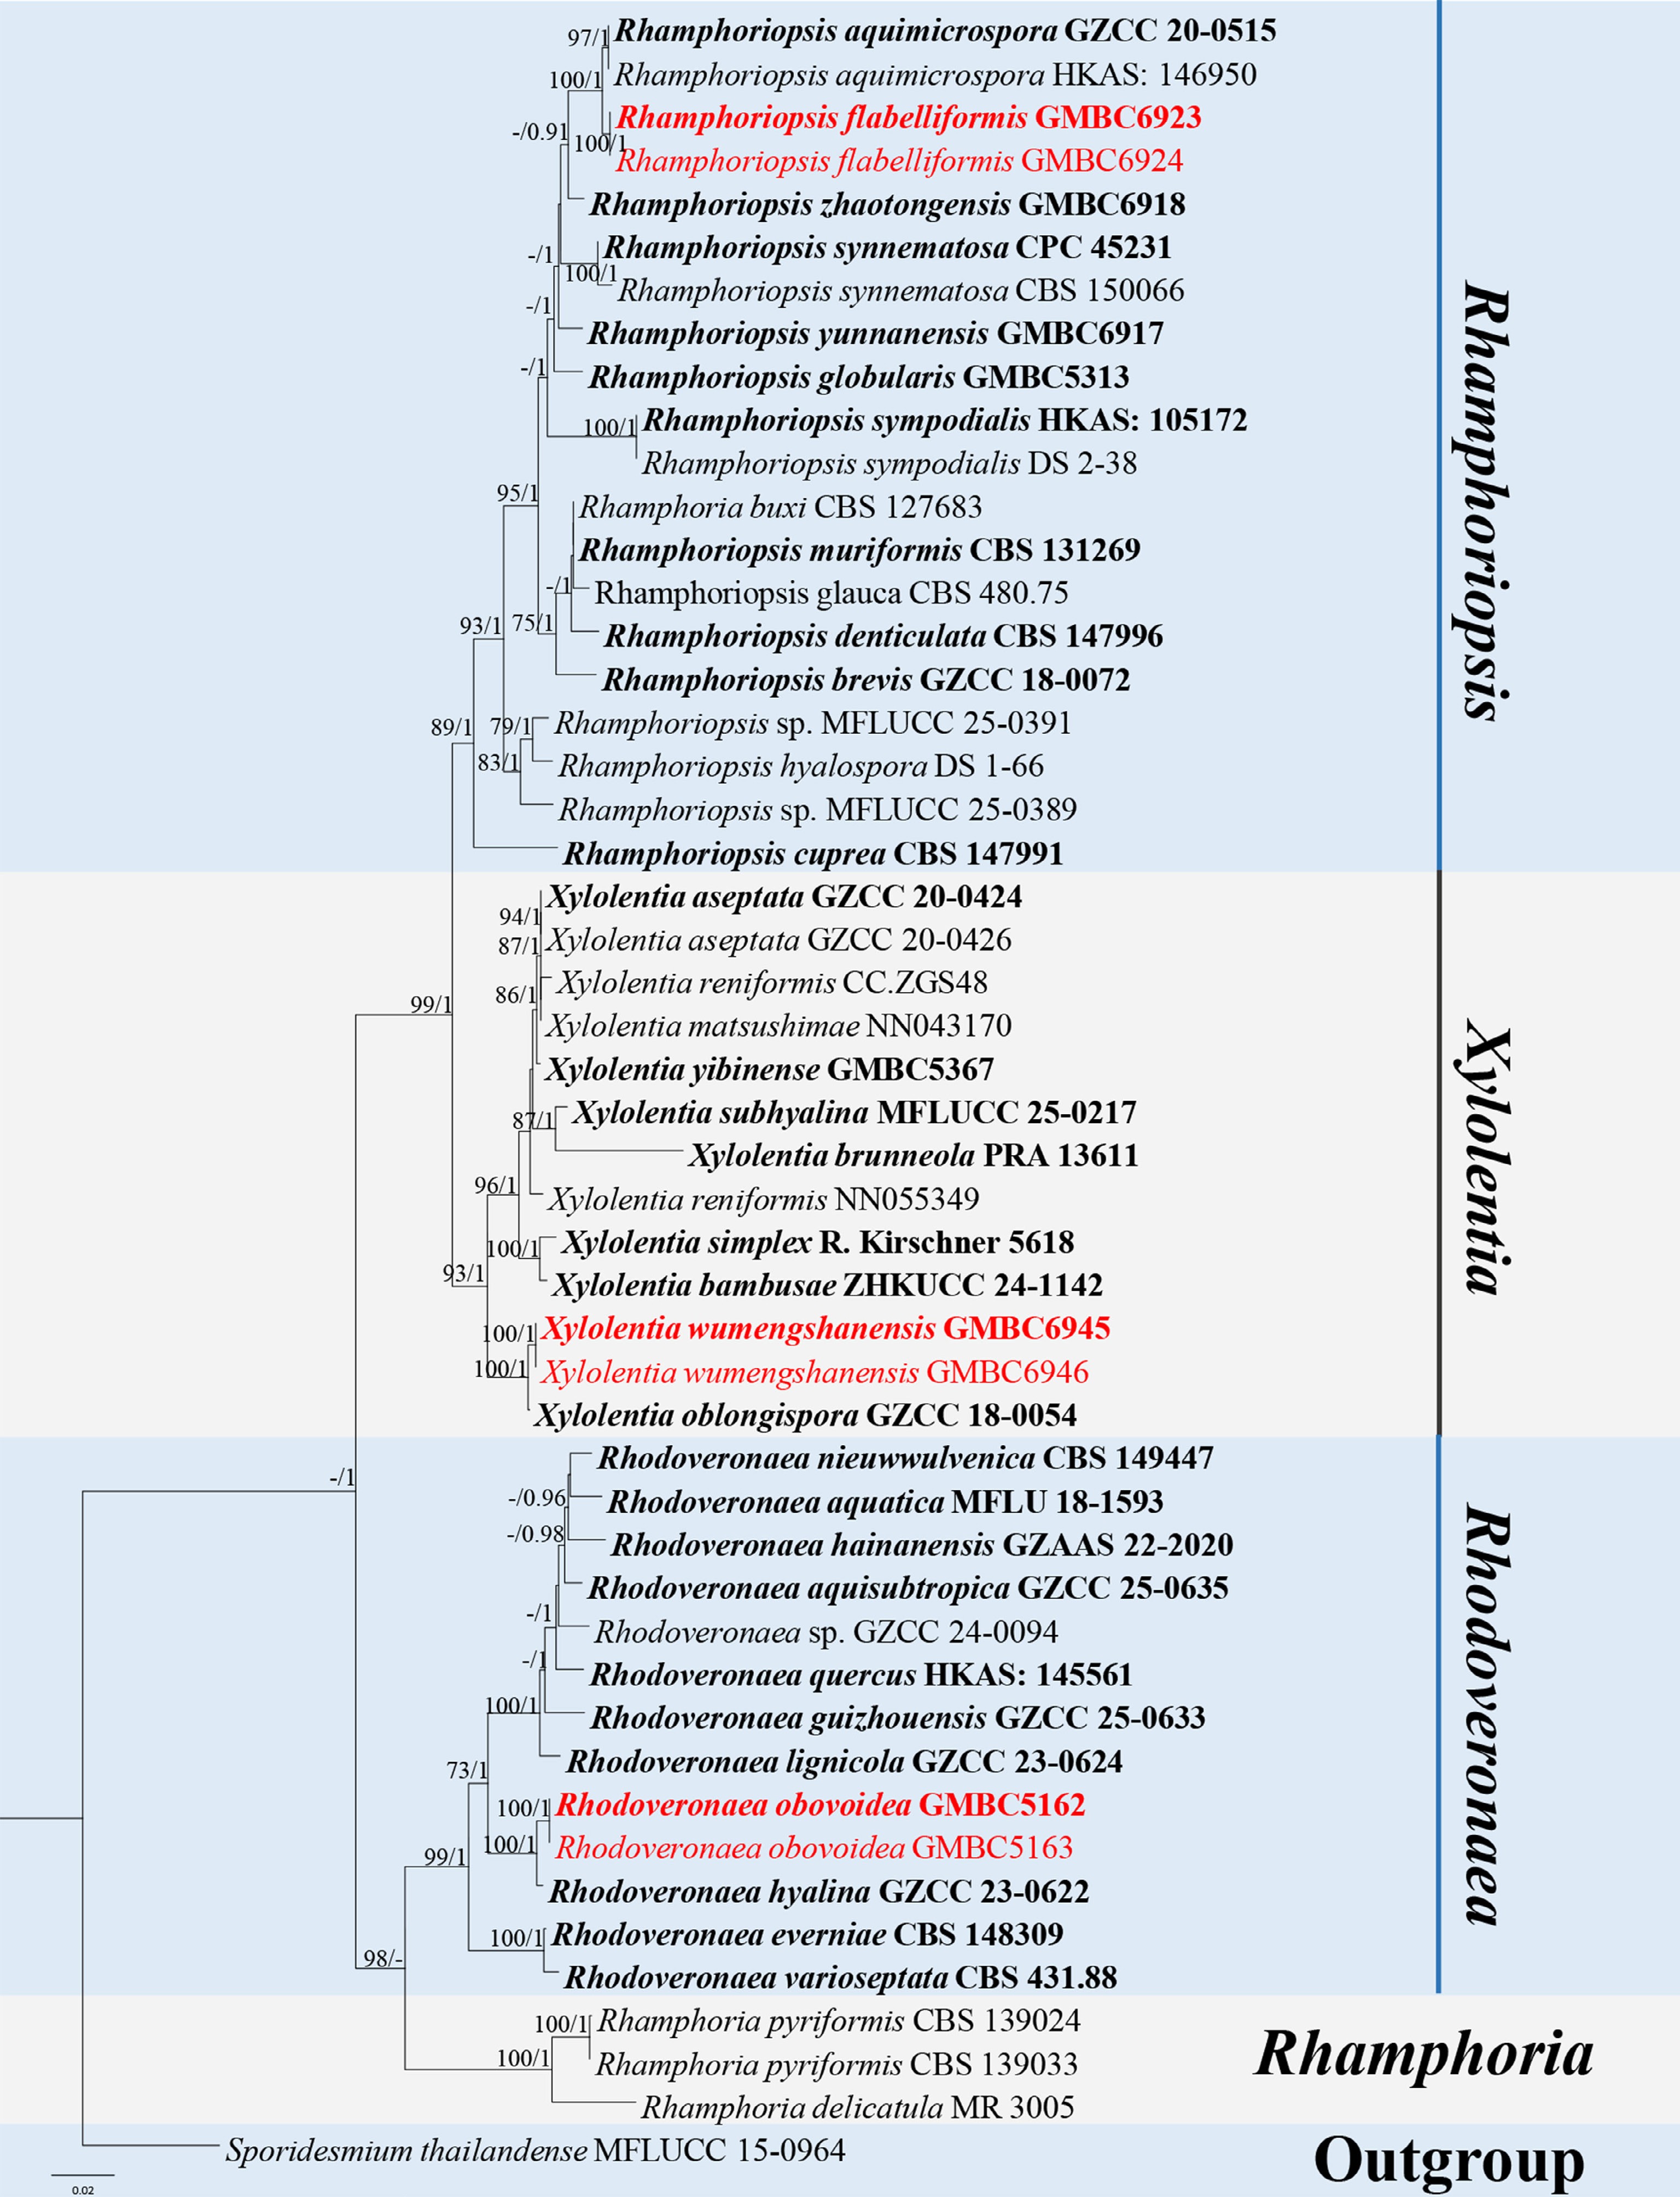
Figure 52.
ML tree of selected Rhamphoriaceae species based on the ITS-LSU-SSU dataset. The combined dataset comprised 50 taxa, 2,373 characters (ITS: 1–512 bp; LSU: 513–1,372 bp; SSU: 1,373–2,373 bp), including indel regions. Maximum likelihood (lnL = –9,769.852619) and Bayesian analyses produced consistent tree topologies. Sporidesmium thailandense (MFLUCC 15-0964) was selected as the outgroup taxon. Bayesian posterior probabilities (PP) ≥ 0.90 and RAxML bootstrap support values ≥ 70 % are shown on the branches. The novel species are indicated in red and ex-type/type strains in bold.
-
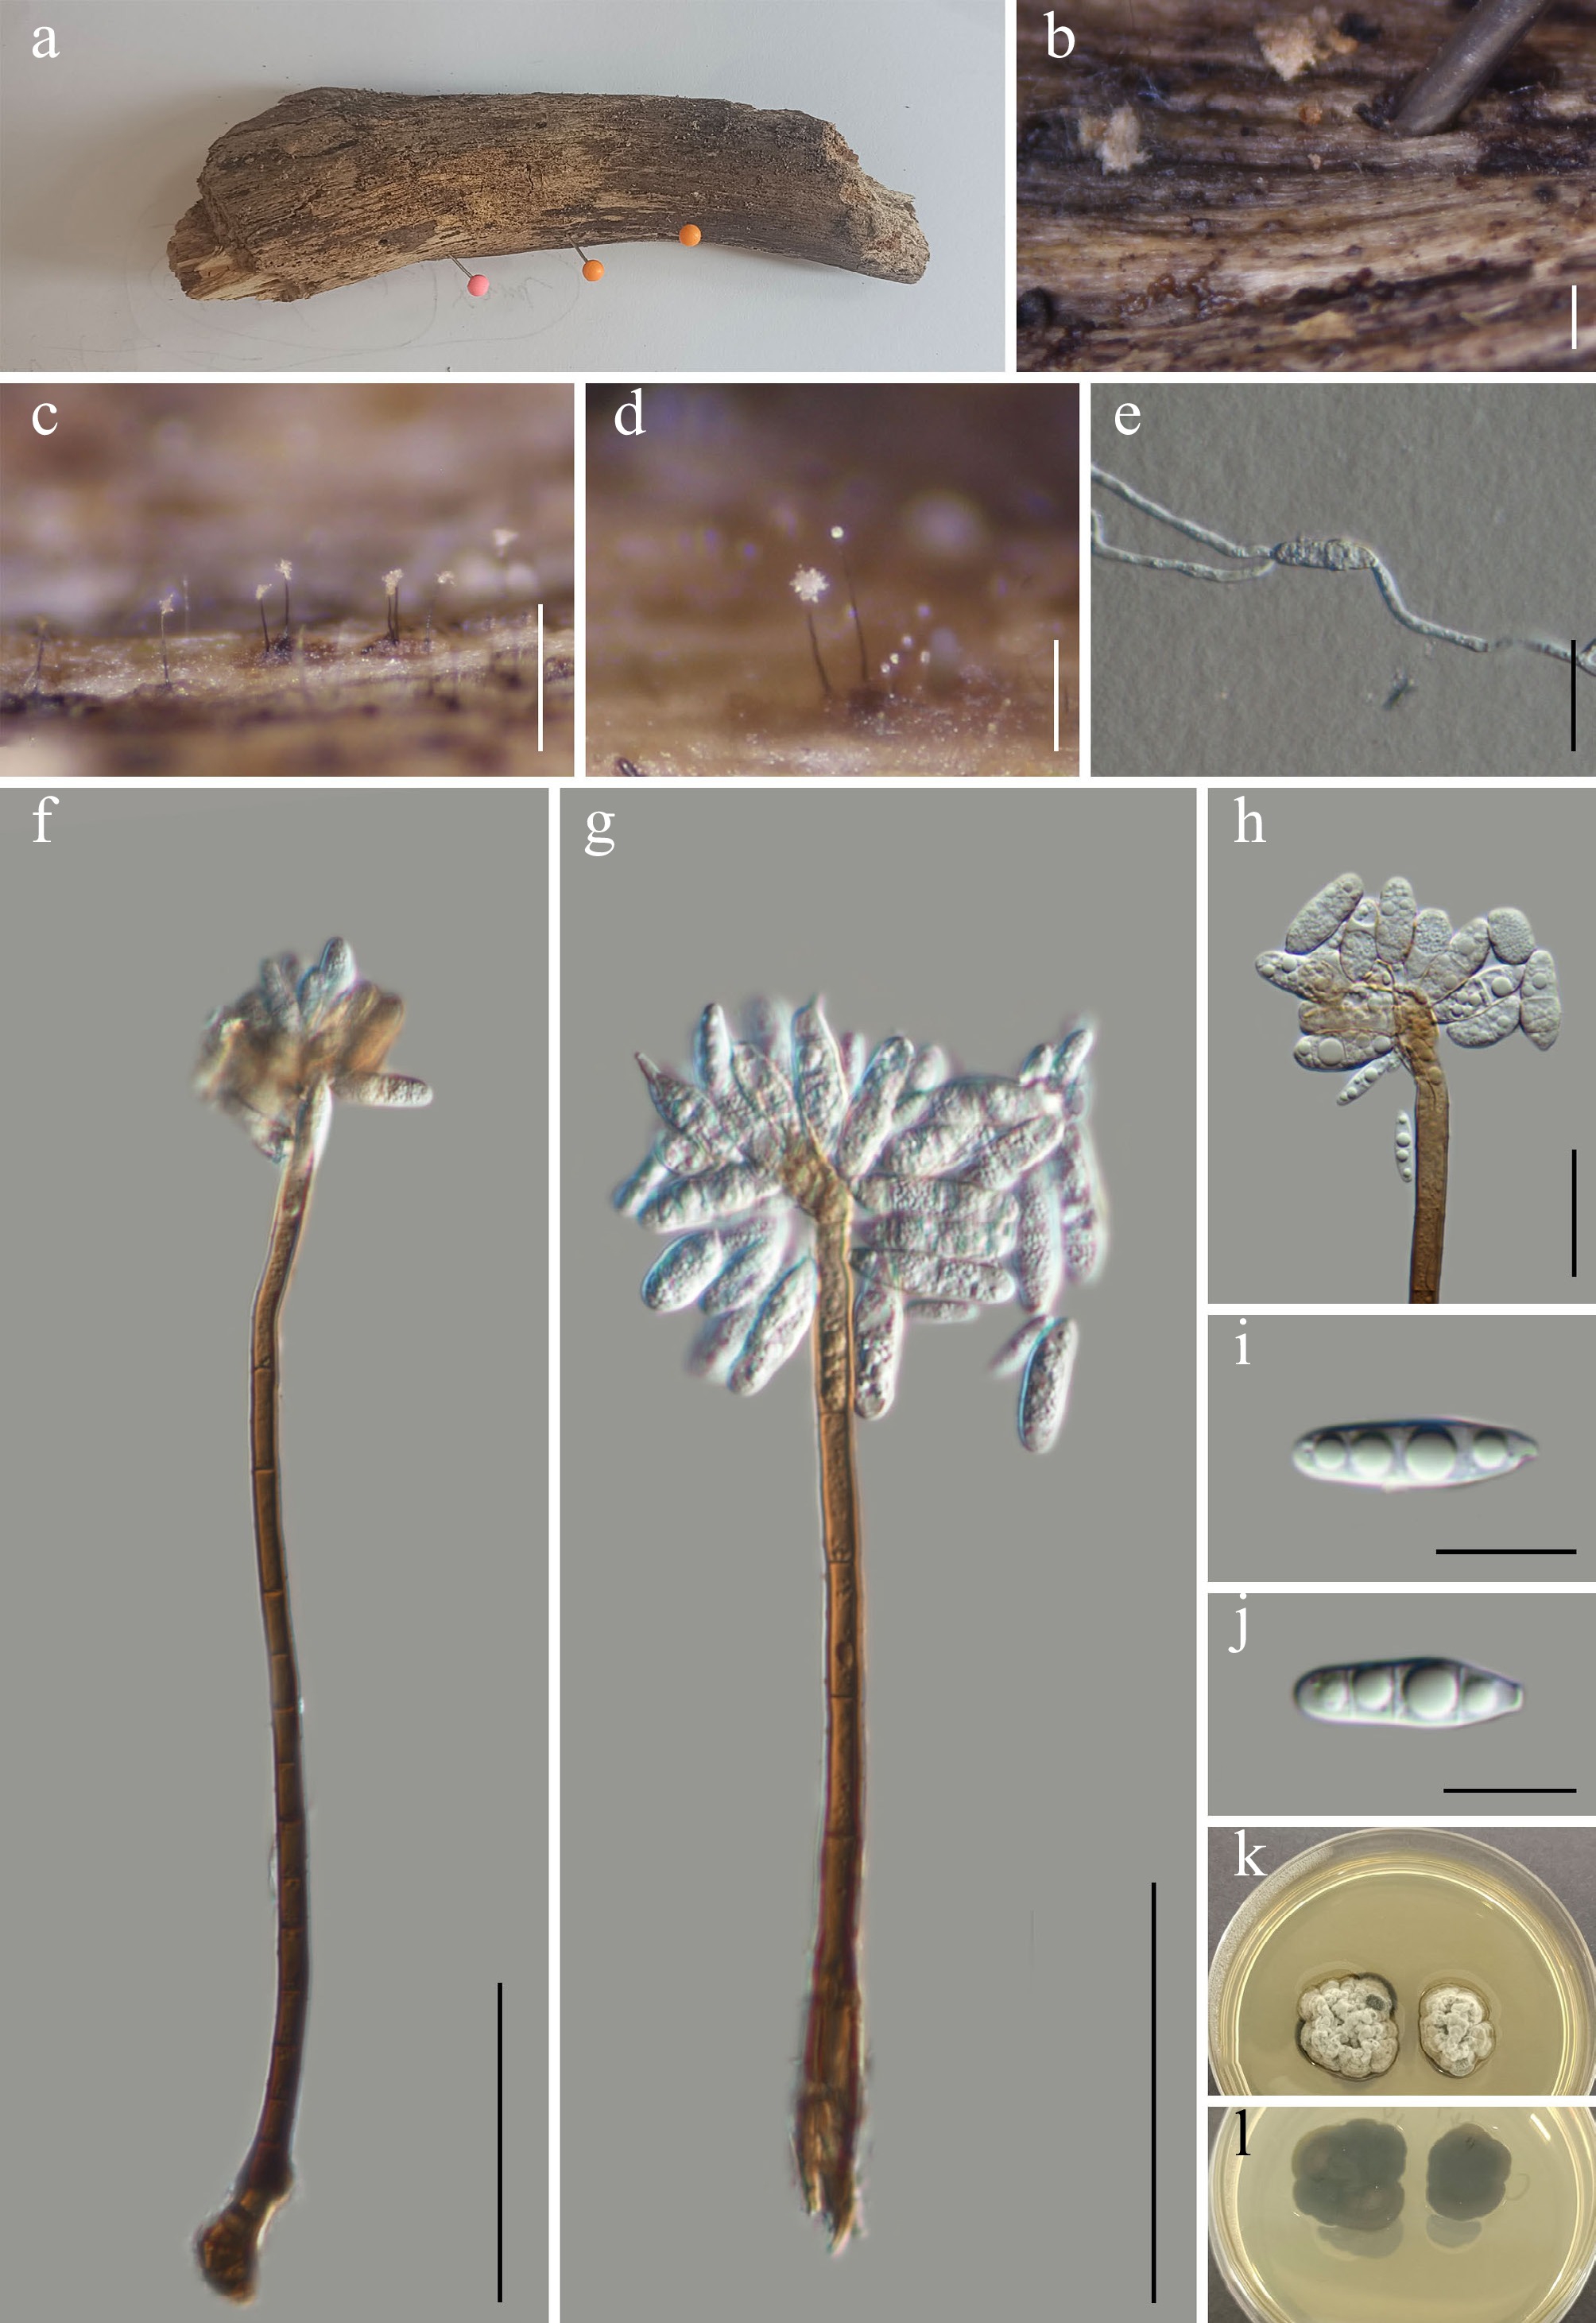
Figure 53.
Rhodoveronaea obovoidea (GMB5162 holotype). (a) Host. (b)–(d) Colonies on natural substrate. (e) Germinating conidium. (f), (g) Conidiophores and conidia. (h) Conidiogenous cells and conidia. (i), (j) Conidia. (k), (l) Surface and reverse view of culture on PDA. Scale bars: b = 1 mm, c = 0.5 mm, d = 0.2 mm, f, g = 50 μm, e, h = 20 μm, i, j = 10 μm.
-
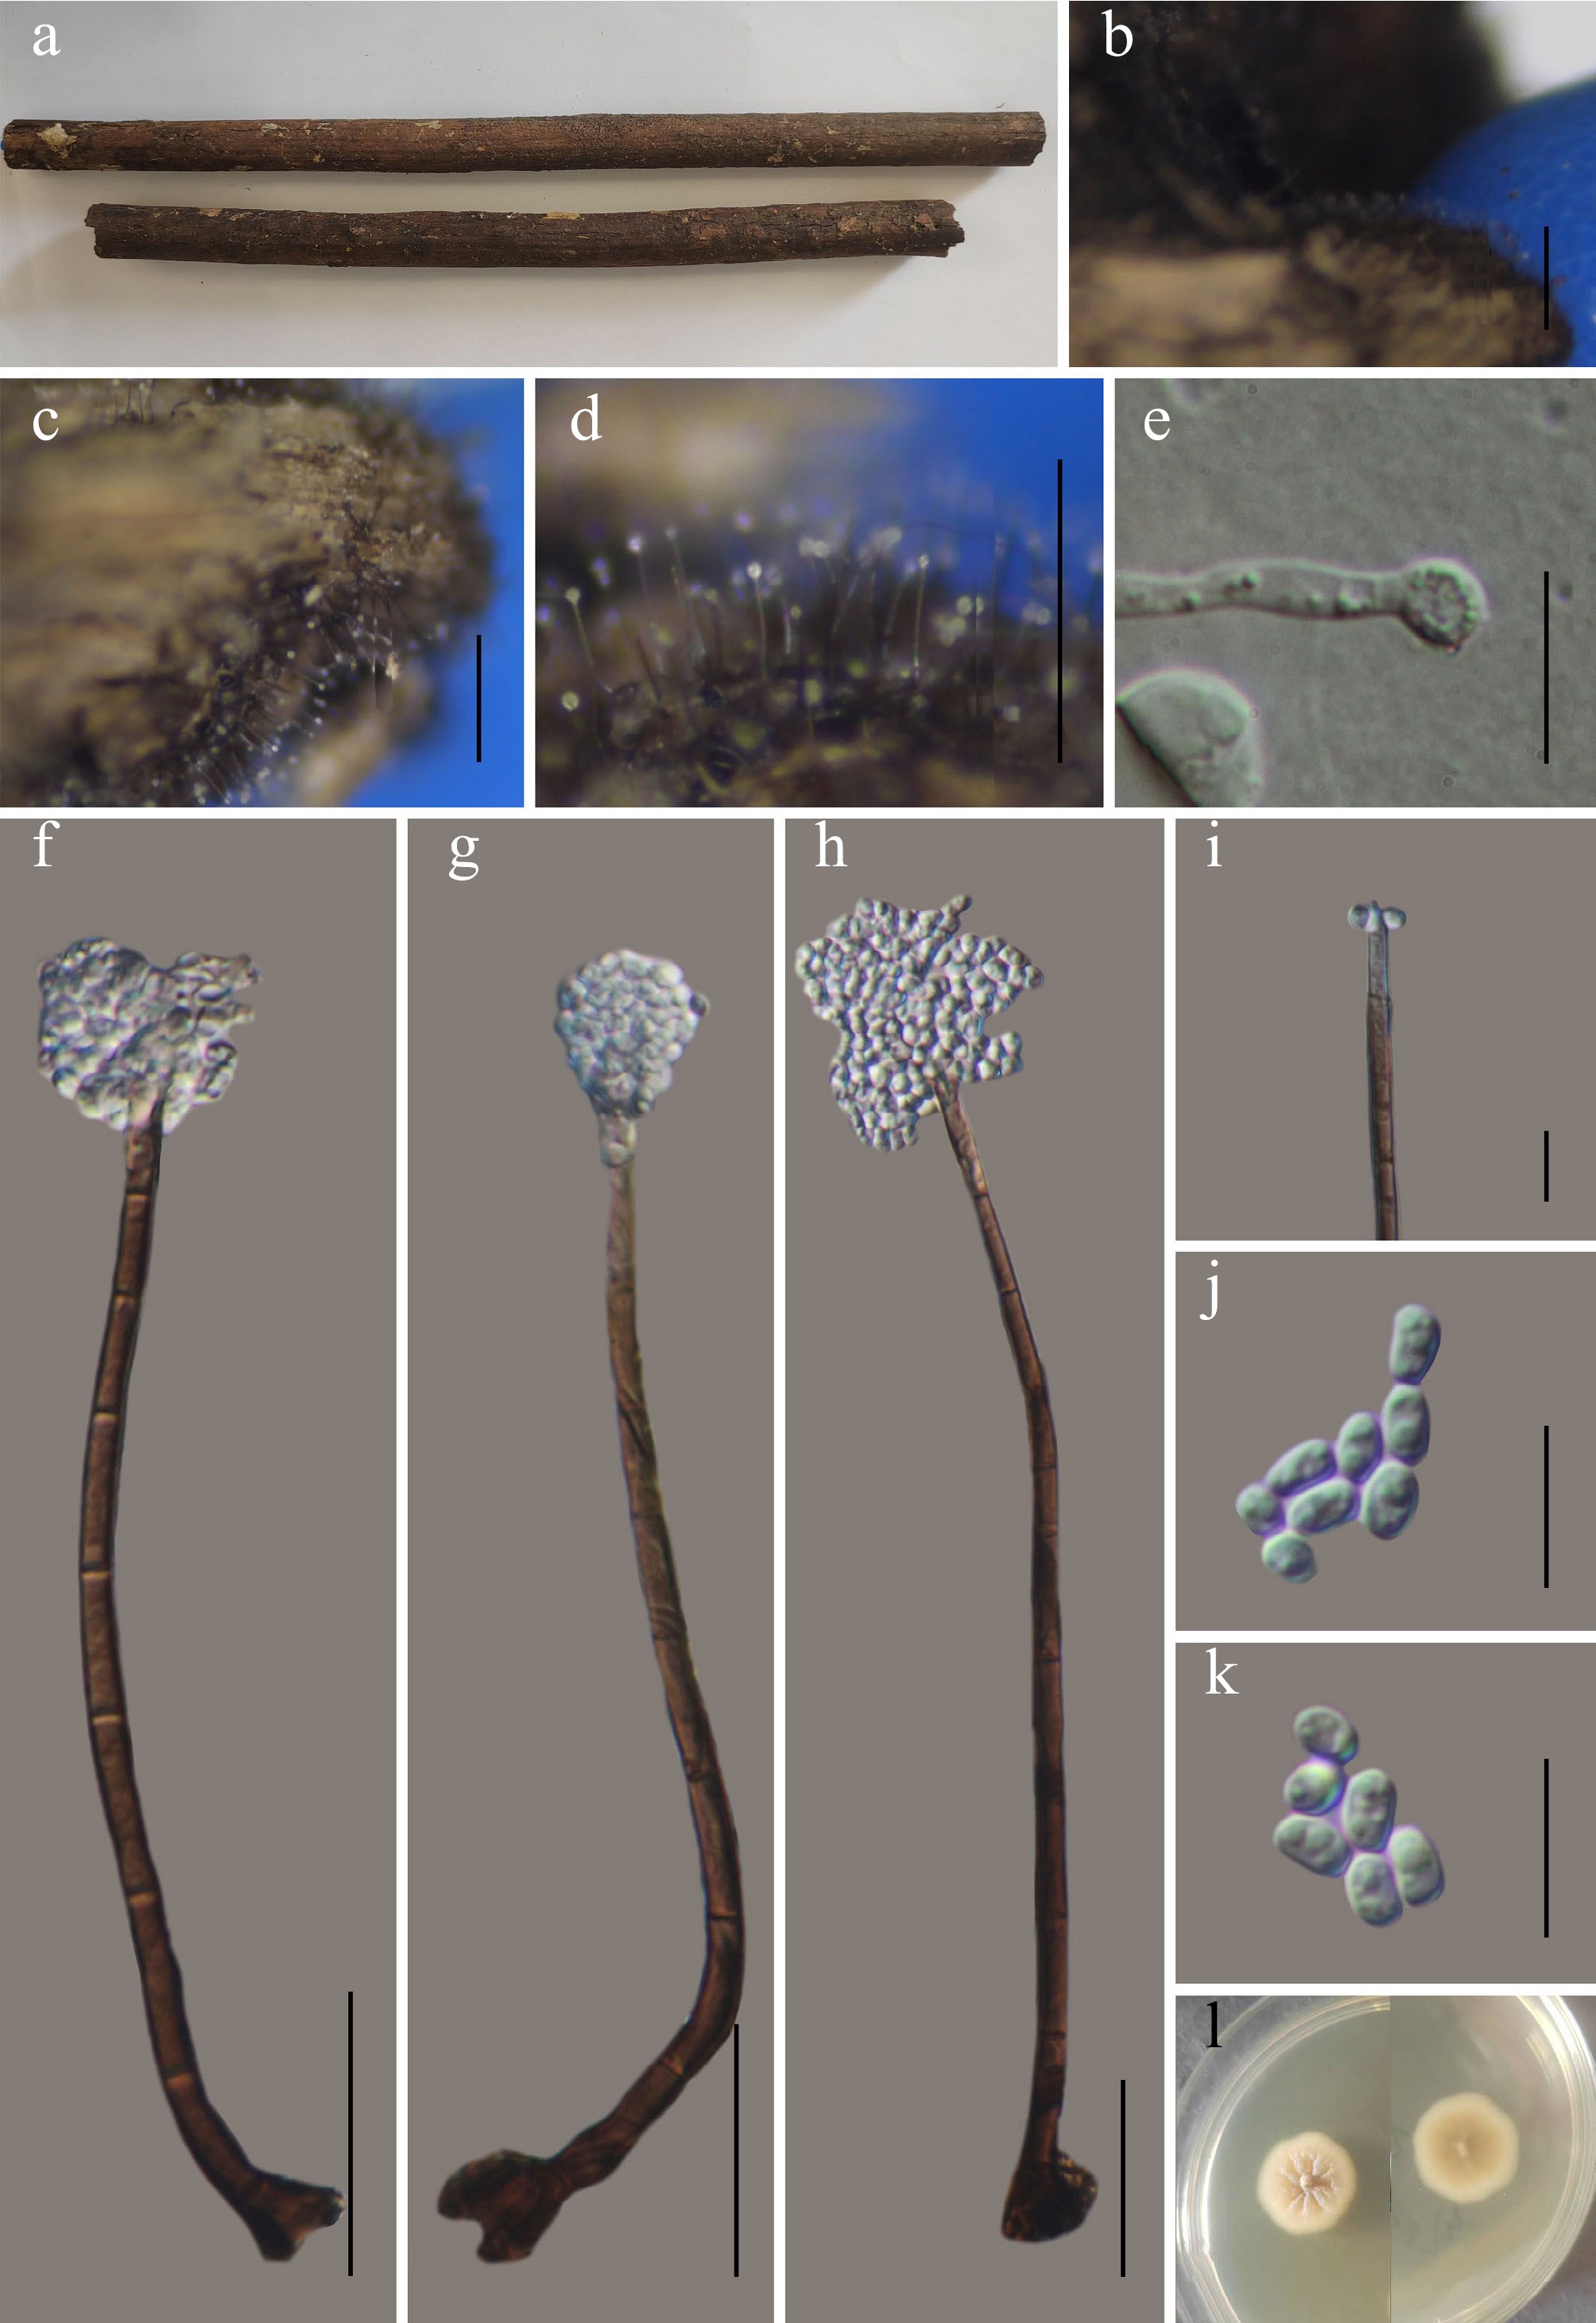
Figure 54.
Xylolentia wumengshanensis (GMB6945 holotype). (a) Host. (b)–(d) Colonies on natural substrate. (e) Germinating conidium. (f)–(h) Conidiophores and conidia. (i) Conidiogenous cells. (j), (k) Conidia. (l) Surface and reverse view of culture on PDA. Scale bars: b = 1 mm, c, d = 0.5 mm, f–h = 30 μm, e, i–k = 10 μm.
-
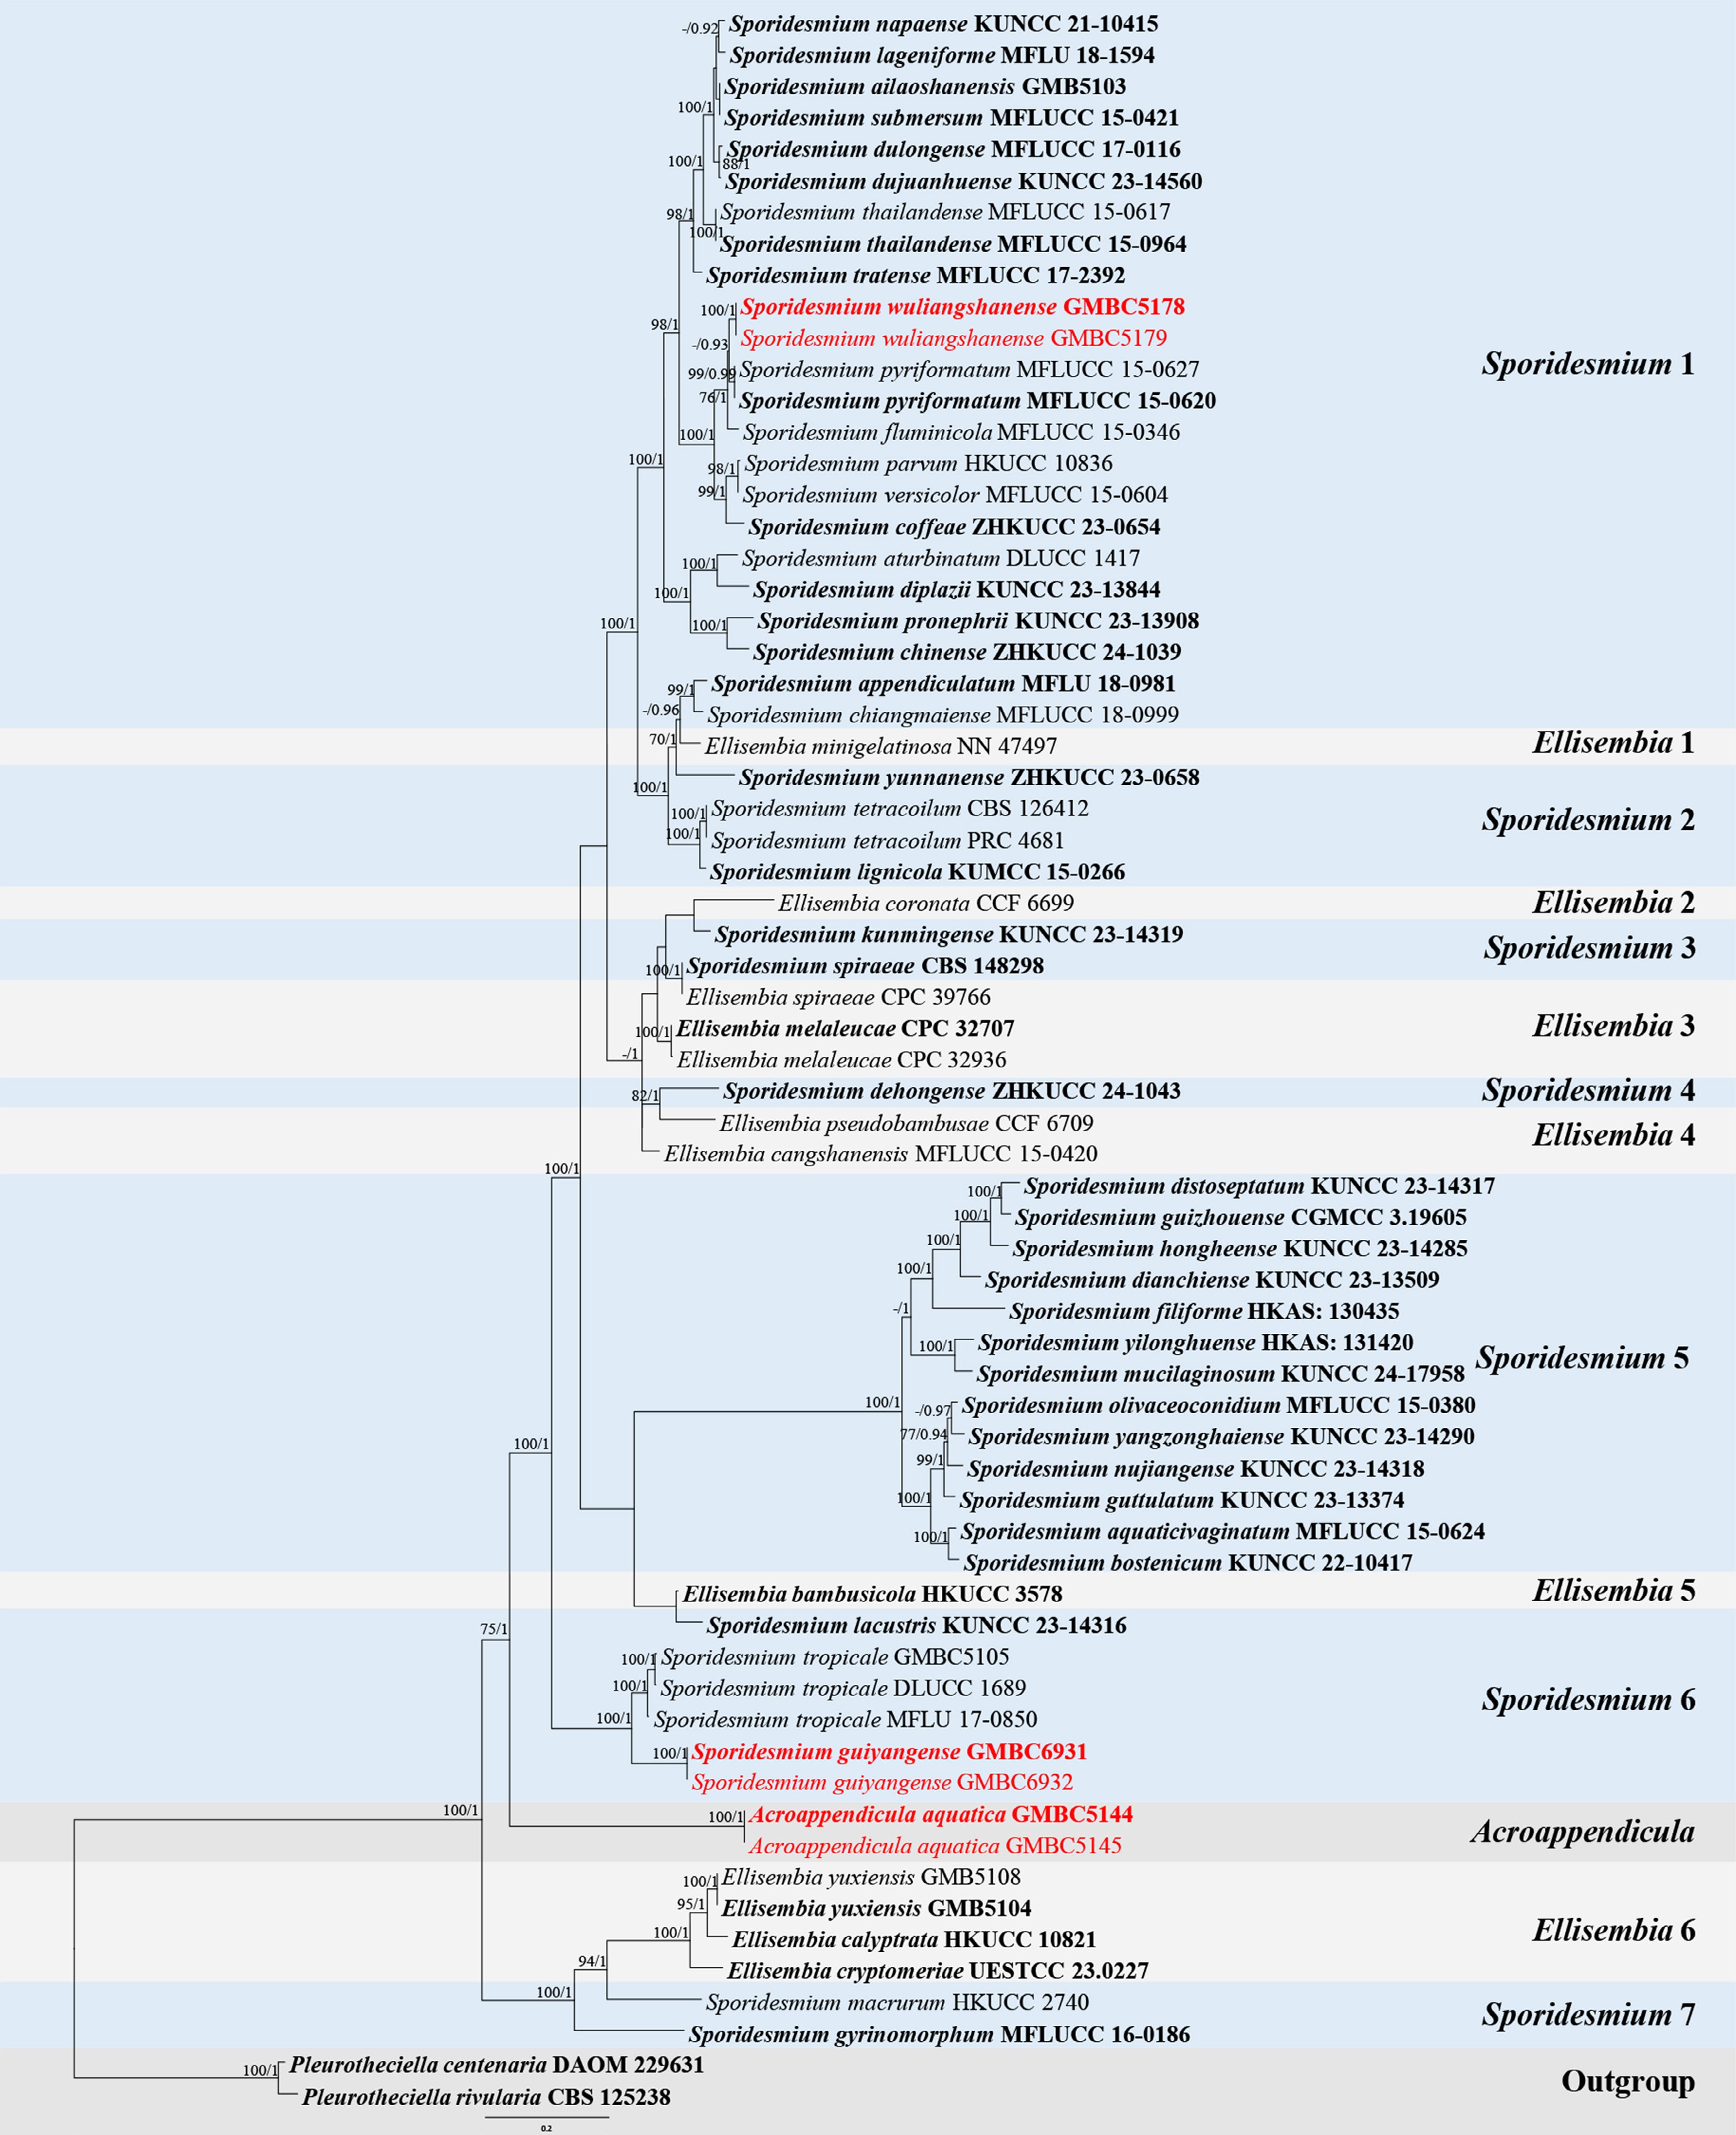
Figure 55.
ML tree of selected Sporidesmiaceae species based on the ITS-LSU-rpb2 dataset. The combined dataset comprised 67 taxa, 2,387 characters (ITS: 1–499 bp; LSU: 500–1,367 bp; rpb2: 1,368–2,387 bp), including indel regions. Maximum likelihood (lnL = –29,293.227036) and Bayesian analyses produced consistent tree topologies. Pleurotheciella centenaria (DAOM 229631) and P. rivularia (CBS 125238) were selected as the outgroup taxa. Bayesian posterior probabilities (PP) ≥ 0.90 and RAxML bootstrap support values ≥ 70 % are shown on the branches. The novel species are indicated in red and ex-type/type strains in bold.
-
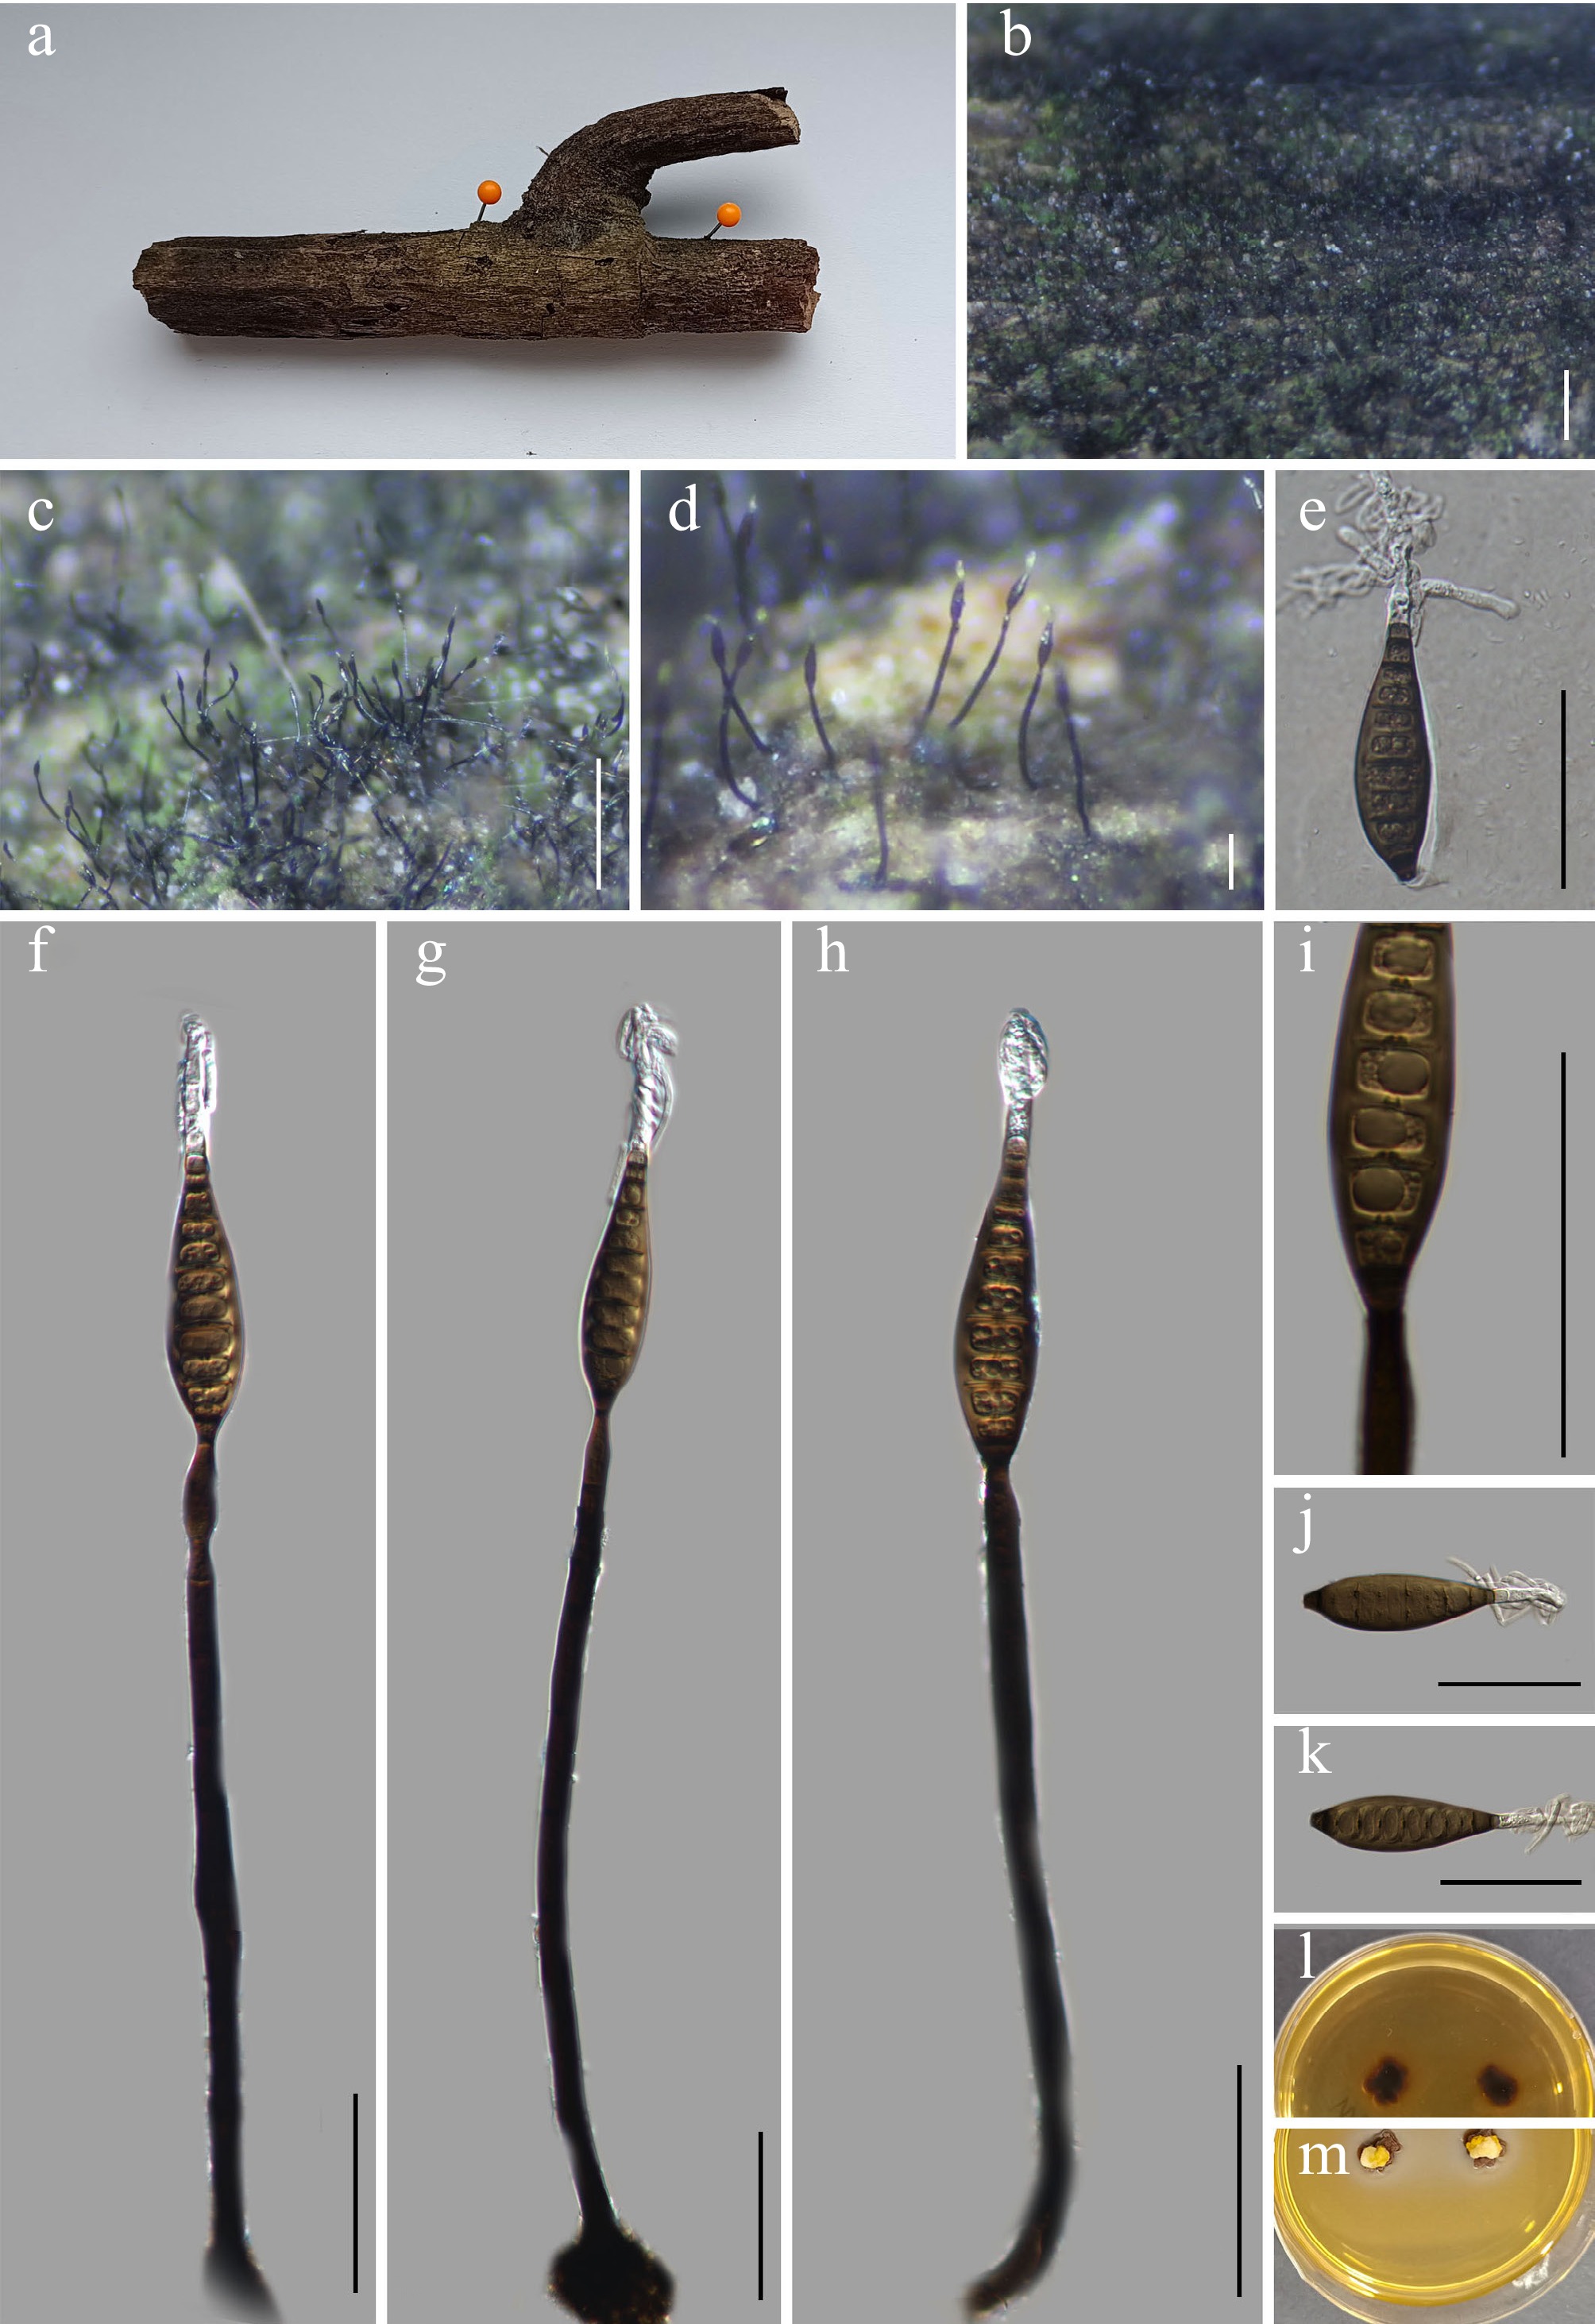
Figure 56.
Acroappendicula aquatica (GMB5144 holotype). (a) Host. (b)–(d) Colonies on natural substrate. (e) Germinating conidium. (f)–(h) Conidiophores and conidia. (i) Conidiogenous cells with conidia. (j), (k) Conidia. (l), (m) Surface view of culture on PDA. Scale bars: b = 1 mm, c = 0.5 mm, d = 0.1 mm, e–k = 50 μm.
-
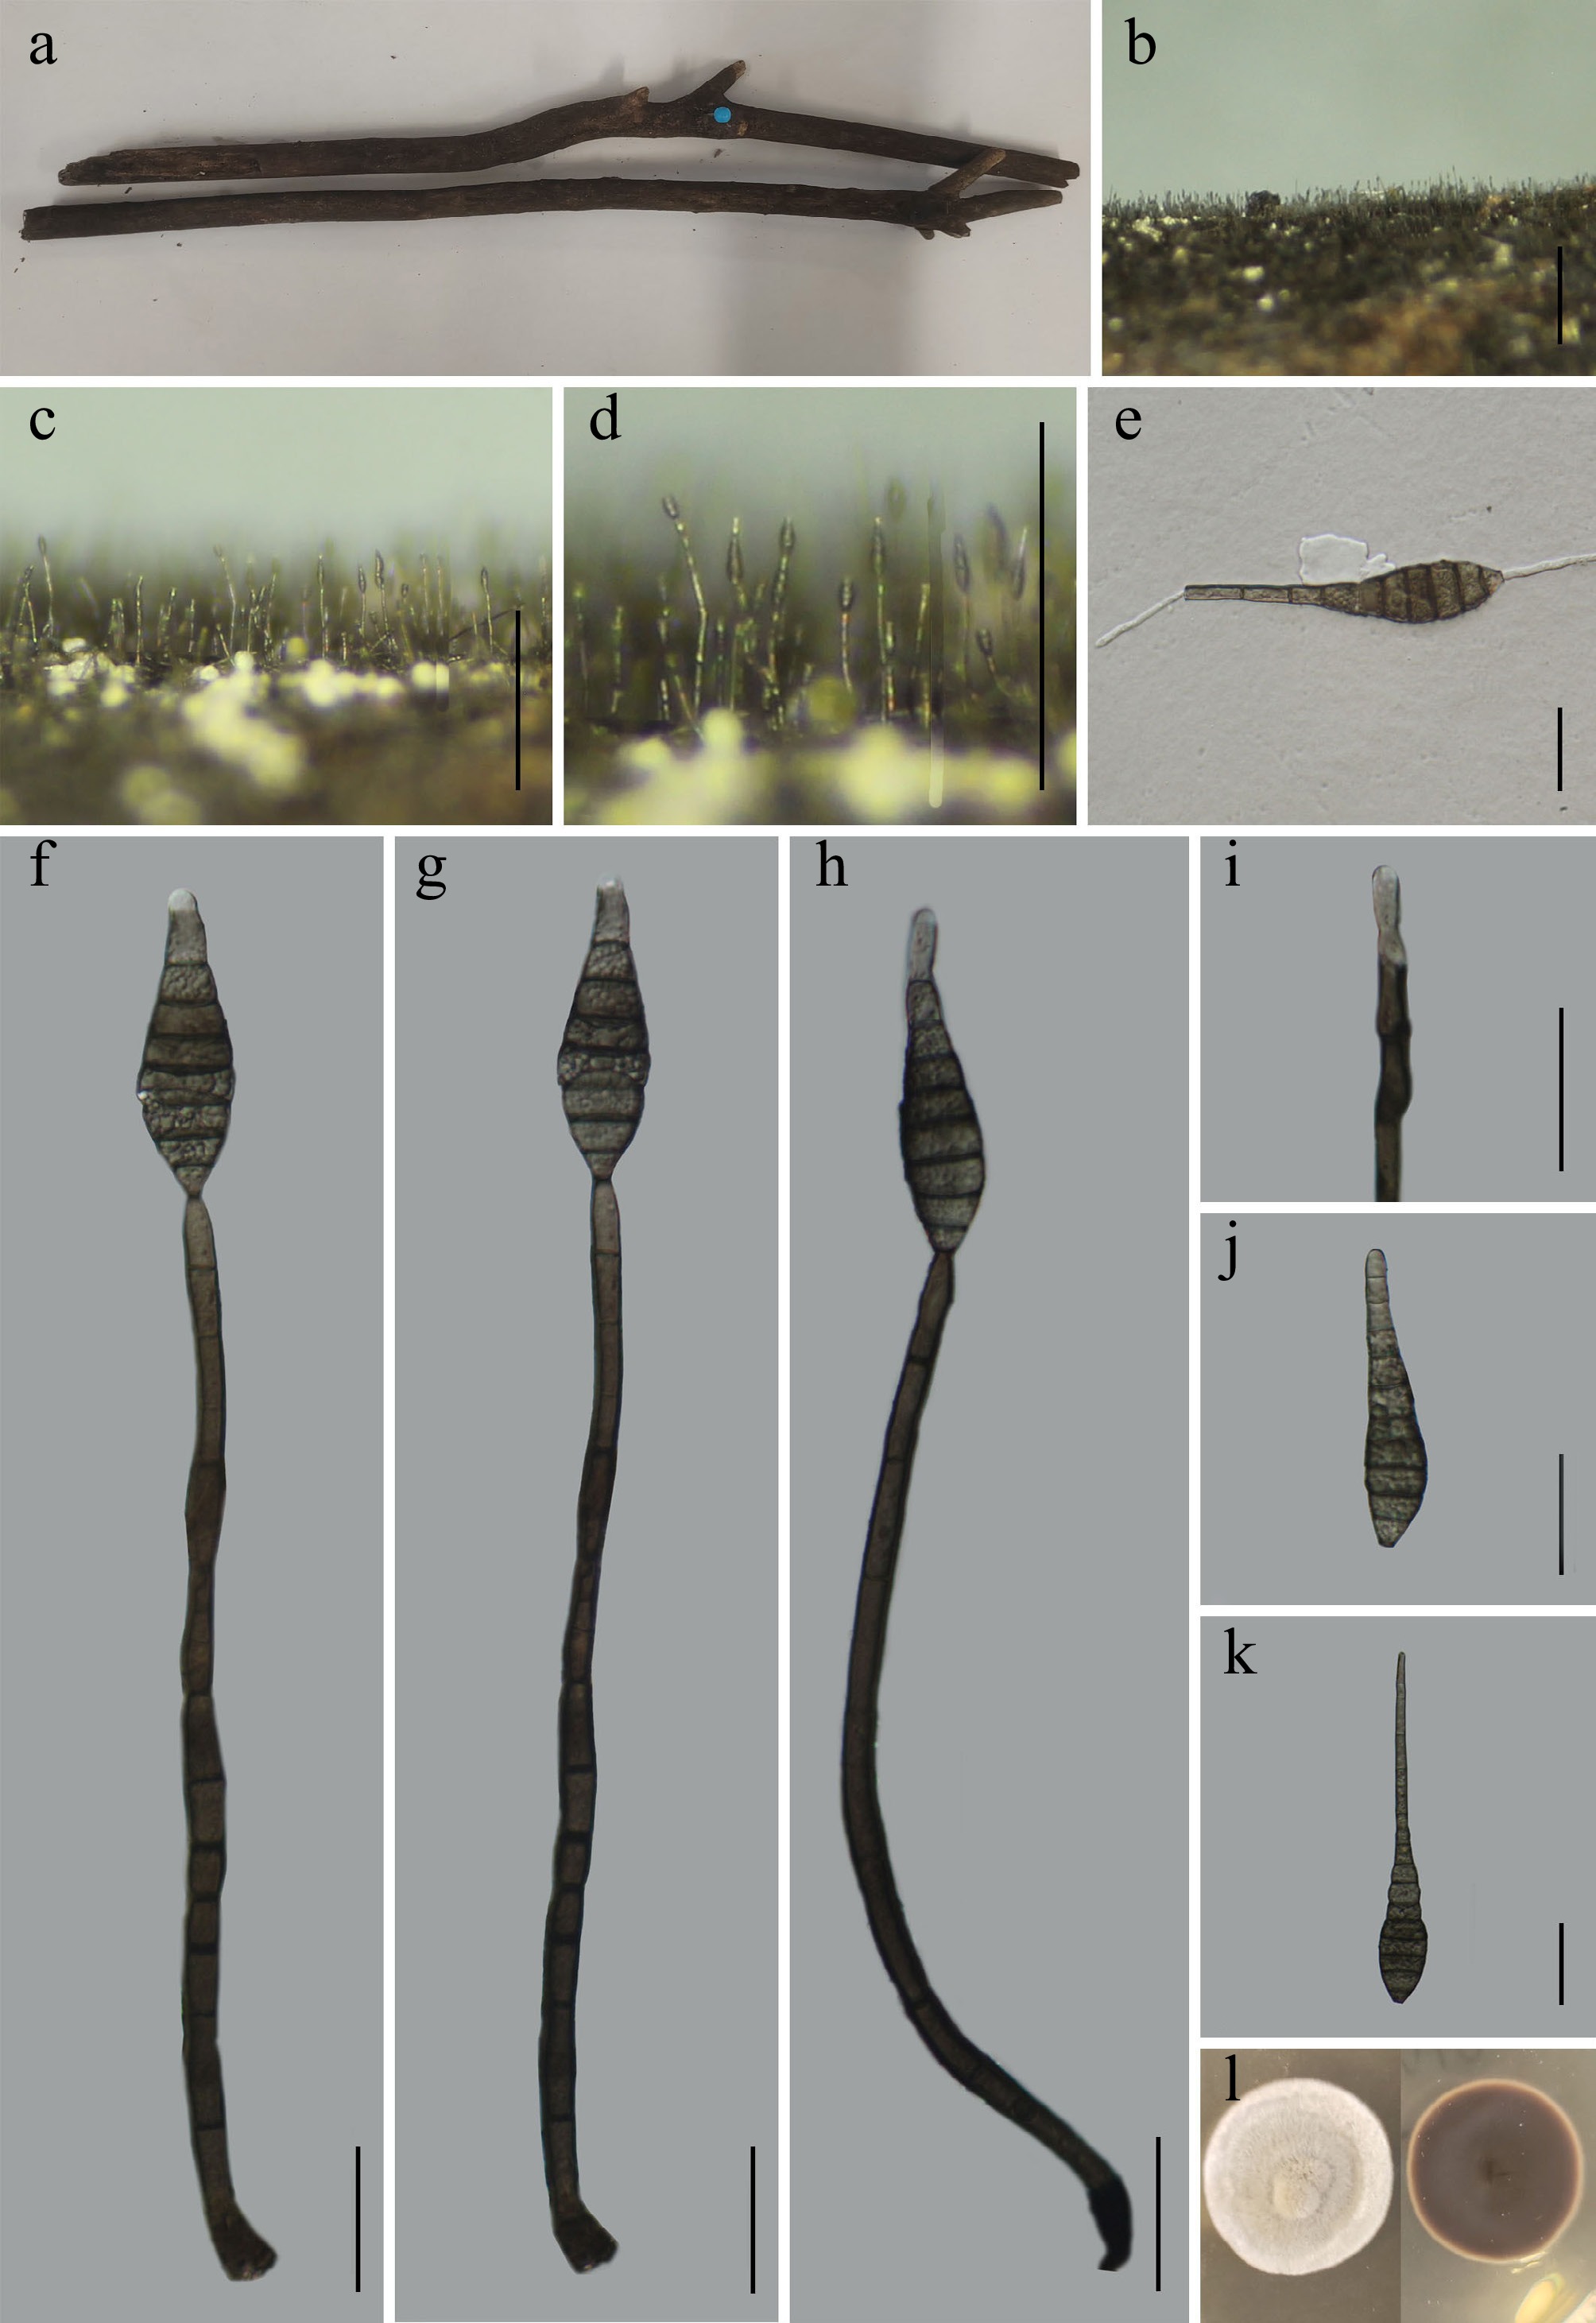
Figure 57.
Sporidesmium guiyangense (GMB6931 holotype). (a) Host. (b)–(d) Colonies on natural substrate. (e) Germinating conidium. (f)–(h) Conidiophores and conidia. (i) Conidiogenous cells. (j), (k) Conidia. (l) Surface and reverse view of culture on PDA. Scale bars: b = 1 mm, c, d = 0.5 mm, e–k = 30 μm.
-
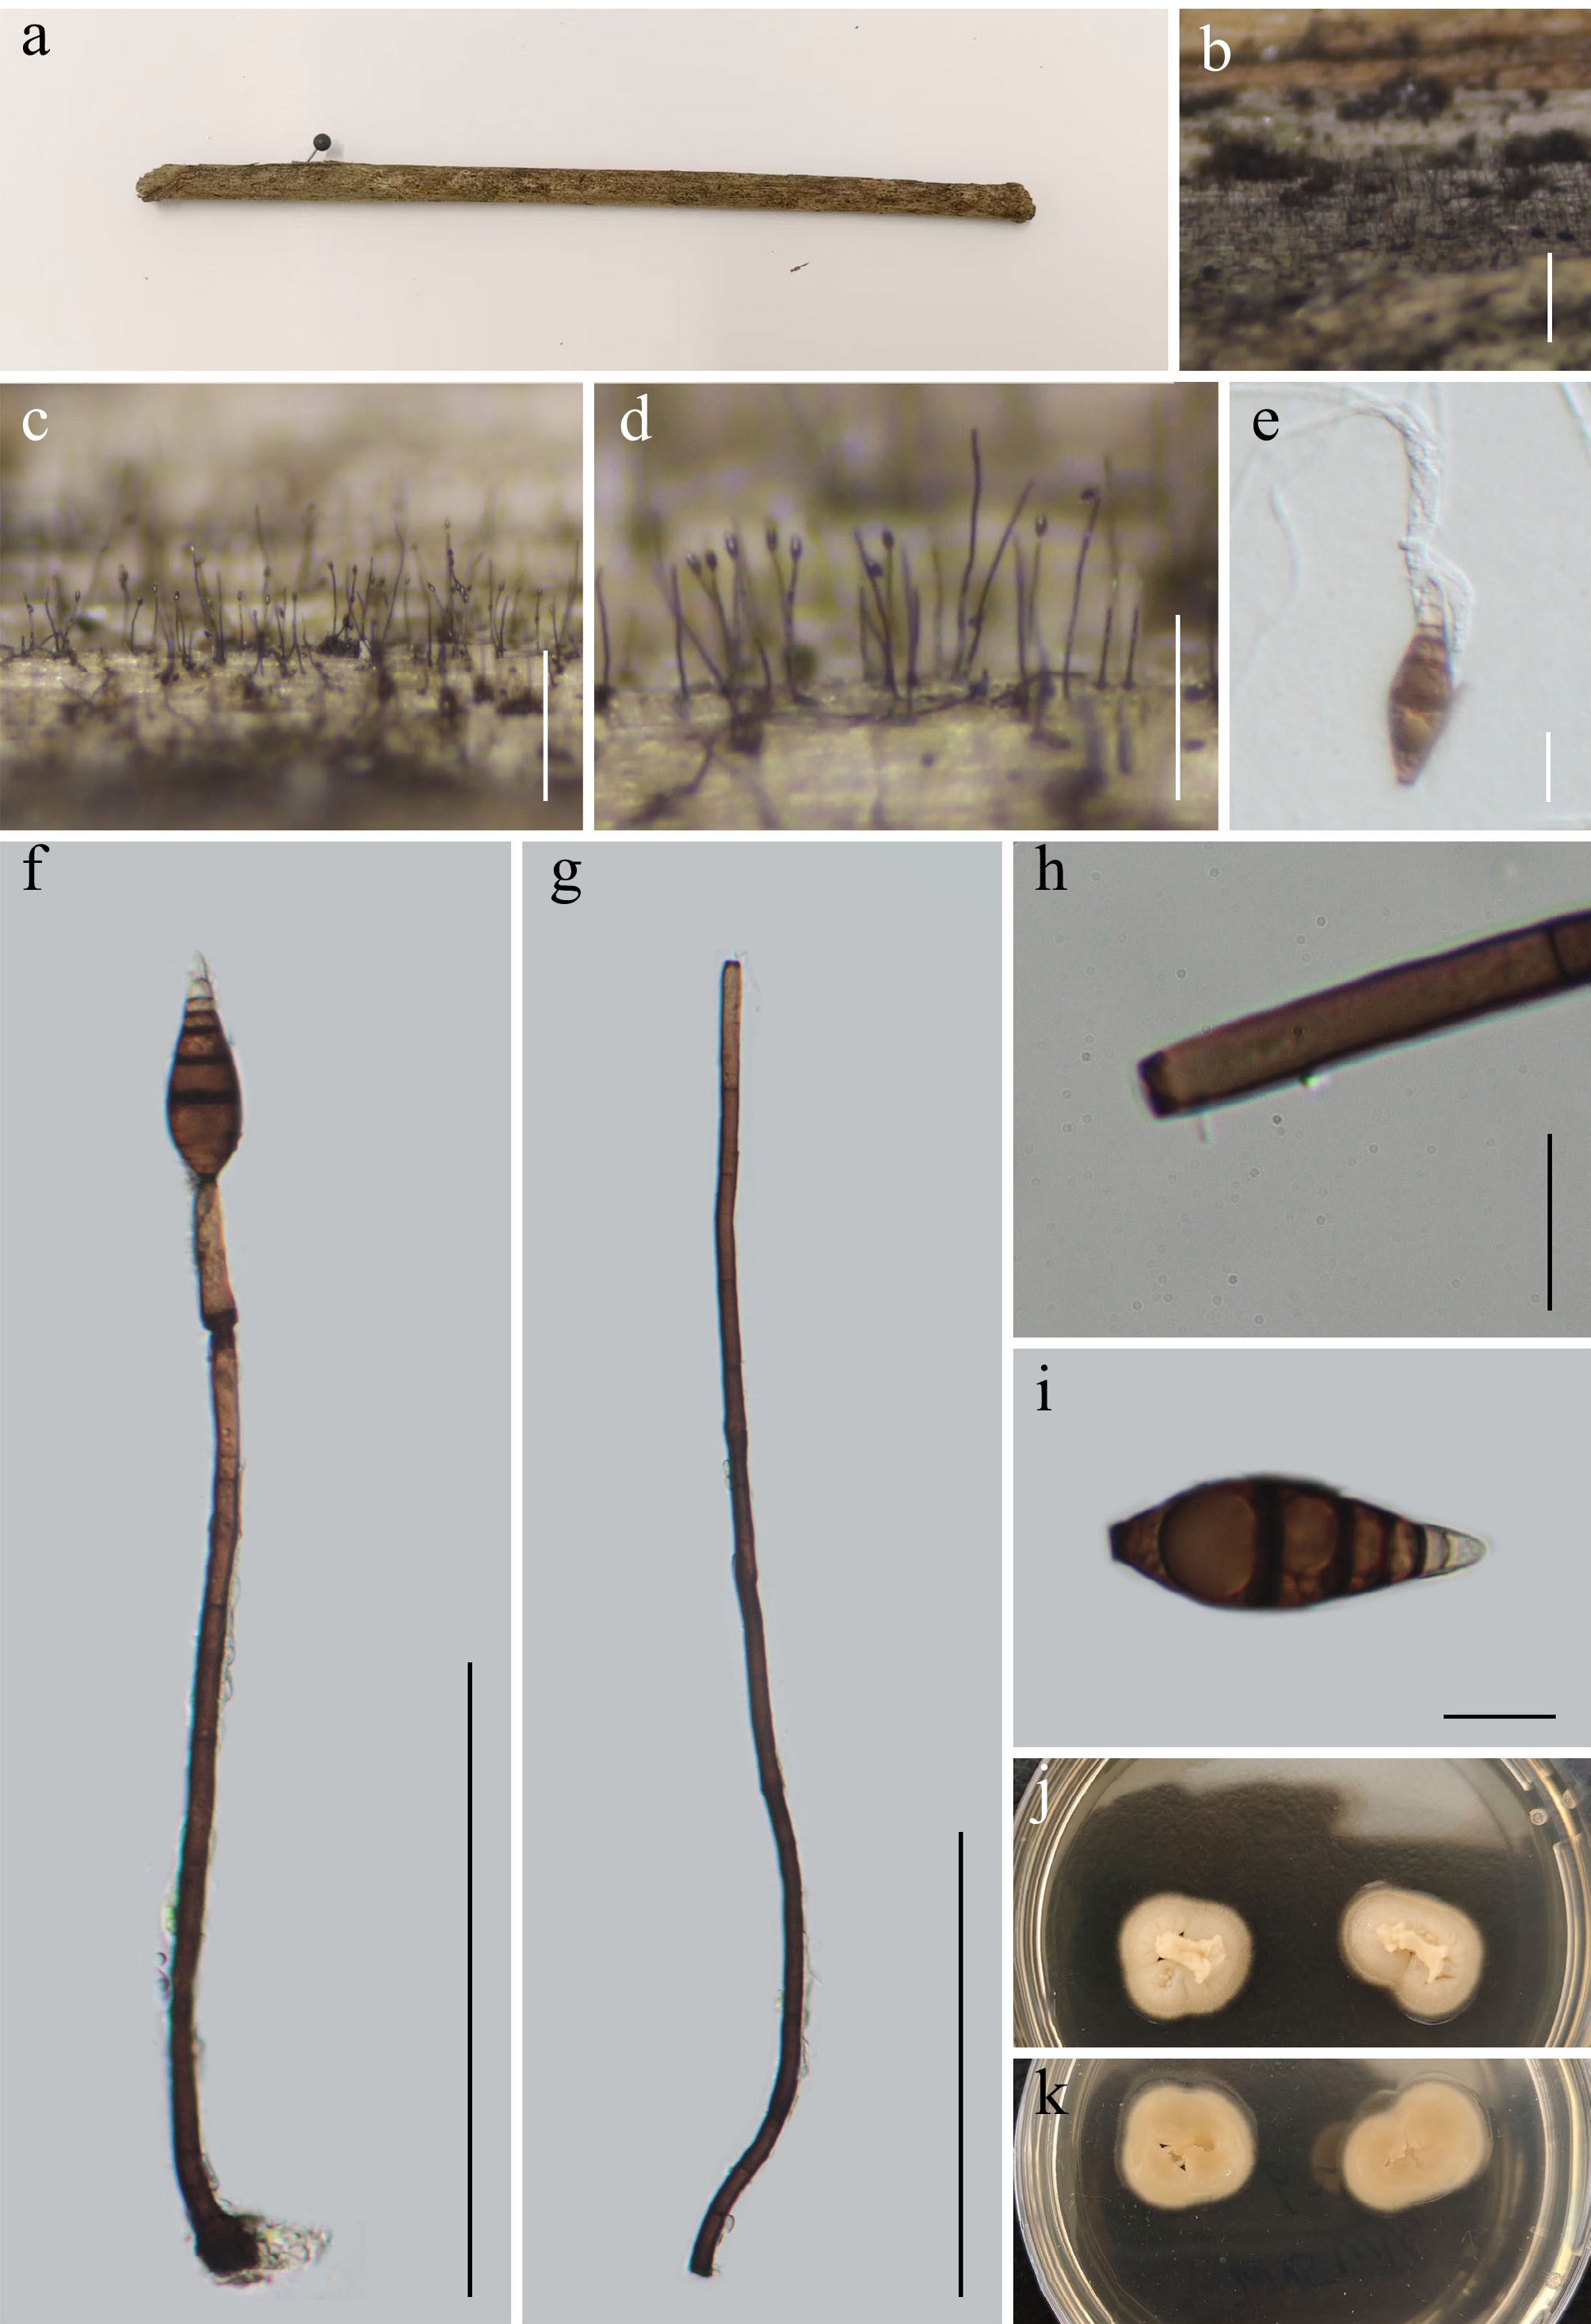
Figure 58.
Sporidesmium wuliangshanense (GMB5178 holotype). (a) Host. (b)–(d) Colonies on natural substrate. (e) Germinating conidium. (f), (g) Conidiophores and conidia. (h) Conidiogenous cells. (i) Conidium. (j), (k) Surface and reverse view of culture on PDA. Scale bars: b = 1 mm, c = 0.5 mm, d = 0.25 mm, f, g = 100 μm, e, h, i = 10 μm.
-
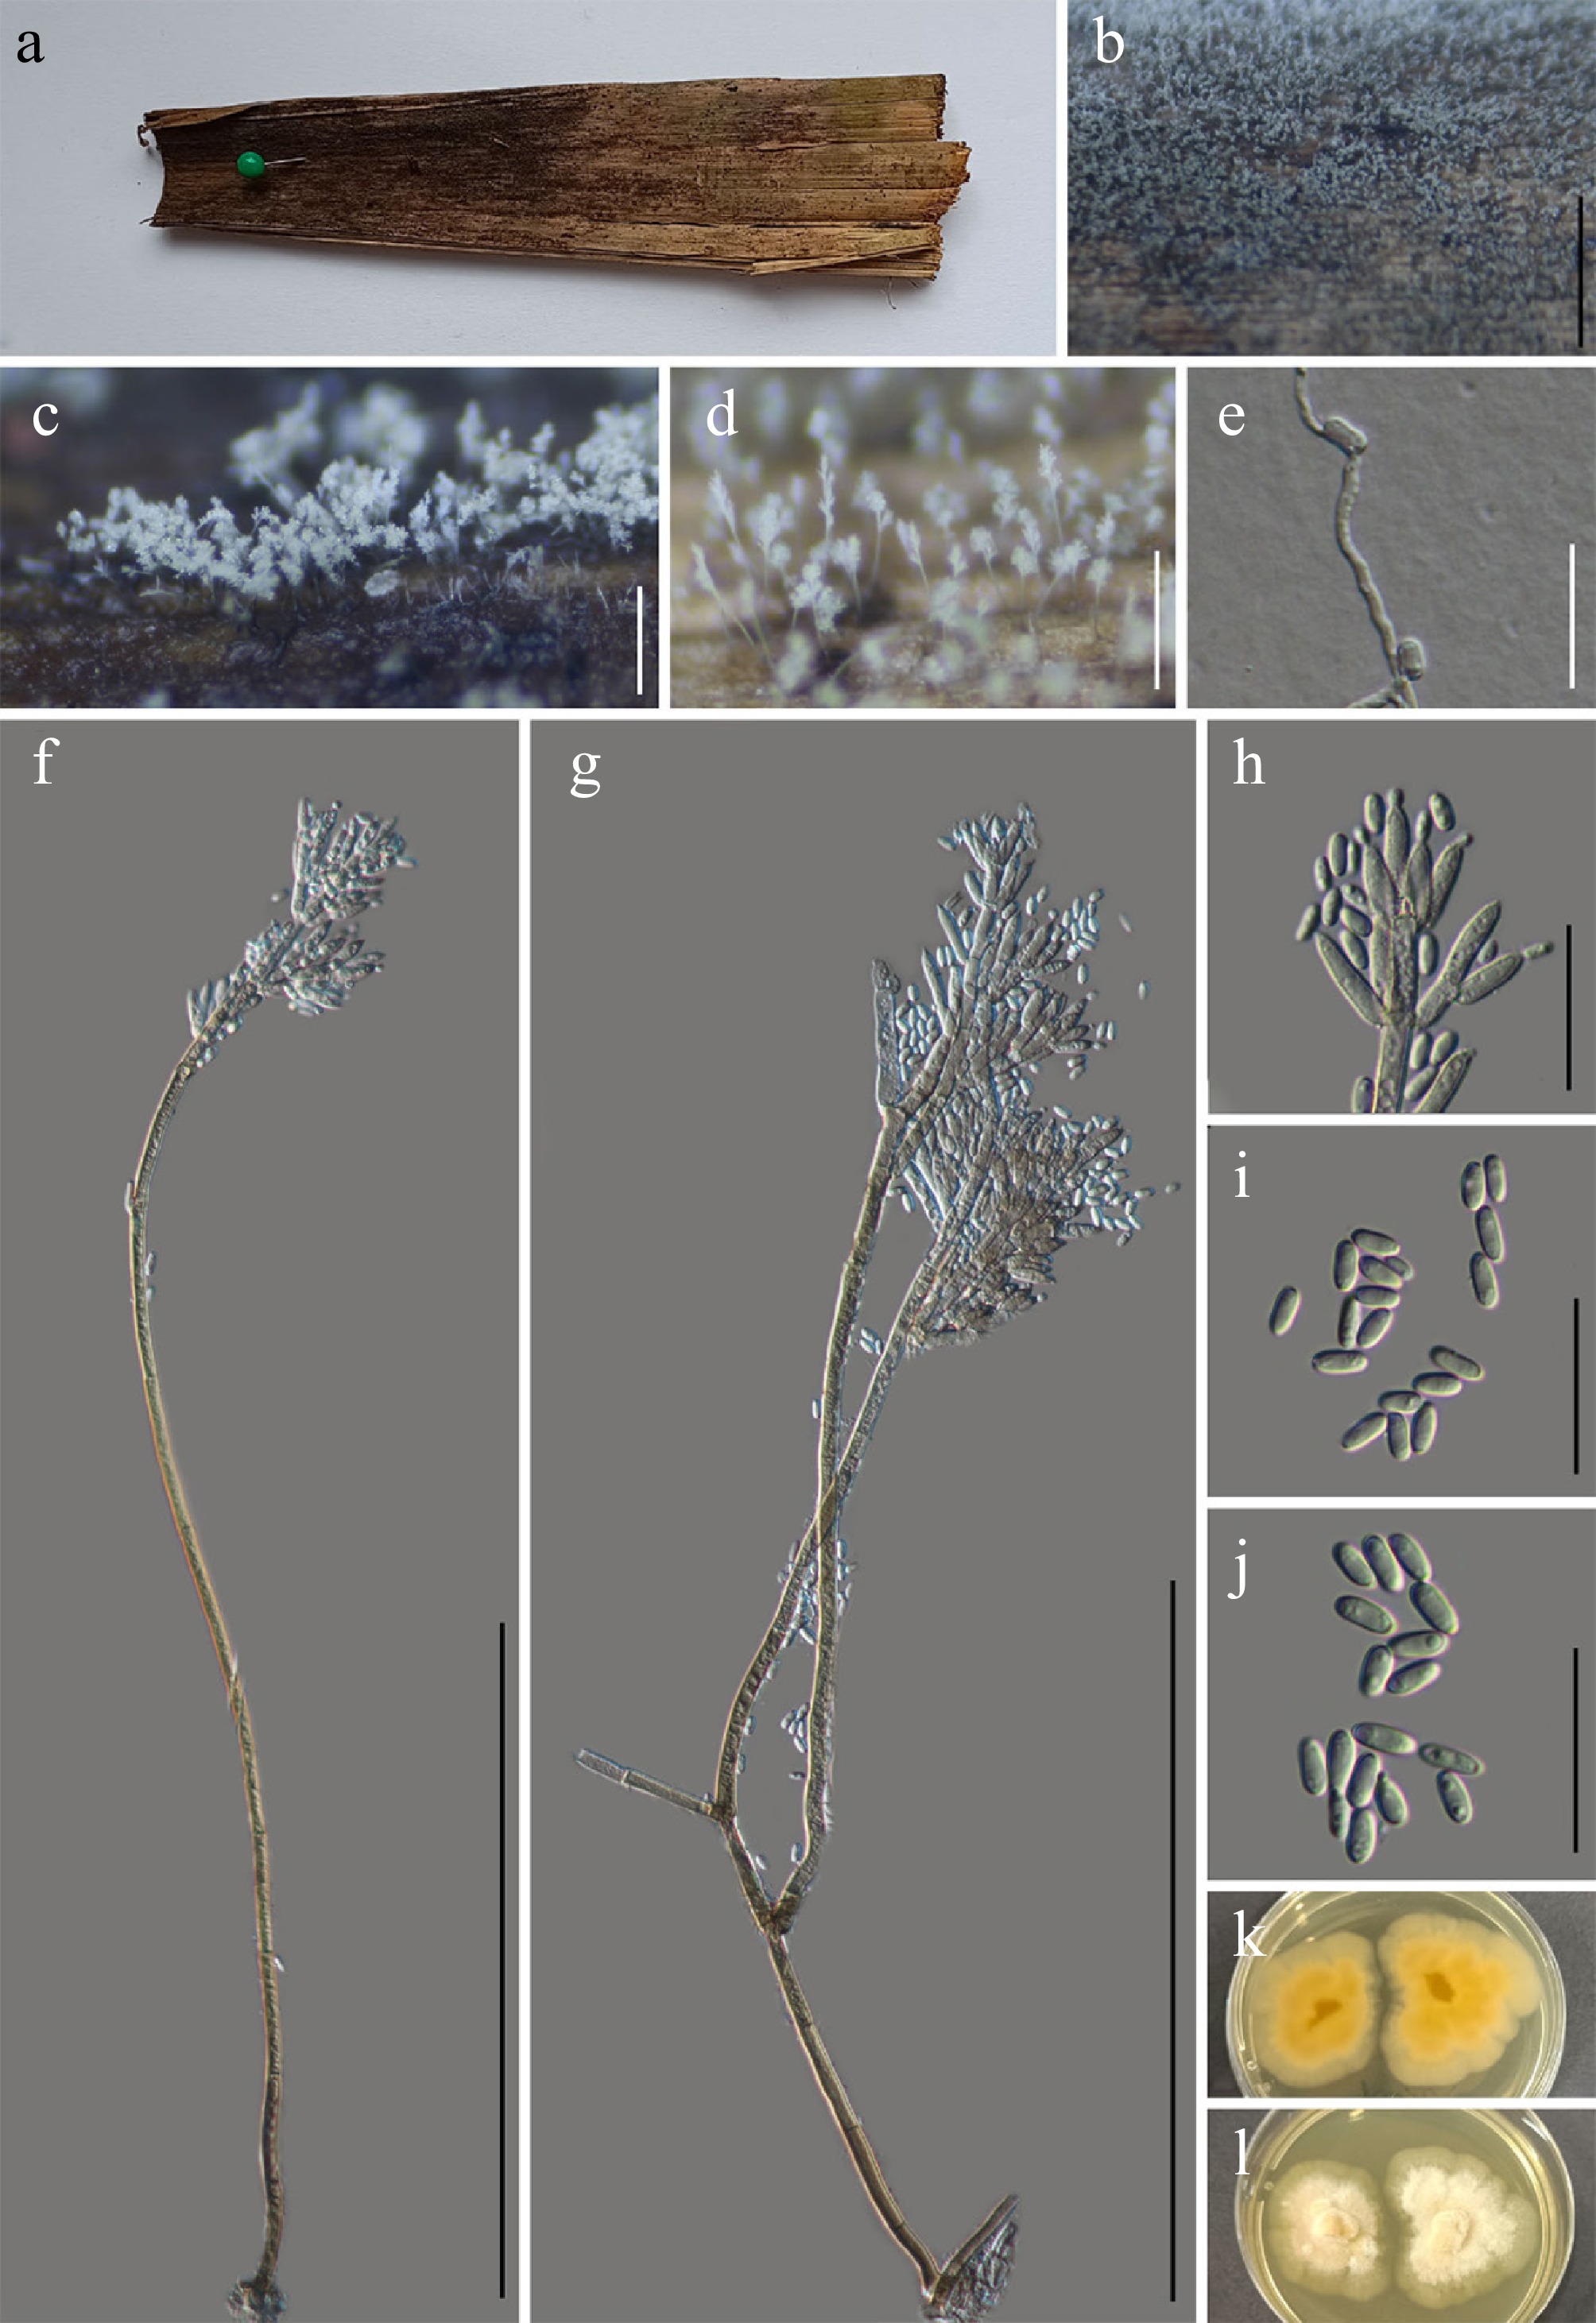
Figure 59.
Stachylidium bicolor (GMB5148). (a) Host. (b)–(d) Colonies on natural substrate. (e) Germinating conidium. (f), (g) Conidiophores and conidia. (h) Conidiogenous cells. (i), (j) Conidia. (k), (l) Surface and reverse view of culture on PDA. Scale bars: b = 3 mm, c = 0.5 mm, d = 2 mm, f, g = 200 μm, e, h–j = 20 μm.
-
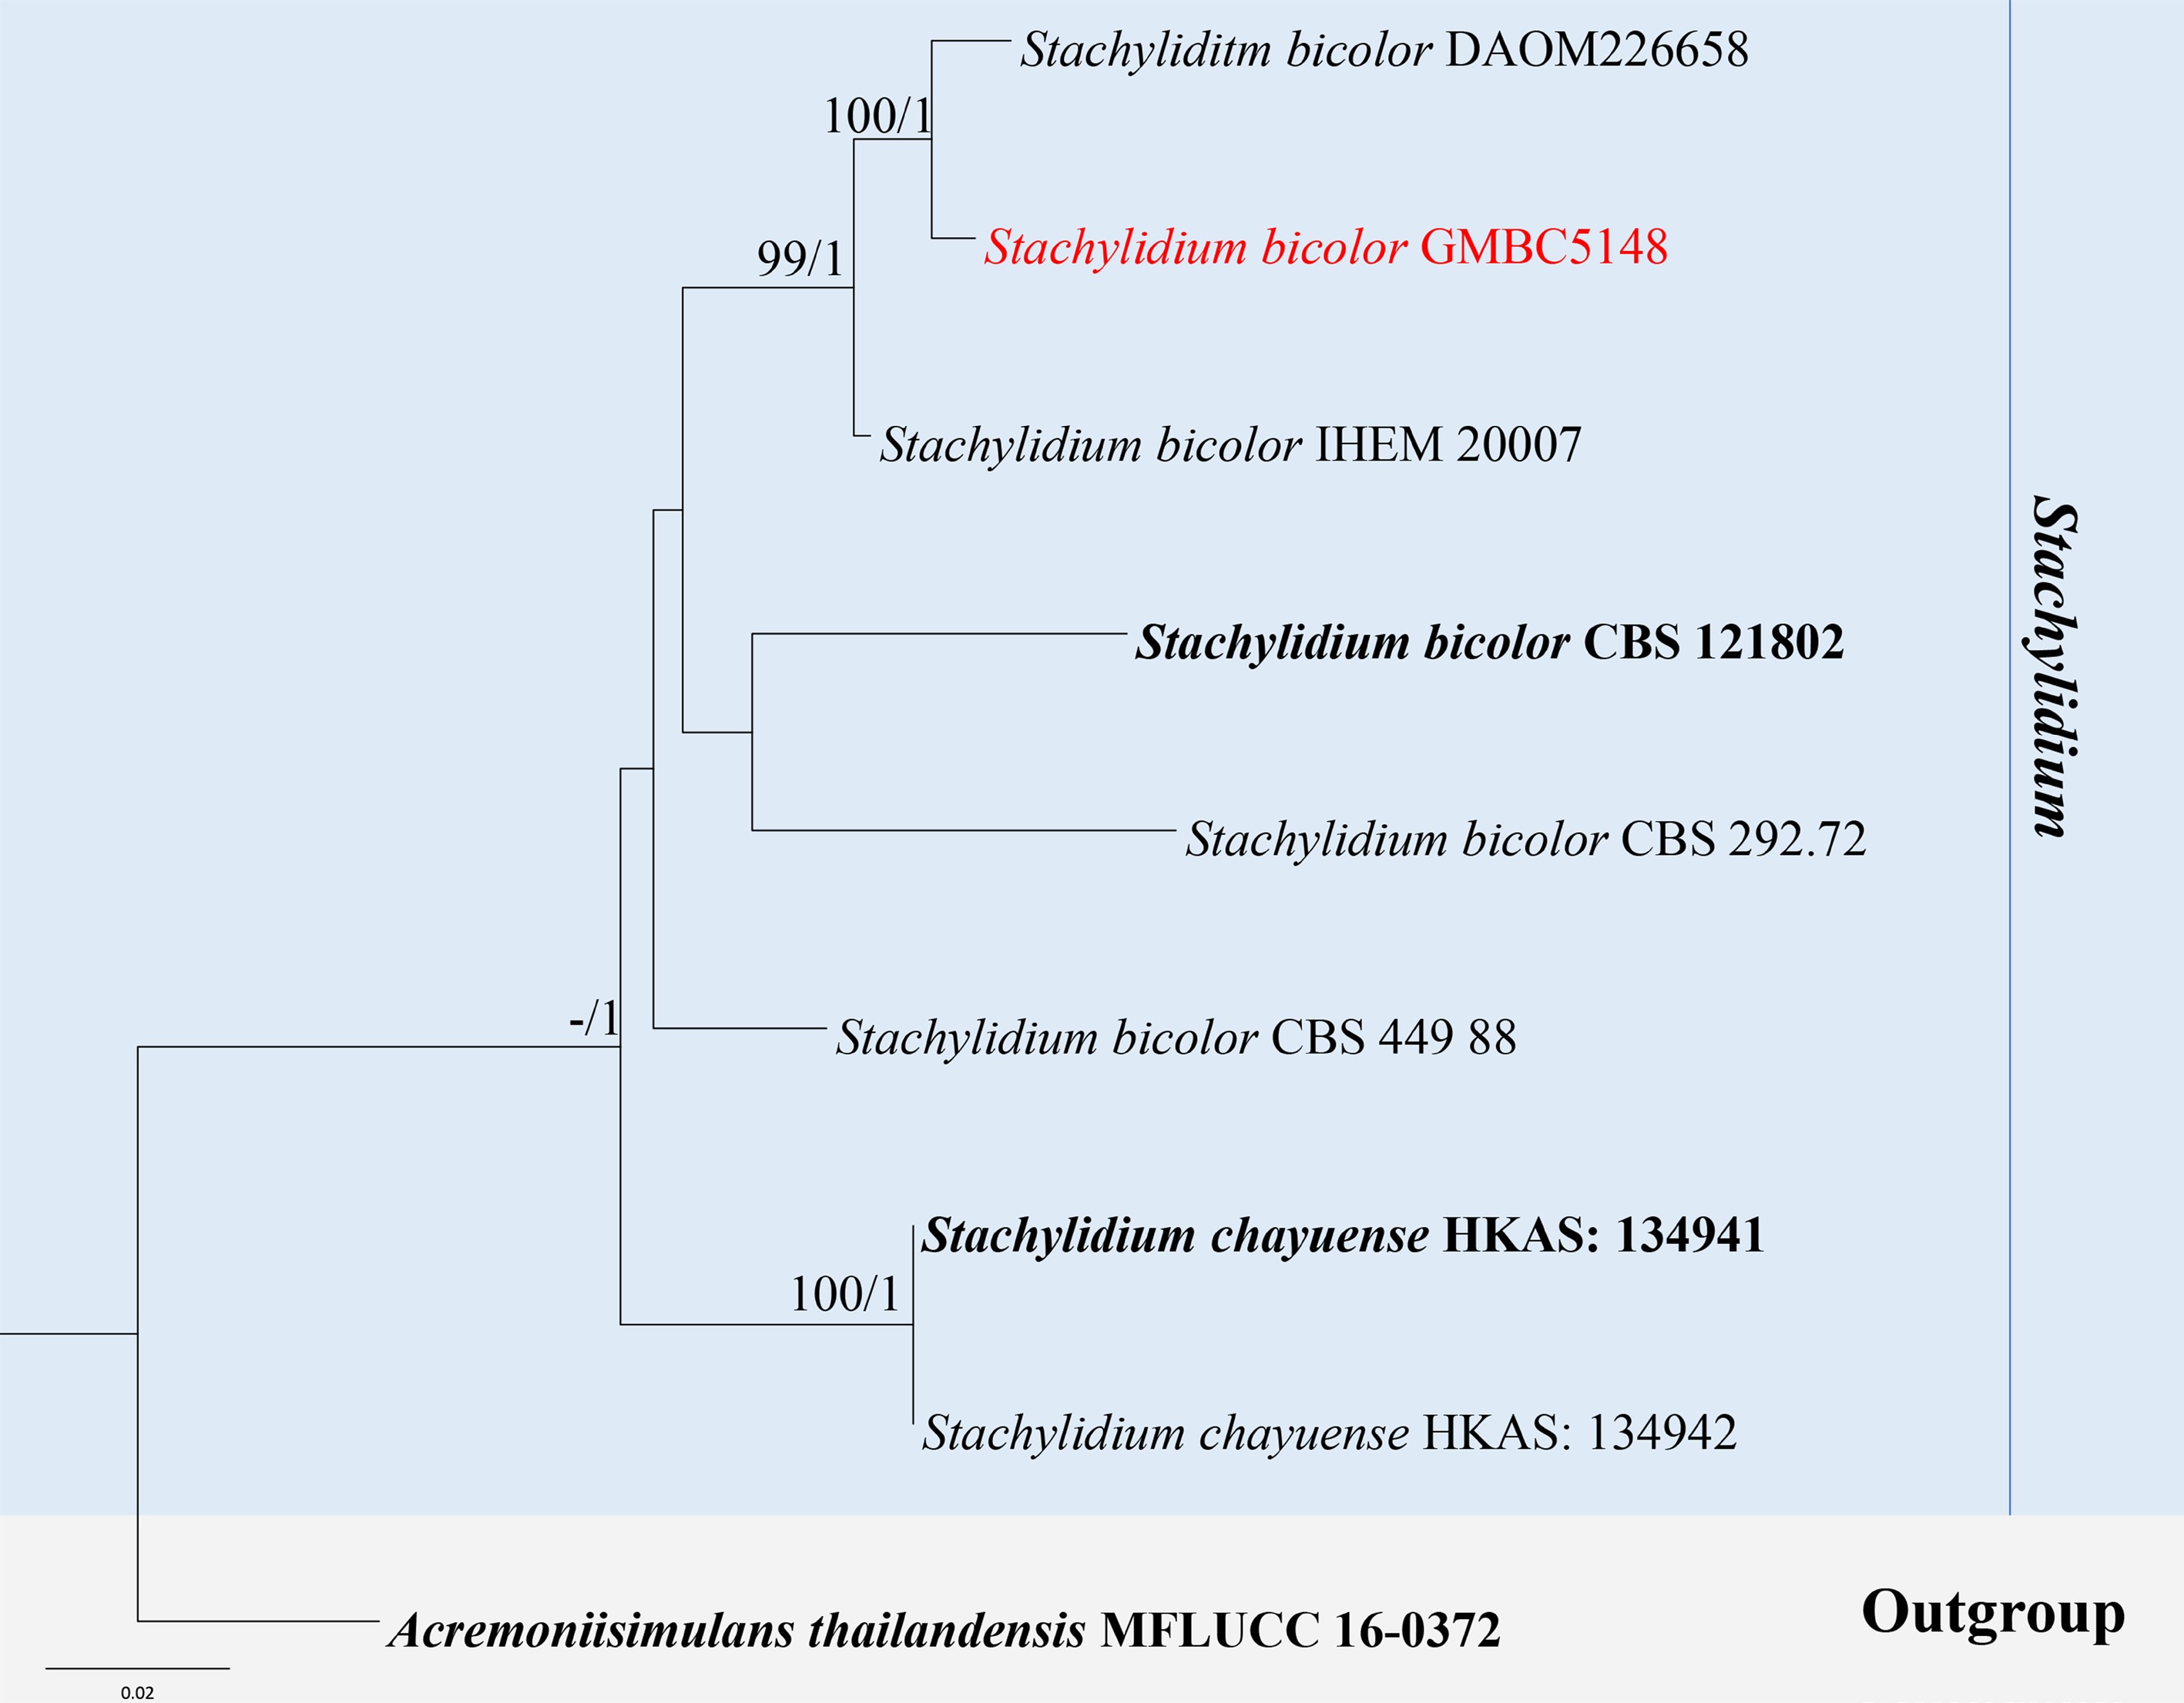
Figure 60.
ML tree of selected Stachylidium species based on the ITS-LSU-tef1-αdataset. The combined dataset comprised nine taxa, 2,221 characters (ITS: 1–515 bp; LSU: 516–1,361 bp; tef1-α: 1,362–2,221 bp), including indel regions. Maximum likelihood (lnL = –5,080.289634) and Bayesian analyses produced consistent tree topologies. Acremoniisimulans thailandensis (MFLUCC 16-0372) was selected as the outgroup taxon. Bayesian posterior probabilities (PP) ≥ 0.90 and RAxML bootstrap support values ≥ 70 % are shown on the branches. The new record is indicated in red and ex-type/type strains in bold.
-
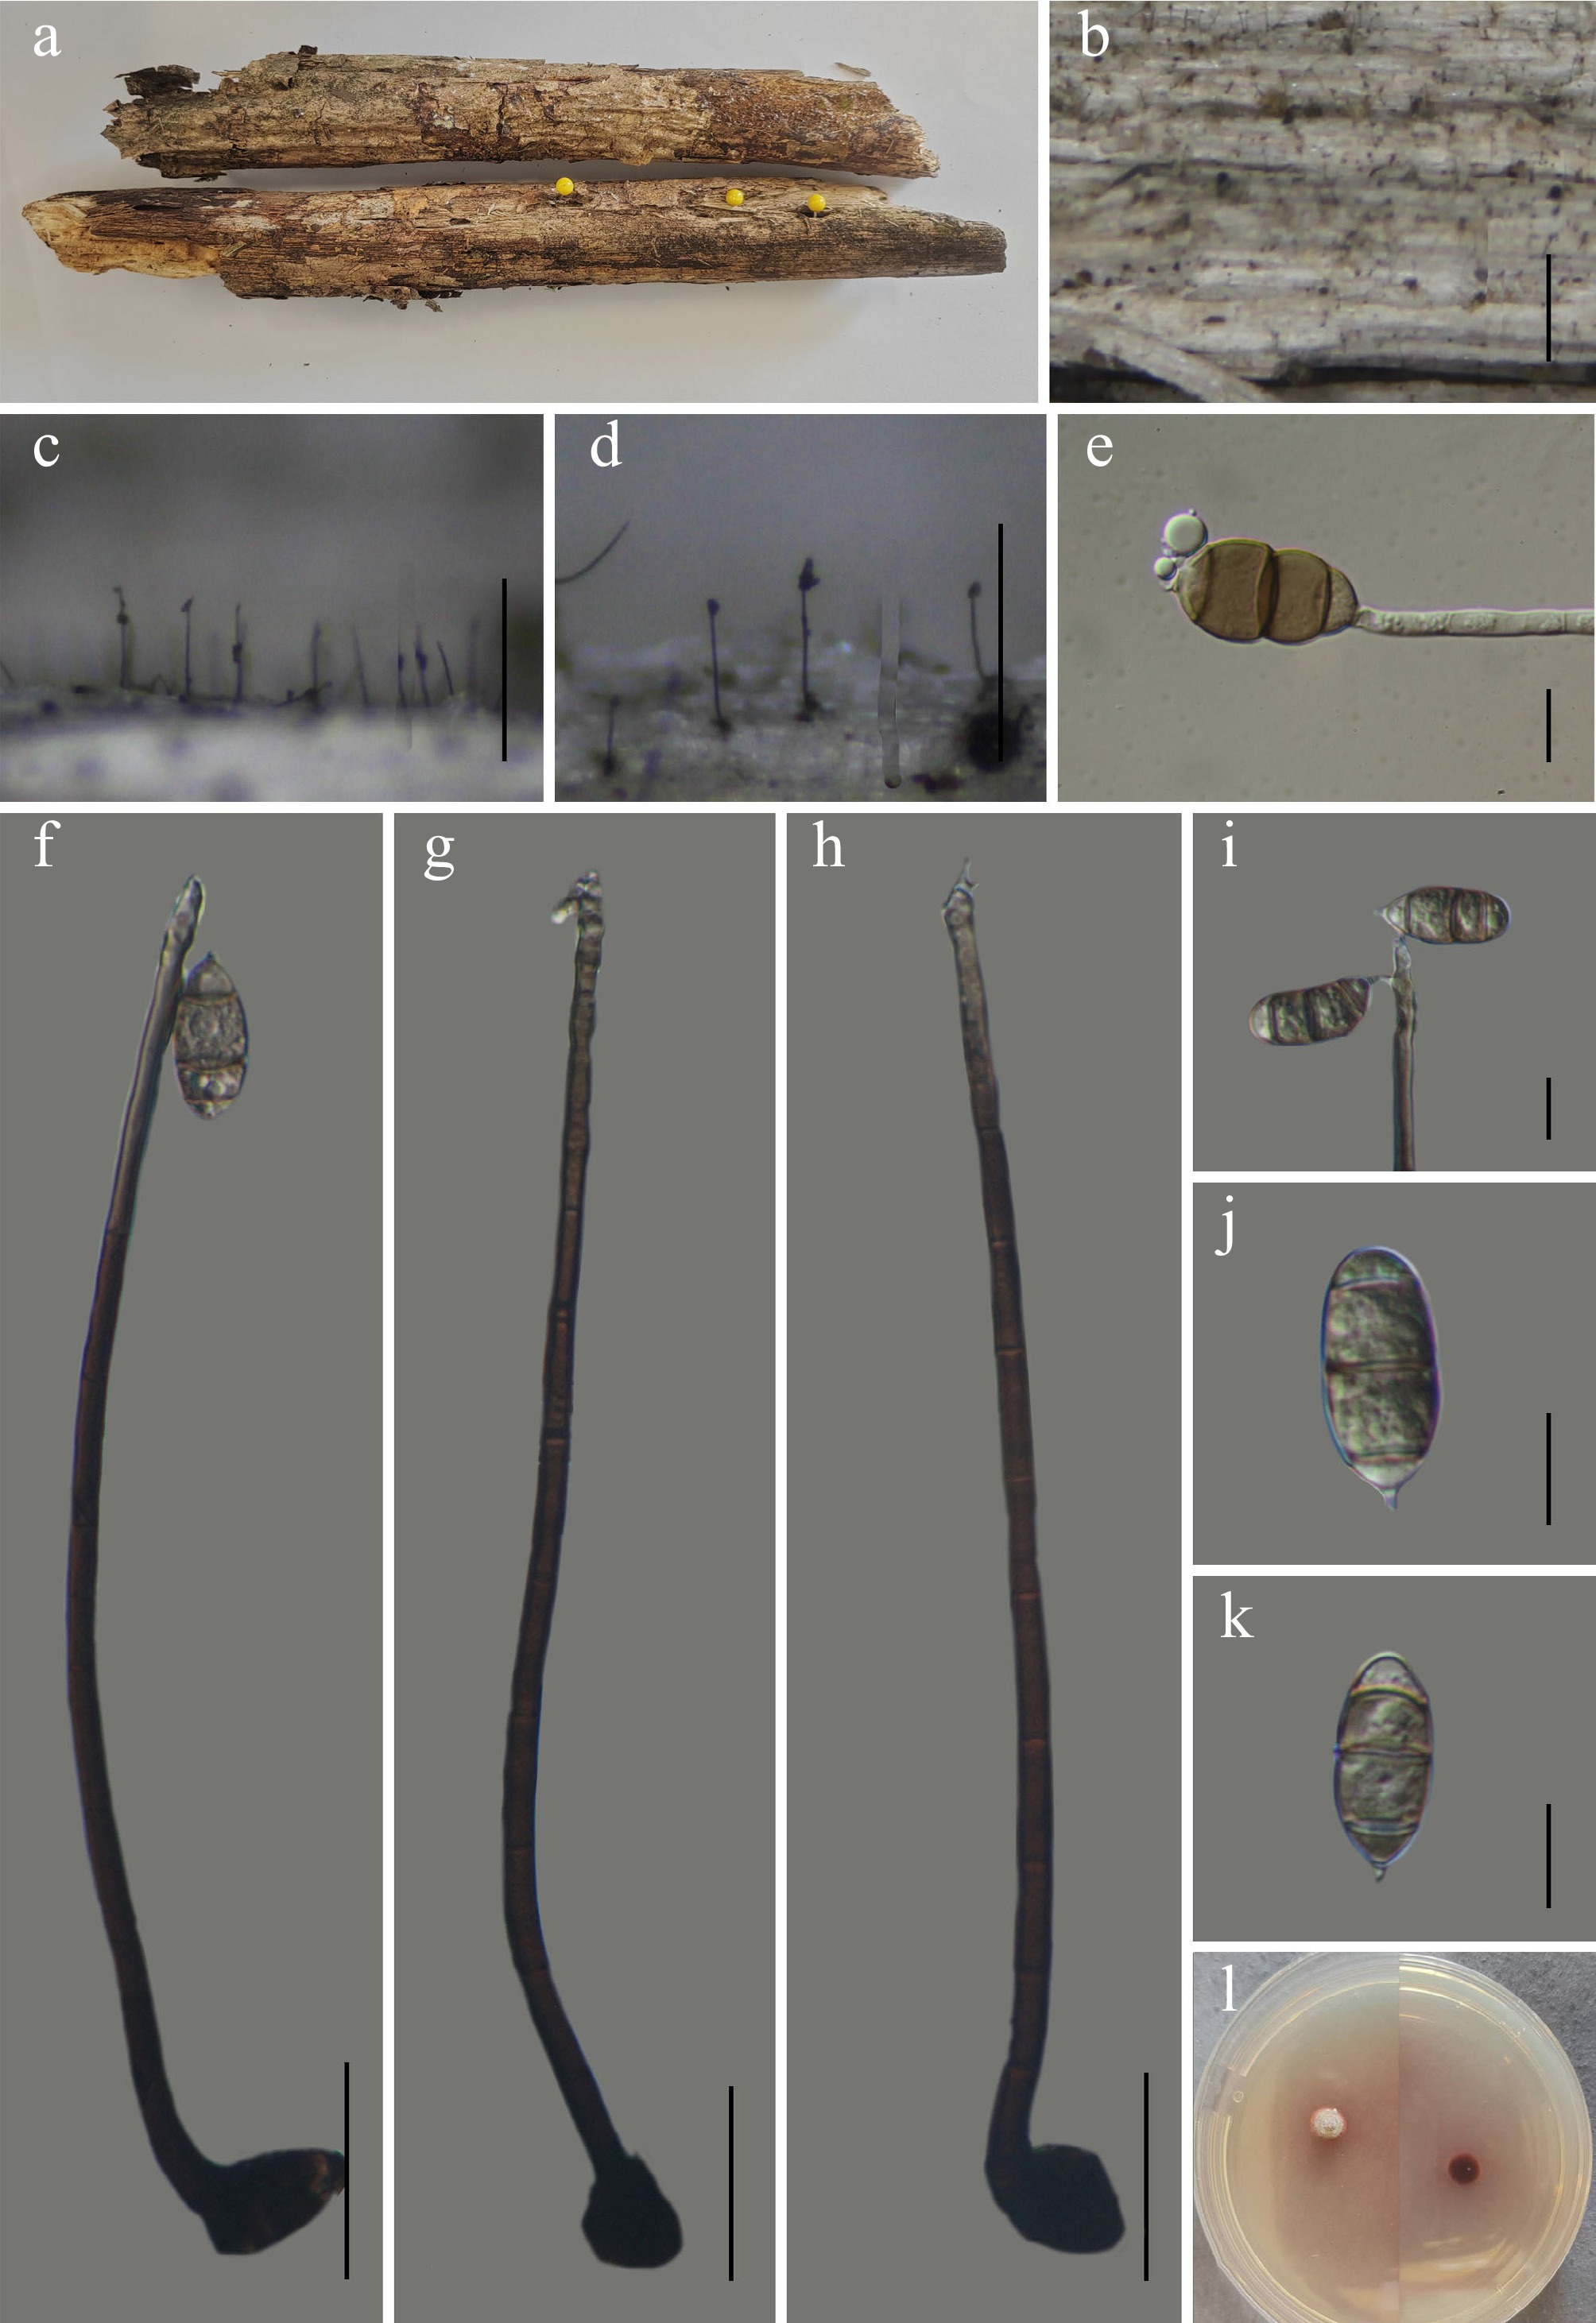
Figure 61.
Brachysporium wumengshanense (GMB6947 holotype). (a) Host. (b)–(d) Colonies on natural substrate. (e) Germinating conidium. (f)–(h) Conidiophores and conidia. (i) Conidiogenous cells and conidia. (j)–(k) Conidia. (l) Surface and reverse view of culture on PDA. Scale bars: b = 1 mm, c, d = 0.5 mm, f–h = 30 μm, e, i–k = 10 μm.
-
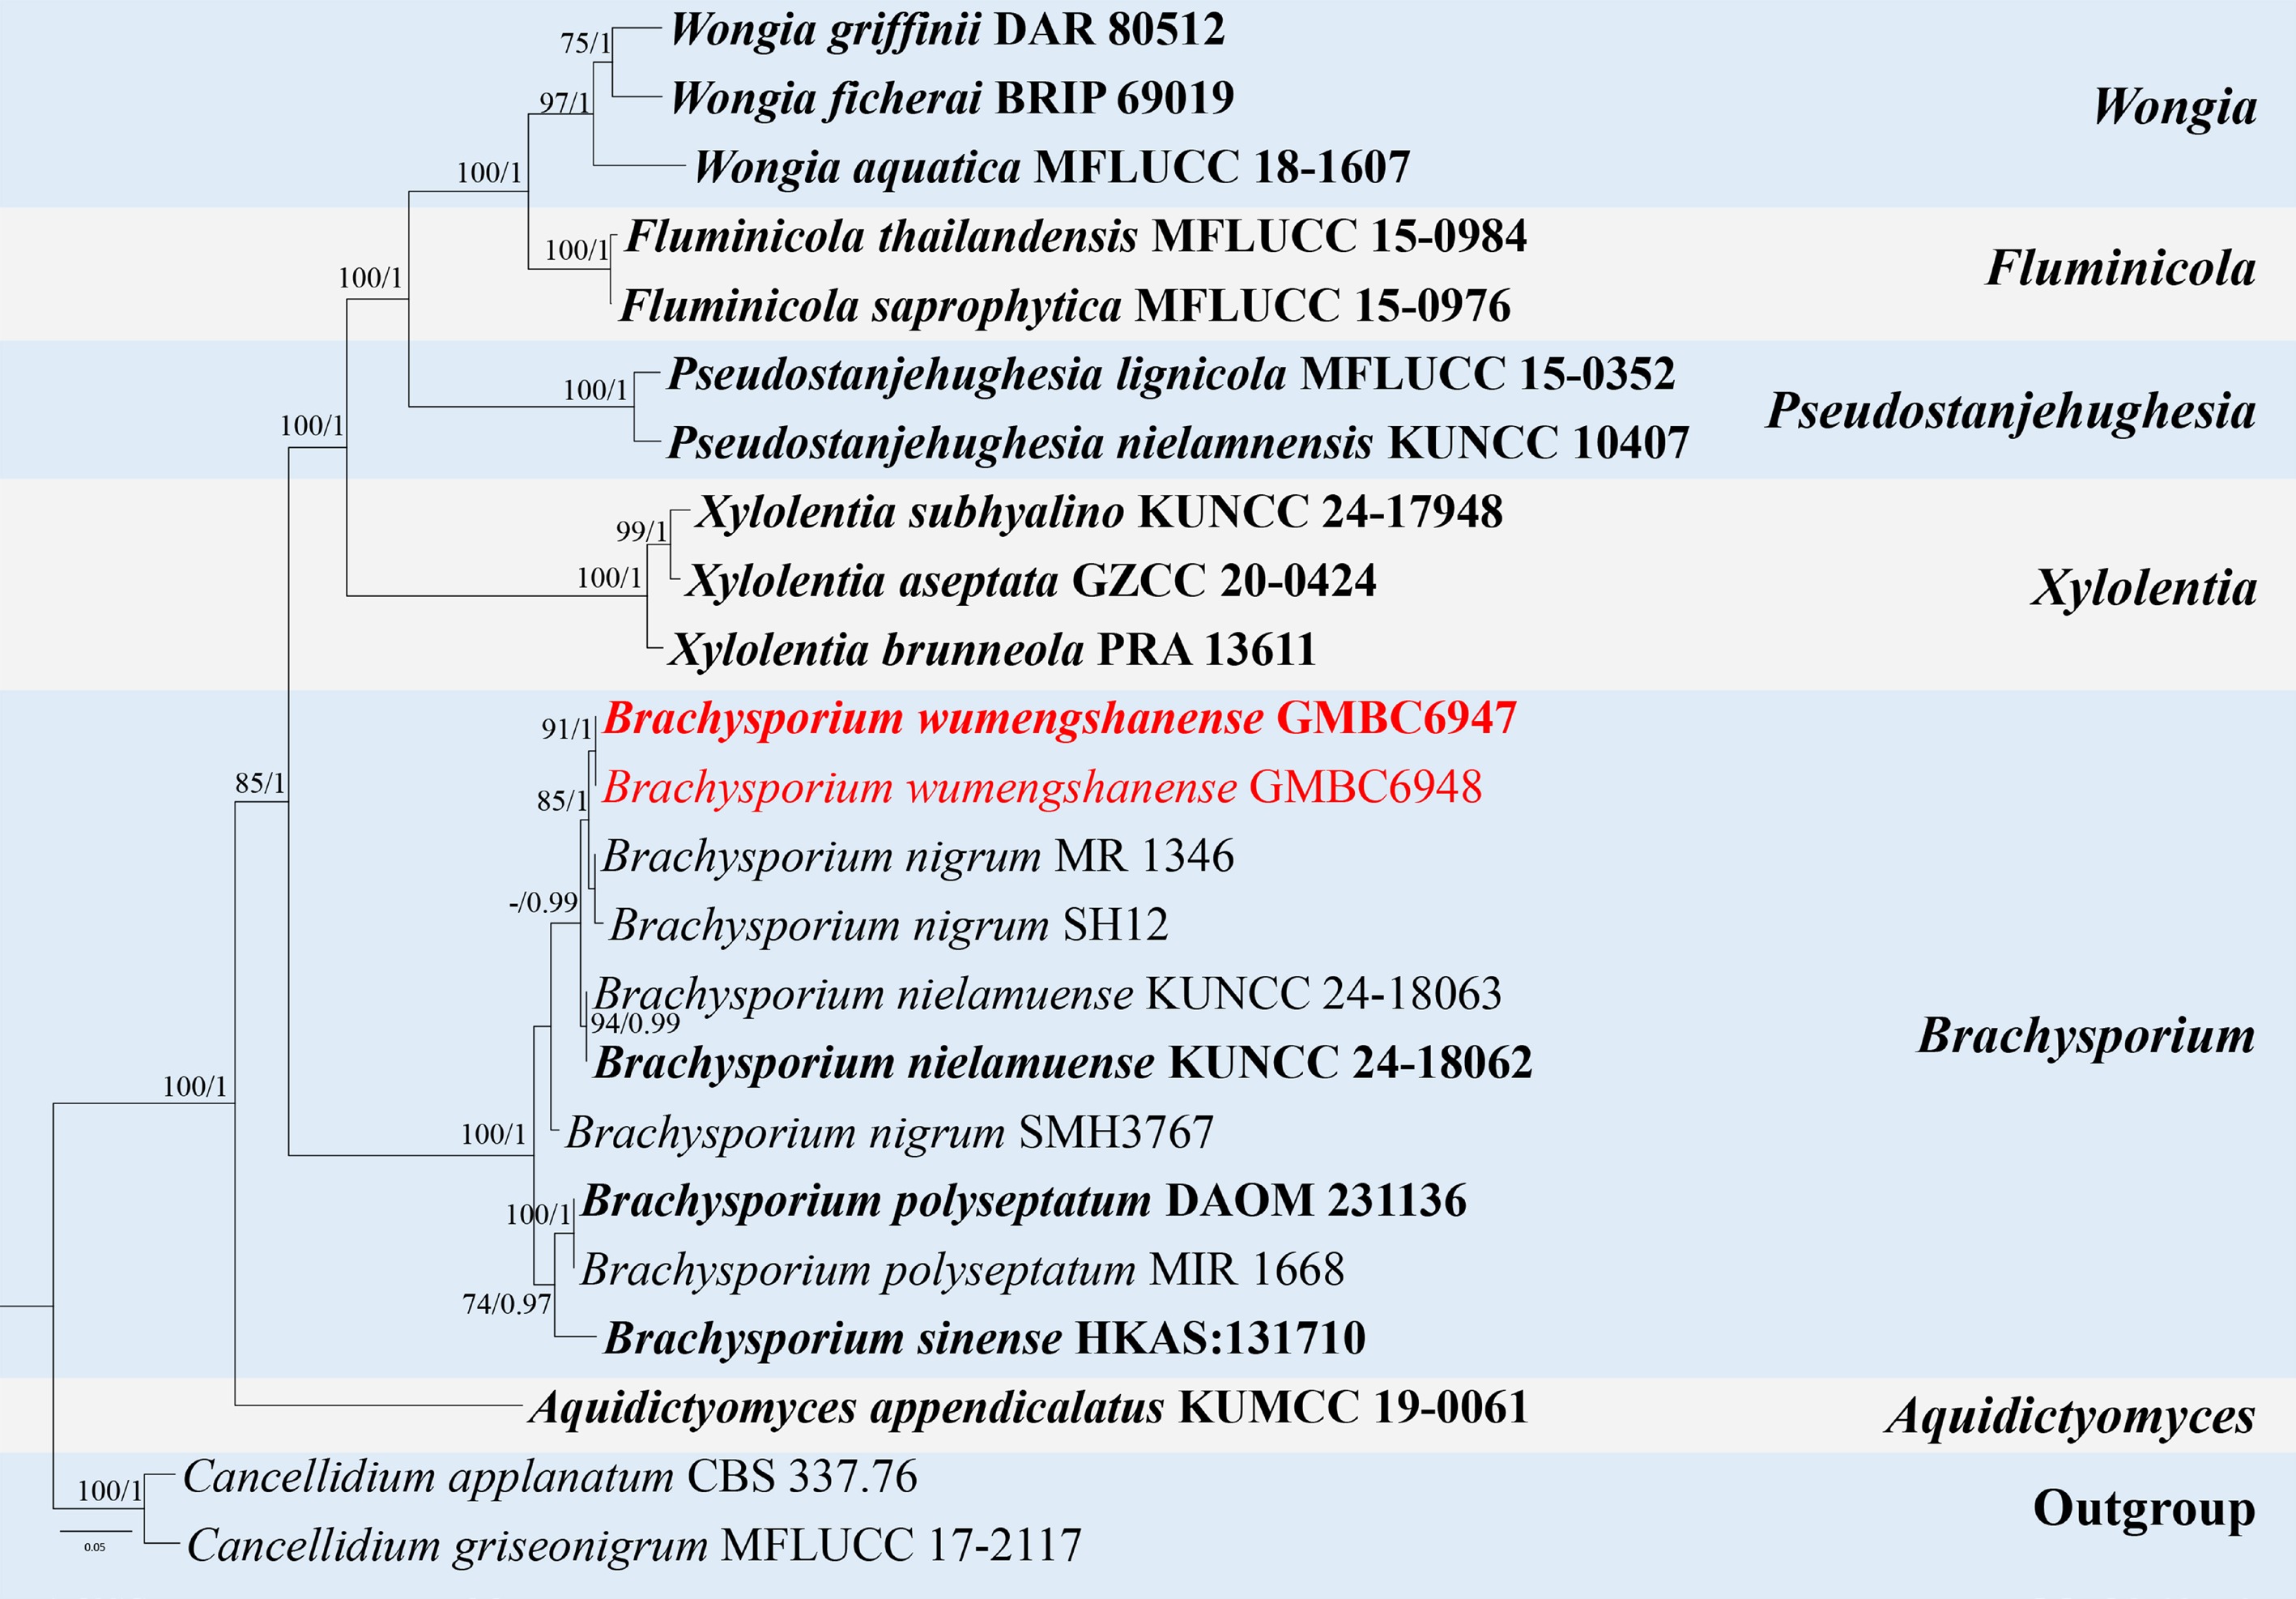
Figure 62.
ML tree of selected species of Brachysporium and related genera inferred from a combined ITS-LSU-rpb2 dataset. The combined dataset comprised 23 taxa, 2,531 characters (ITS: 1–513 bp; LSU: 514–1,388 bp; rpb2: 1,389–2,531 bp), including indel regions. Maximum likelihood (lnL = –11,943.803387) and Bayesian analyses produced consistent tree topologies. Cancellidium griseonigrum (MFLUCC 17-2117) and C. applanatum (CBS 337.76) were selected as the outgroup taxa. Bayesian posterior probabilities (PP) ≥ 0.90 and RAxML bootstrap support values ≥ 70 % are shown on the branches. The novel species is marked in red and ex-type/type strains in bold.
-
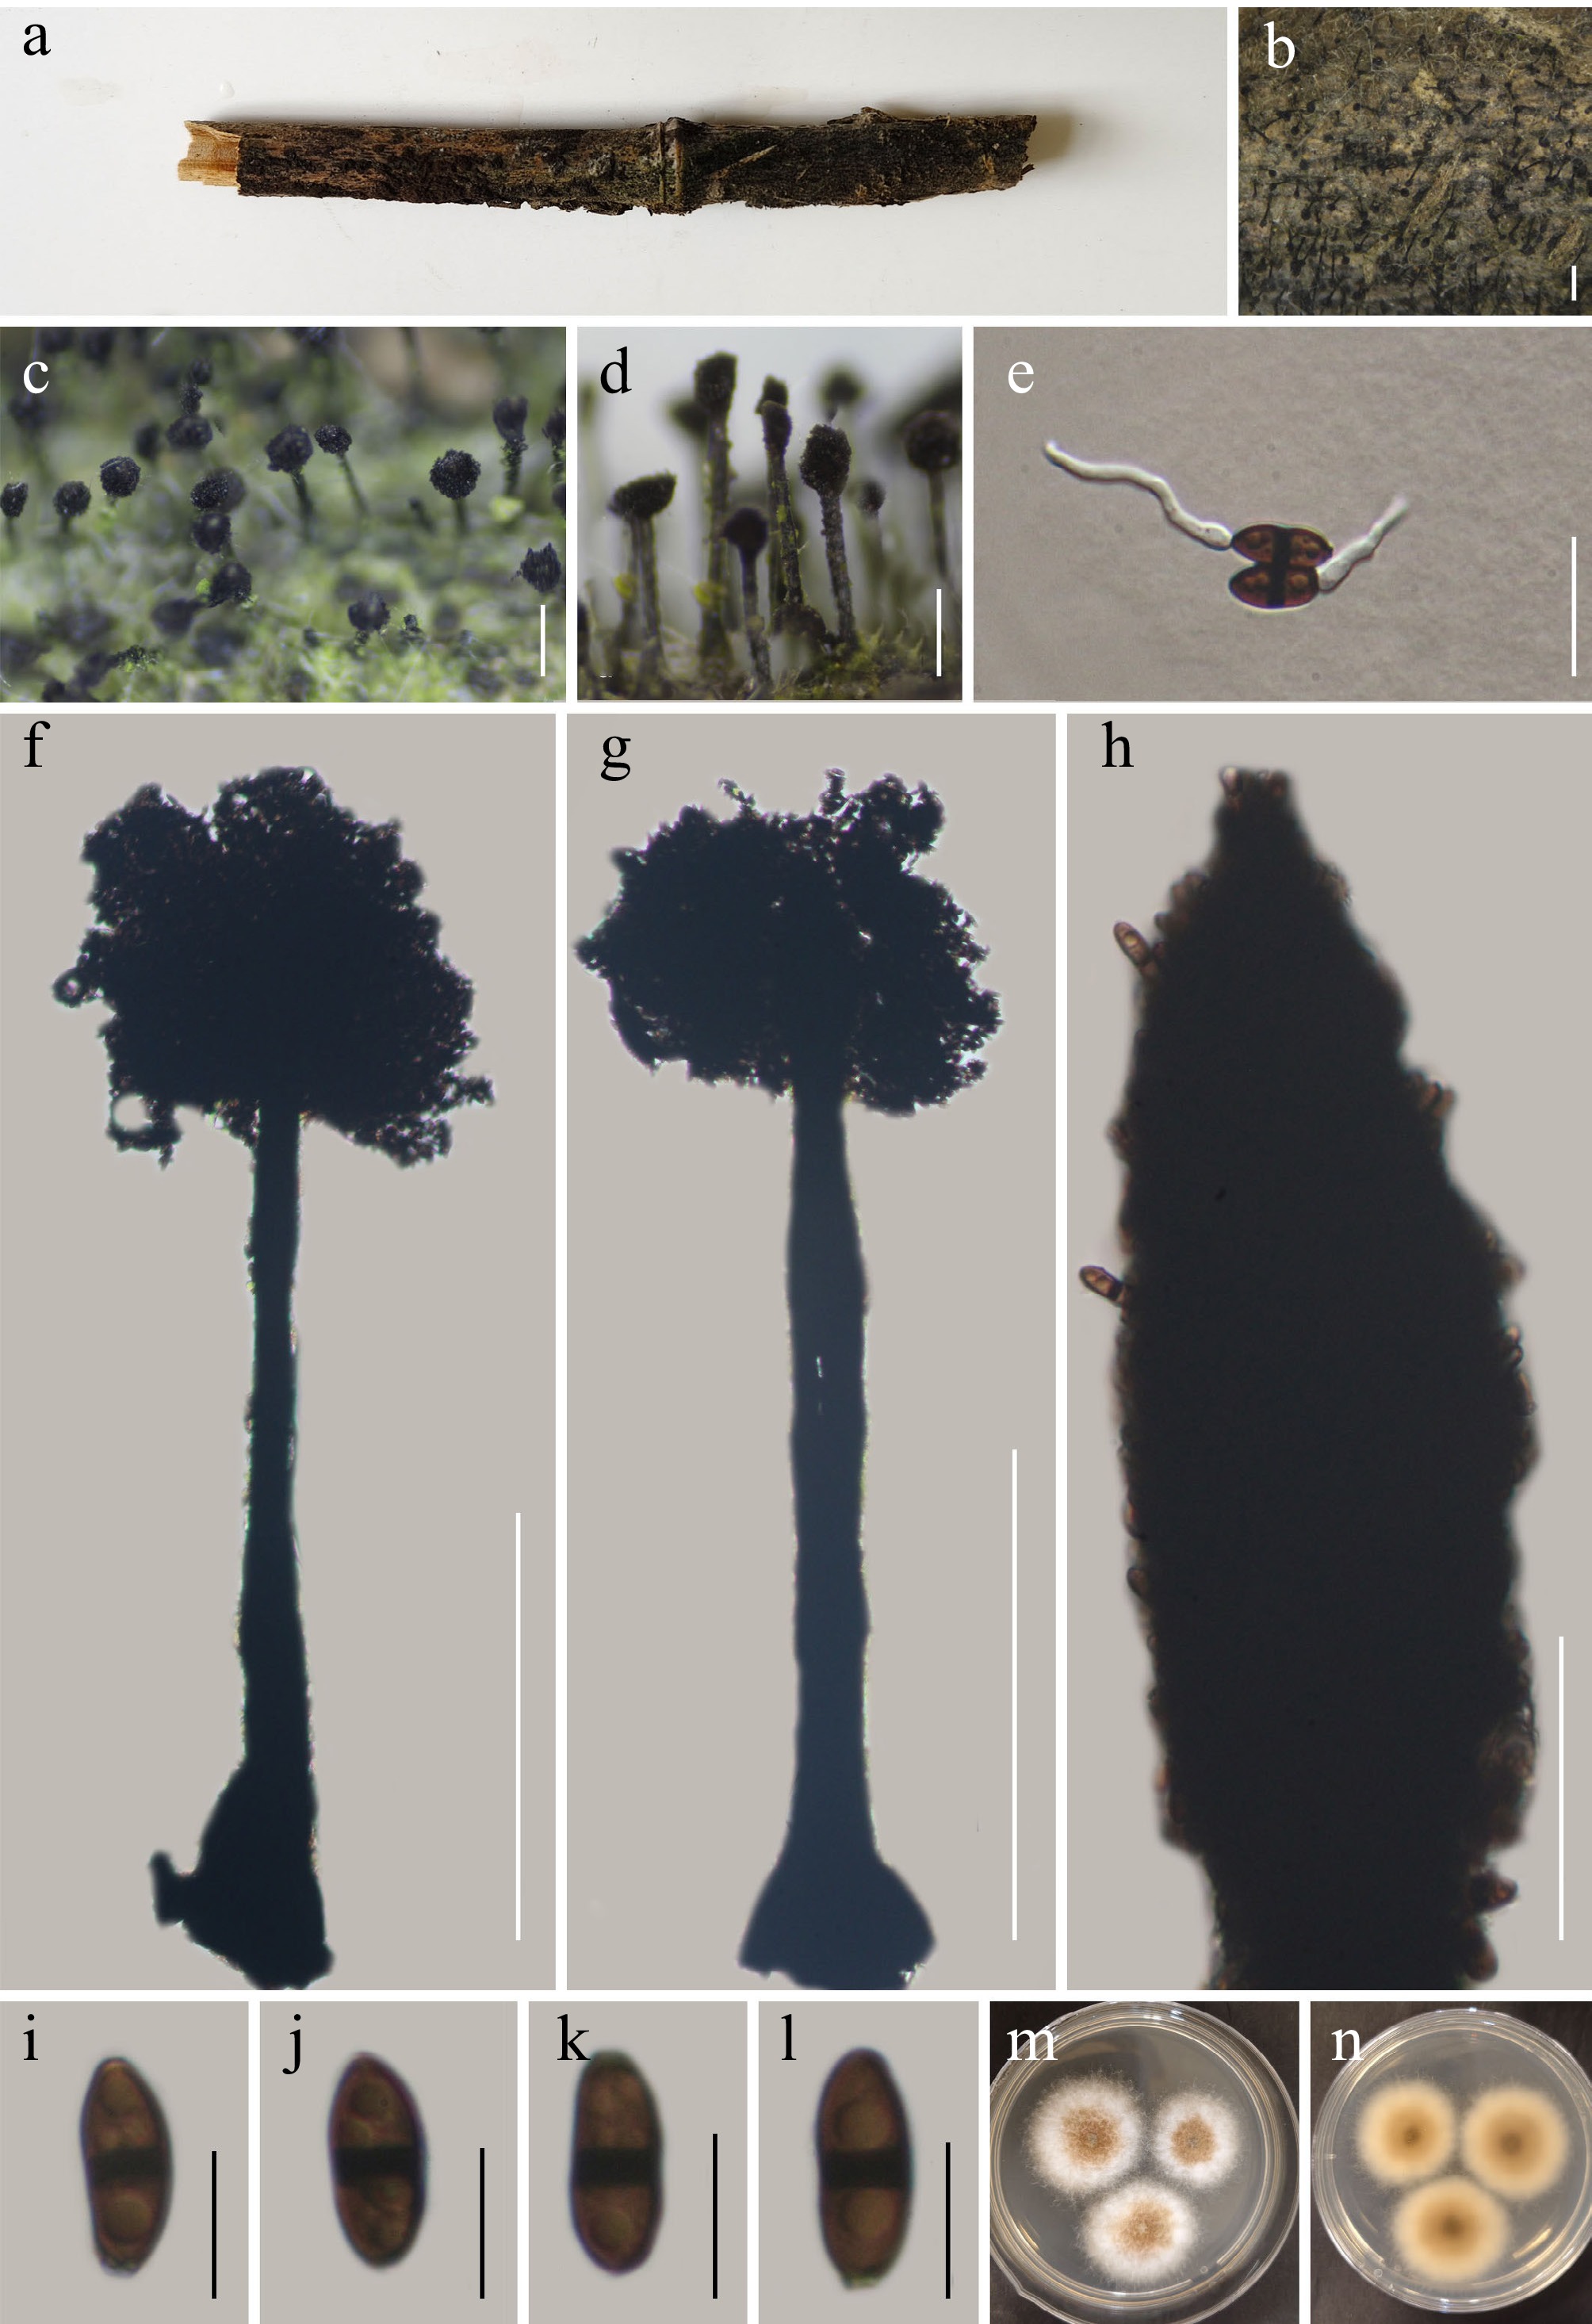
Figure 63.
Vamsapriya tongluobaensis (GMB5164). (a) Host. (b)–(d) Colonies on natural substrate. (e) Germinating conidia. (f), (g) Conidiophores and conidia. (h) Conidiogenous cells with conidia. (i)–(l) Conidia. (m), (n) Surface and reverse view of culture on PDA. Scale bars: b = 1 mm, c, d = 0.5 mm; f, g = 500 μm, e = 20 μm, i–l = 10 μm.
-
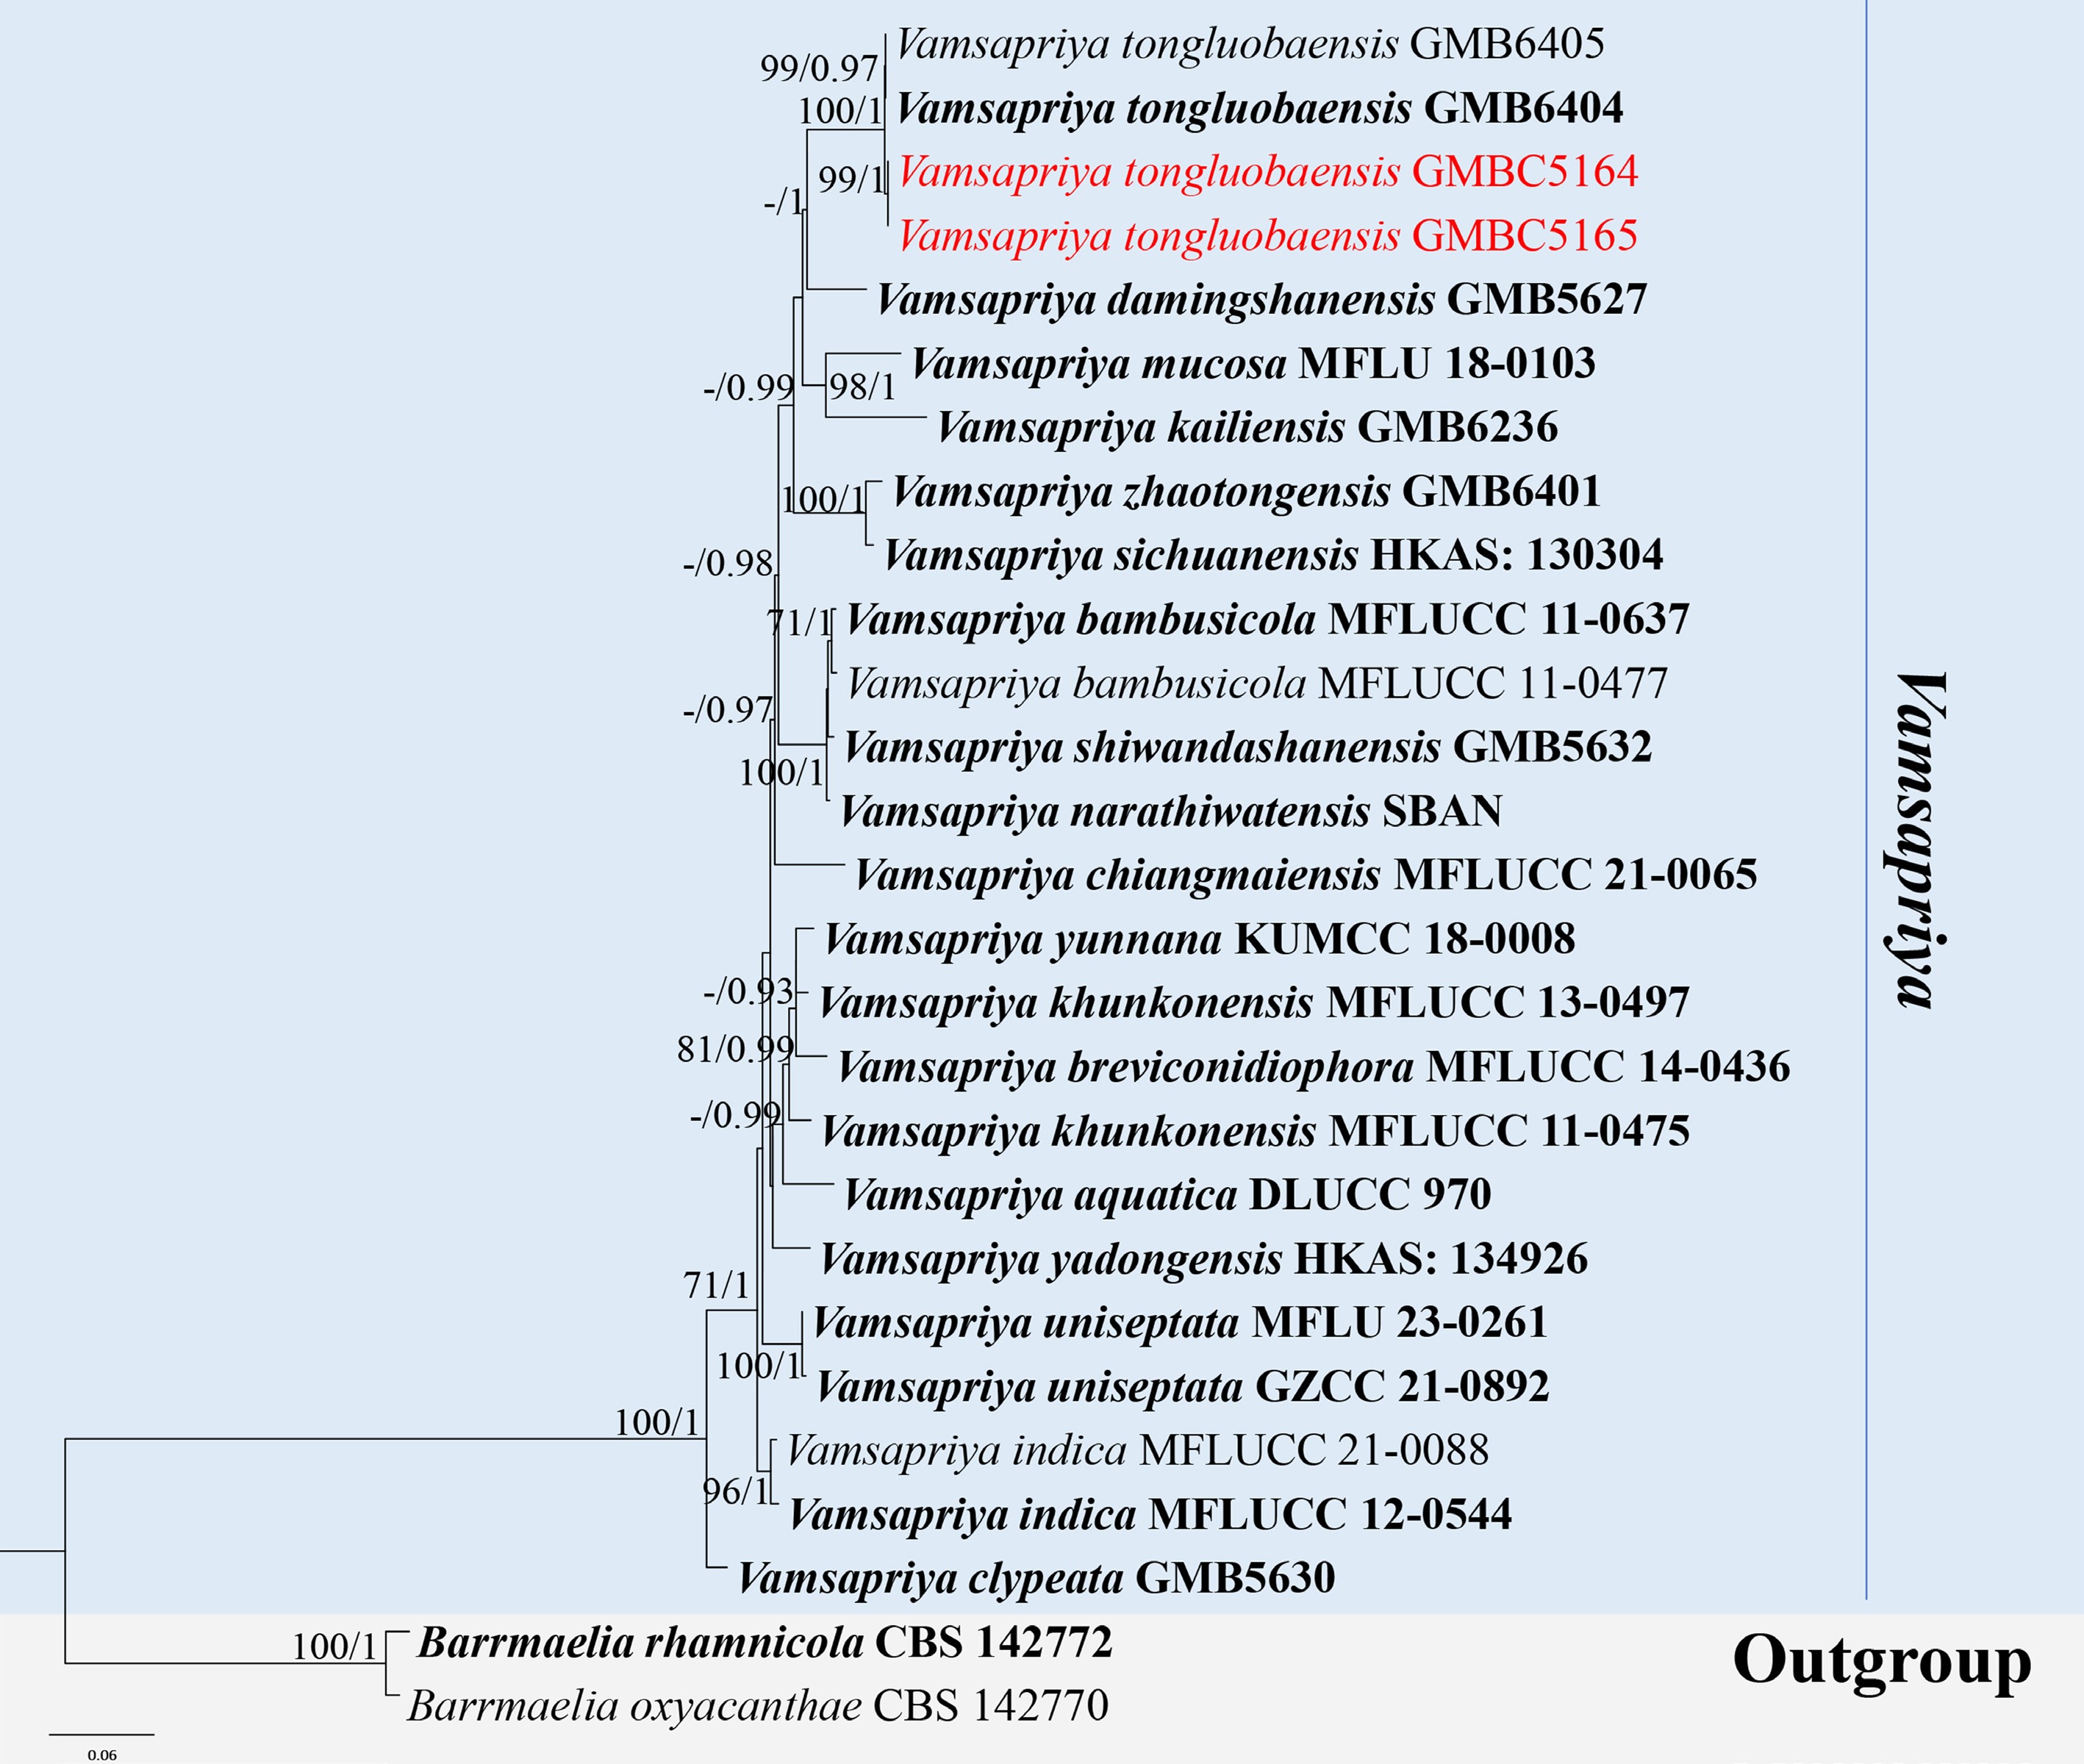
Figure 64.
ML tree of selected Vamsapriya species based on the ITS-LSU-SSU-rpb2-tub2 dataset. The combined dataset comprised 27 taxa, 2,947 characters (ITS: 1–535 bp; LSU: 536–1,406 bp; rpb2: 1,407–2,483 bp; tub2: 2,484–2,947 bp) including indel regions. Maximum likelihood (lnL = −10,545.792640) and Bayesian analyses produced consistent tree topologies. Barrmaelia oxyacanthae (CBS 142770) and B. rhamnicola (CBS 142772) were selected as the outgroup taxon. Bayesian posterior probabilities (PP) ≥ 0.90 and RAxML bootstrap support values ≥ 70 % are shown on the branches. The new strains are marked in red. Ex-type/type strains are indicated in bold.
Figures
(64)
Tables
(0)