-
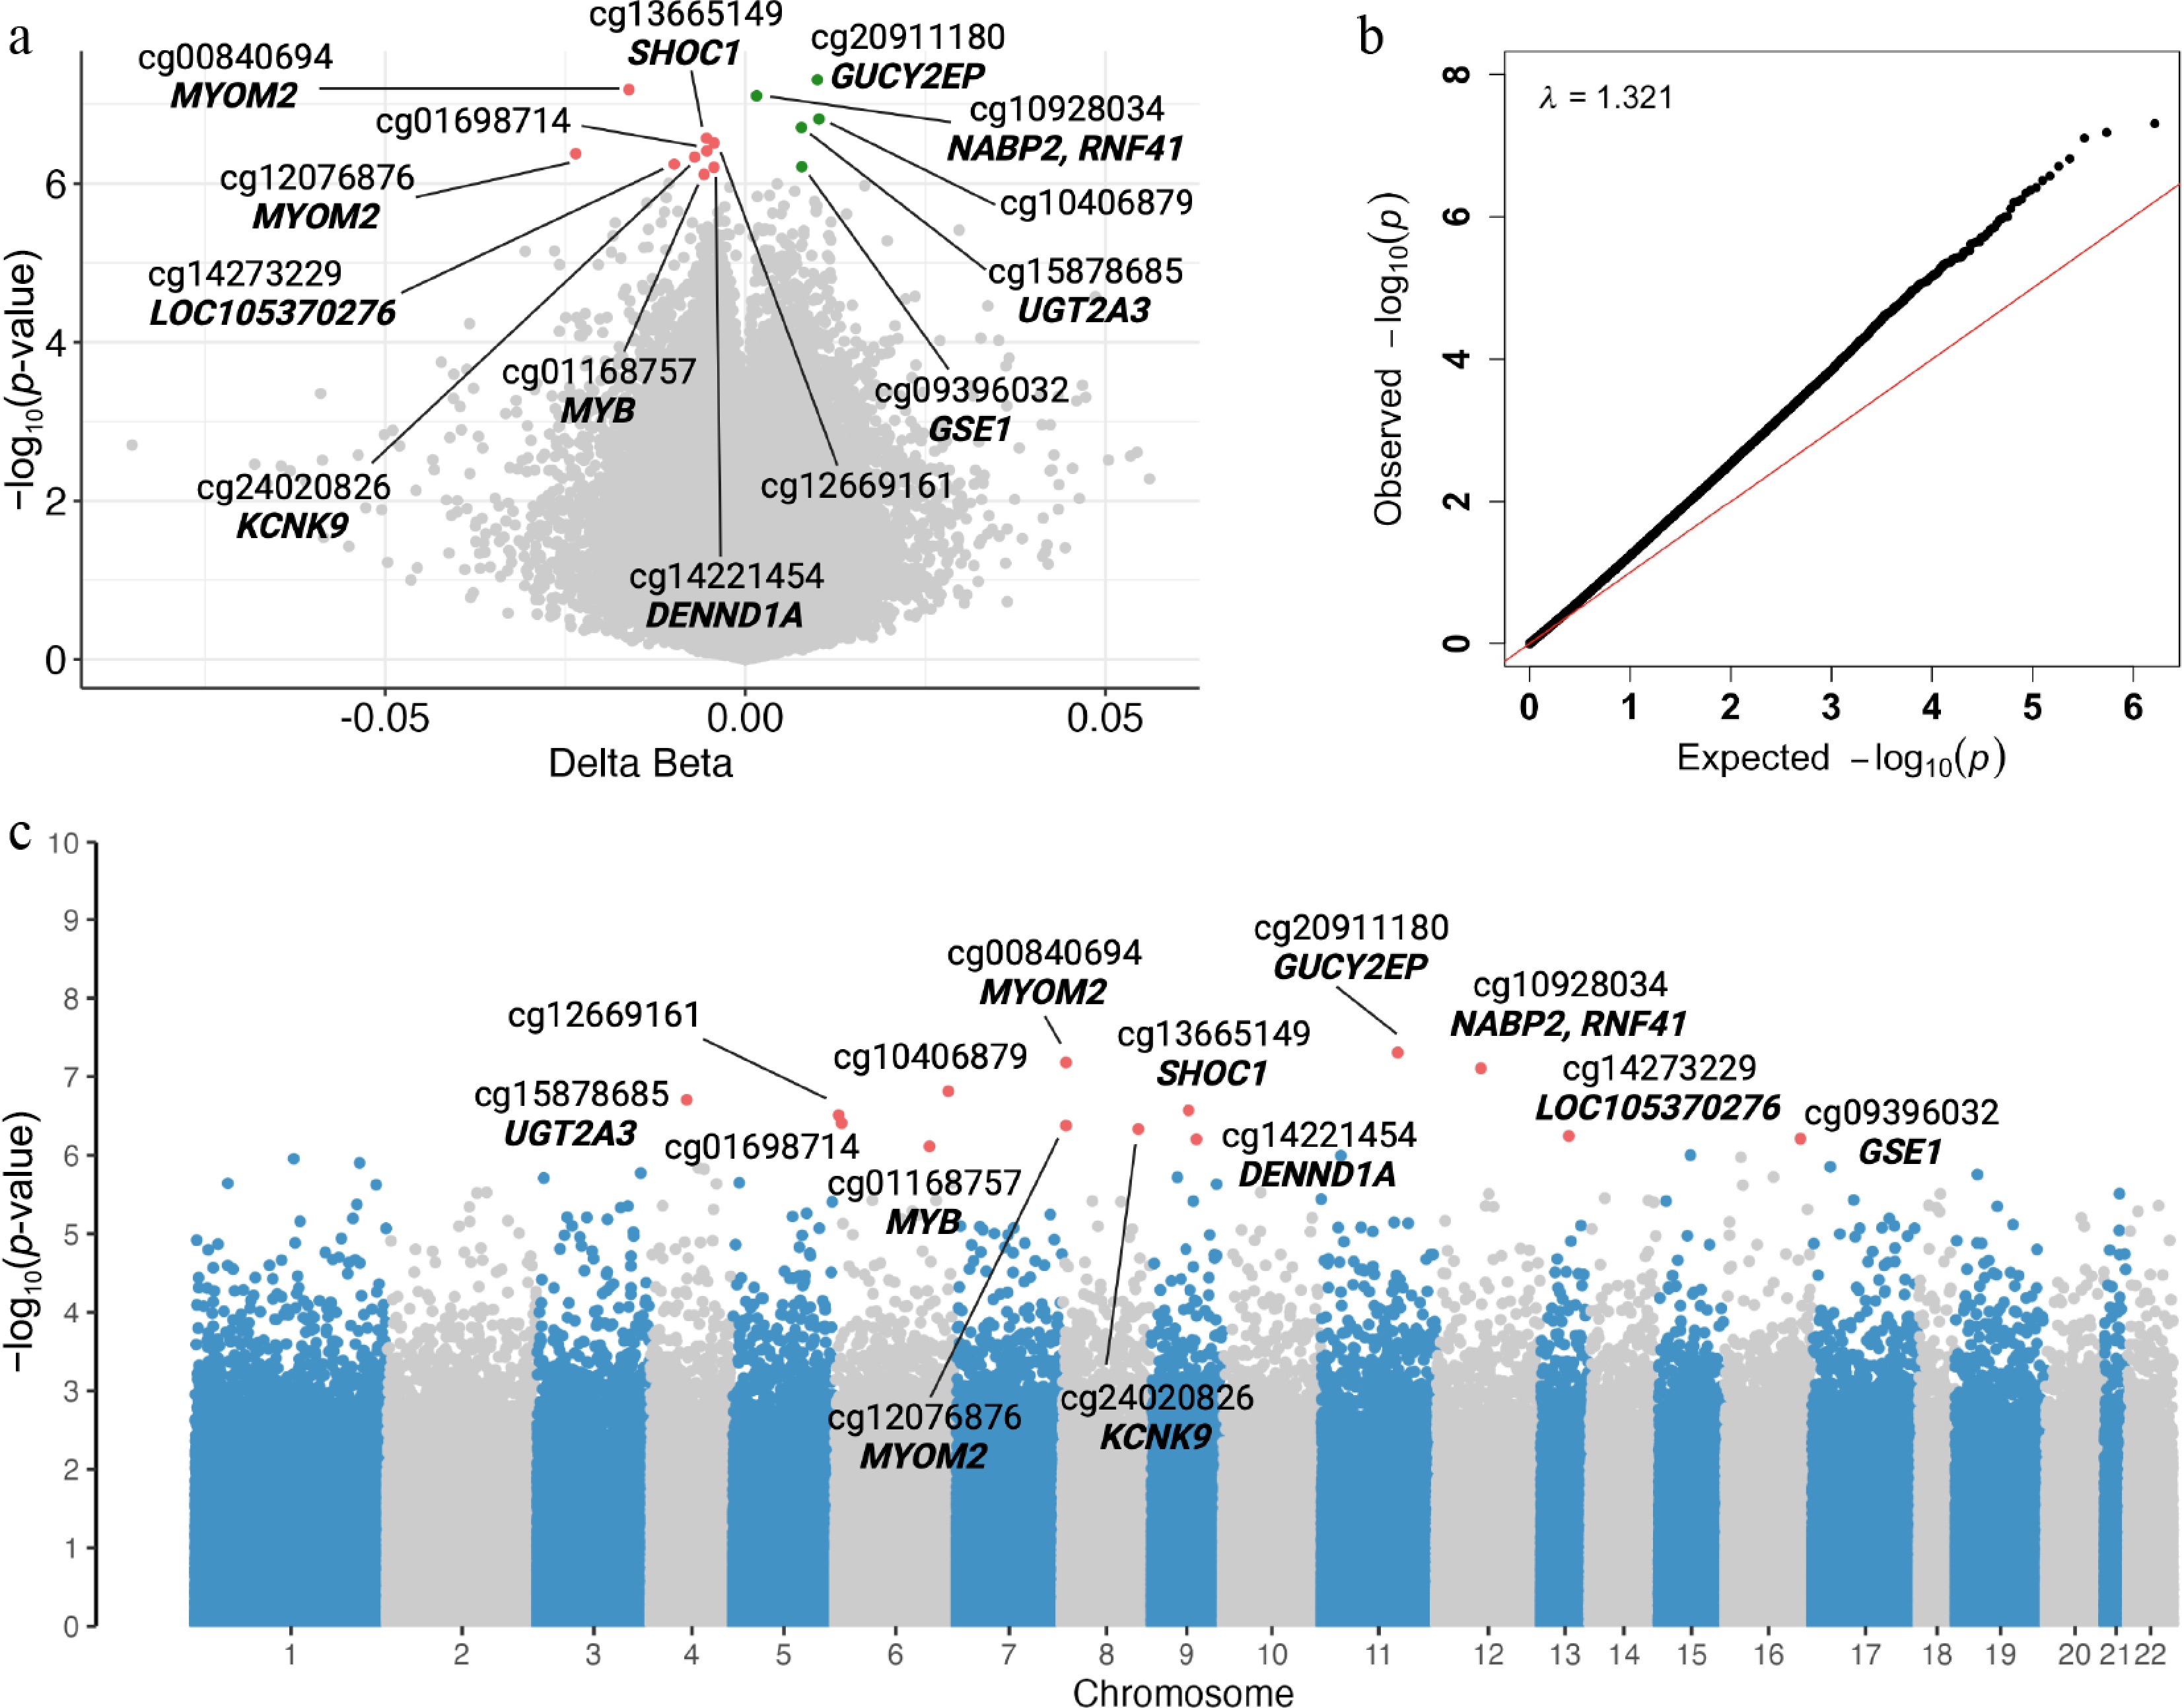
Figure 1.
Maternal differentially methylated CpGs associated with SGA. Volcano plot (a) showing hypomethylated (left) and hypermethylated (right) DMPs. CpG sites surpassing the FDR threshold are depicted in red or green, whereas nonsignificant CpGs appear in gray. QQ plot (b) illustrating the distribution of p-values and the calculated genomic inflation factor (λ). Manhattan plot (c) displaying the genomic position of each DMP, with statistically significant sites highlighted in red. Gene and CpG annotations are shown.
-
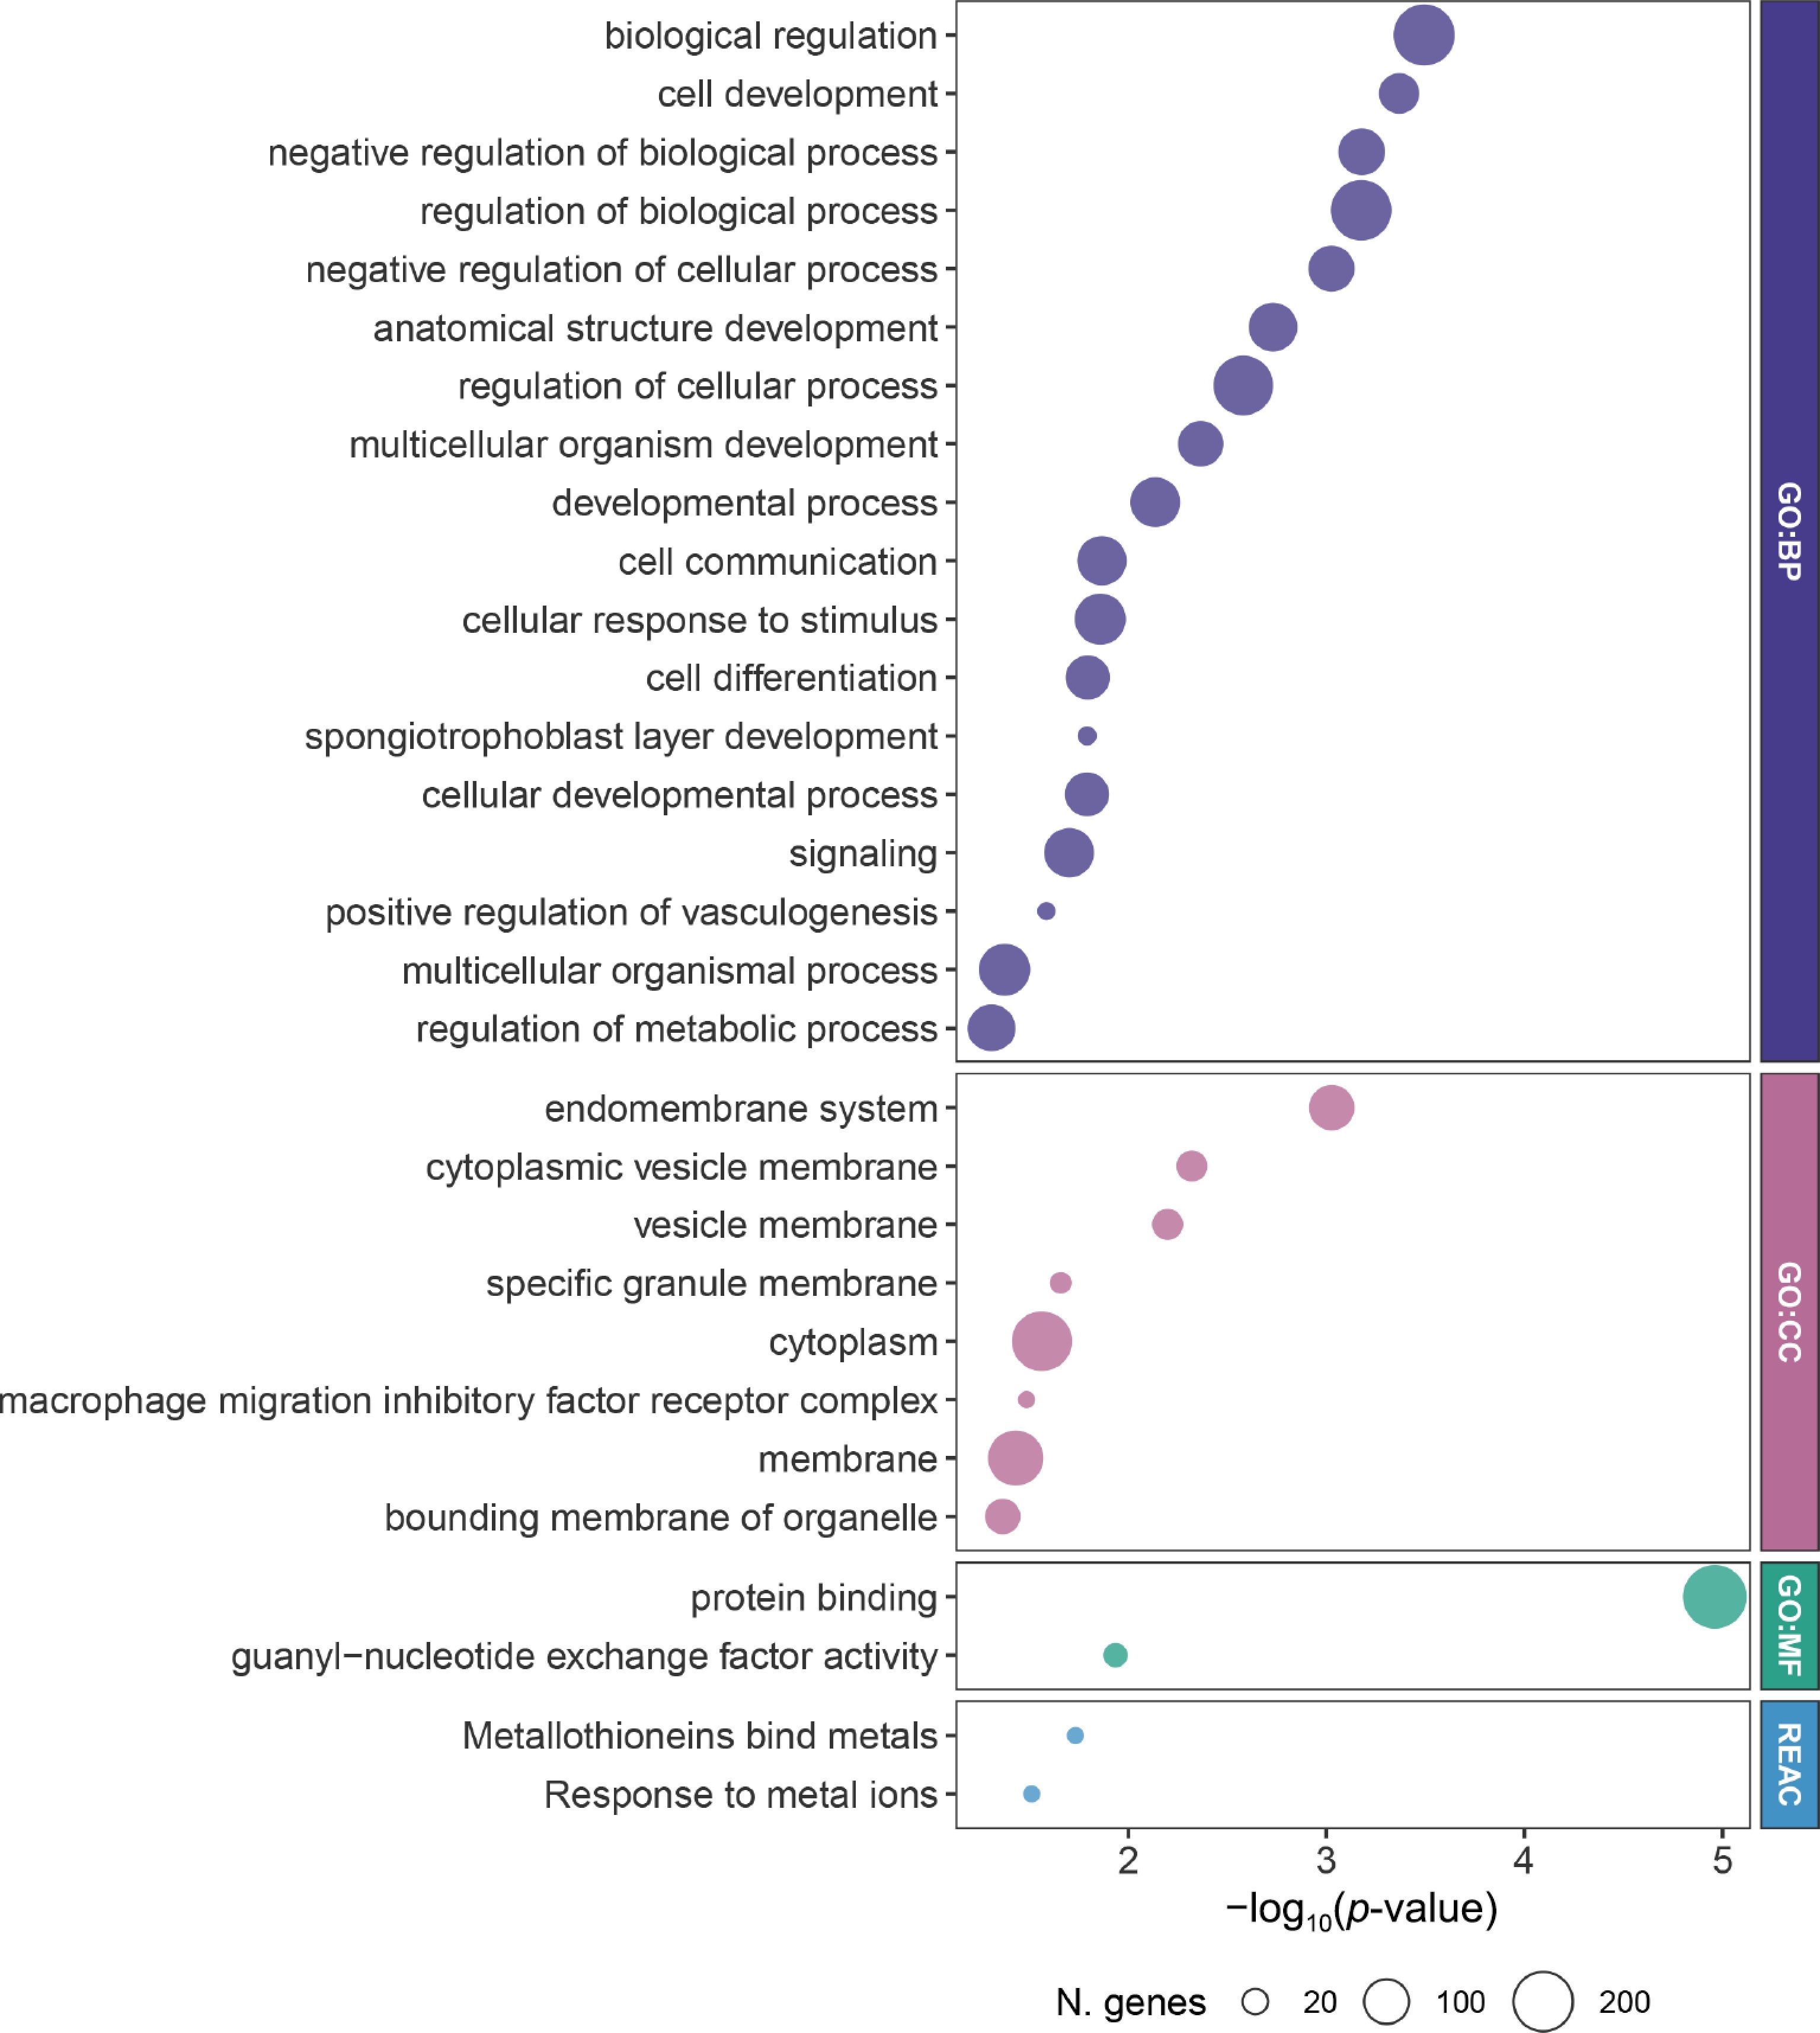
Figure 2.
Pathway enrinchemnt enrichment analysis of DMP-associated genes. Bubble plots display the top enriched GO biological process (GO:BP), cellular components (GO:CC), molecular functions (GO:MF), and REACTOME (REACT) terms derived from DMP-annotated genes. The x-axis represents the enrichment significance (−log10[p-value]). Bubble size indicates the number of genes contributing to each term.
-
Total (n = 931) SGA (n = 133) AGA (n = 798) p-value Maternal Age 0.201[1] Mean (SD) 23.46 (5.33) 22.85 (4.87) 23.56 (5.40) Smoked during pregnancy 0.017[2] No 832 (100.0%) 111 (13.3%) 721 (86.7%) Yes 99 (100.0%) 22 (22.2%) 77 (77.8%) Education 0.069[2] High school or less 397 (100.0%) 59 (14.9%) 338 (85.1%) Some college or college degree 469 (100.0%) 71 (15.1%) 398 (84.9%) Education beyond college 65 (100.0%) 3 (4.6%) 62 (95.4%) BMI 0.129[1] Mean (SD) 28.86 (7.90) 28.09 (8.18) 28.98 (7.85) Infants' sex 0.002[2] Female 460 (100.0%) 82 (17.8%) 378 (82.2%) Male 471 (100.0%) 51 (10.8%) 420 (89.2%)
Maternal age refers to the age at enrollment. College includes either college degree or some college experience. p-value refers to Wilcoxon's rank sum test (1) or Pearson's χ2 test (2). SGA, small for gestational age; AGA, average for gestational age; SD, standard deviation; BMI, body mass index. Table 1.
Demographic characteristics of pregnant Black participants.
-
CpG ID Position Gene Symbol Δβ p-value FDR p-value cg20911180 chr11: 76,700,751 GUCY2EP 0.010 4.94E-08 0.021 cg00840694 chr8: 2,046,459 MYOM2 −0.016 6.59E-08 0.021 cg10928034 chr12: 56,224,331 NABP2, RNF41 0.002 7.85E-08 0.021 cg10406879 chr6: 165,091,497 0.010 1.54E-07 0.031 cg15878685 chr4: 68,953,138 UGT2A3 0.008 1.97E-07 0.032 cg13665149 chr9: 111,794,787 SHOC1 −0.005 2.69E-07 0.036 cg12669161 chr6: 3,170,598 −0.004 3.09E-07 0.036 cg01698714 chr6: 6,678,738 −0.005 3.89E-07 0.038 cg12076876 chr8: 2 046,264 MYOM2 −0.024 4.20E-07 0.038 cg24020826 chr8: 139,617,937 KCNK9 −0.007 4.64E-07 0.038 cg14273229 chr13: 80,362,139 LOC105370276 −0.010 5.71E-07 0.039 cg09396032 chr16: 85,635,856 GSE1 0.008 6.16E-07 0.039 cg14221454 chr9: 123,584,783 DENND1A −0.004 6.27E-07 0.039 cg01168757 chr6: 135,173,257 −0.006 7.71E-07 0.045 Genomic positions are based on the GRCh38/hg38 human reference genome assembly. Δβ, delta beta; FDR, false discovery rate. Table 2.
Differentially methylated CpGs associated with SGA.
Figures
(2)
Tables
(2)