-
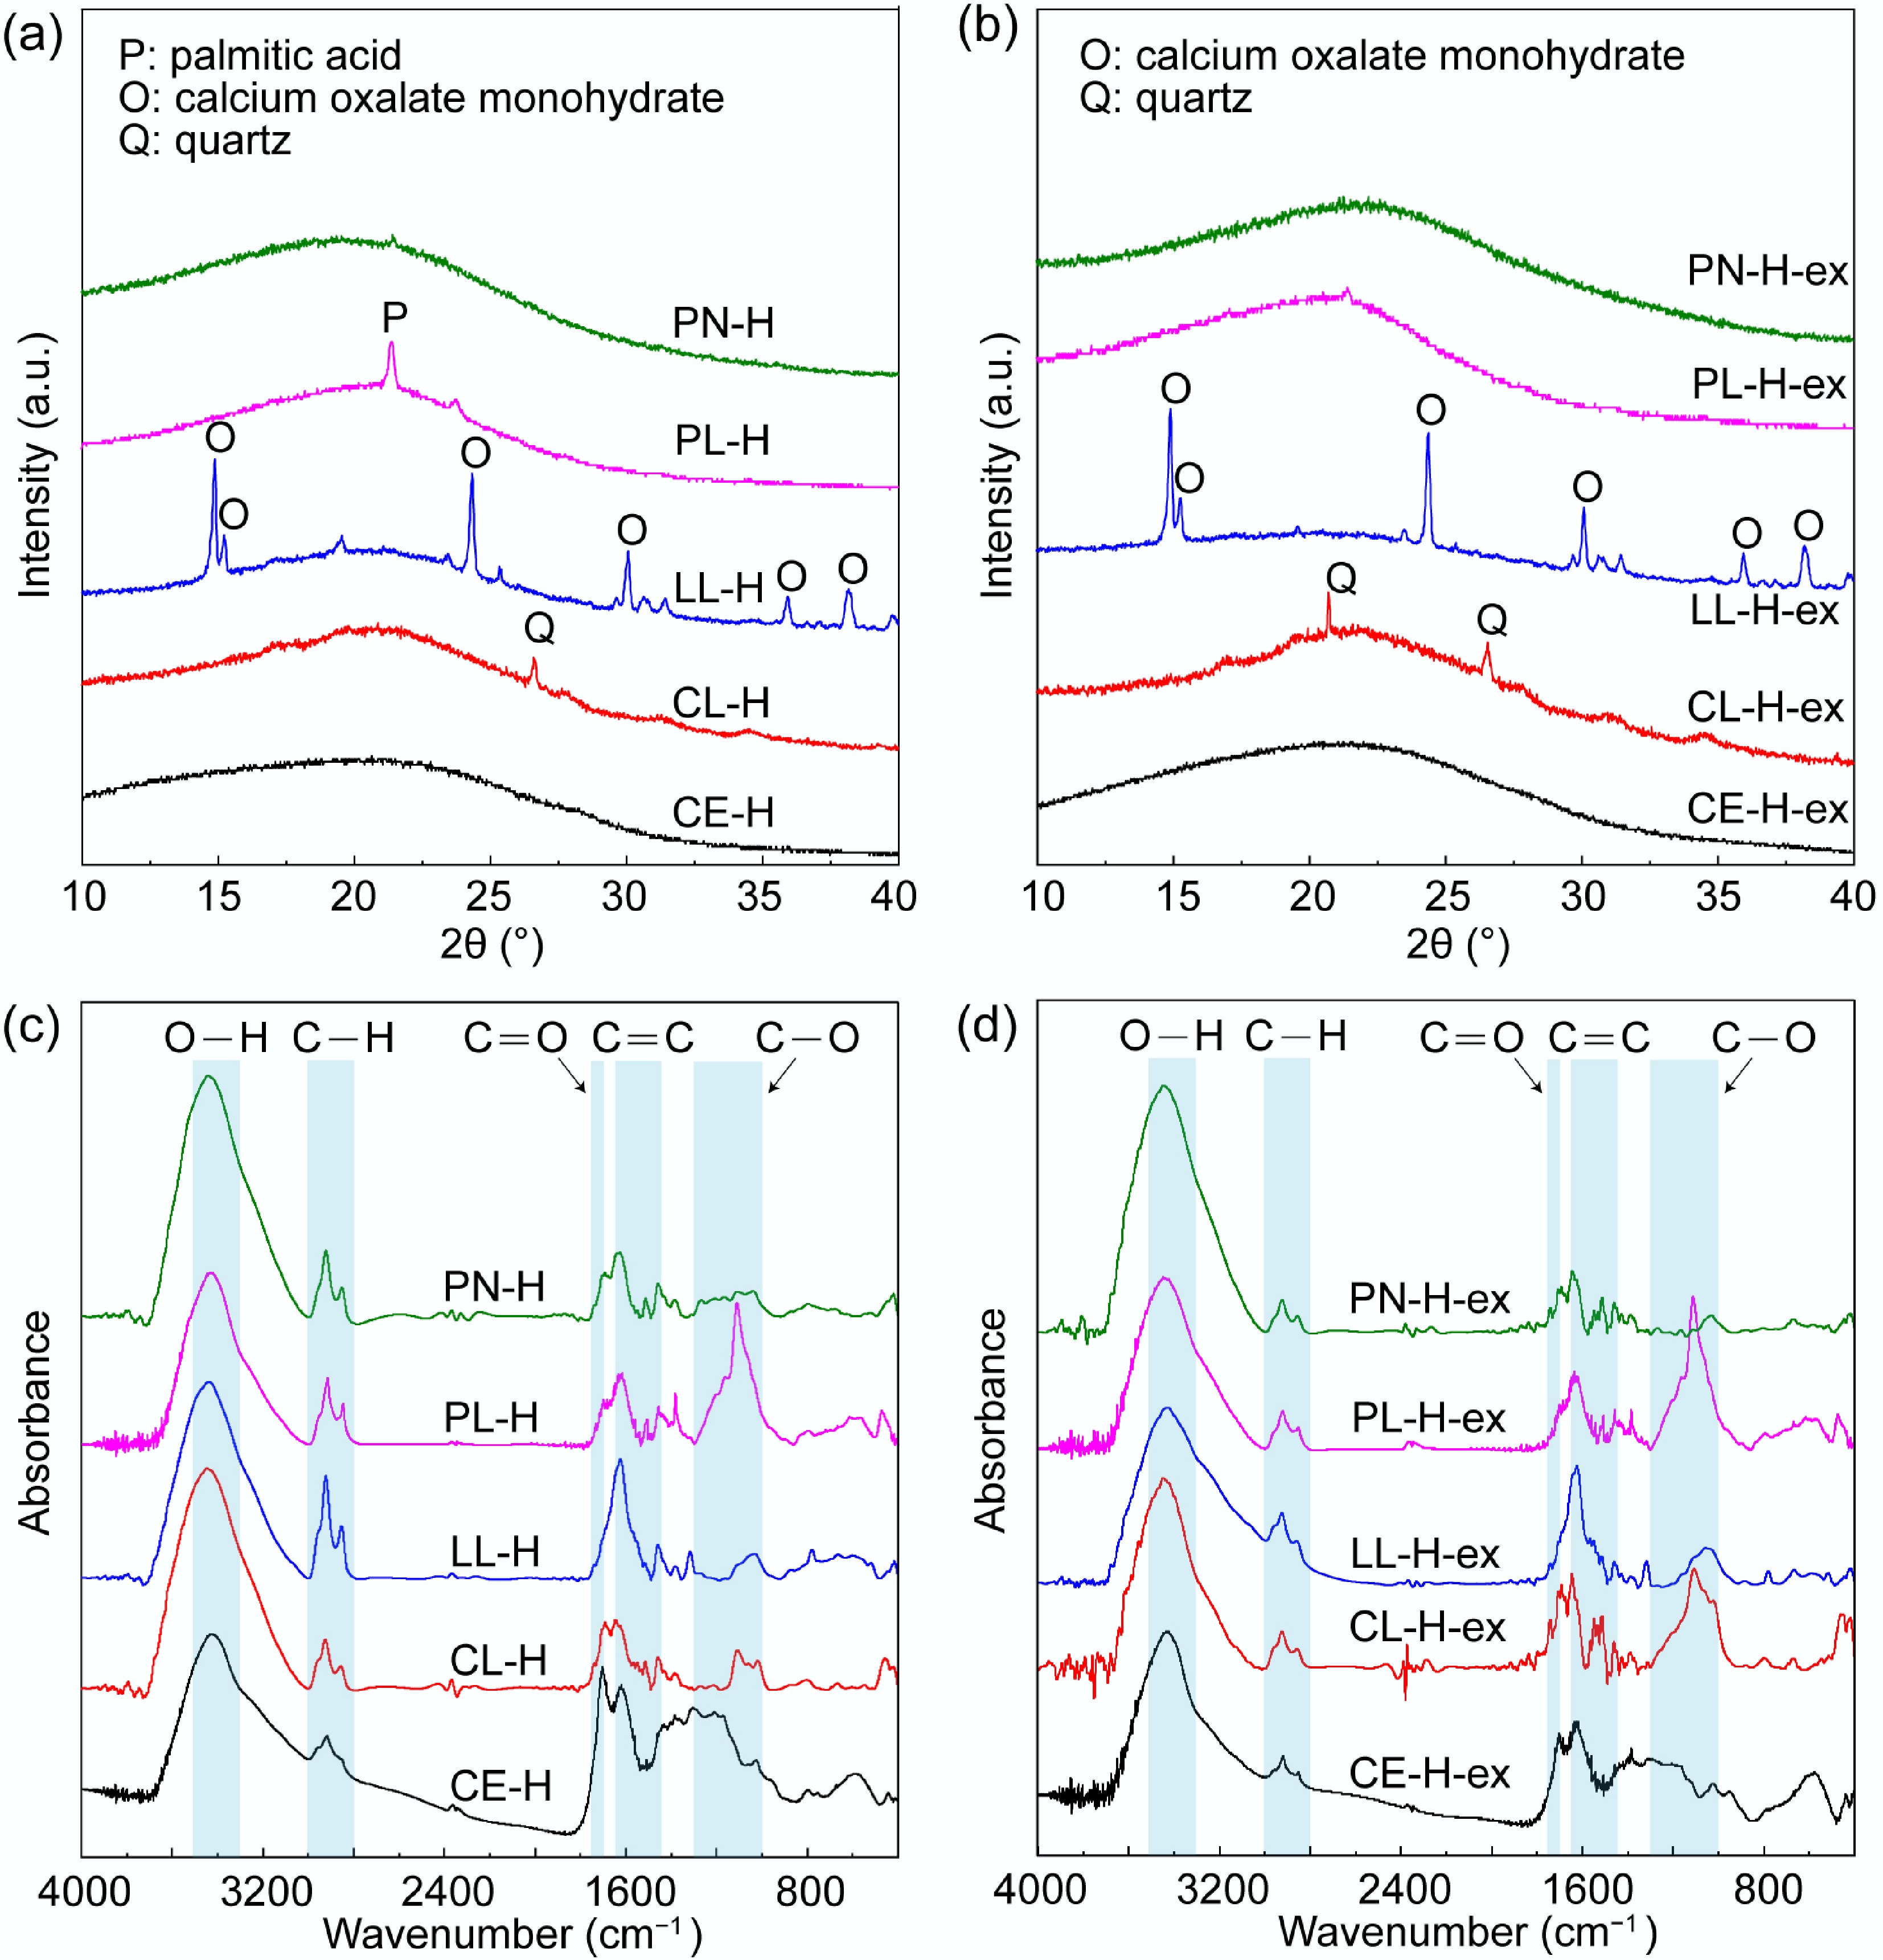
Figure 1.
(a), (b) XRD patterns and (c), (d) FTIR spectra of different hydrochar samples before (left column) and after (right column) acetone extraction. Abbreviation definitions: CE-H, CL-H, LL-H, PL-H, and PN-H represent unextracted hydrochar derived from cellulose, corn leaves, lotus leaves, palm leaves, and pine needles, respectively; CE-H-ex, CL-H-ex, LL-H-ex, PL-H-ex, and PN-H-ex correspond to acetone-extracted hydrochar samples.
-
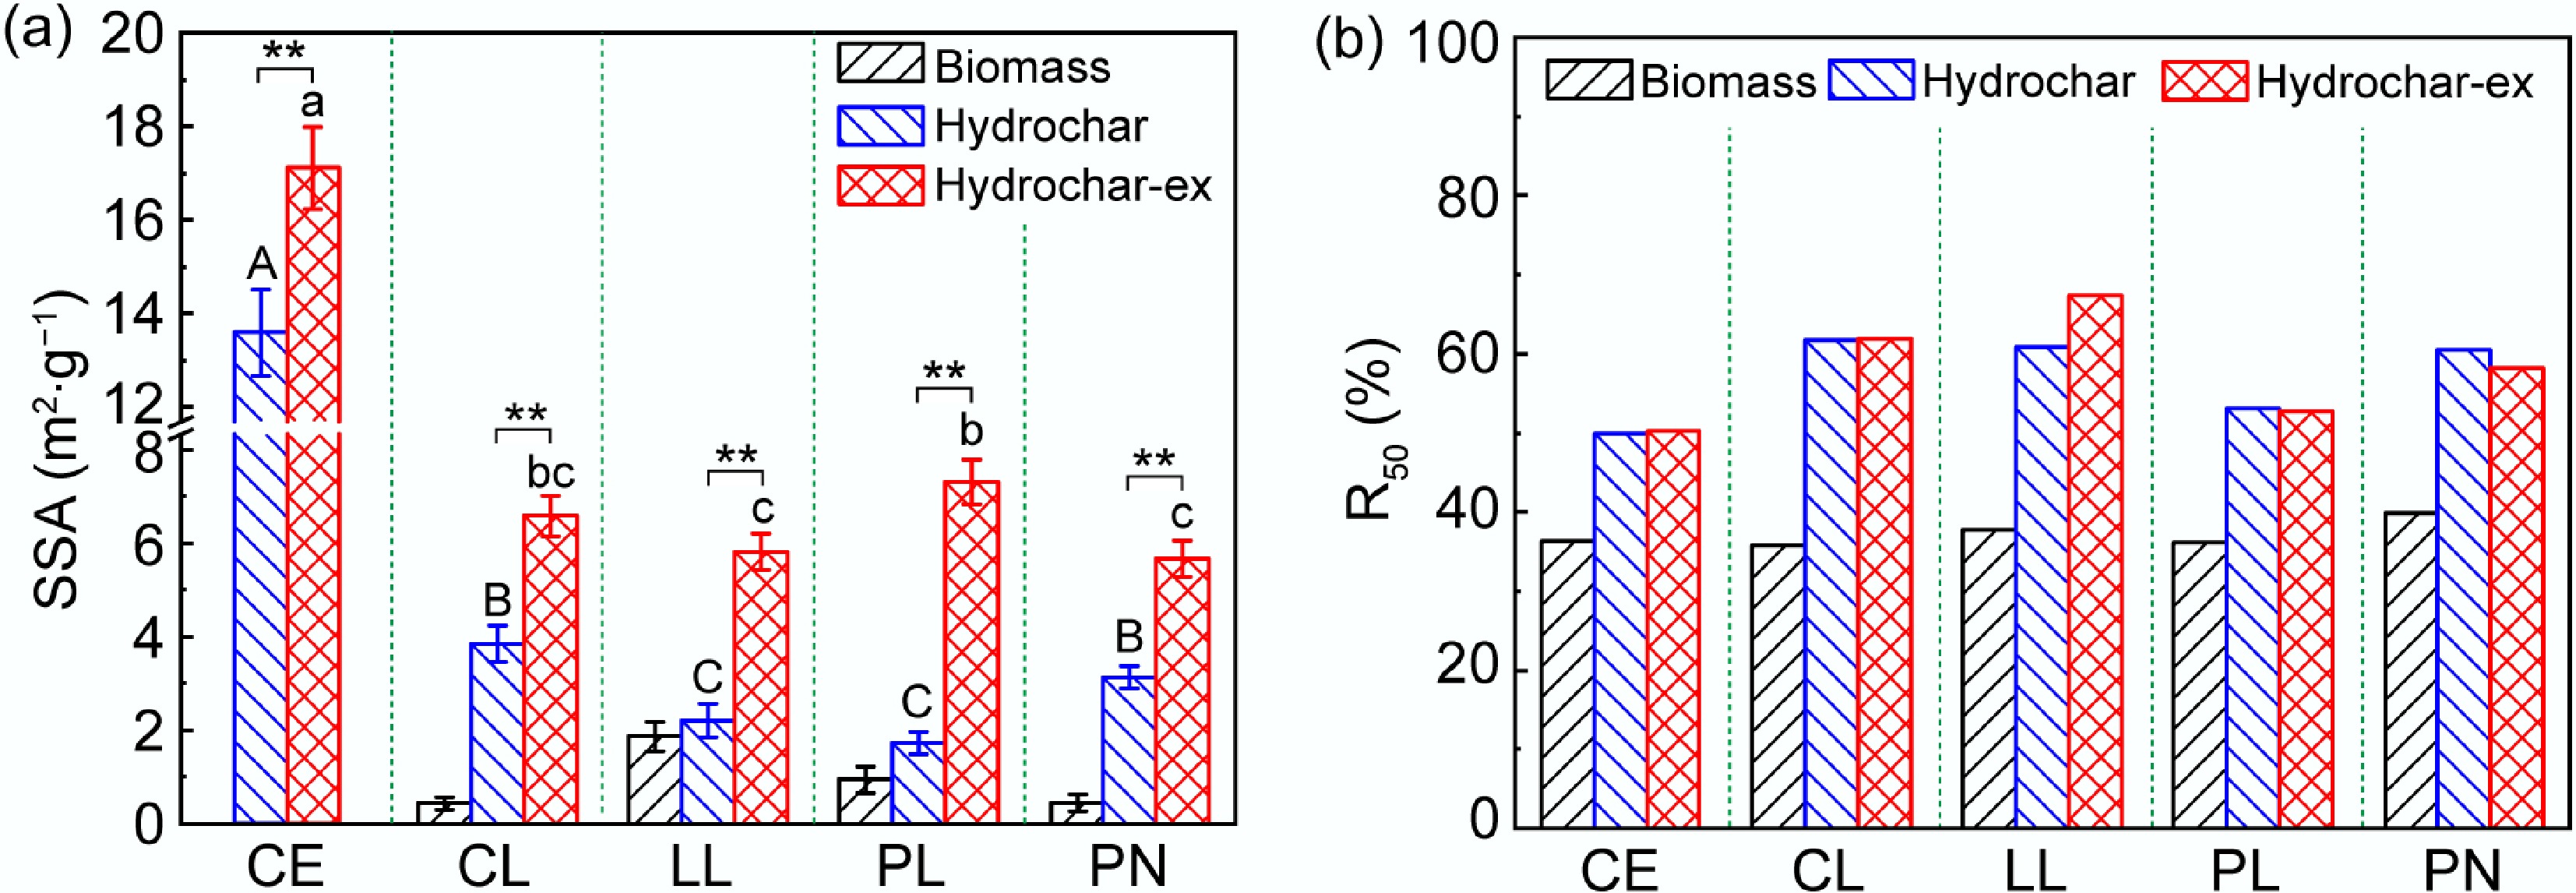
Figure 2.
(a) Specific surface area (SSA) of hydrochar derived from different biomass before and after acetone extraction. (b) Recalcitrance index (R50) of hydrochar before and after acetone extraction. SSA = specific surface area; R50 = recalcitrance index. CE, CL, LL, PL, and PN represent raw cellulose, corn leaves, lotus leaves, palm leaves, and pine needle biomass, respectively; Hydrochar denotes unextracted hydrochar, and Hydrochar-ex denotes acetone-extracted hydrochar. (A)–(C) compare the SSA of different hydrochar samples before extraction, and (a)–(c) represent the comparison of SSA of different hydrochar after extraction. ** represents a significant difference (p < 0.01) in the SSA of hydrochar before and after extraction.
-
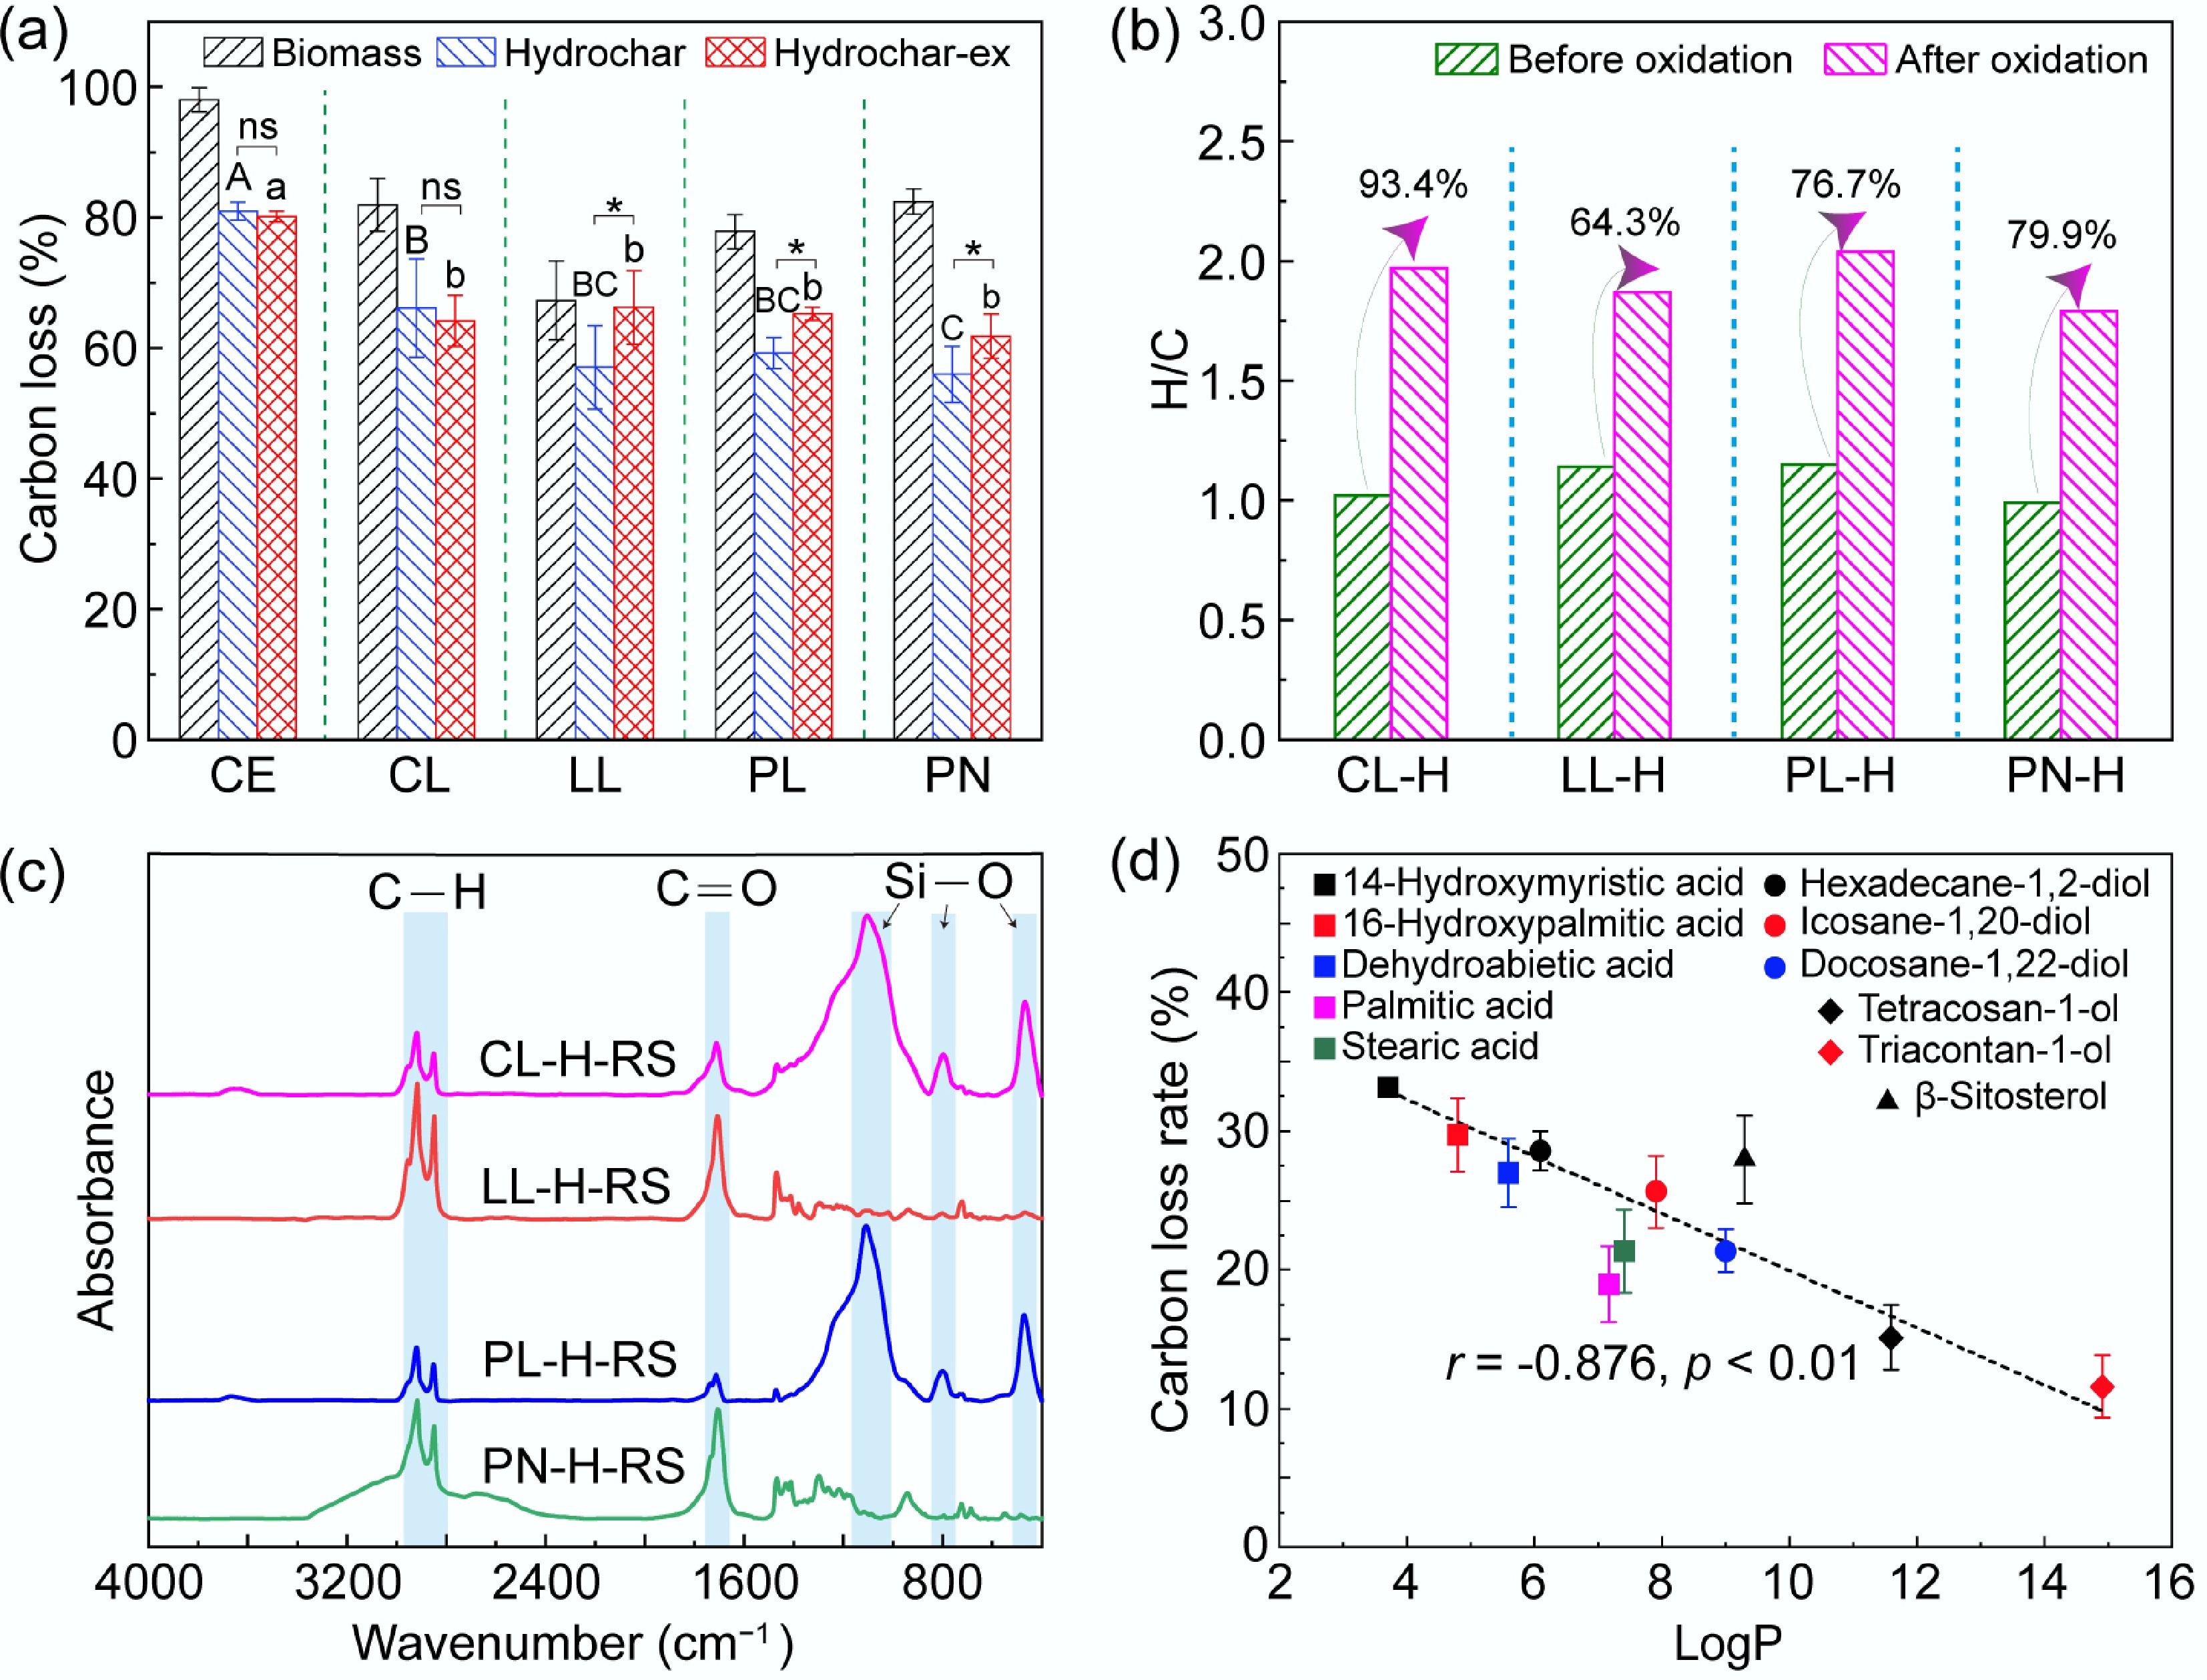
Figure 3.
(a) Carbon loss rate of hydrochar oxidized by K2Cr2O7 before and after acetone extraction. (b) H/C atomic ratio of leaf-derived hydrochar before and after oxidation by K2Cr2O7. (c) FTIR spectra of solid residues obtained from the chemical oxidation of leaf-derived hydrochar. (d) Correlation between LogP values of hydrophobic organics and their carbon loss rate after oxidation by K2Cr2O7. Sample abbreviations CE, CL, LL, PL, and PN are consistent with Fig. 2; hydrochar-related labels CE-H, CL-H, LL-H, PL-H, and PN-H follow the definitions provided in Fig. 1, and the labels Hydrochar and Hydrochar-ex are defined in Fig. 2. CL-H-RS, LL-H-RS, PL-H-RS, and PN-H-RS denote solid residues obtained from chemical oxidation of CL-H, LL-H, PL-H, and PN-H hydrochar, respectively. LogP is the logarithmic value of the octanol-water partition coefficient P. (A)–(C) present a comparison of the carbon loss rates of different hydrochars before extraction, and (a)–(c) present a comparison of carbon loss rates of different hydrochars after extraction. ns indicates no significant difference in the carbon loss rate of hydrochar before and after extraction, and * indicates a significant difference in the carbon loss rate of hydrochar before and after extraction (p < 0.05).
-
Number Compound name Molecular formula LogPa Peak area percentage (%) CE-H CL-H LL-H PL-H PN-H 1 Hexylmalonic acid C9H16O4 2.1 –b 2.21 – – – 2 3,5-Dimethylphenol C8H10O 2.4 – 1.05 – – – 3 12-Hydroxydodecanoic acid C12H24O3 3.6 – – – – 4.08 4 14-Hydroxymyristic acid C14H28O3 3.7 – – – – 7.76 5 Dehydrodiisoeugenol C20H22O4 4.4 – – – – 1.60 6 Dodecanoic acid C12H24O2 4.6 – 1.49 – – – 7 16-Hydroxy-9-Hexadecenoic acid C16H30O3 4.6 – – 3.00 – – 8 16-Hydroxypalmitic acid C16H32O3 4.8 – 1.53 – – 36.73 9 Dehydroabietic acid C20H28O2 5.6 – 1.07 – – 9.10 10 Myristic acid C14H28O2 6.11 – 1.36 – 1.32 – 11 Oleic acid C18H34O2 6.5 – 1.33 – – 1.46 12 Ergosterol peroxide C28H44O3 6.7 – 1.60 – – – 13 Palmitic acid C16H32O2 7.17 – 17.62 13.86 24.07 5.64 14 Stearic acid C18H36O2 7.4 – 4.17 1.45 8.31 – 15 3-Methoxycholest-7-en-6-ol C28H48O2 7.7 – 1.68 – – – 16 β-Sitosterol C29H50O 9.3 – 7.69 11.66 4.03 4.65 17 Nonacosane-4,10-diol C29H60O2 12.1 – – 20.78 – – 18 alpha-Tocopherol C29H50O2 12.2 – – – 2.74 – 19 Nonacosan-10-ol C29H60O 14 – – 14.66 – 2.40 20 17-Pentatriacontene C35H70 18.2 – – 1.02 – – Note: a P is the octanol-water partition coefficient; b – means non-detected. All data are derived from single GC–MS measurements without replicates. LogP values were retrieved from the PubChem database. CE-H, CL-H, LL-H, PL-H, and PN-H represent hydrochar prepared from cellulose, corn leaves, lotus leaves, palm leaves, and pine needles, respectively. Table 1.
Hydrophobic organic compounds identified in the extraction products of hydrochar derived from different biomass
-
Sample C (%) H (%) O (%) N (%) S (%) H/C O/C CE 42.07 ± 0.24 6.41 ± 0.01 52.48 ± 2.32 –I – 1.83 0.94 CE-H 70.16 ± 0.40aII 4.76 ± 0.05a 25.54 ± 0.41b – – 0.81 0.27 CE-H-ex 68.04 ± 0.92a 4.65 ± 0.07a 26.86 ± 0.15a – – 0.82 0.30 CL 41.40 ± 0.35 5.59 ± 0.08 28.59 ± 0.47 1.59 ± 0.01 0.13 ± 0.01 1.62 0.52 CL-H 62.90 ± 1.15a 5.35 ± 0.11a 9.74 ± 0.49a 2.58 ± 0.05a 0.17 ± 0.01a 1.02 0.12 CL-H-ex 55.88 ± 0.77b 4.32 ± 0.10b 11.99 ± 2.47a 2.61 ± 0.04a 0.18 ± 0.01a 0.93 0.16 LL 44.53 ± 0.83 5.78 ± 0.11 30.49 ± 0.14 3.85 ± 0.07 0.21 ± 0.01 1.56 0.51 LL-H 63.76 ± 1.66a 6.05 ± 0.05a 14.10 ± 2.20a 3.41 ± 0.23a 0.08 ± 0.07a 1.14 0.17 LL-H-ex 58.48 ± 0.55b 4.80 ± 0.06b 17.22 ± 1.17a 3.60 ± 0.05a 0.15 ± 0.01a 0.99 0.22 PL 43.72 ± 0.81 6.13 ± 0.36 38.61 ± 0.87 1.62 ± 0.09 0.13 ± 0.08 1.68 0.66 PL-H 63.65 ± 0.93a 6.12 ± 0.26a 15.44 ± 0.37b 2.24 ± 0.04b 0.04 ± 0.02a 1.15 0.18 PL-H-ex 57.10 ± 0.83b 4.97 ± 0.21b 17.15 ± 0.49a 2.41 ± 0.05a 0.05 ± 0.04a 1.05 0.23 PN 49.72 ± 0.53 6.27 ± 0.07 36.20 ± 1.06 1.65 ± 0.01 0.11 ± 0.01 1.51 0.55 PN-H 74.14 ± 2.01a 6.14 ± 0.06a 14.82 ± 0.95a 2.28 ± 0.08a 0.08 ± 0.02 0.99 0.15 PN-H-ex 69.41 ± 0.80b 5.19 ± 0.07b 15.65 ± 0.85b 2.40 ± 0.03b – 0.90 0.17 Note: data are presented as mean ± standard deviation, n = 3 parallel replicates. I – means non-detected; II a and b indicate a significant difference in the bulk elemental composition of hydrochar before and after acetone extraction, and the same letter means no significant difference. CE, CL, LL, PL, and PN denote raw cellulose, corn leaves, lotus leaves, palm leaves, and pine needles; CE-H, CL-H, LL-H, PL-H, and PN-H are the corresponding hydrochar samples; CE-H-ex, CL-H-ex, LL-H-ex, PL-H-ex, and PN-H-ex refer to acetone-extracted hydrochar samples. Table 2.
Elemental composition of hydrochar samples before and after acetone extraction
-
Sample Alkyl C/% O–alkyl C/% Aryl C/% O–aryl C/% Carboxyl C/% Carbonyl C/% Aromaticity/% CE 0.00 100.00 0.00 0.00 0.00 0.00 0.00 CE-H 25.00 12.27 45.00 8.64 2.27 6.82 59.00 CE-H-ex 26.29 12.68 42.25 8.92 2.35 7.51 56.77 CL 10.54 79.33 5.17 0.05 4.91 0.00 5.49 CL-H 45.75 9.48 36.71 2.70 0.47 4.89 41.64 CL-H-ex 35.83 11.90 37.74 4.78 1.89 7.86 47.11 LL 21.63 59.60 6.90 1.79 10.08 0.00 9.66 LL-H 50.83 8.48 32.38 3.14 2.56 2.60 37.45 LL-H-ex 38.91 12.65 33.63 4.52 5.18 5.10 42.52 PL 13.98 66.82 7.99 3.38 7.83 0.00 12.33 PL-H 42.65 13.50 29.27 8.96 2.75 2.87 40.51 PL-H-ex 36.14 15.76 33.84 8.34 2.60 3.31 44.84 PN 12.37 67.25 12.07 3.41 4.83 0.07 16.28 PN-H 43.97 10.18 34.72 4.56 1.57 5.00 42.05 PN-H-ex 36.50 14.14 37.23 5.25 1.70 5.19 45.61 Note: all values originate from single measurements without replicates. Aromaticity (%) = 100 × (Aryl C + O-aryl C)/(Alkyl C + O-alkyl C + Aryl C + O-aryl C). Sample abbreviations are consistent with Table 2. Table 3.
Carbon structure of hydrochar before and after acetone extraction determined by solid-state 13 C-NMR spectroscopy
-
Sample Activation energy,
E (J mol−1)Pre-exponential factor, A (min−1) g(α) Coefficient of determination, R2 CE-H 57.51 347.88 (1–α)ln(1–α)+α 0.999 CE-H-ex 57.27 315.06 (1–α)ln(1–α)+α 0.999 CL-H 47.46 13.25 (1–α)ln(1–α)+α 0.992 CL-H-ex 55.83 595.50 [(1–α)−2–1]/2 0.981 LL-H 21.29 0.60 –ln(1–α) 0.987 LL-H-ex 33.43 8.47 [(1–α)−2–1]/2 0.978 PL-H 45.97 44.32 α2 0.999 PL-H-ex 52.28 145.55 α2 0.999 PN-H 43.87 13.71 α2 0.986 PN-H-ex 48.77 23.82 (1–α)ln(1–α)+α 0.994 Sample abbreviations are defined in Table 2. α = fractional conversion; g(α) = integral form of the reaction model. Table 4.
Kinetic parameters for thermal decomposition of hydrochar before and after acetone extraction
Figures
(3)
Tables
(4)