-
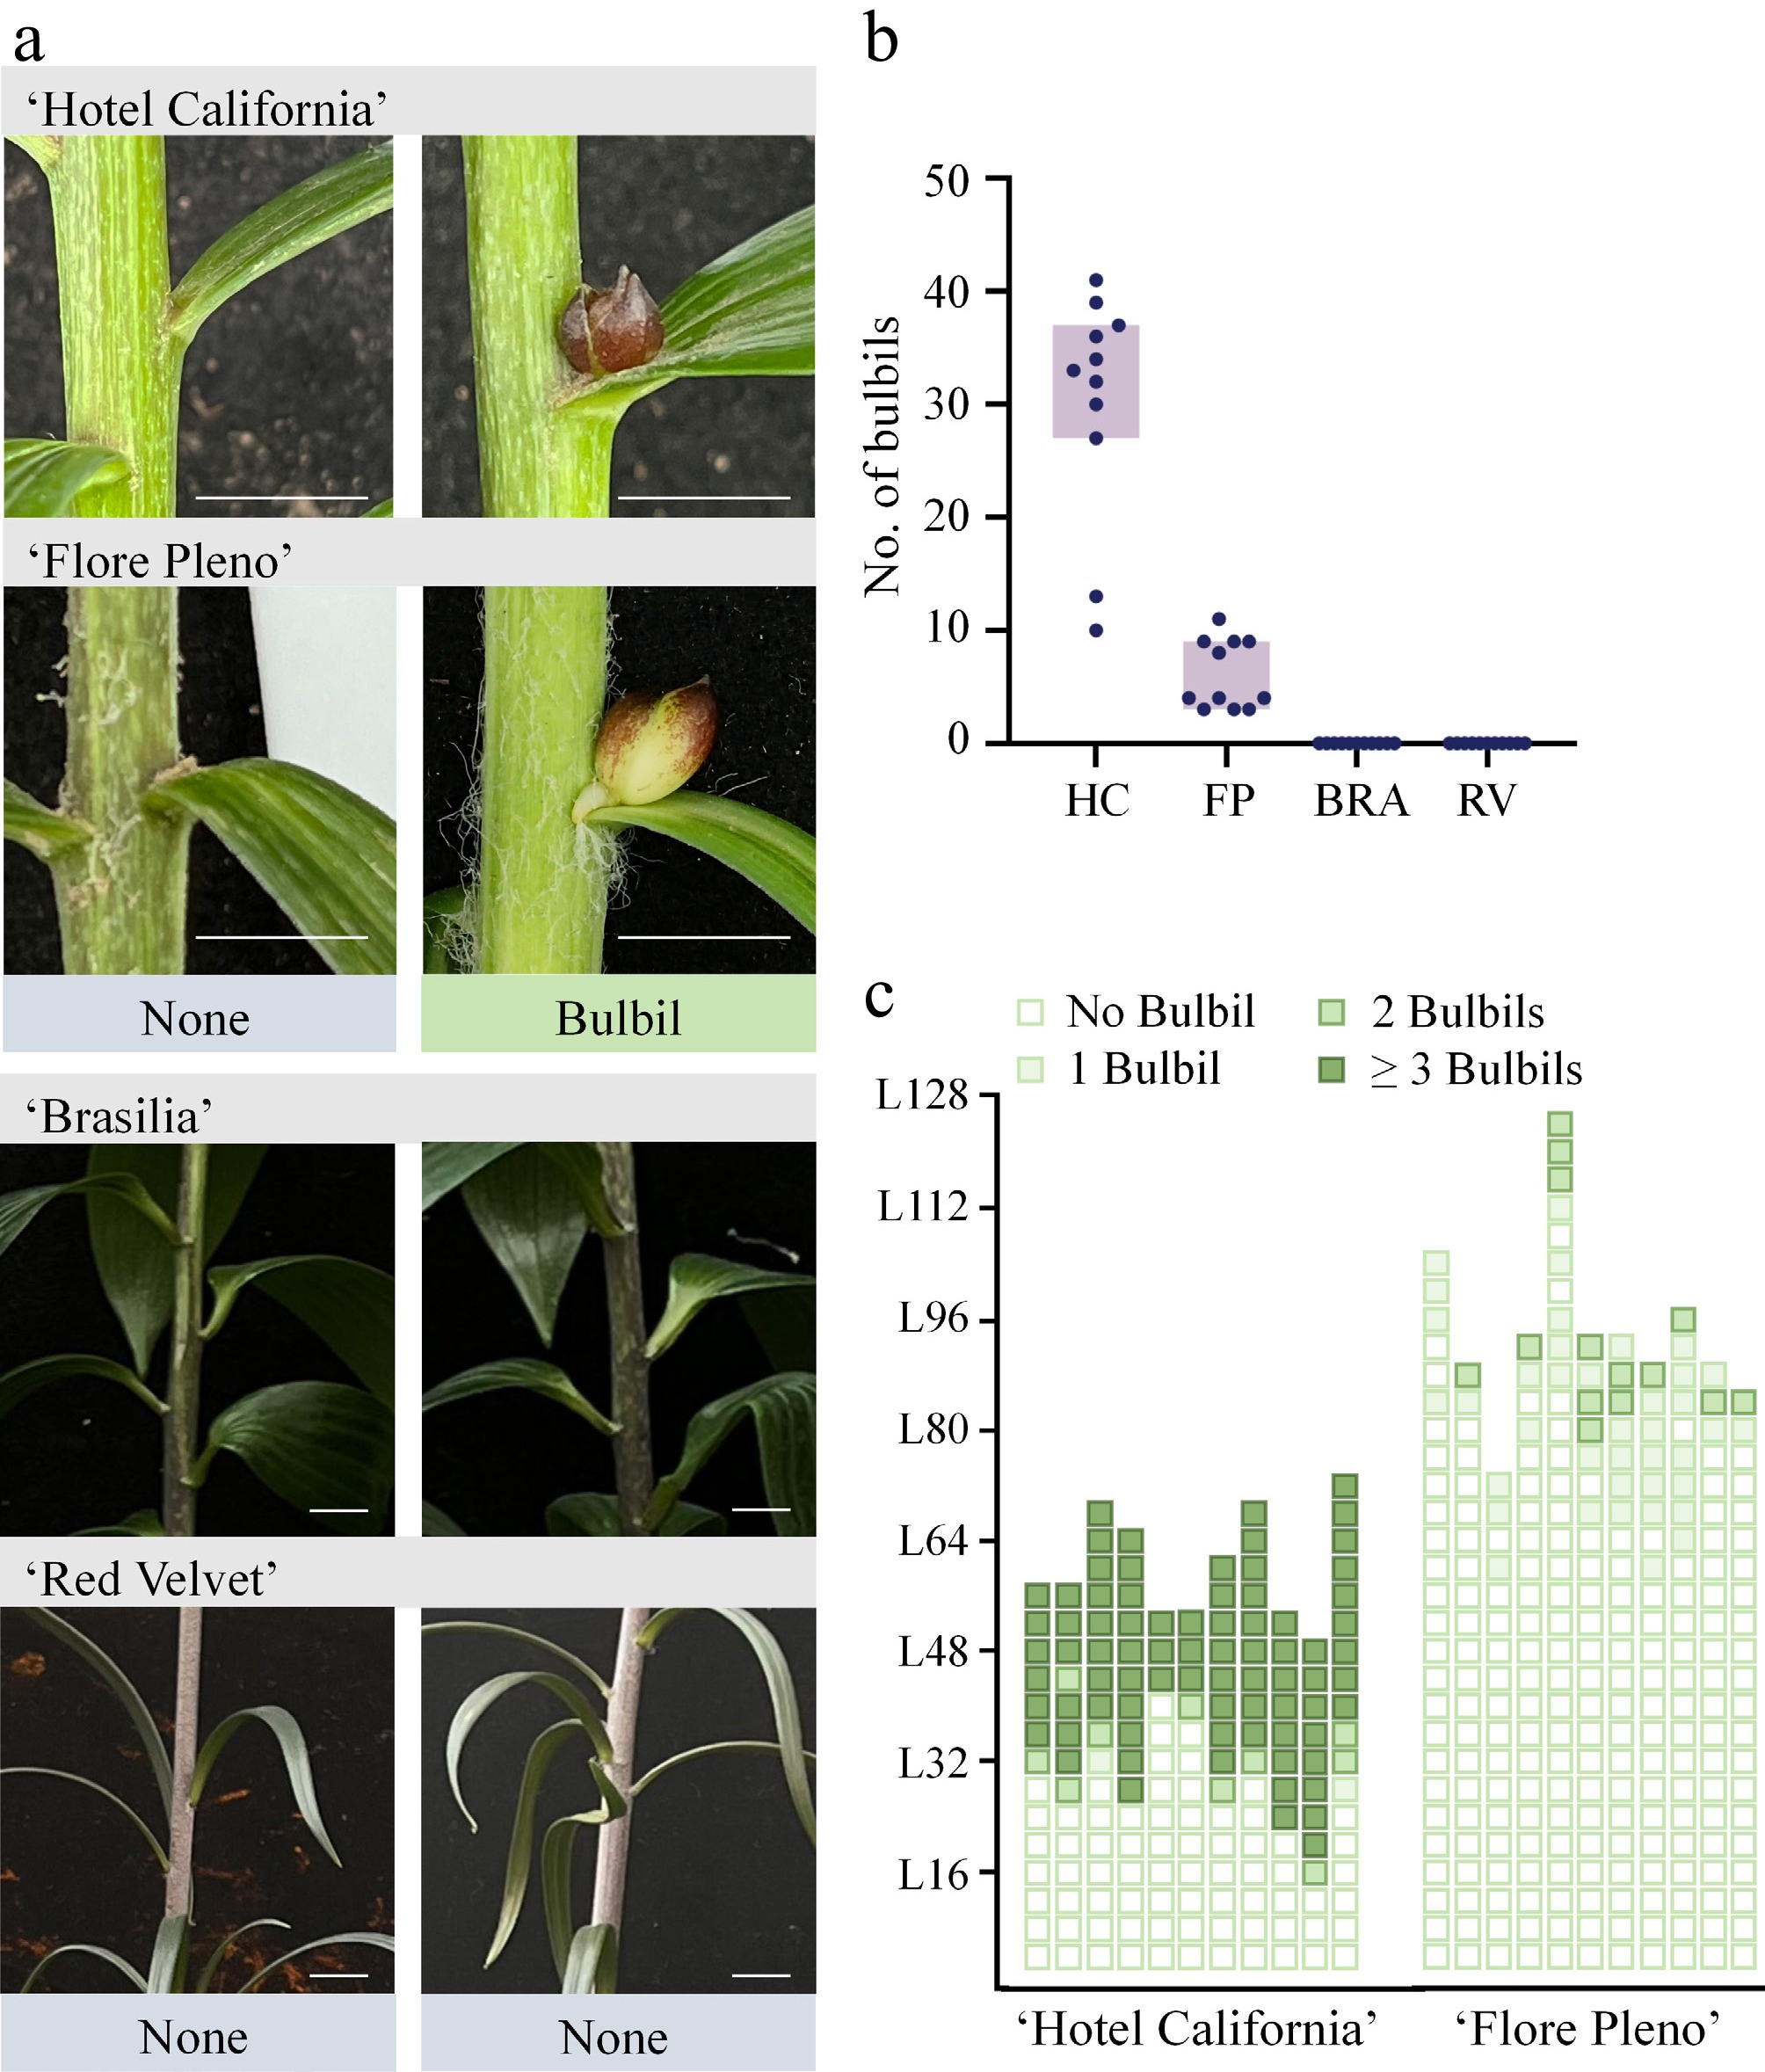
Figure 1.
Formation process of different lily bulbil varieties. (a) The number of bulbils was counted when the bulbs of four varieties of lily were planted for 50 d. Scale bar indicates 1 cm. The data are expressed as mean ± SD (n = 11). (b) Statistics of the occurrence position of bulbils for lily varieties that naturally occur in bulbils. L16 represents the 16th leaf counted from the bottom of the stem segment, and so on, and L128 represents the 128th leaf counted from the bottom of the stem segment upwards. (c) Phenotypic comparison of leaf axils in bulbil-forming and non-bulbil-forming lily varieties. HC, 'Hotel California'; FP, 'Flore Pleno'; BRA, 'Brasilia'; RV, 'Red Velvet'.
-
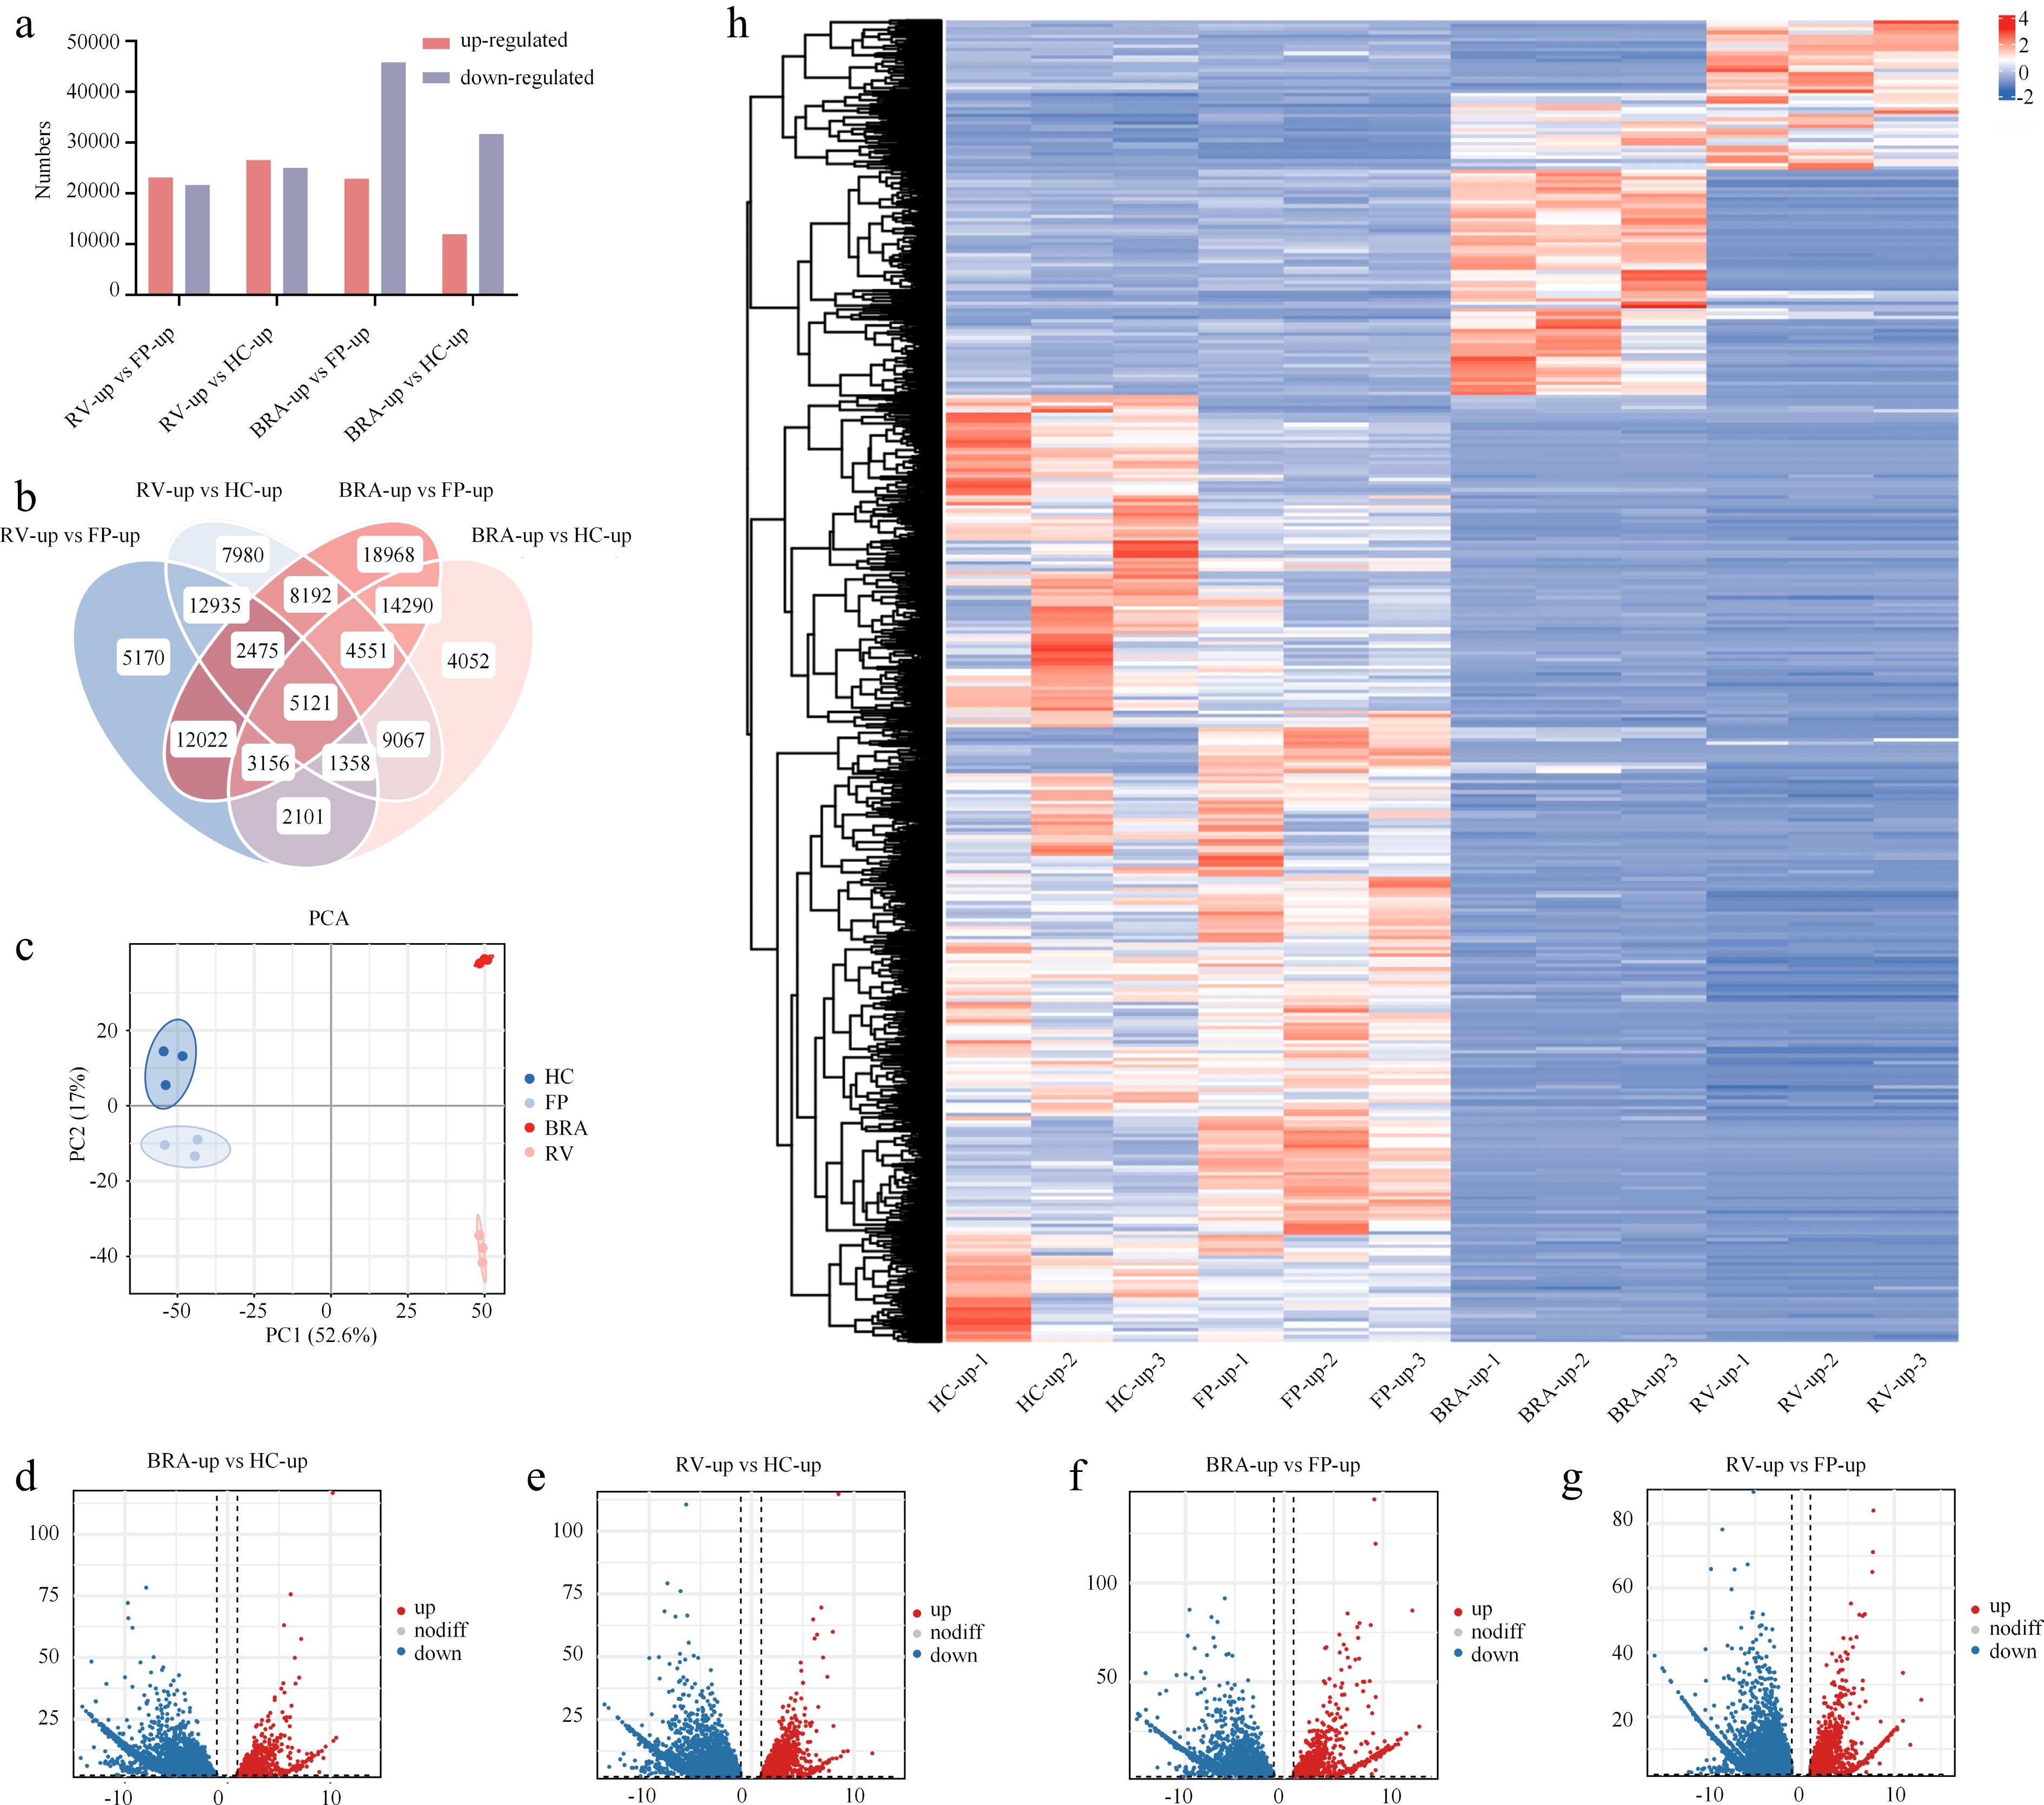
Figure 2.
DEGs between the axils of the upper leaves of different lily varieties. (a) Number of DEGs compared in pairs. (b) Venn diagram showing the number of DEGs among different comparisons. (c) PCA between samples. (d–g) Volcano plots showing DEGs with common trends in different comparisons. (h) Heatmap showing the relative expression levels of DEGs with 5,121 annotations. The blue-to-red color scale on the right indicates the FPKM values from low to high.
-
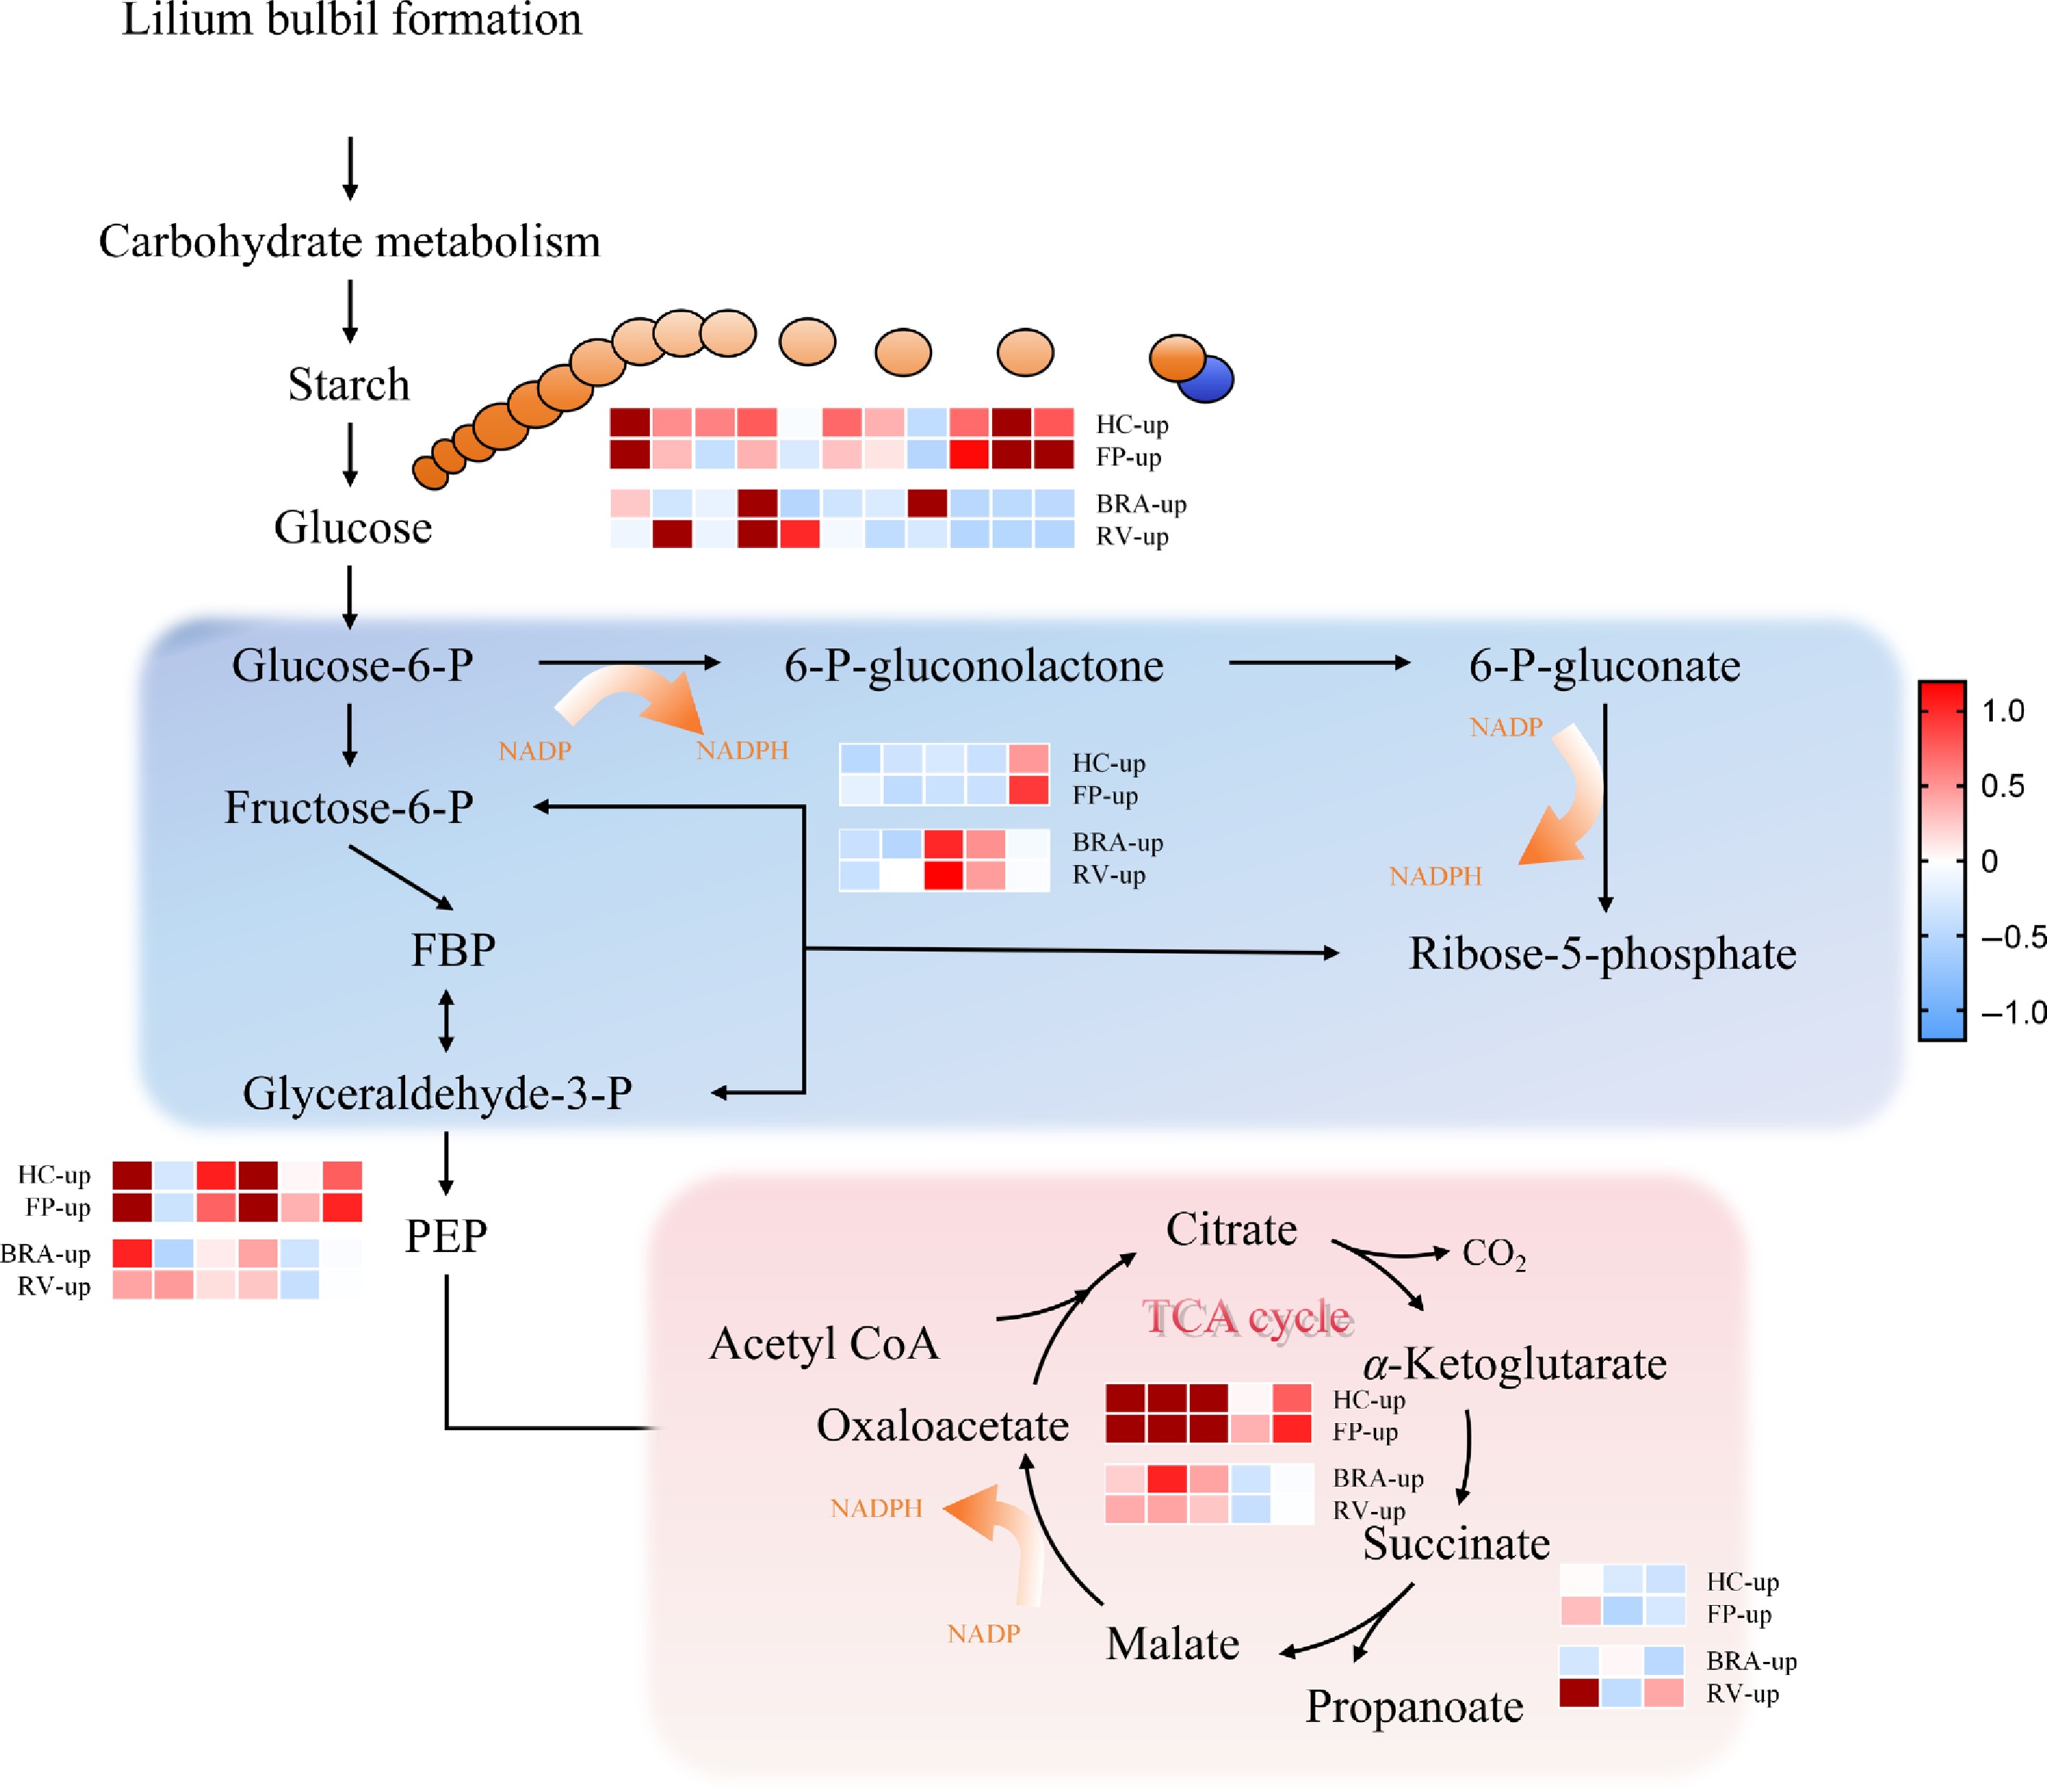
Figure 3.
Heatmap of the relative expression levels of DEGs potentially associated with bulbil formation. Carbohydrate metabolism pathways related to bulbil formation. A total of 30 significantly differentially expressed genes were found to be involved in carbohydrate metabolism during bulbil formation. Red indicates an upward adjustment, and blue indicates a downward adjustment. Glucose-6-P; fructose-6-P; FBP; glyceraldehyde-3-P; 6-P-gluconolactone; 6-P-gluconate; ribose-5-phosphate; PEP; oxaloacetate; acetyl CoA; citrate; α-Ketoglutarate; succinate; propanoate; malate.
-
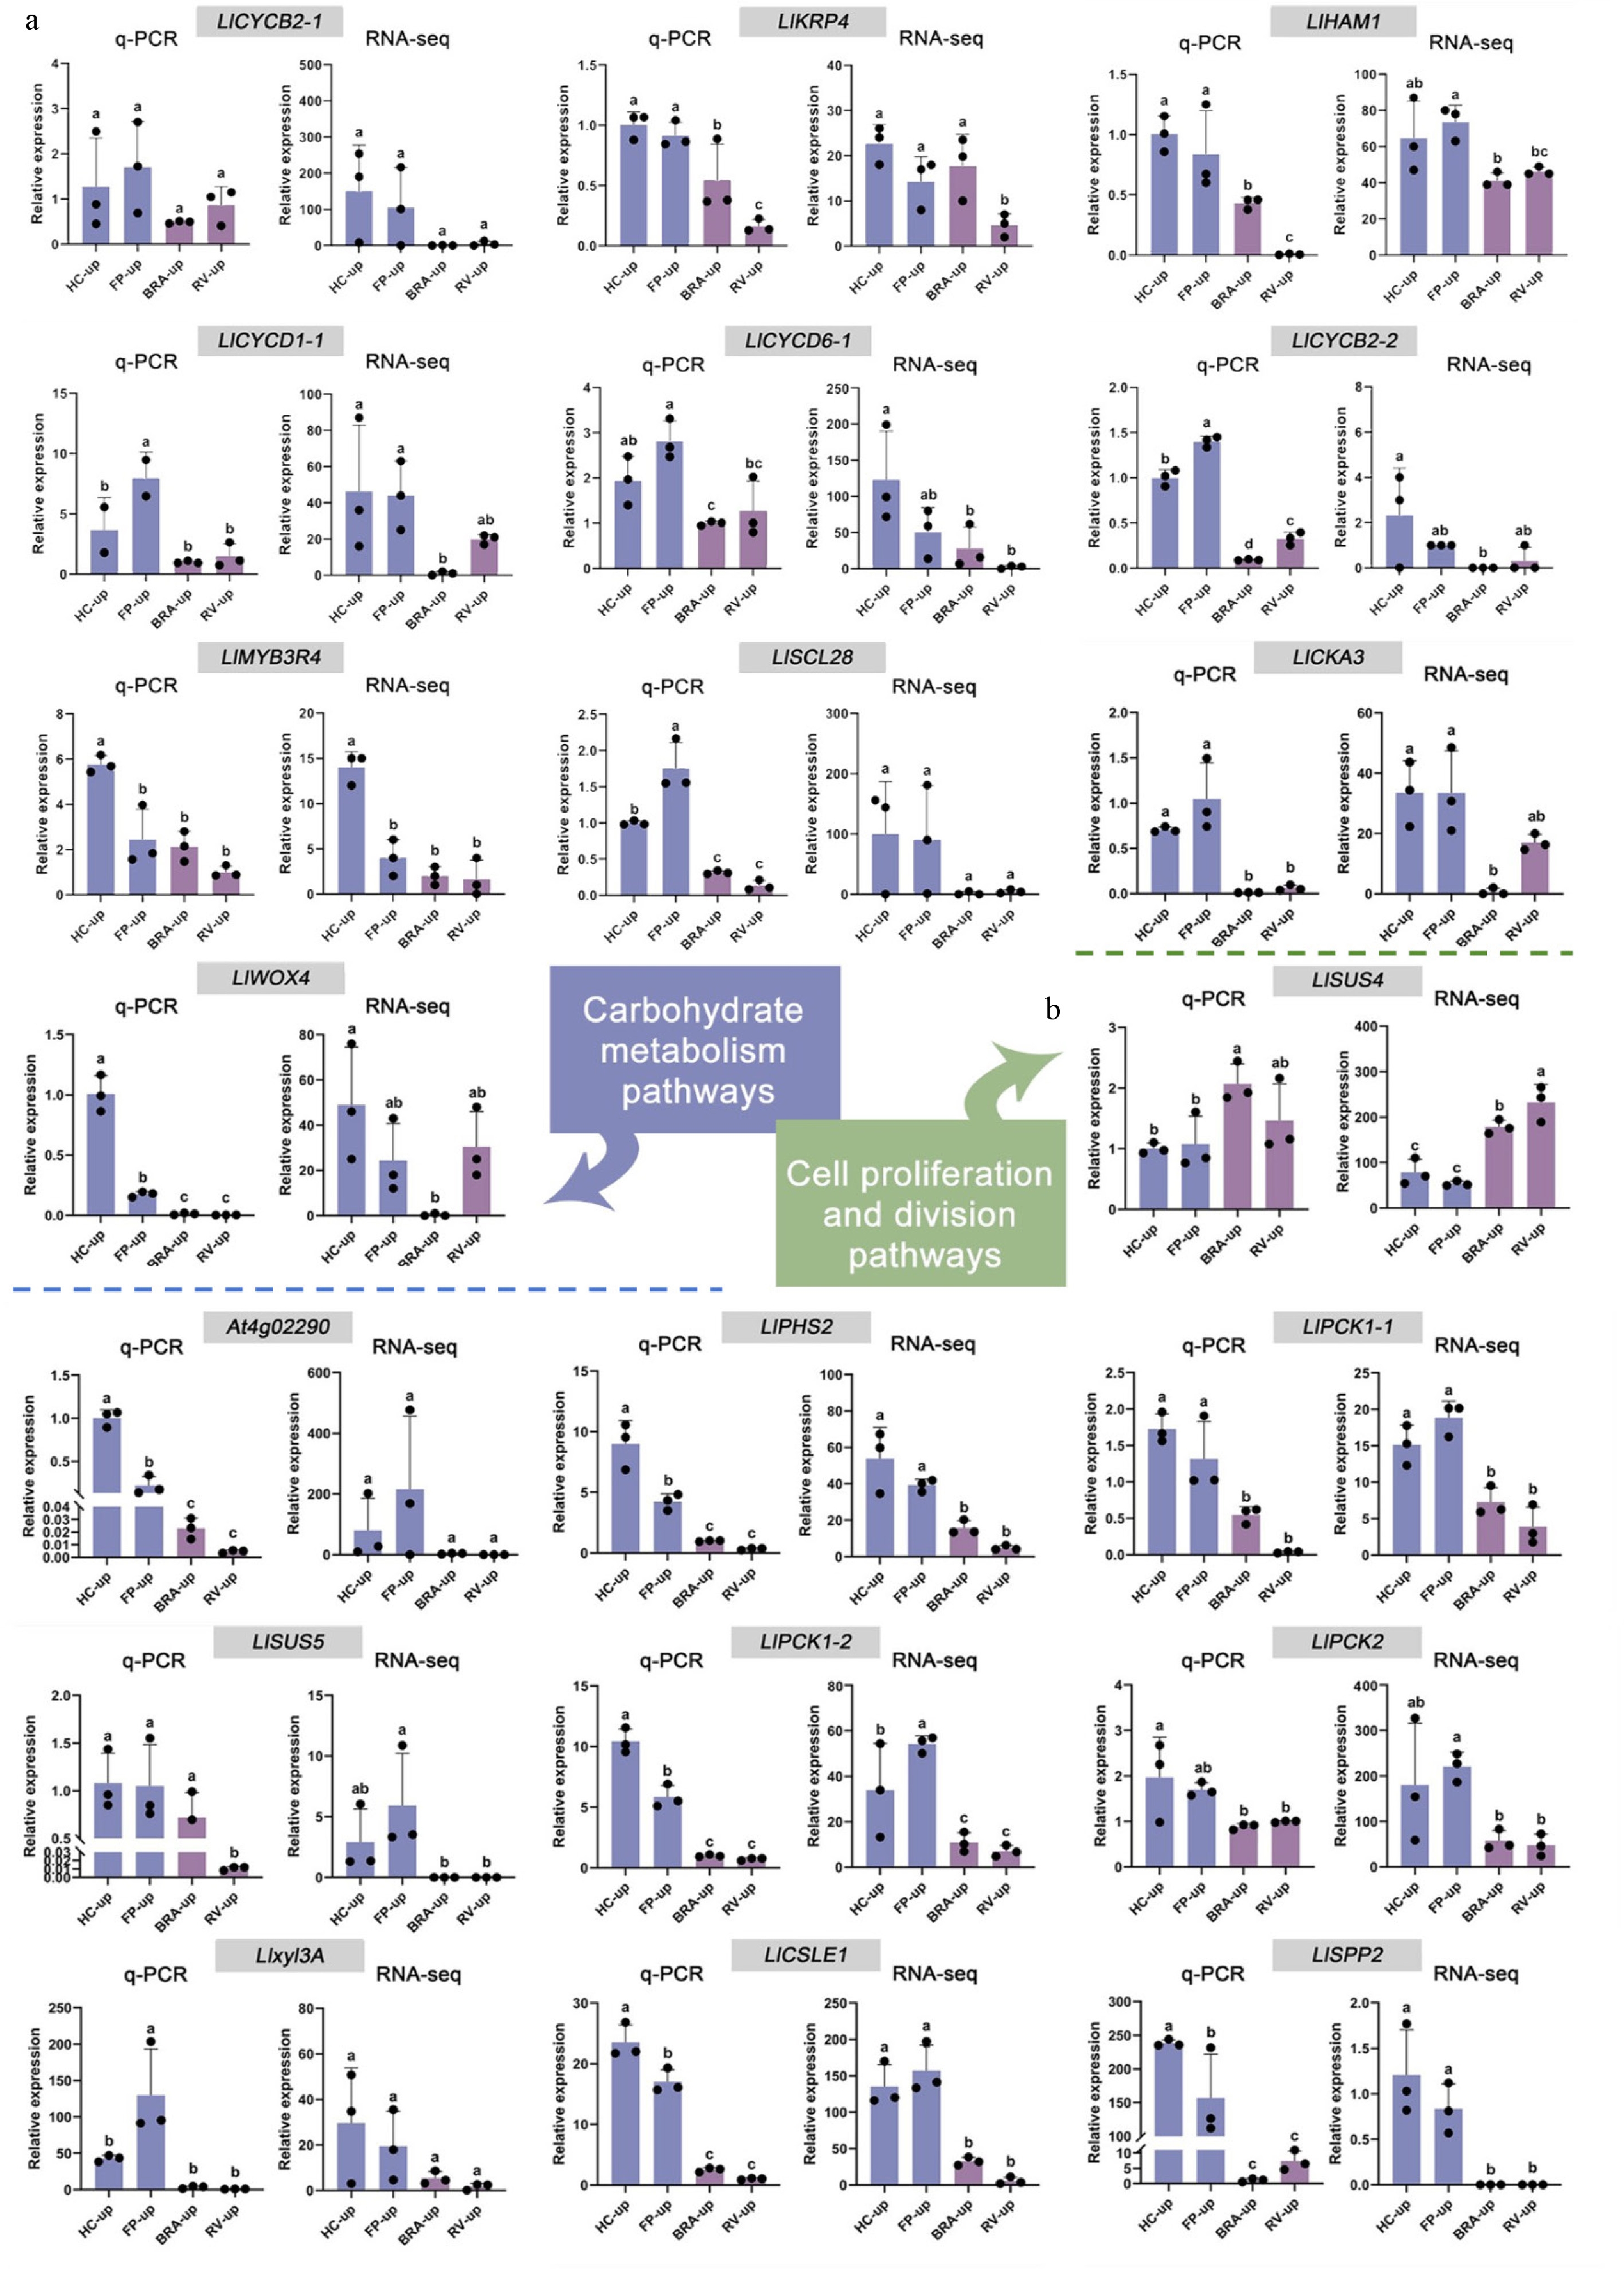
Figure 4.
Expression analysis of selected unigenes in leaf axils of different lily cultivars. (a) Unigenes of carbohydrate metabolism pathways. (b) Unigenes of cell proliferation and division pathways. Blue and purple columns represent the CBF and IBF groups, respectively. The qRT-PCR values were detected using the 2−ΔΔCᴛ method. Error bars show the standard deviation (SD) of three independent biological replicates. Lowercase letters indicate significant differences (p < 0.05).
-
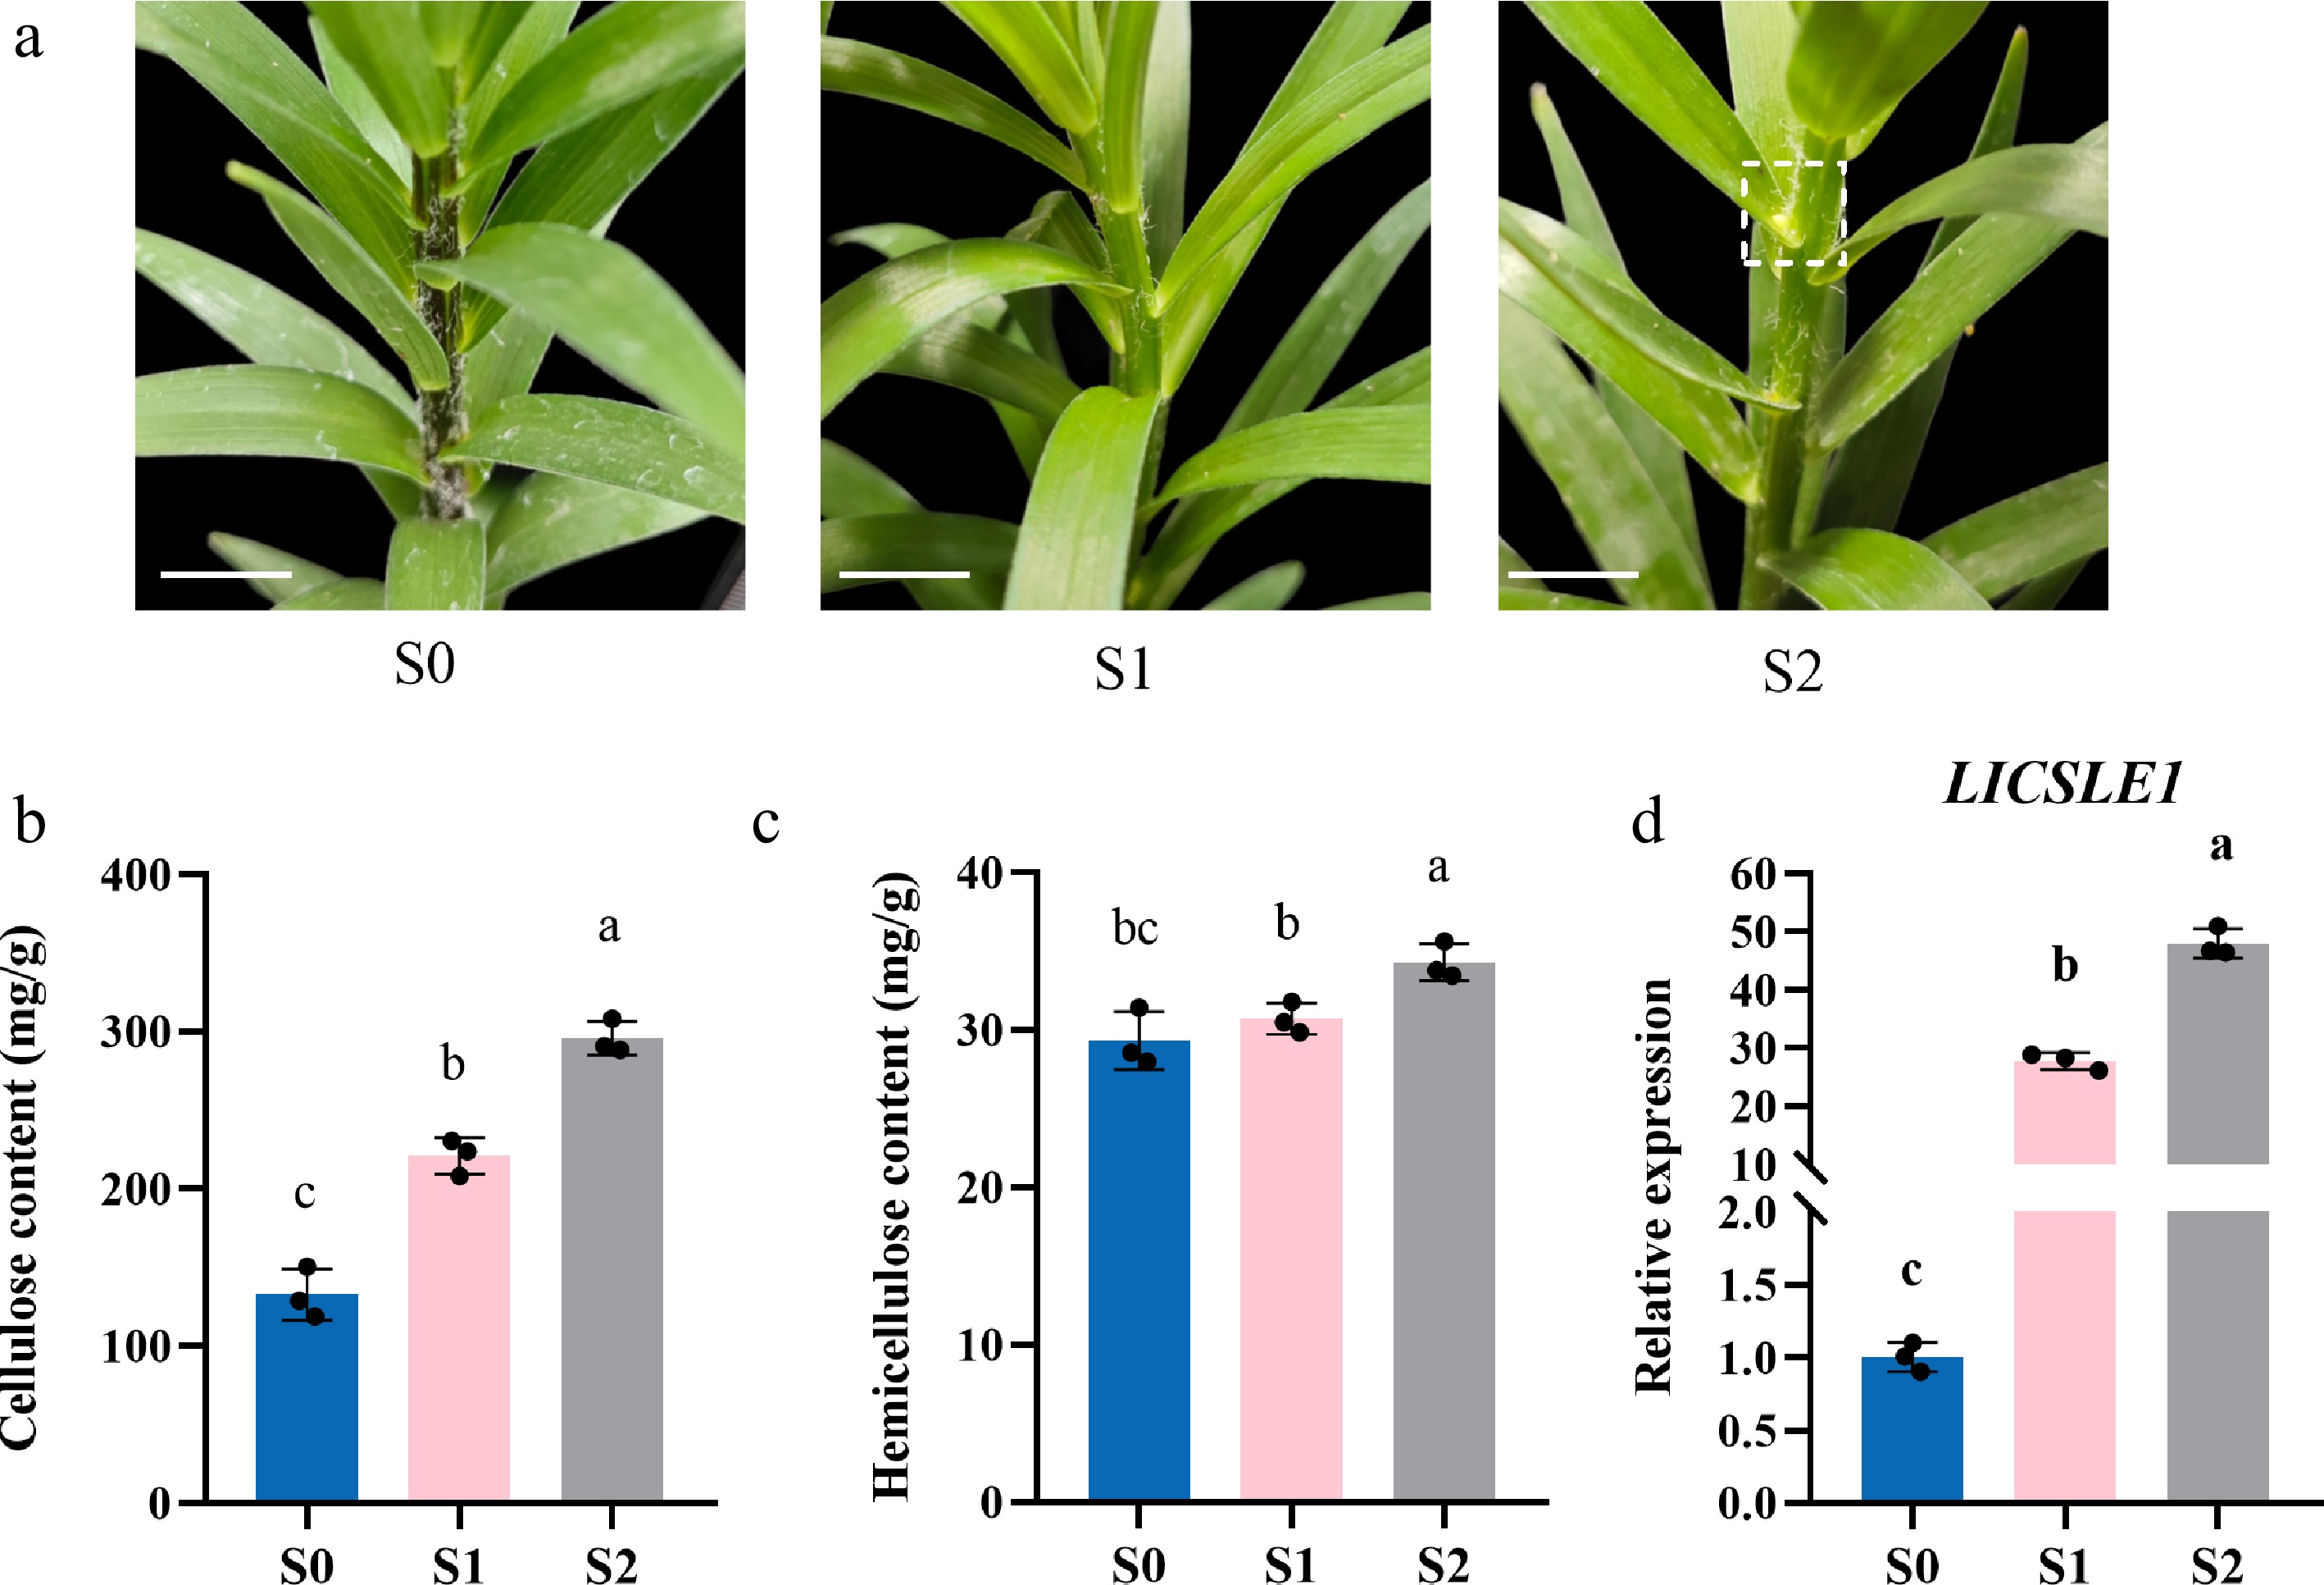
Figure 5.
Characteristics of the cell wall components and LlCSLE1 expression in L. lancifolium at different bulbil development stages. (a) Morphological observations of leaf axils at different stages of bulbil formation. S0, S1, and S2 represent three distinct growth phases. Scale bar indicates 1 cm. (b) Cellulose content during different developmental stages of bulbil formation in Lilium lancifolium. (c) Hemicellulose content during different developmental stages of bulbil formation in Lilium lancifolium. (d) Relative expression levels of LlCSLE1 during different developmental stages of bulbil formation in Lilium lancifolium. Different letters (a, b, c) indicate significant differences among groups (p < 0.05).
-
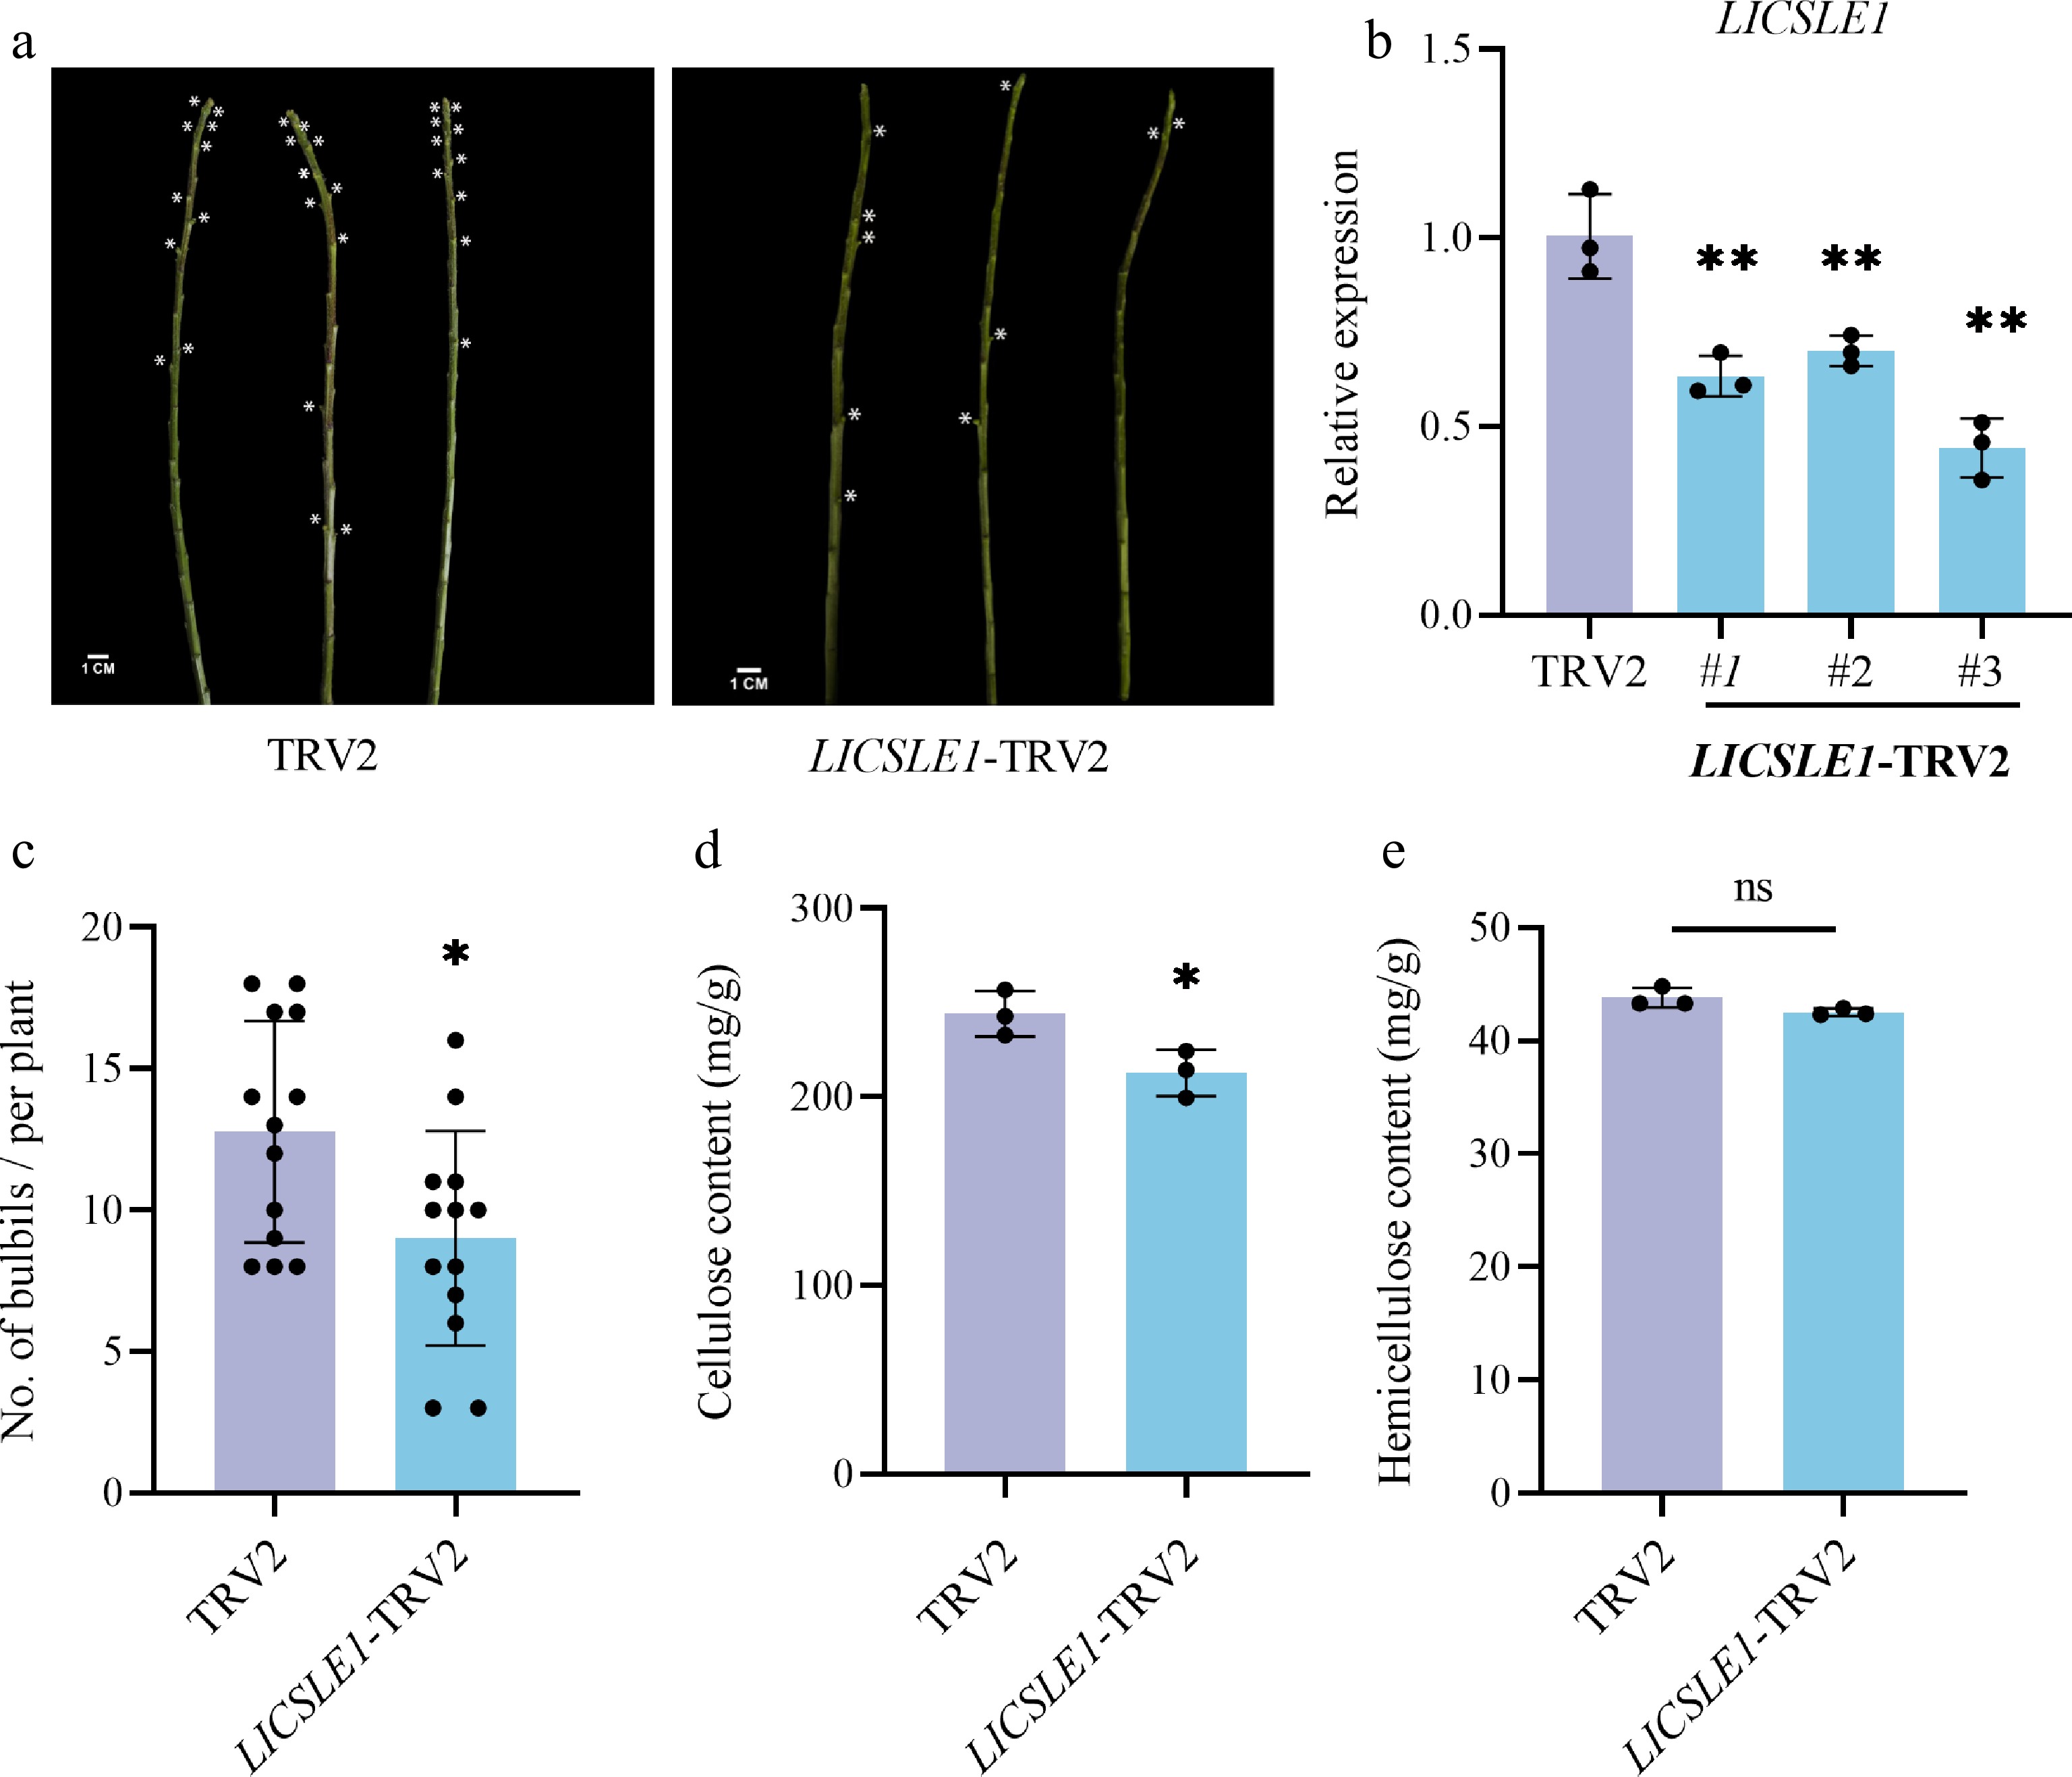
Figure 6.
LlCSLE1 affects the formation of bulbils in L. lancifolium. (a) Middle and upper stem segments of silenced and TRV2 plants form a bulbil phenotype after 60 d. Leaves were removed, leaving only the petiole base to provide a clearer view of the phenotype. This manipulation was applied equally to both groups and performed only at the endpoint, without affecting normal growth or bulbil development during the experimental period. At least 13 independent plants in the TRV2 or silenced groups were used. White asterisks denote the bulbils. The scale bar indicates 1.0 cm. (b) Relative expression of LlCSLE1; ** indicates significant differences at p < 0.01. (c) Bulbil formation amount, * indicates significant differences at p < 0.05. (d) Cellulose dry weight content in the leaf axil, * indicates significant differences at p < 0.05. (e) Hemicellulose dry weight content in the leaf axil, 'ns' indicates no significant differences at p > 0.05. The data are expressed as mean ± SD of three biological replicates. Student's t-test was used for statistical analysis.
-
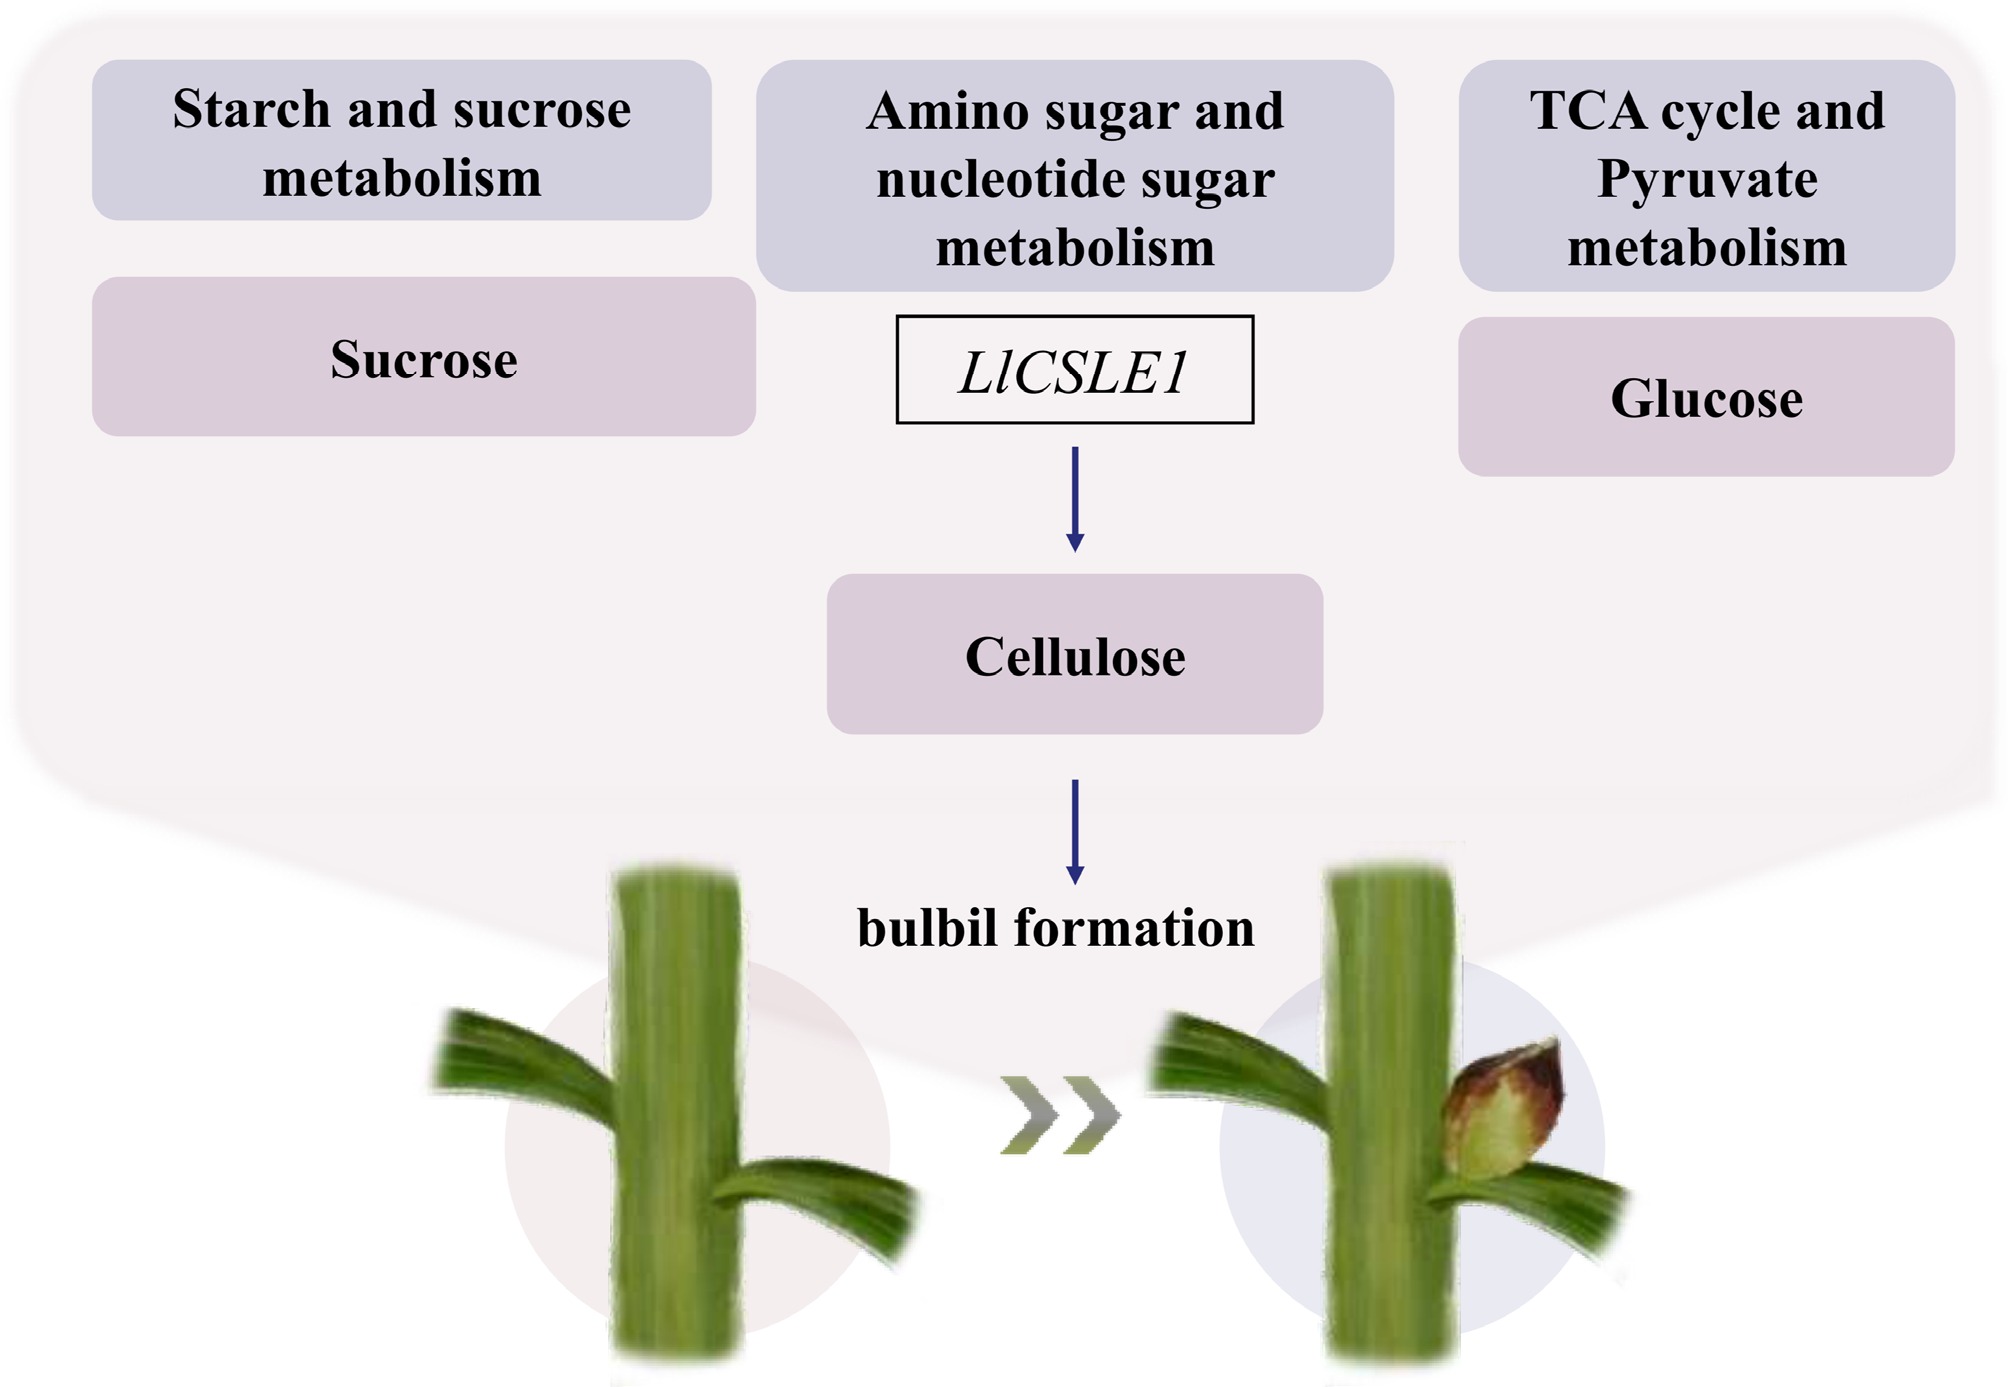
Figure 7.
Schematic diagram of the mechanism by which LlCSLE1-mediated cellulose synthesis promotes bulbil formation.
Figures
(7)
Tables
(0)