-
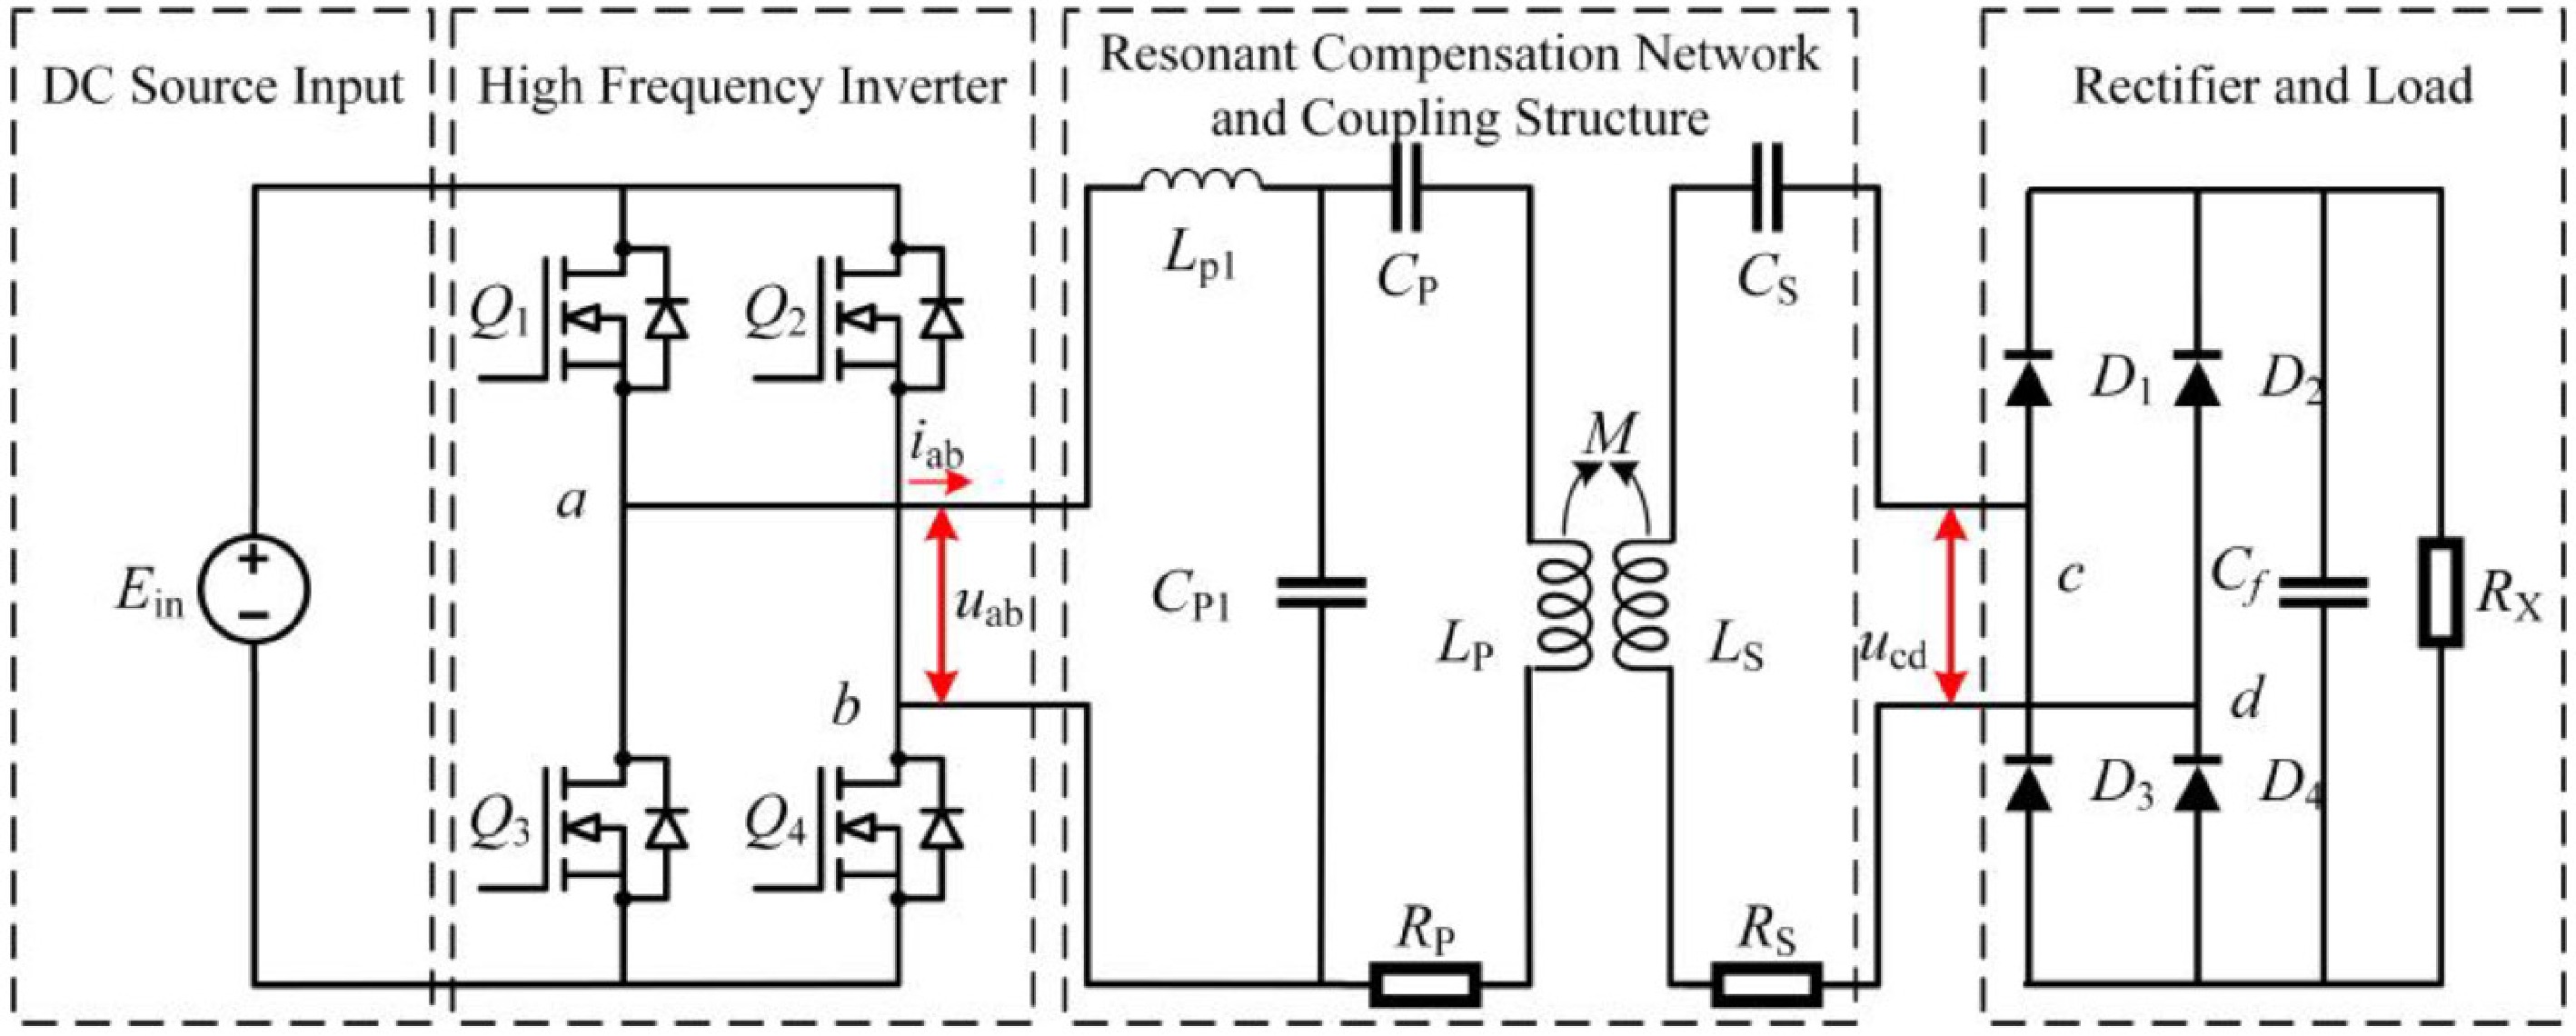
Figure 1.
Typical circuit model of WPT system.
-
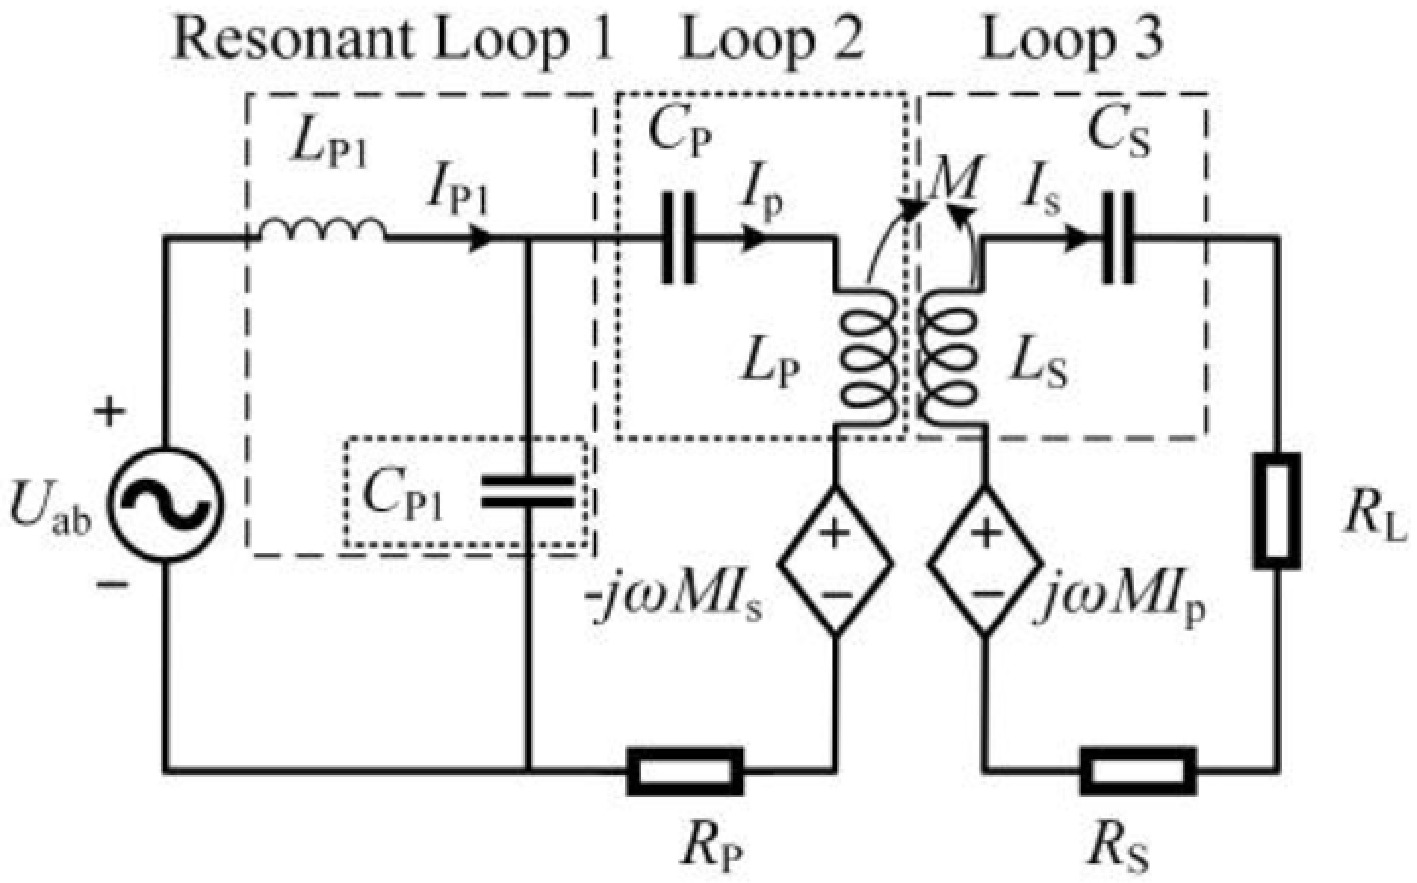
Figure 2.
Simplified structure of a LCC-S WPT system.
-
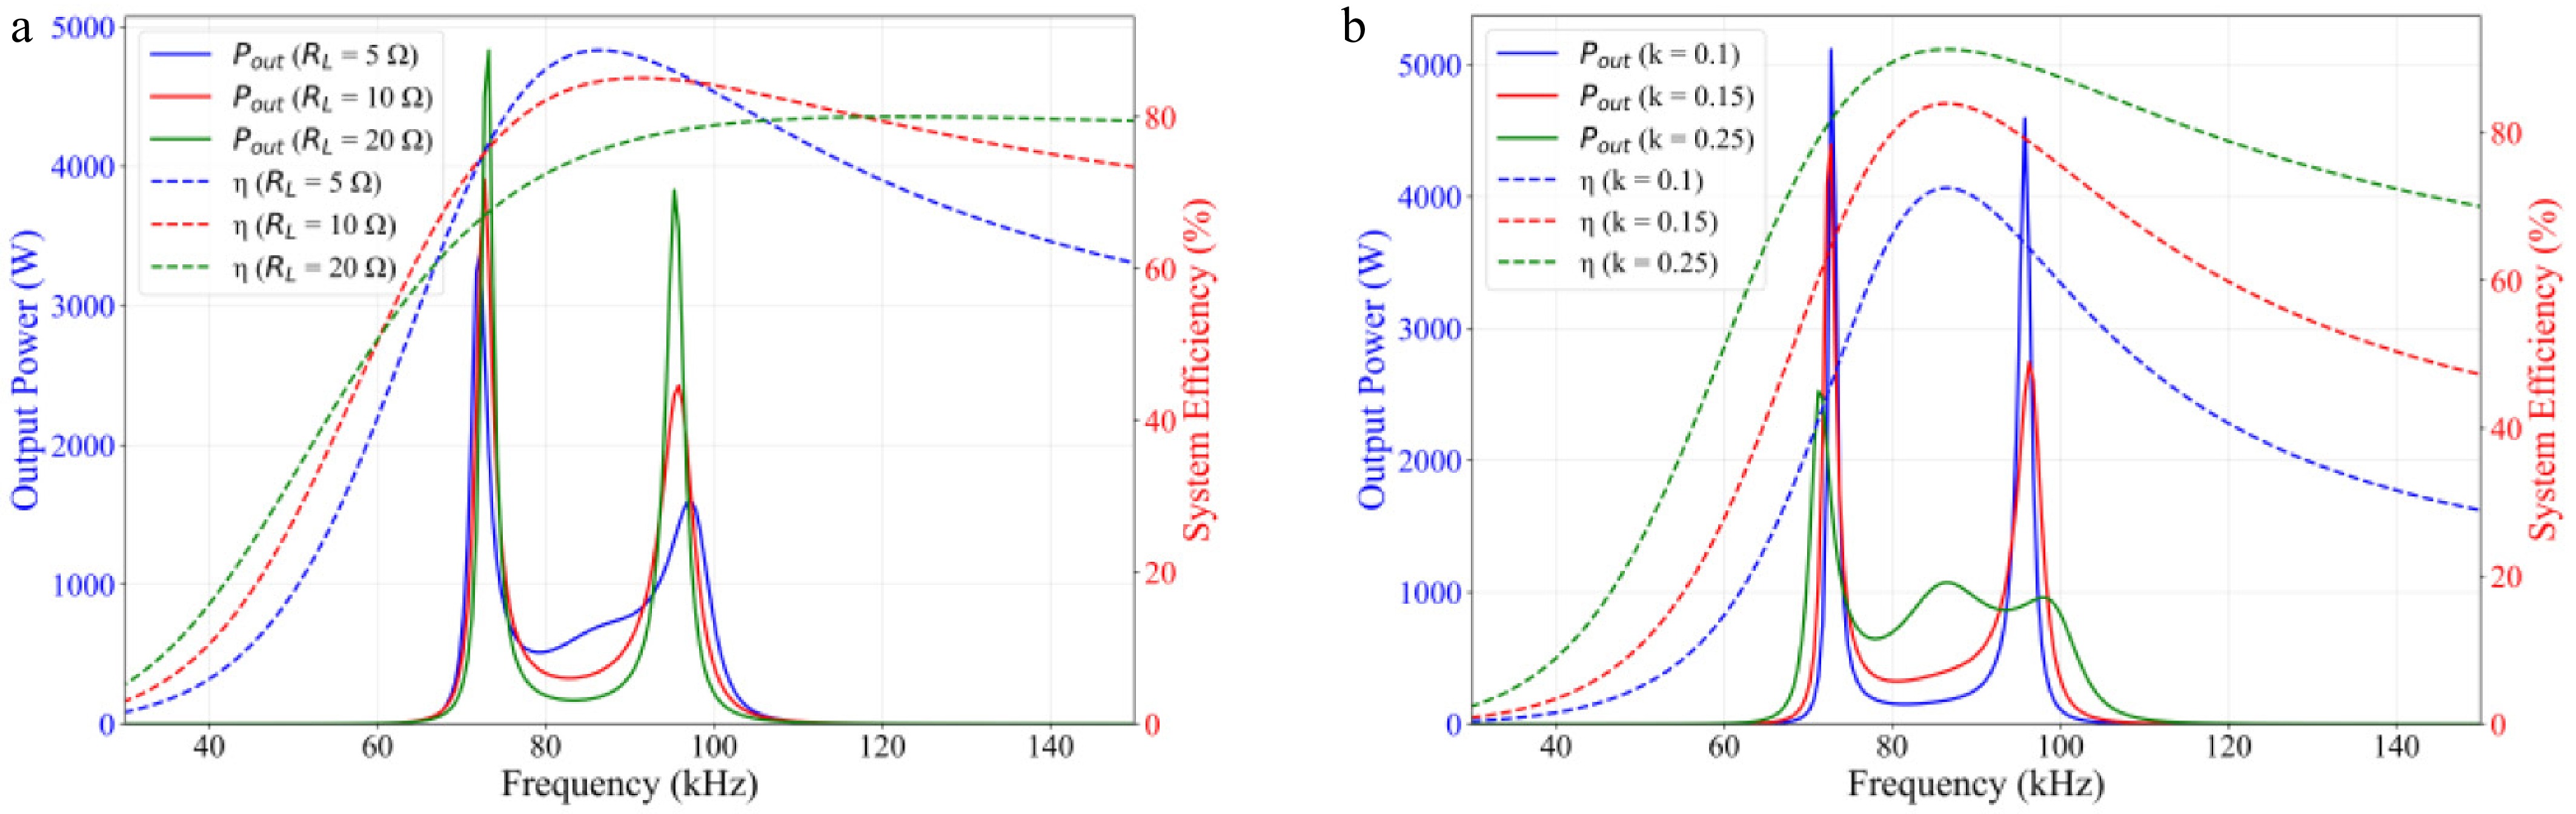
Figure 3.
System output characteristics. (a) load variation, and (b) coupling coefficient variation.
-
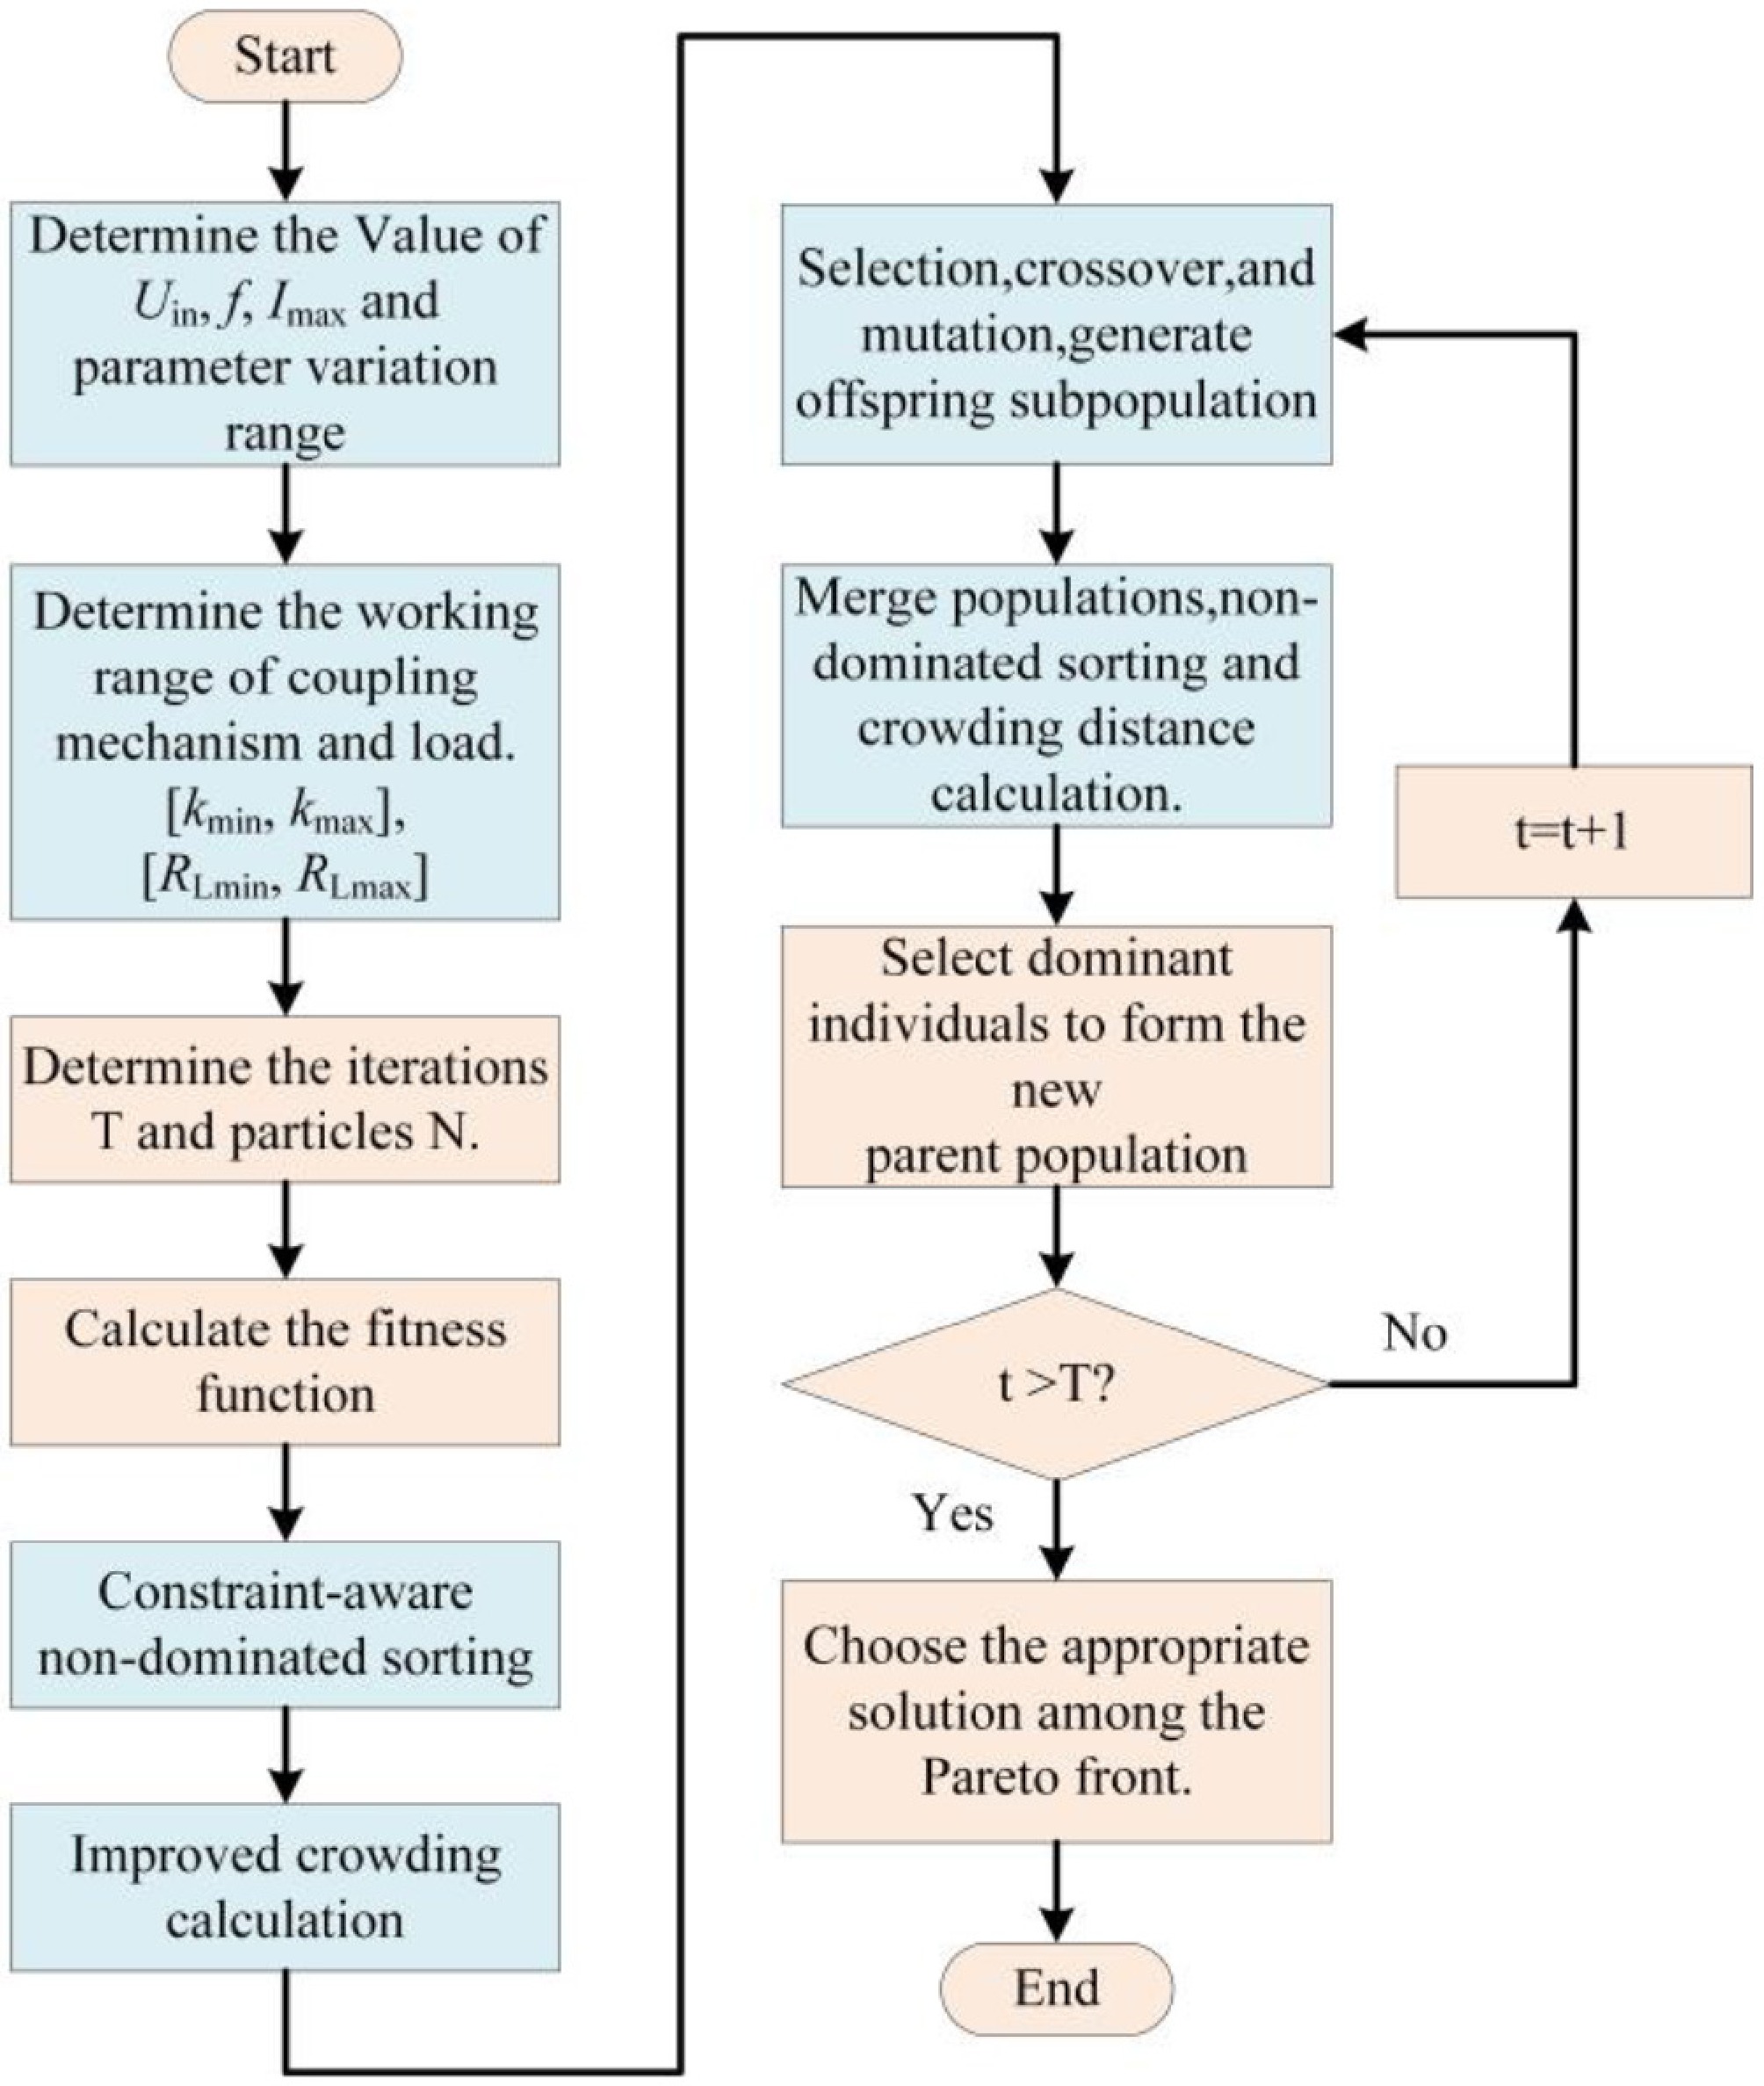
Figure 4.
Multi-objective parameter optimization process based on NSGA-II.
-
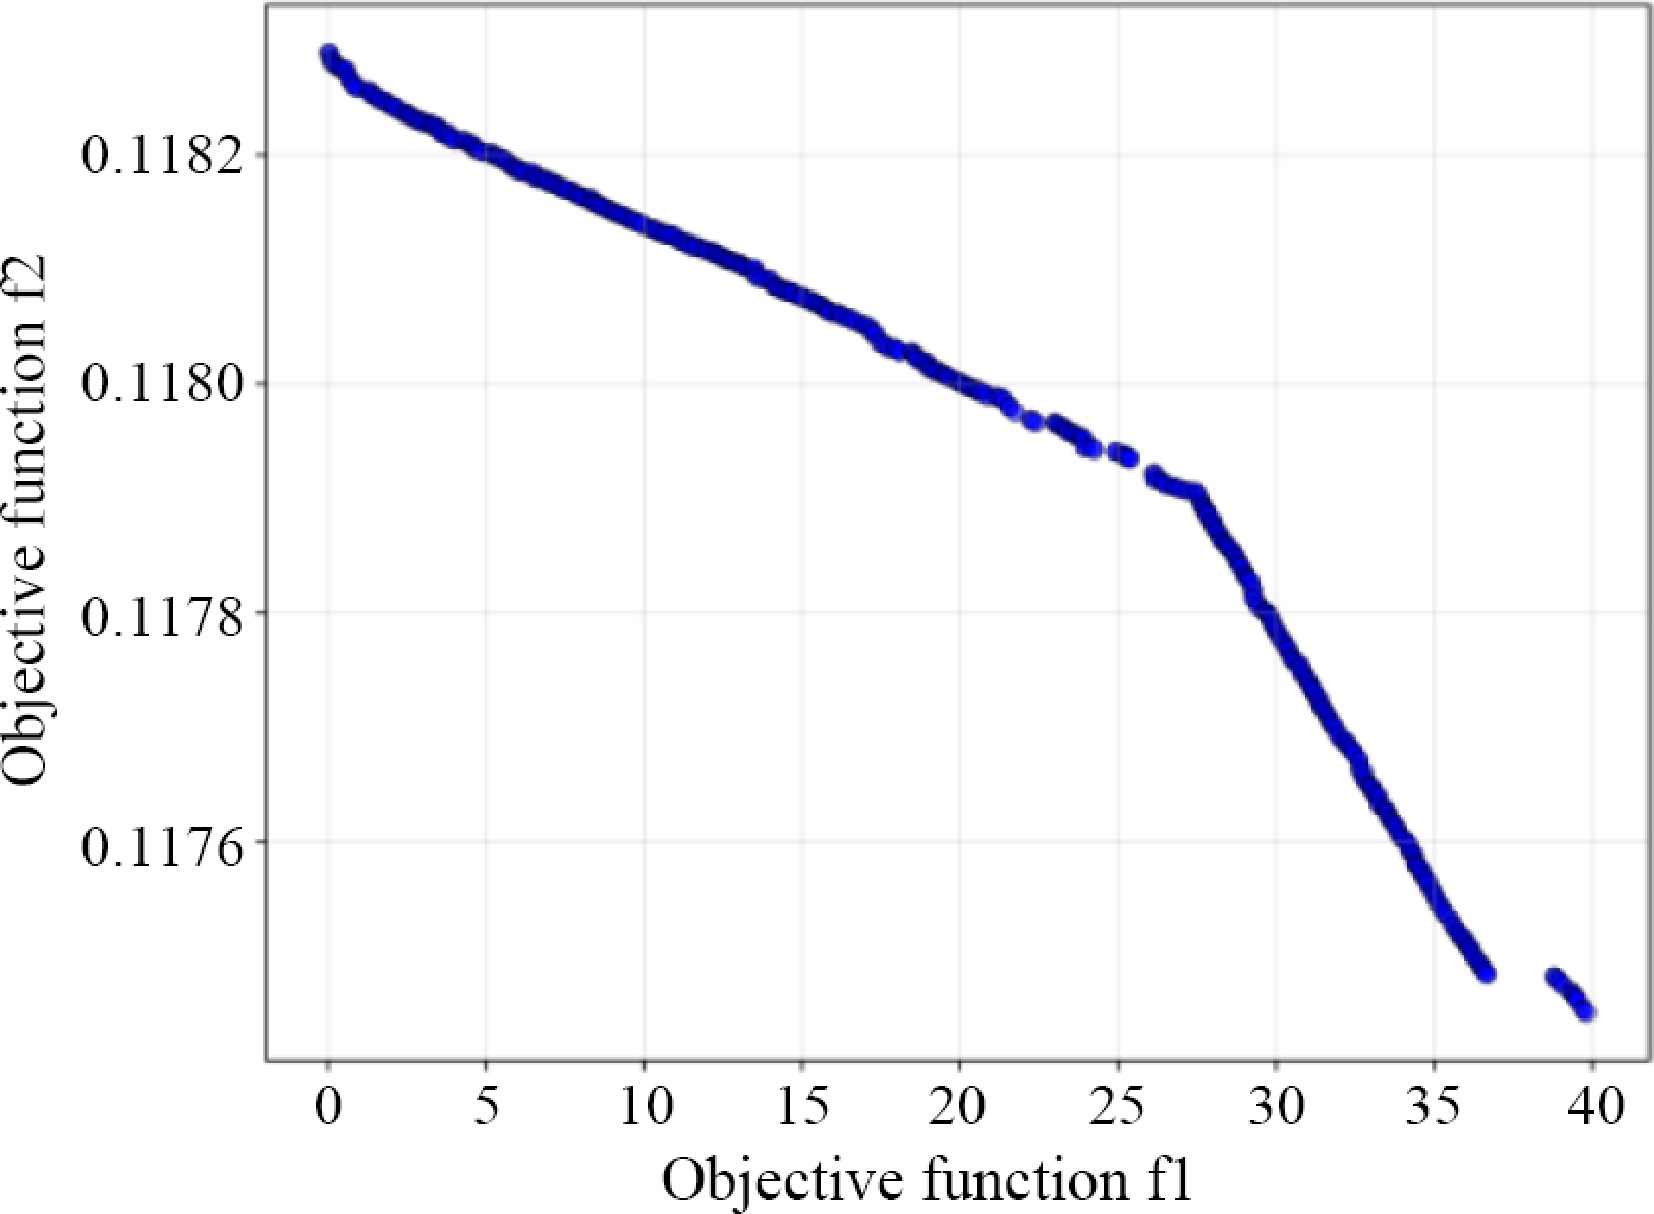
Figure 5.
Multi-objective optimization results.
-
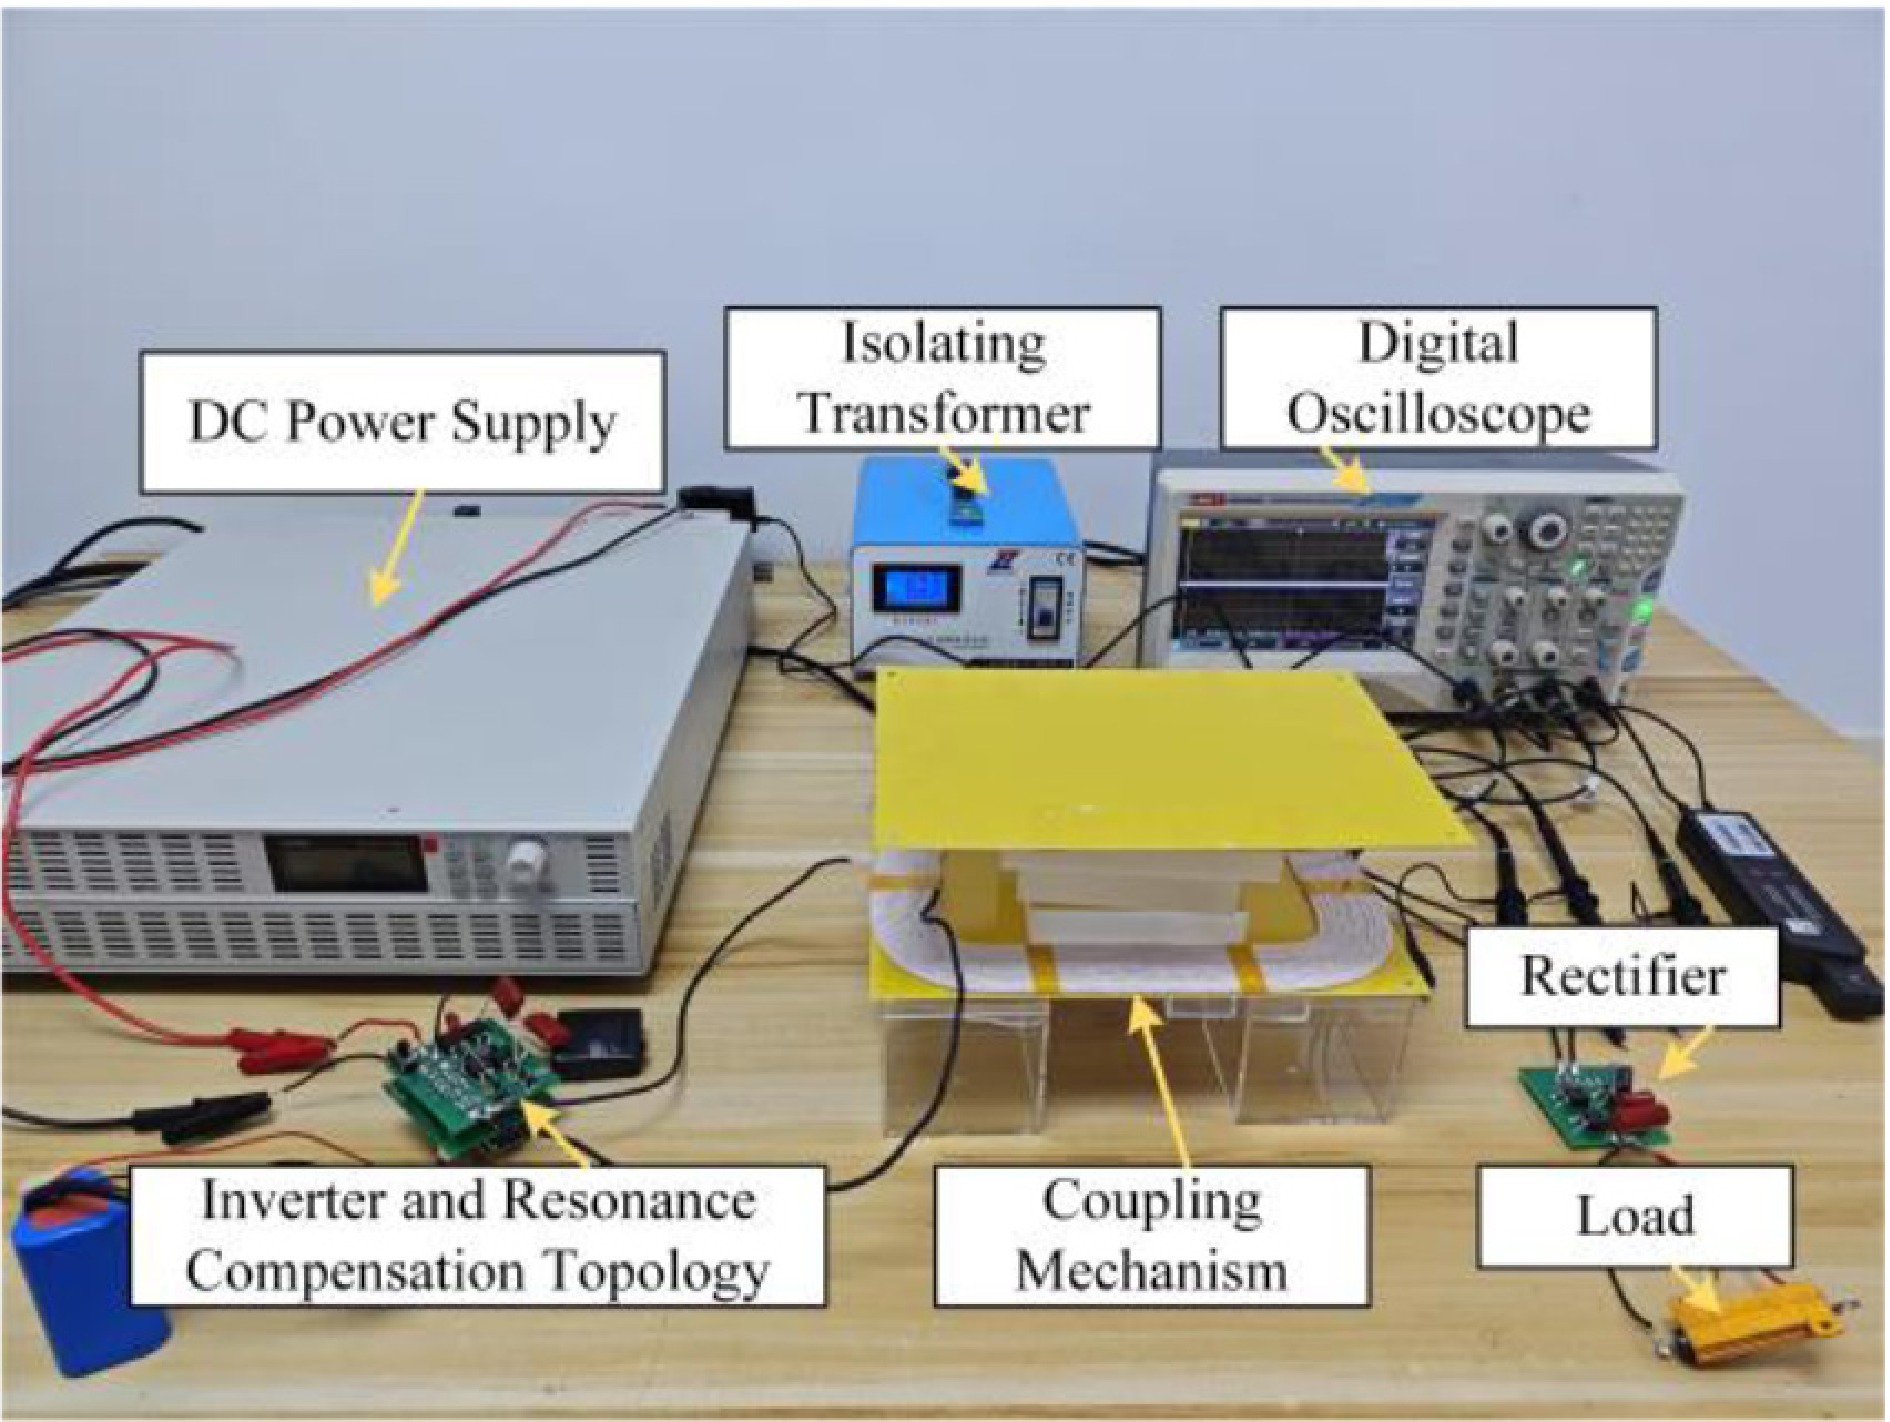
Figure 6.
Experimental setup of LCC-S WPT system.
-
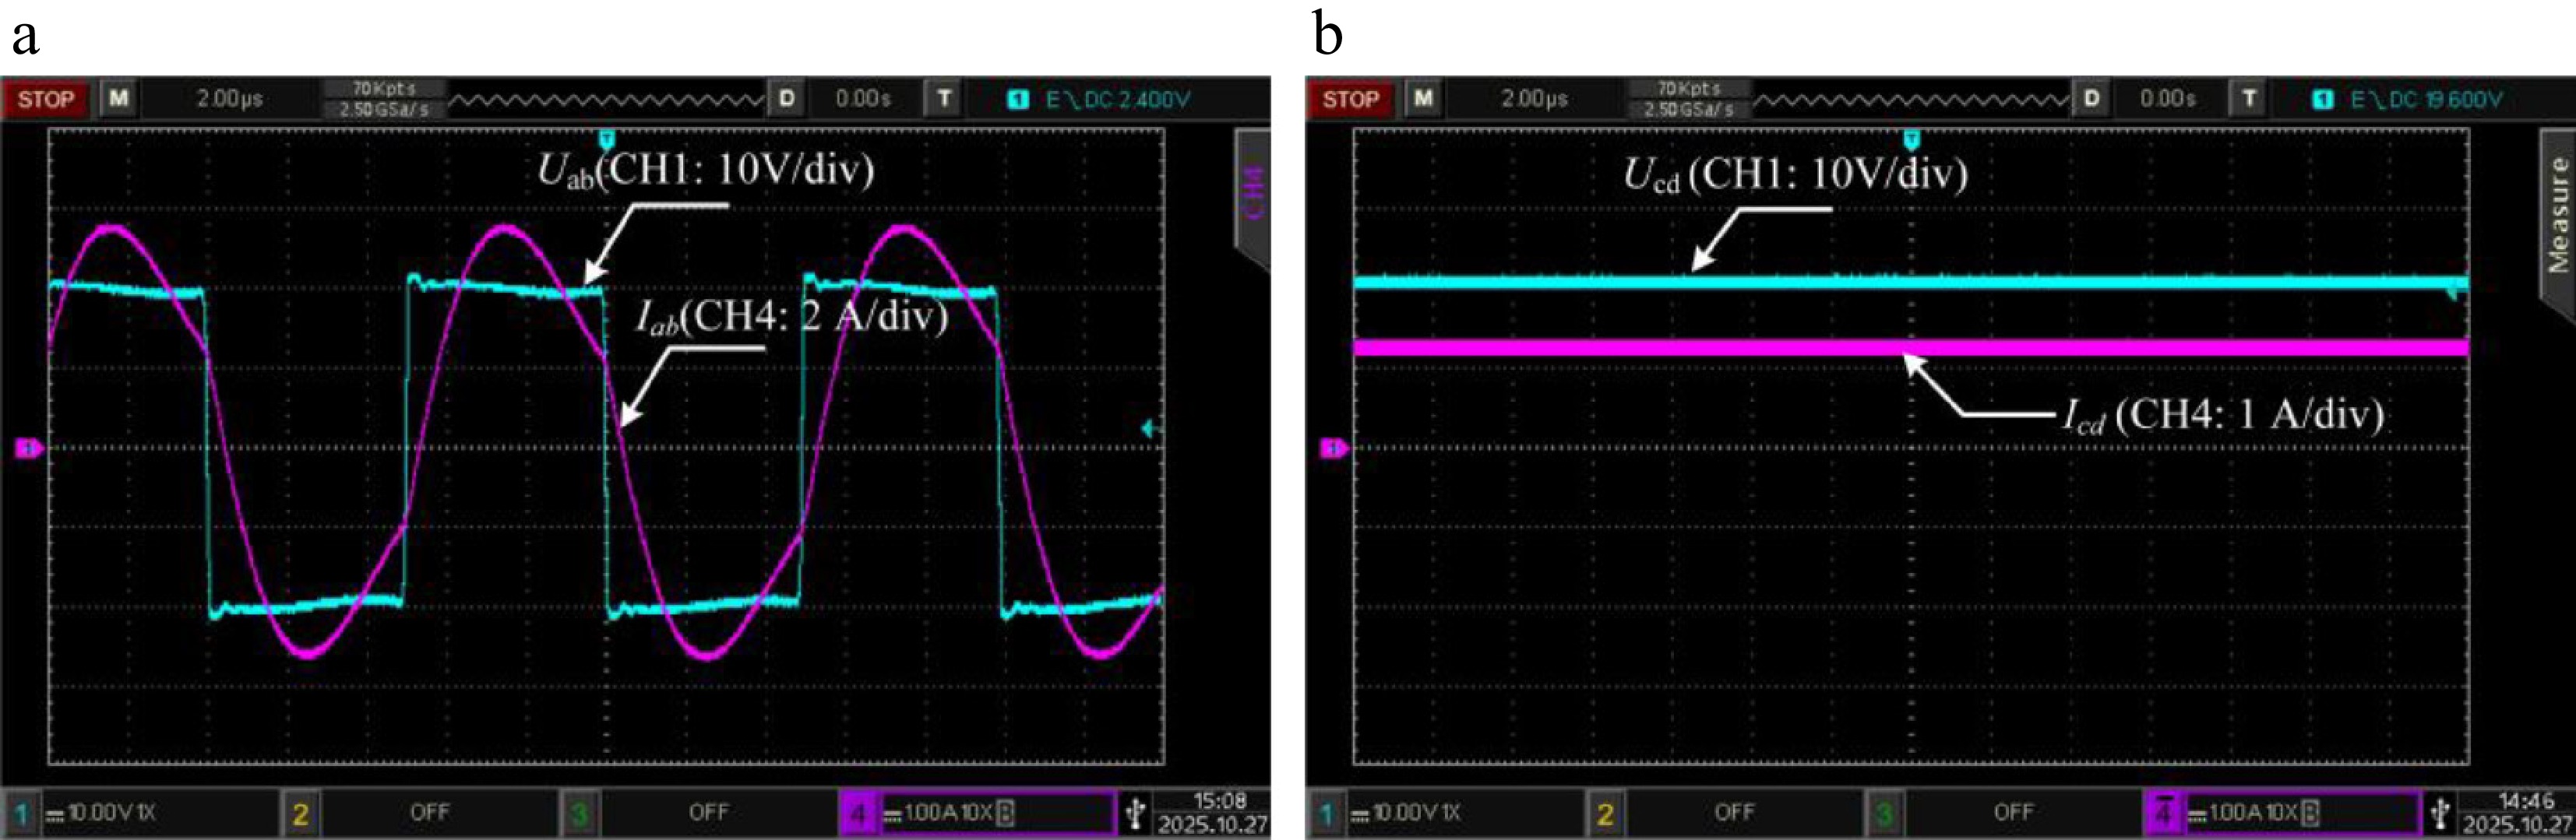
Figure 7.
Experimental results of set-I (a) inverter output, and (b) load.
-
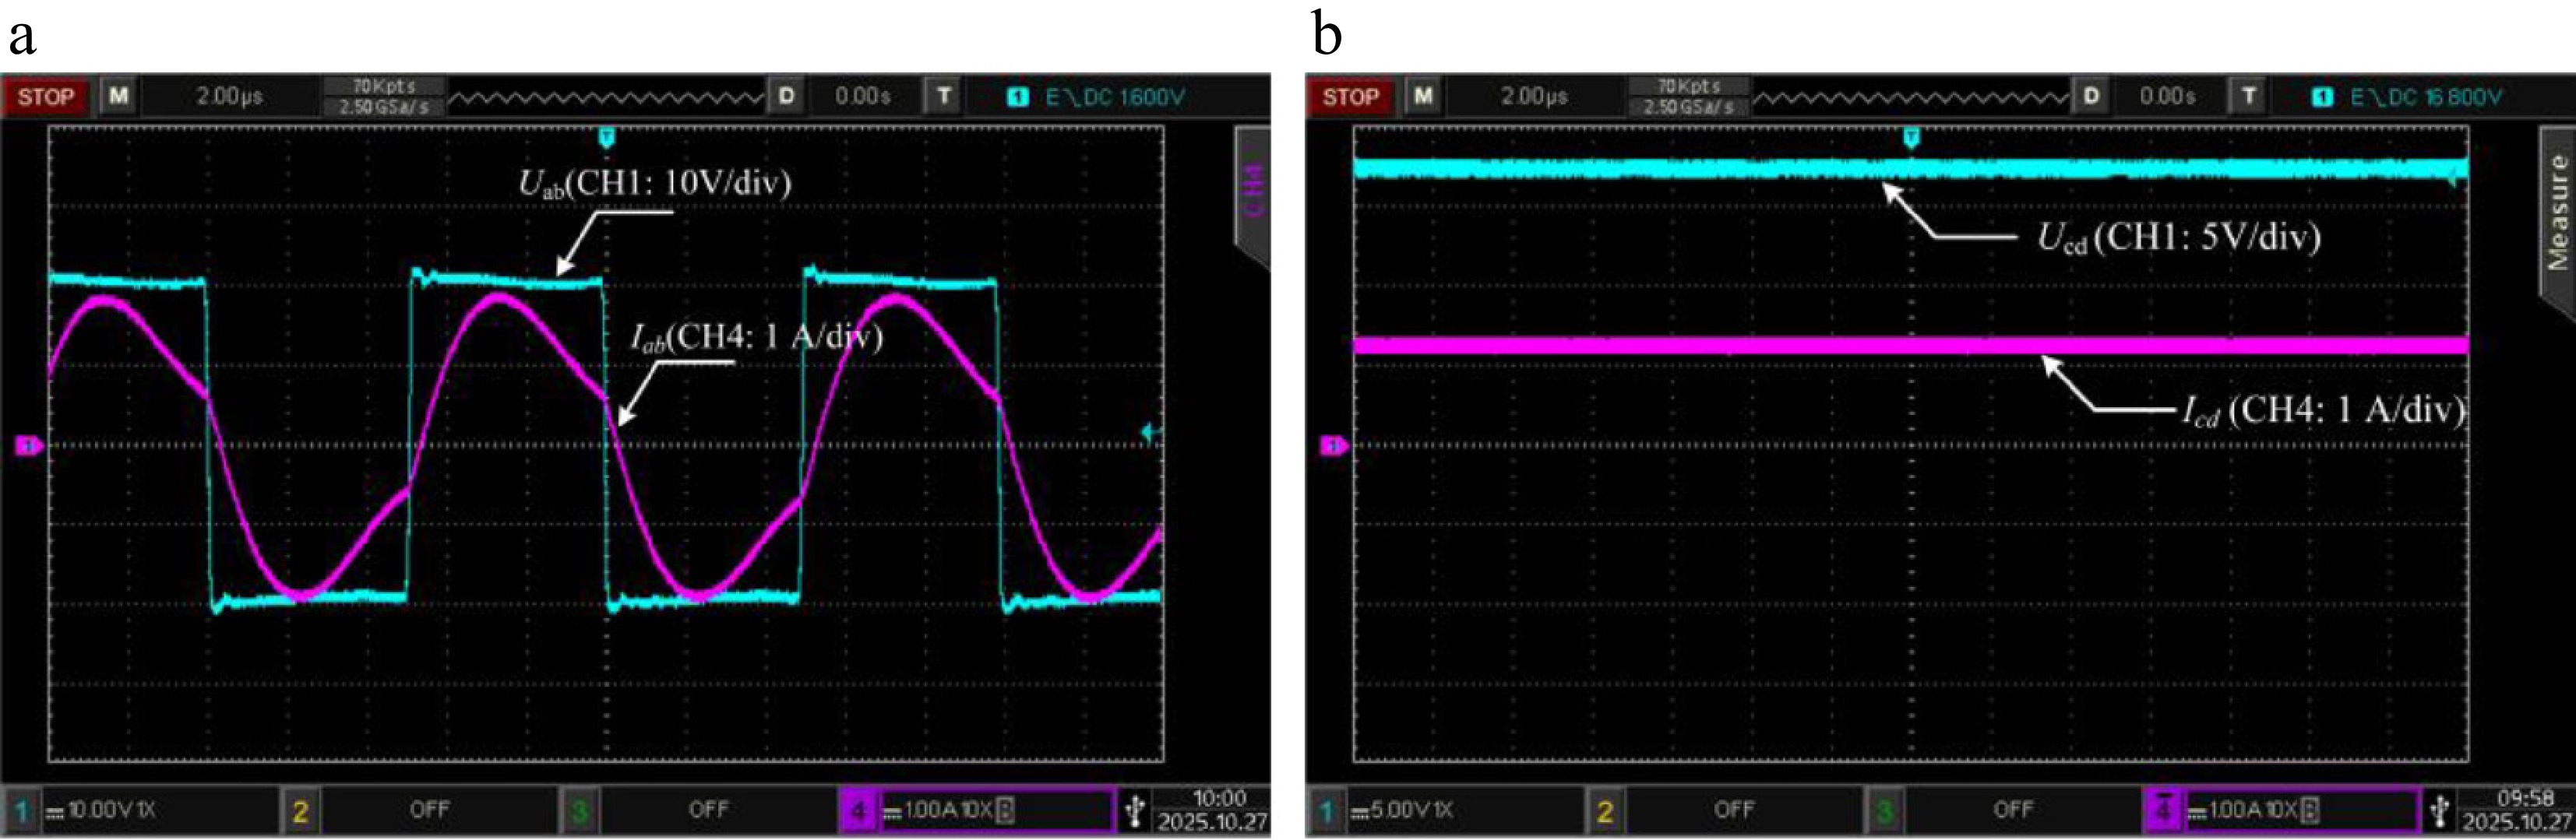
Figure 8.
Experimental results of set-II (a) inverter output, and (b) load.
-
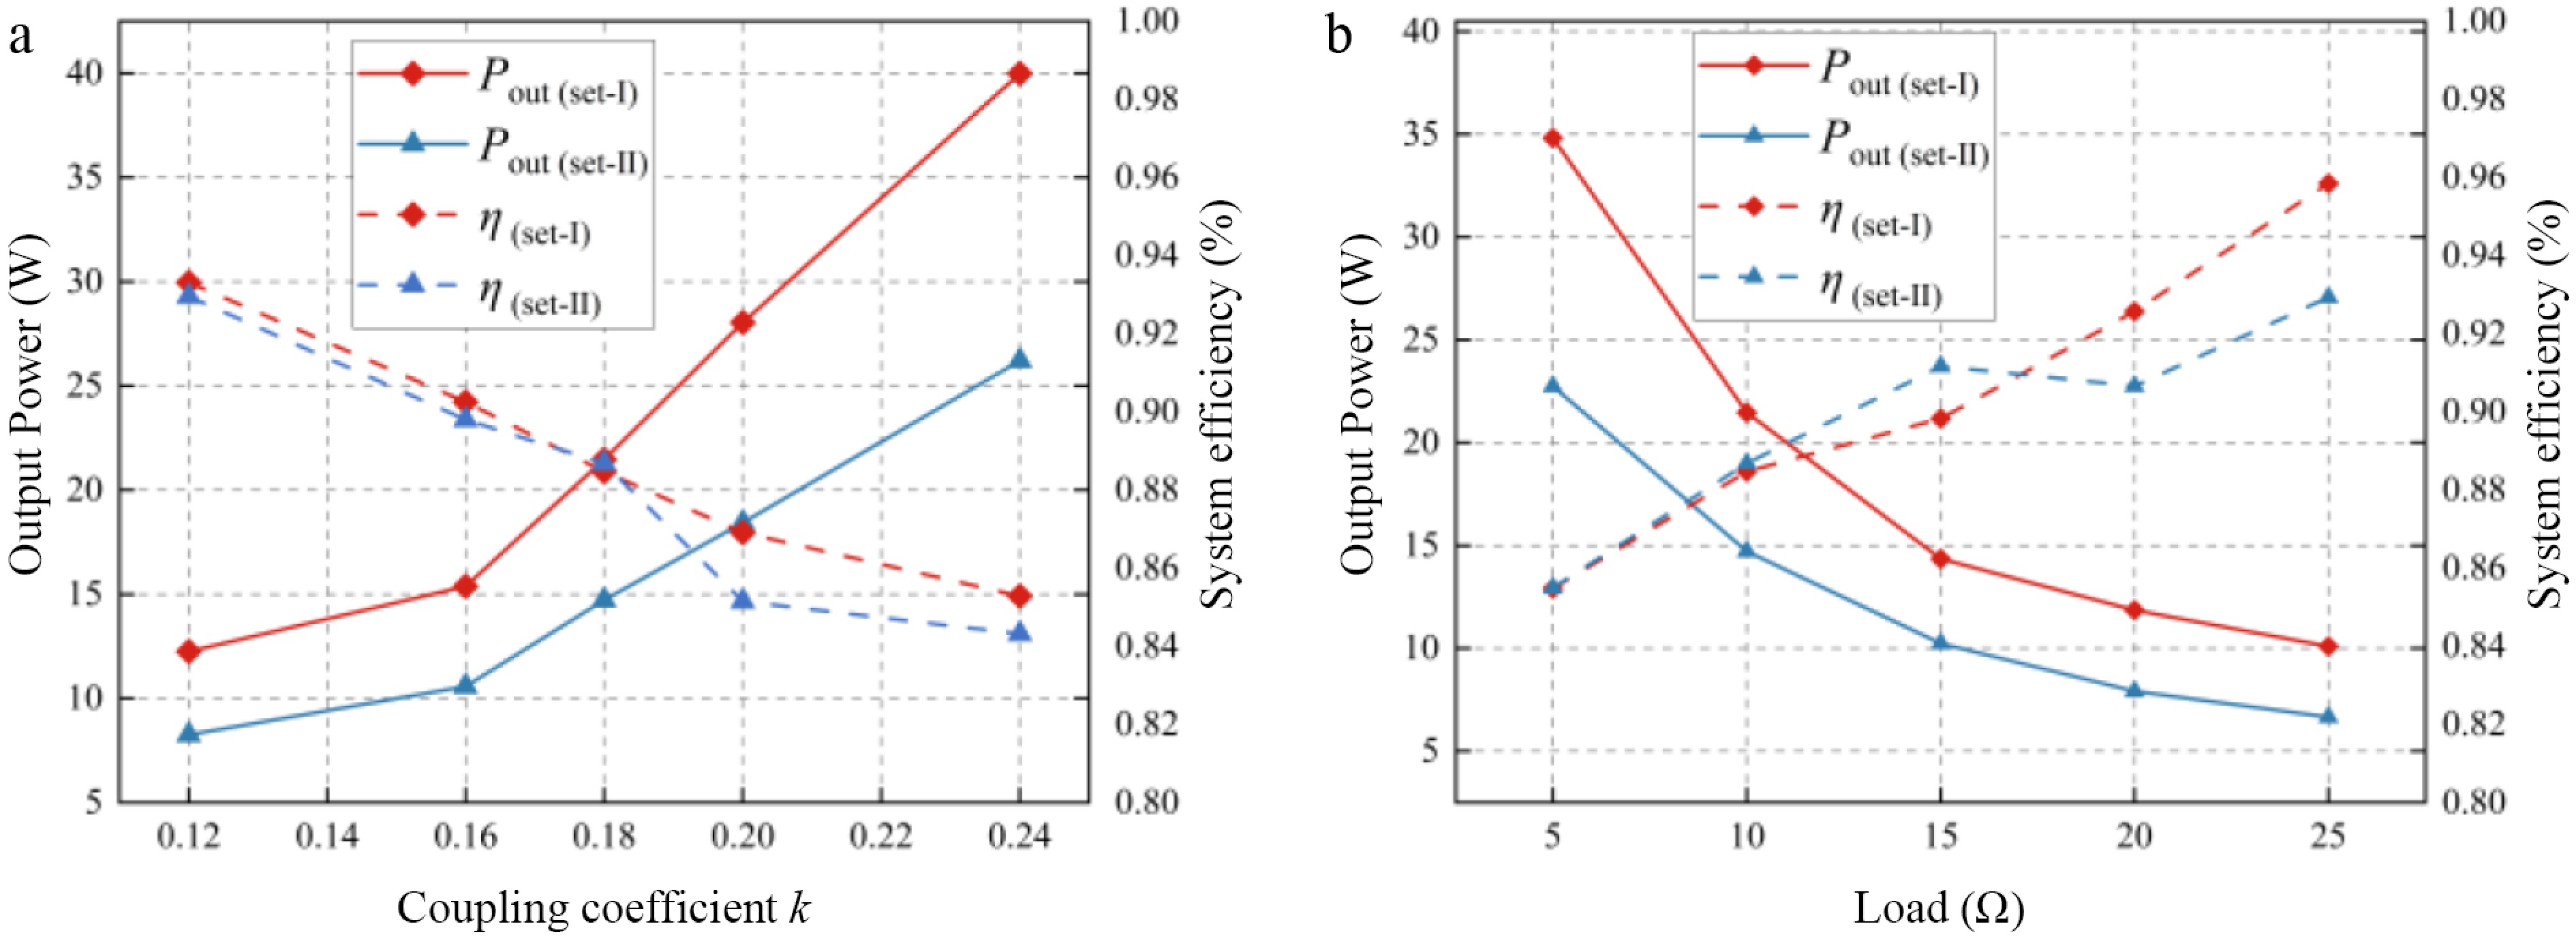
Figure 9.
Experimental results (a) coupling coefficient variation, and (b) load variation.
-
Method Main objective Limitation Ref. Genetic algorithm Compensation-network design for improving efficiency and power Does not explicitly consider both load and coupling coefficient variations in a unified framework [18] Analytical design Parameter design for power and efficiency improvement Mainly condition-specific design, without multi-objective optimization [19] Multi-objective optimization Efficiency and power optimization under dynamic conditions Does not focus on LCC-S compensation-parameter design with improved constraint-aware search [20] Parametric sweep simulation Performance analysis under parameter and misalignment variations Relies on discrete scanning, inefficient for multi-variable tradeoff optimization [21] Improved NSGA-II Robust multi-objective LCC-S compensation-parameter optimization under load and coupling coefficient variations Requires iterative optimization This article Table 1.
Comparison with representative optimization-based WPT design studies.
-
Parameter Value Parameter Value Parameter Value Uab 20 V LP1 2 μH f (1, 150) kHz LP 29.8 μH LS 30.2 μH k 0.1, 0.15, 0.25 RP 150.94 mΩ RS 126.08 mΩ RL 5, 10, 20 Table 2.
Parameter setting for output characteristic analysis.
-
Symbol Value Symbol Value Uab 20 V f 100 kHz LP 99.69 μH LS 100.5 μH RP 194.2 mΩ RS 225.8 mΩ LP1 (set-I) 20.9 μH LP1 (set-II) 25.24 μH CP1 (set-I) 120.5 nF CP1 (set-II) 100.5 nF CP (set-I) 32.95 nF CP (set-II) 33.3 nF CS (set-I) 24.73 nF CS (set-II) 24.73 nF RL [5, 5, 25 ] Ω k [0.12, 0.04, 0.24] Table 3.
Experimental parameter setting.
Figures
(9)
Tables
(3)