-
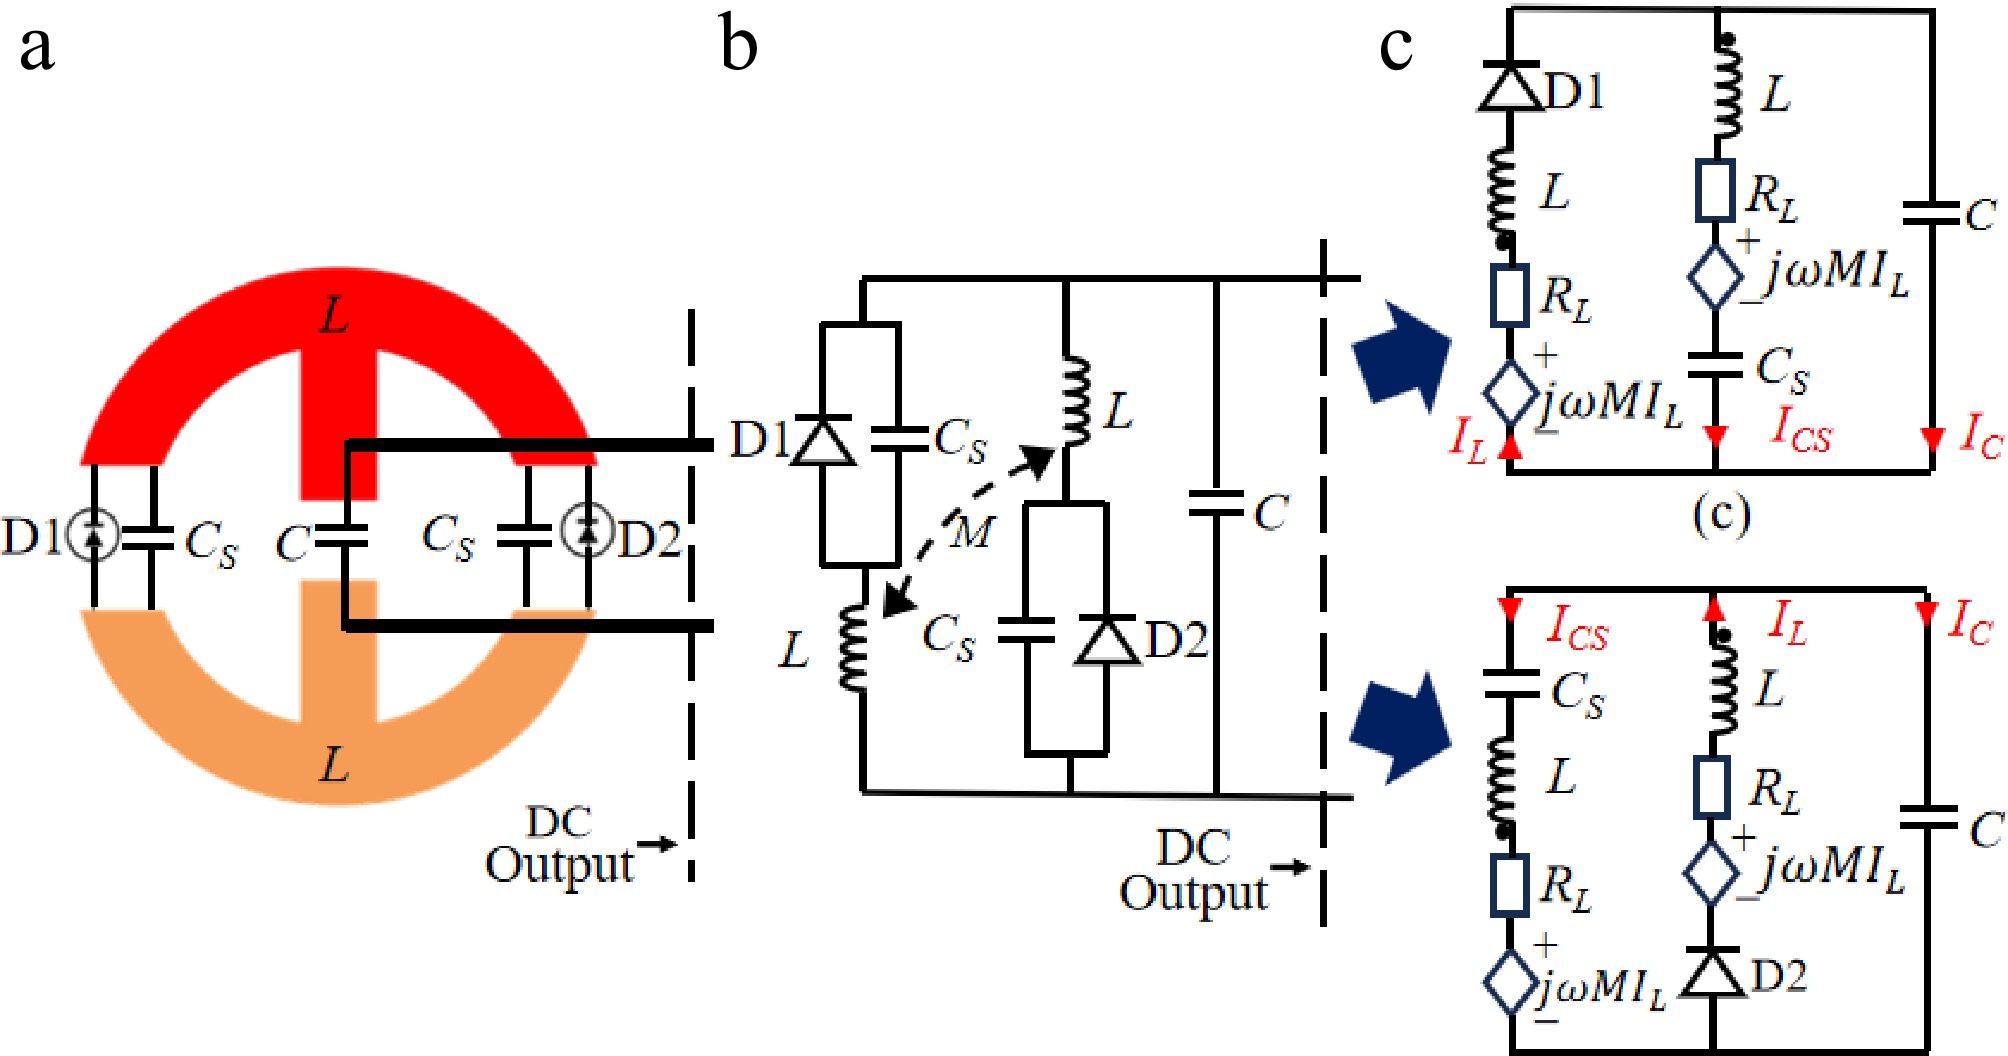
Figure 1.
The toroidal rectifier and simplified equivalent circuit models. (a) Physical structure diagram of the rectifier toroidal. (b) Equivalent circuit model of a receiver rectifier toroidal. (c) Equivalent circuit when D1 is on, and D2 is off. (d) Equivalent circuit when D1 is off, and D2 is on.
-
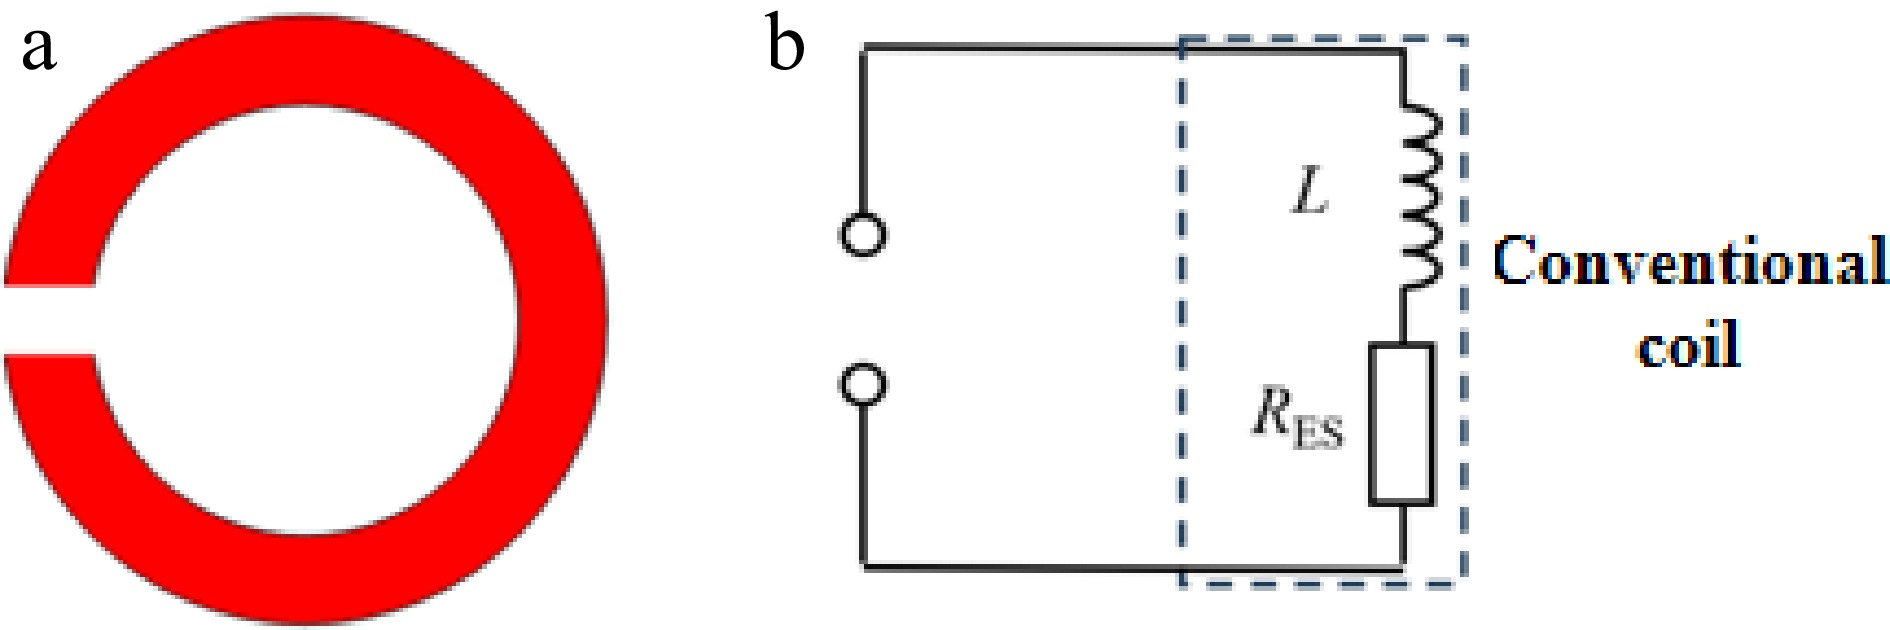
Figure 2.
Single-port toroidal coil. (a) Schematic of the physical model. (b) Schematic of the equivalent circuit.
-
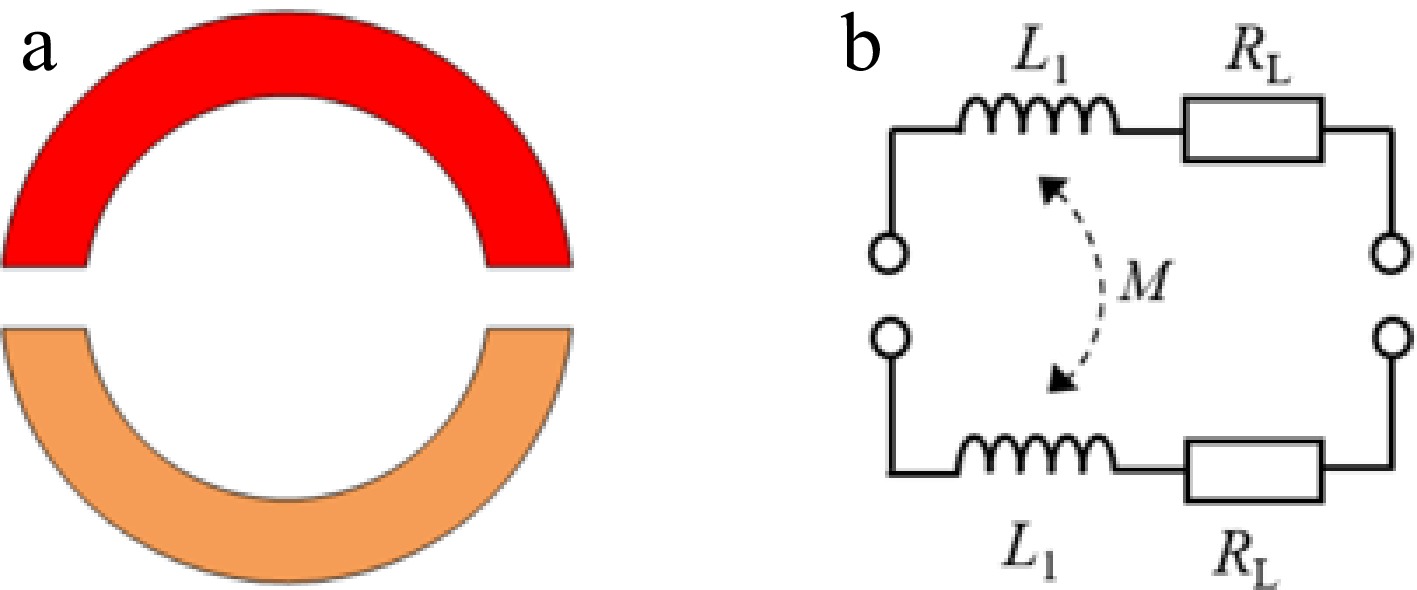
Figure 3.
Dual-port toroidal coil. (a) Schematic of the physical model. (b) Schematic of the equivalent circuit.
-
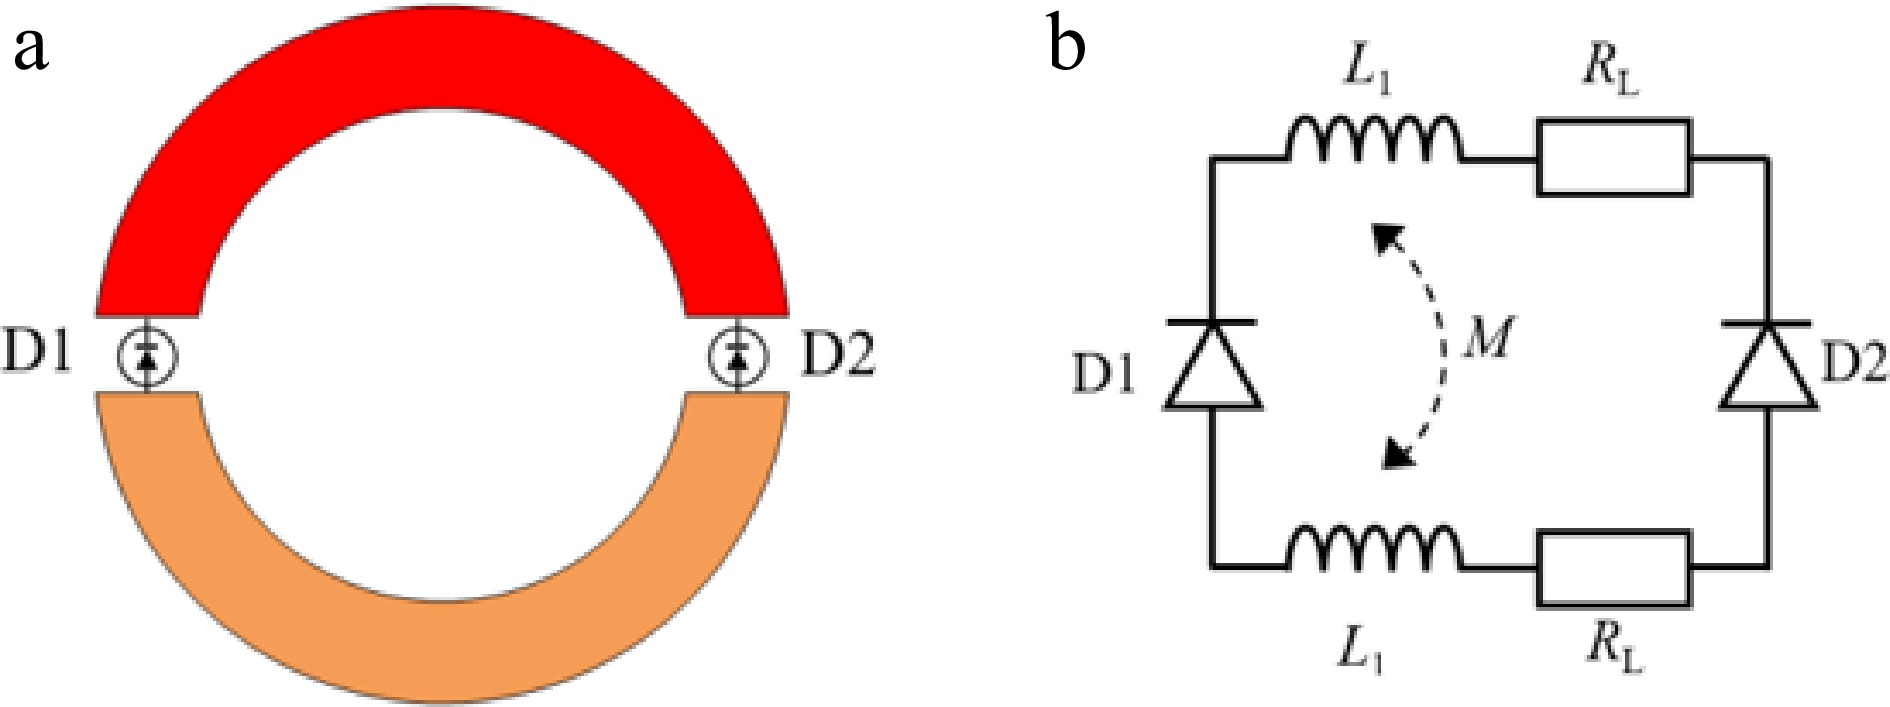
Figure 4.
Rectifier toroidal coil. (a) Schematic of the physical model. (b) Schematic of the equivalent circuit.
-
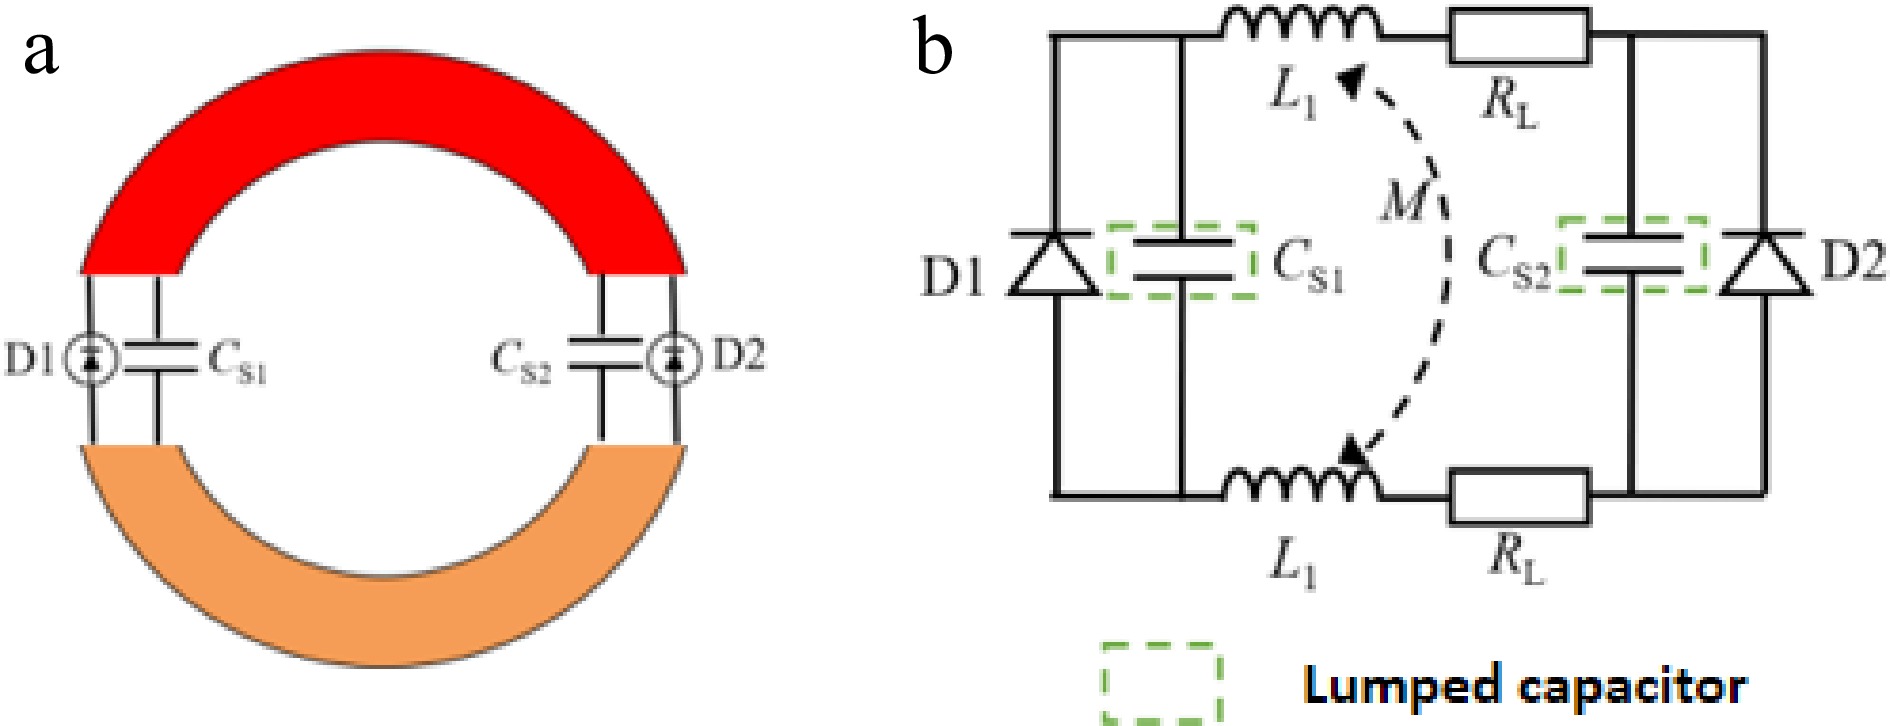
Figure 5.
Capacitor-compensated rectifier toroidal coil. (a) Schematic of the physical model. (b) Schematic of the equivalent circuit.
-
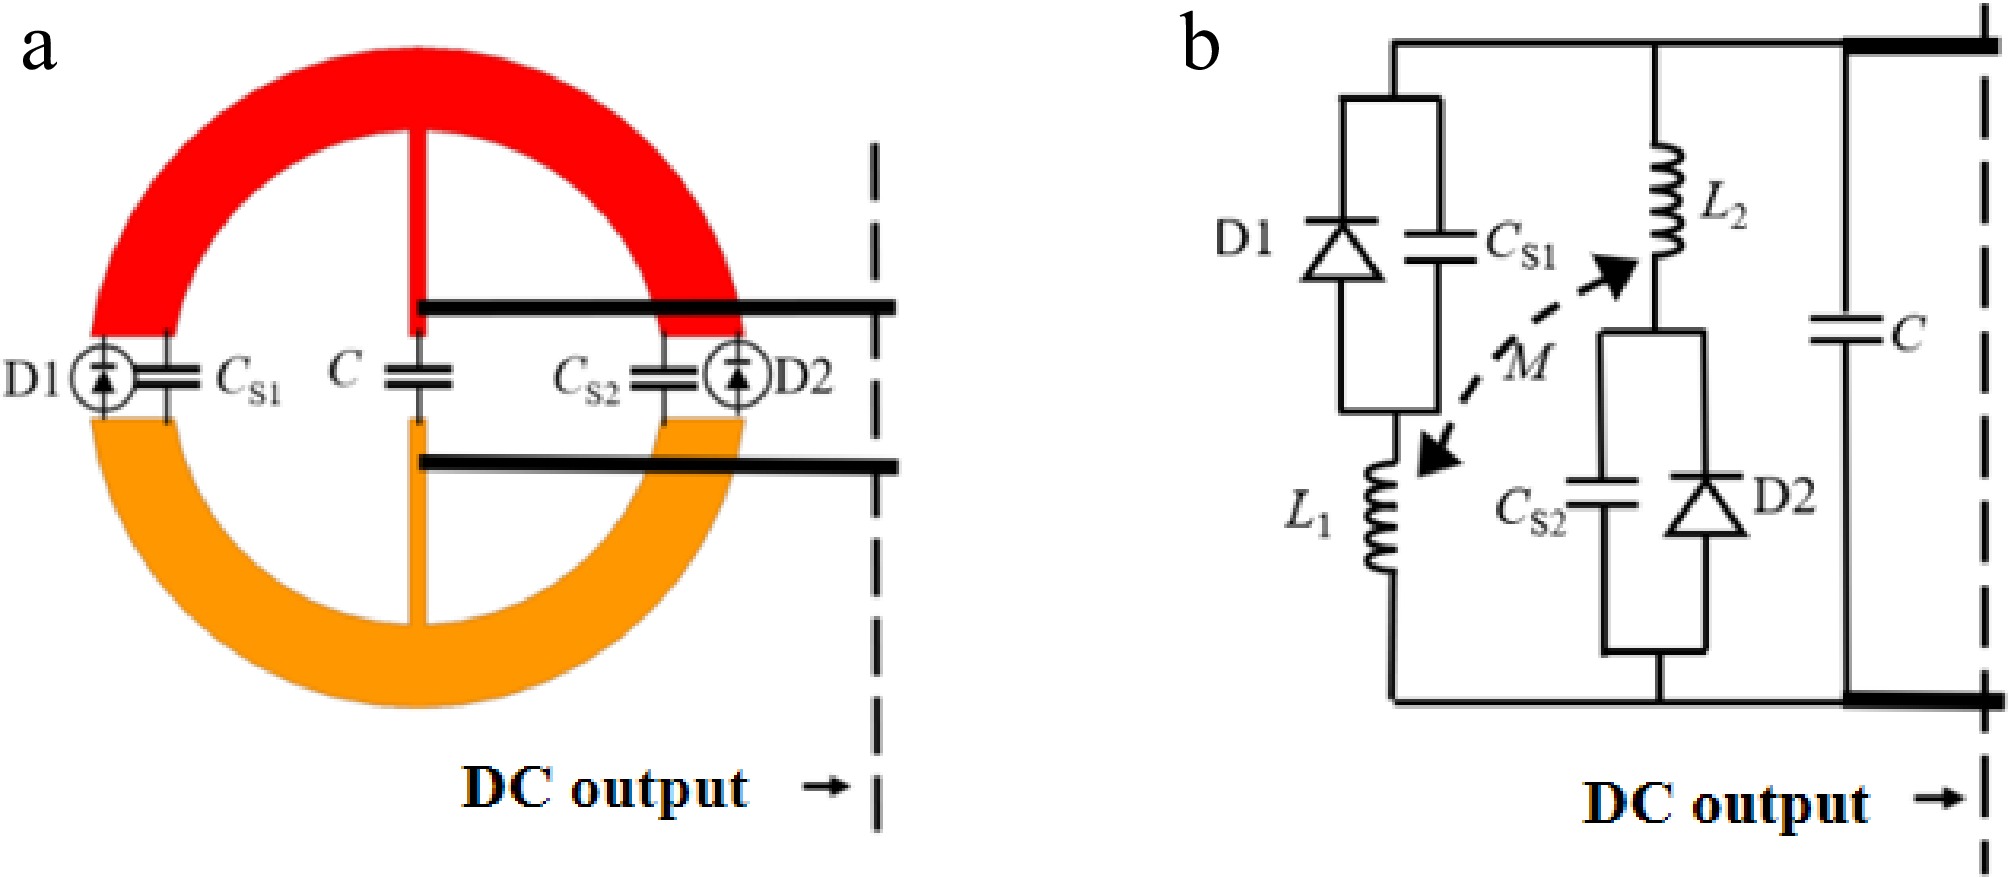
Figure 6.
Non-self-resonant rectifier toroidal. (a) Schematic of the physical model. (b) Schematic of the equivalent circuit.
-
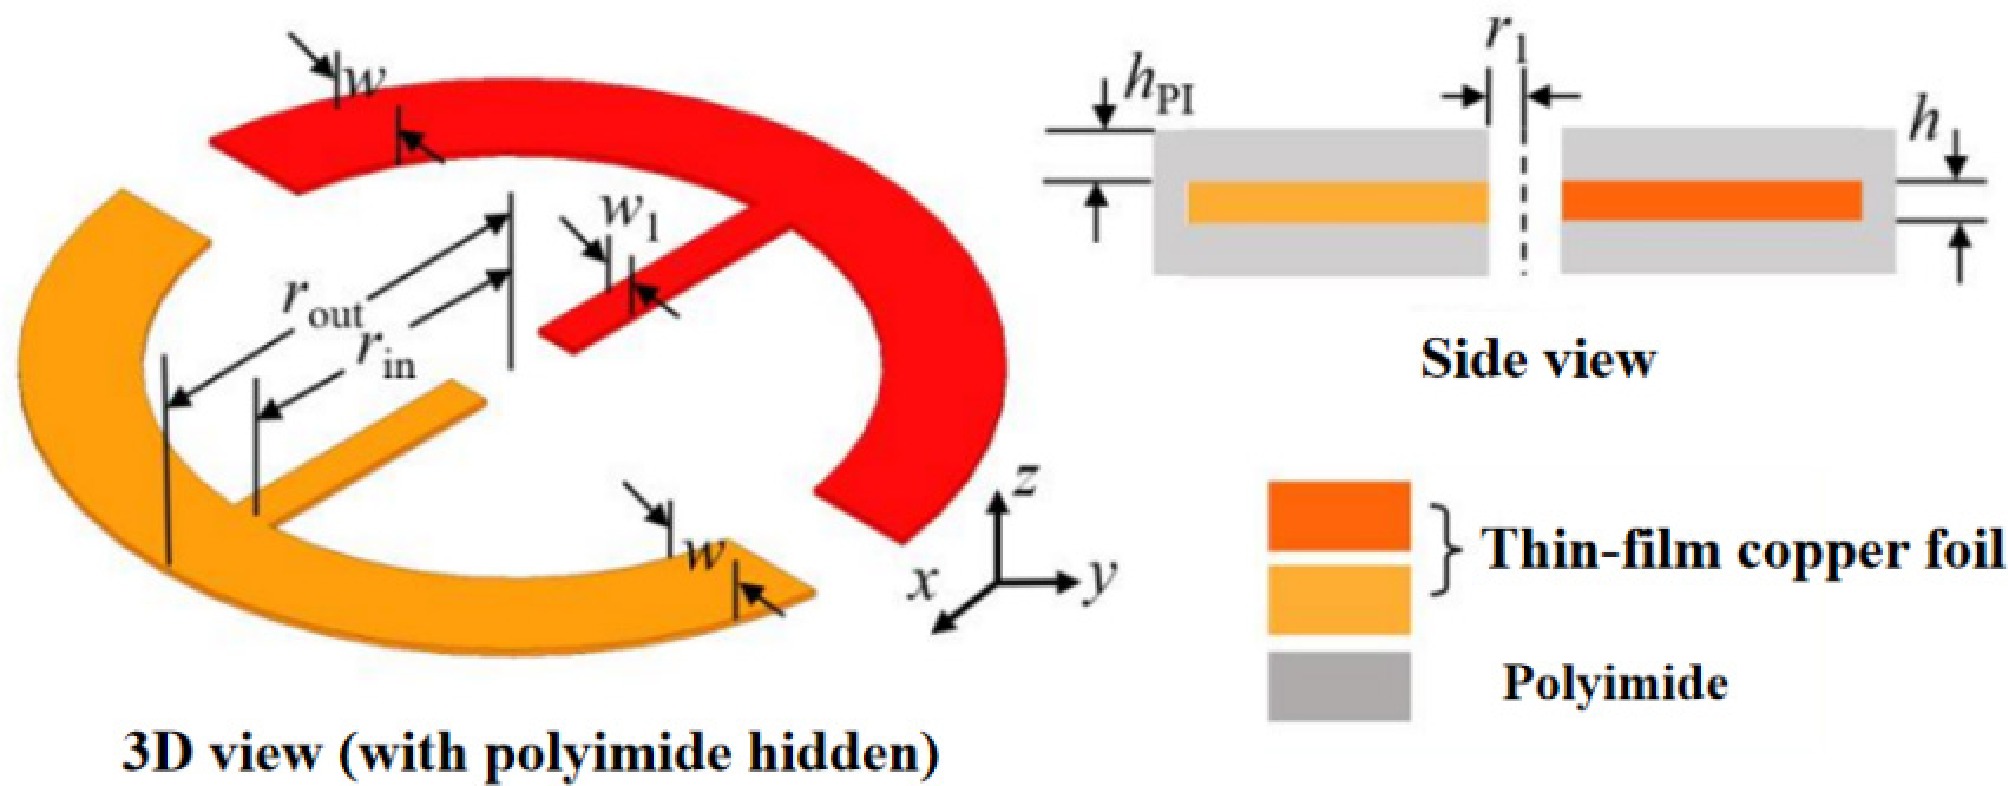
Figure 7.
Schematic of the non-self-resonant rectifier toroidal coil (lumped elements not shown).
-
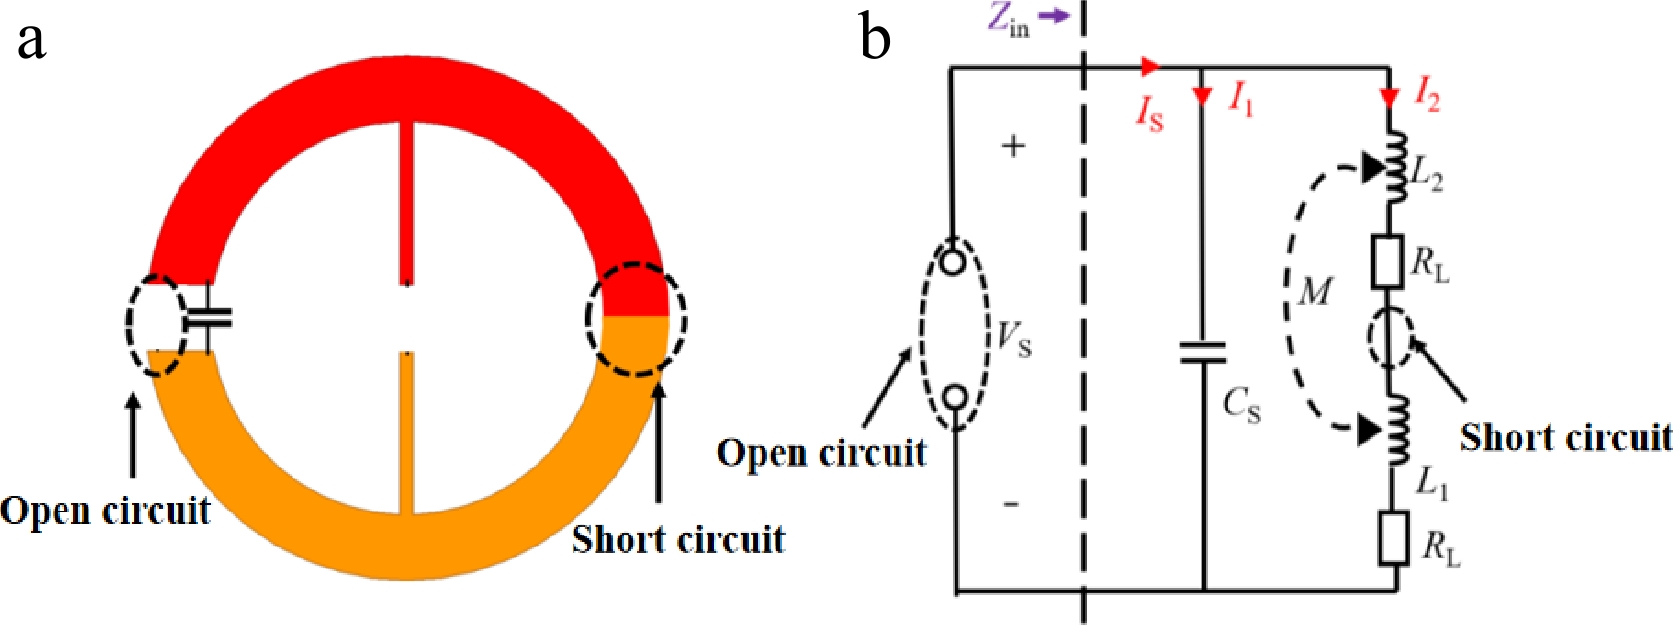
Figure 8.
Toroidal coil. (a) Schematic of the physical model. (b) Schematic of the equivalent circuit.
-
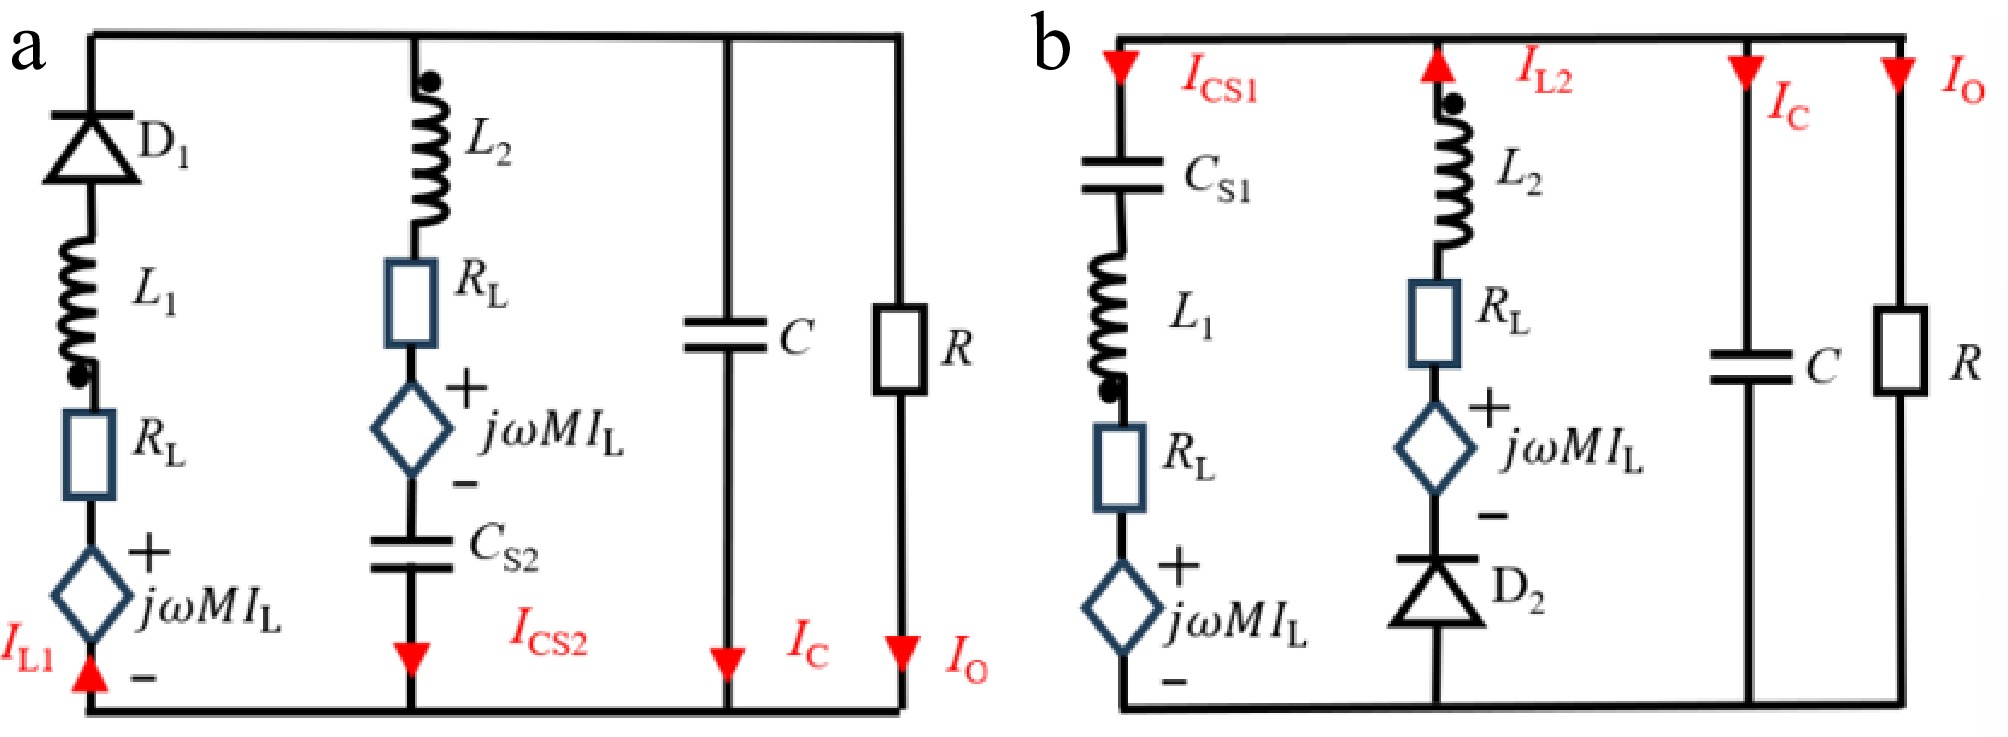
Figure 9.
Two operating topologies of the non-self-resonant rectifier toroidal coil. (a) D2 is conducting, and D1 is cut off. (b) D1 is conducting, and D2 is cut off.
-
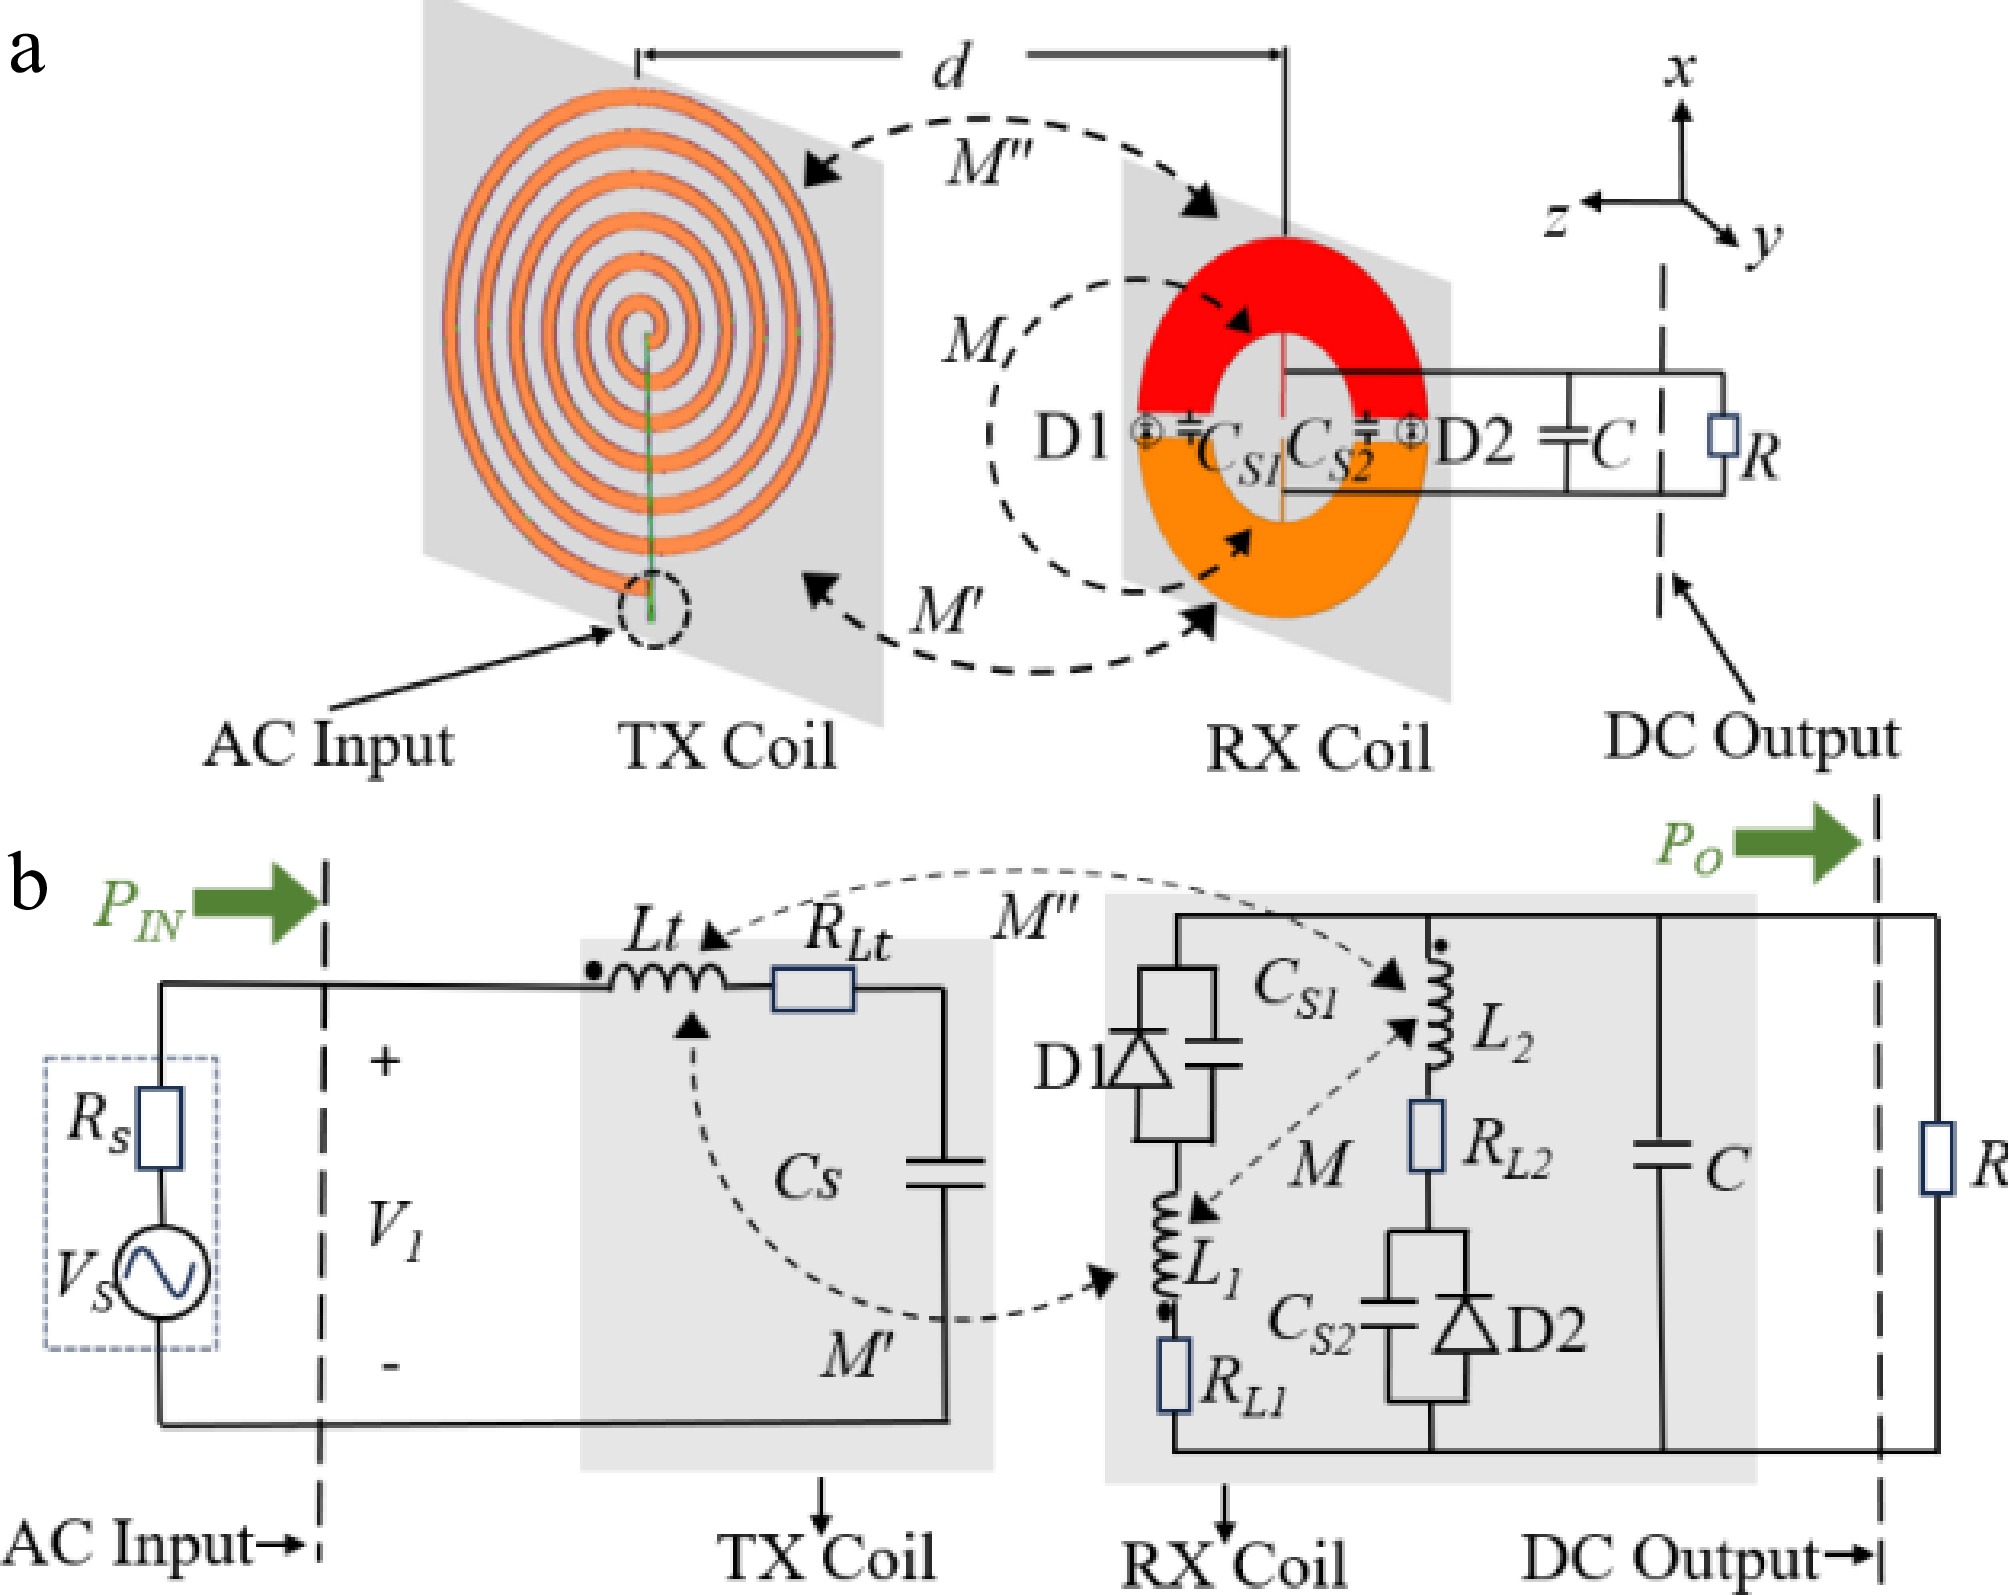
Figure 10.
(a) Structure, and (b) equivalent circuit of a toroidal rectifier in WPT.
-
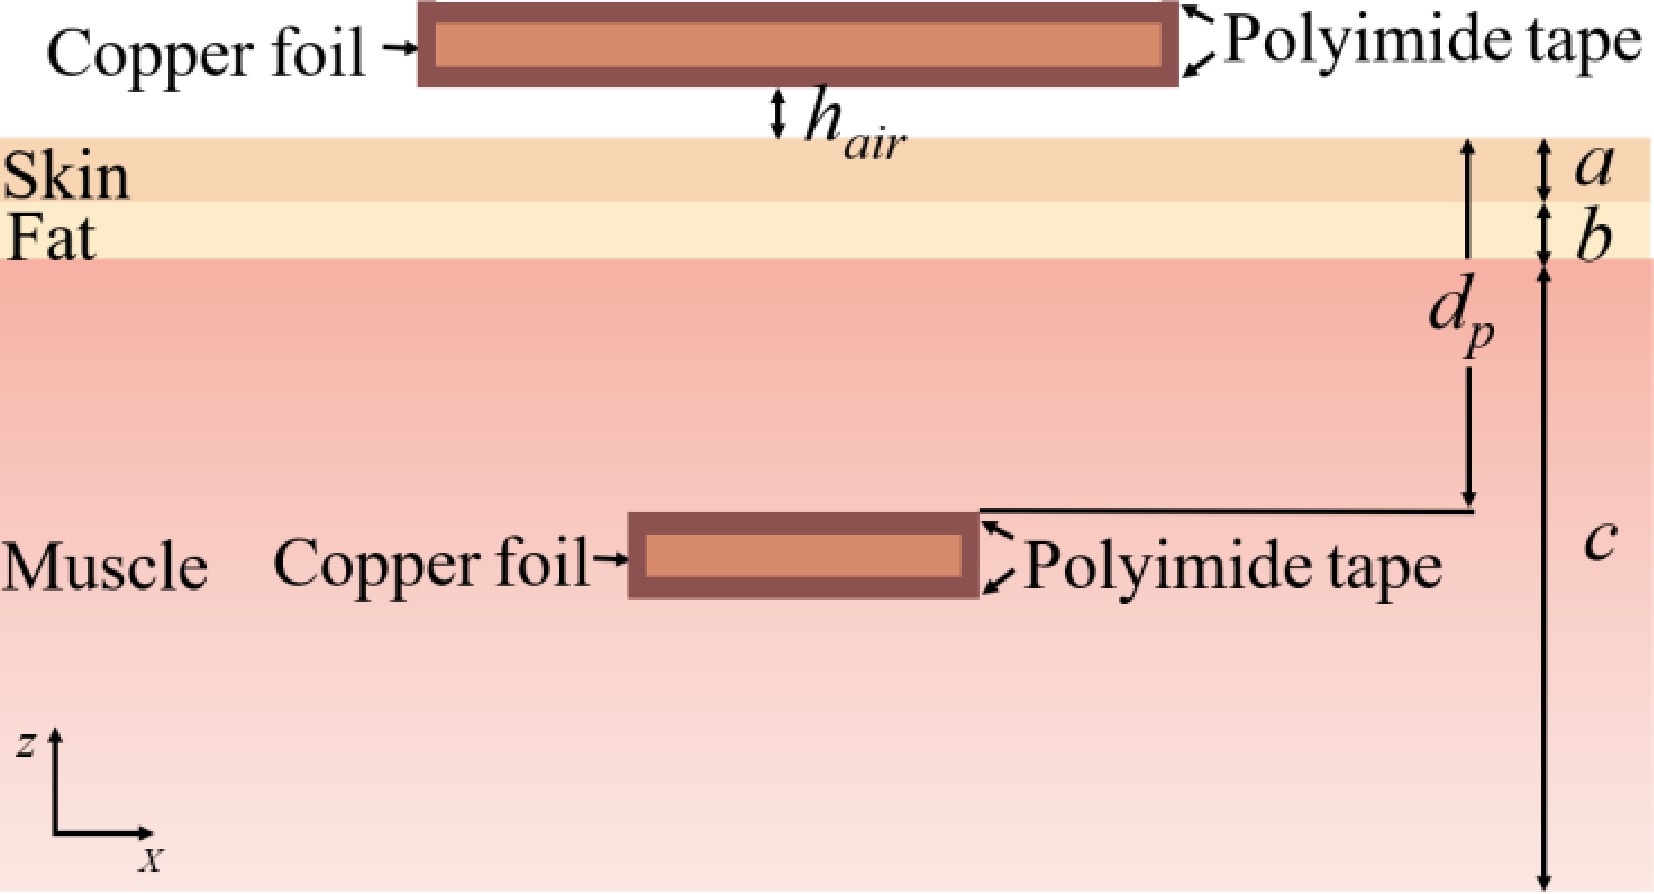
Figure 11.
Overall structure of the three-tissue-layer model of skin-fat-muscle with thicknesses of 2, 2, and 6 mm.
-
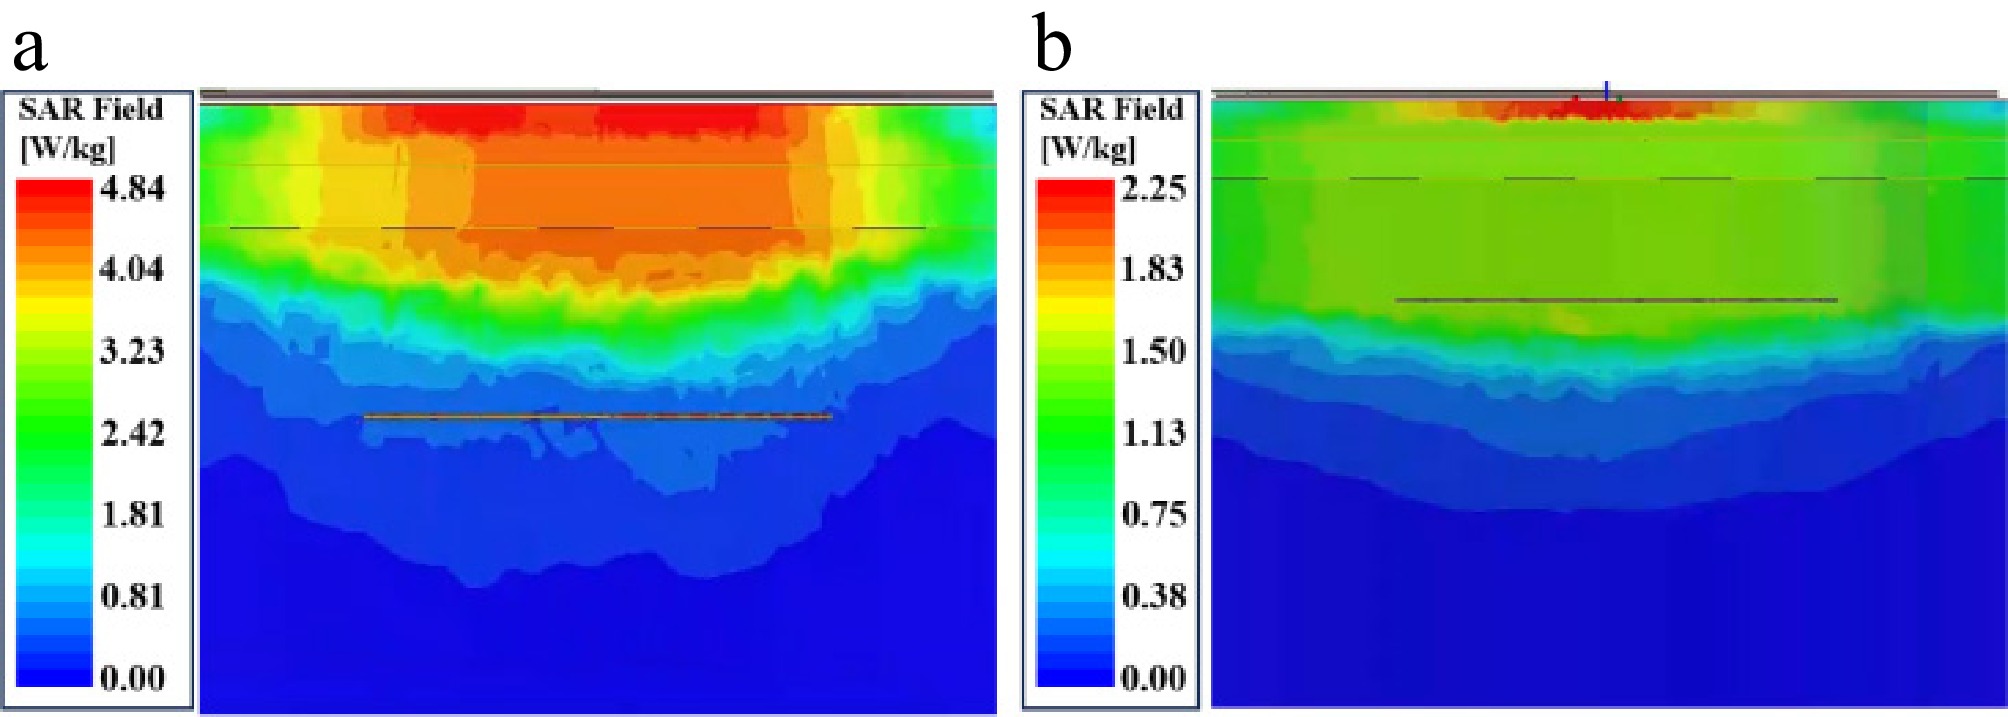
Figure 12.
Distribution of the average SAR in the human body at 40.68 MHz with a 1 W input power and a 10 mm implant depth. (a) 1 g-avg SAR, and (b) 10 g-avg SAR distributions.
-
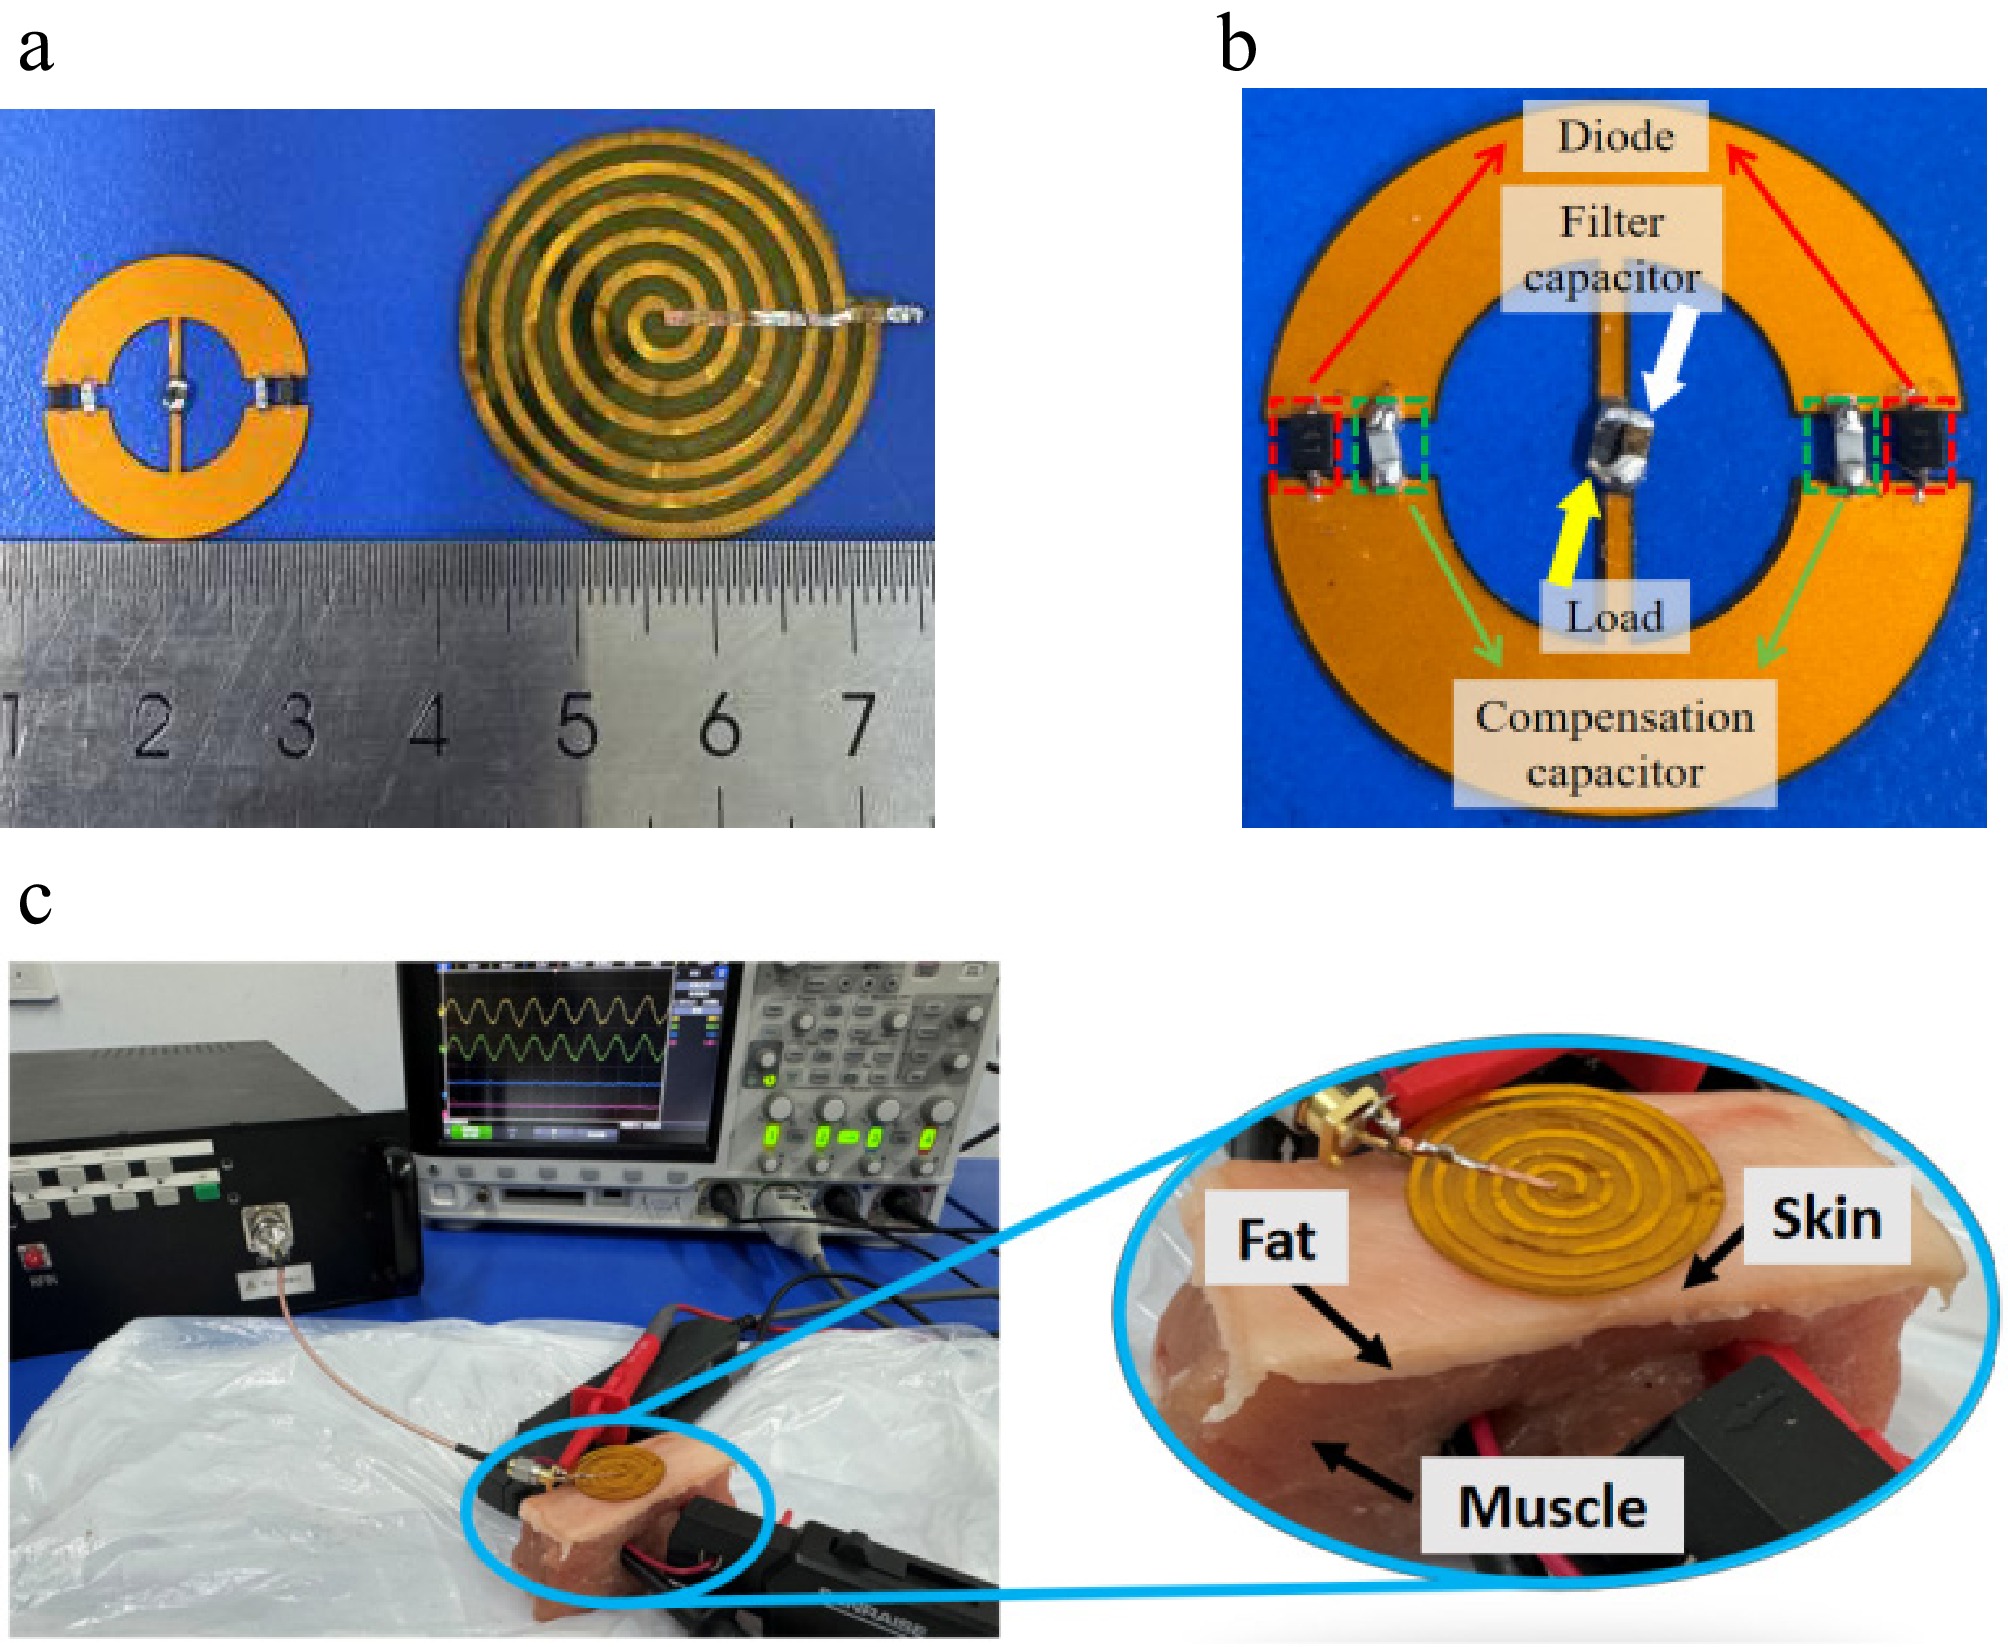
Figure 13.
Experimental prototype and setup. (a) Top view of the toroidal rectifier on the left and transmitting coil on the right. (b) Detailed view of the toroidal rectifier. (c) The experimental setup employing the pork tissue to simulate the three-layer human tissue.
-
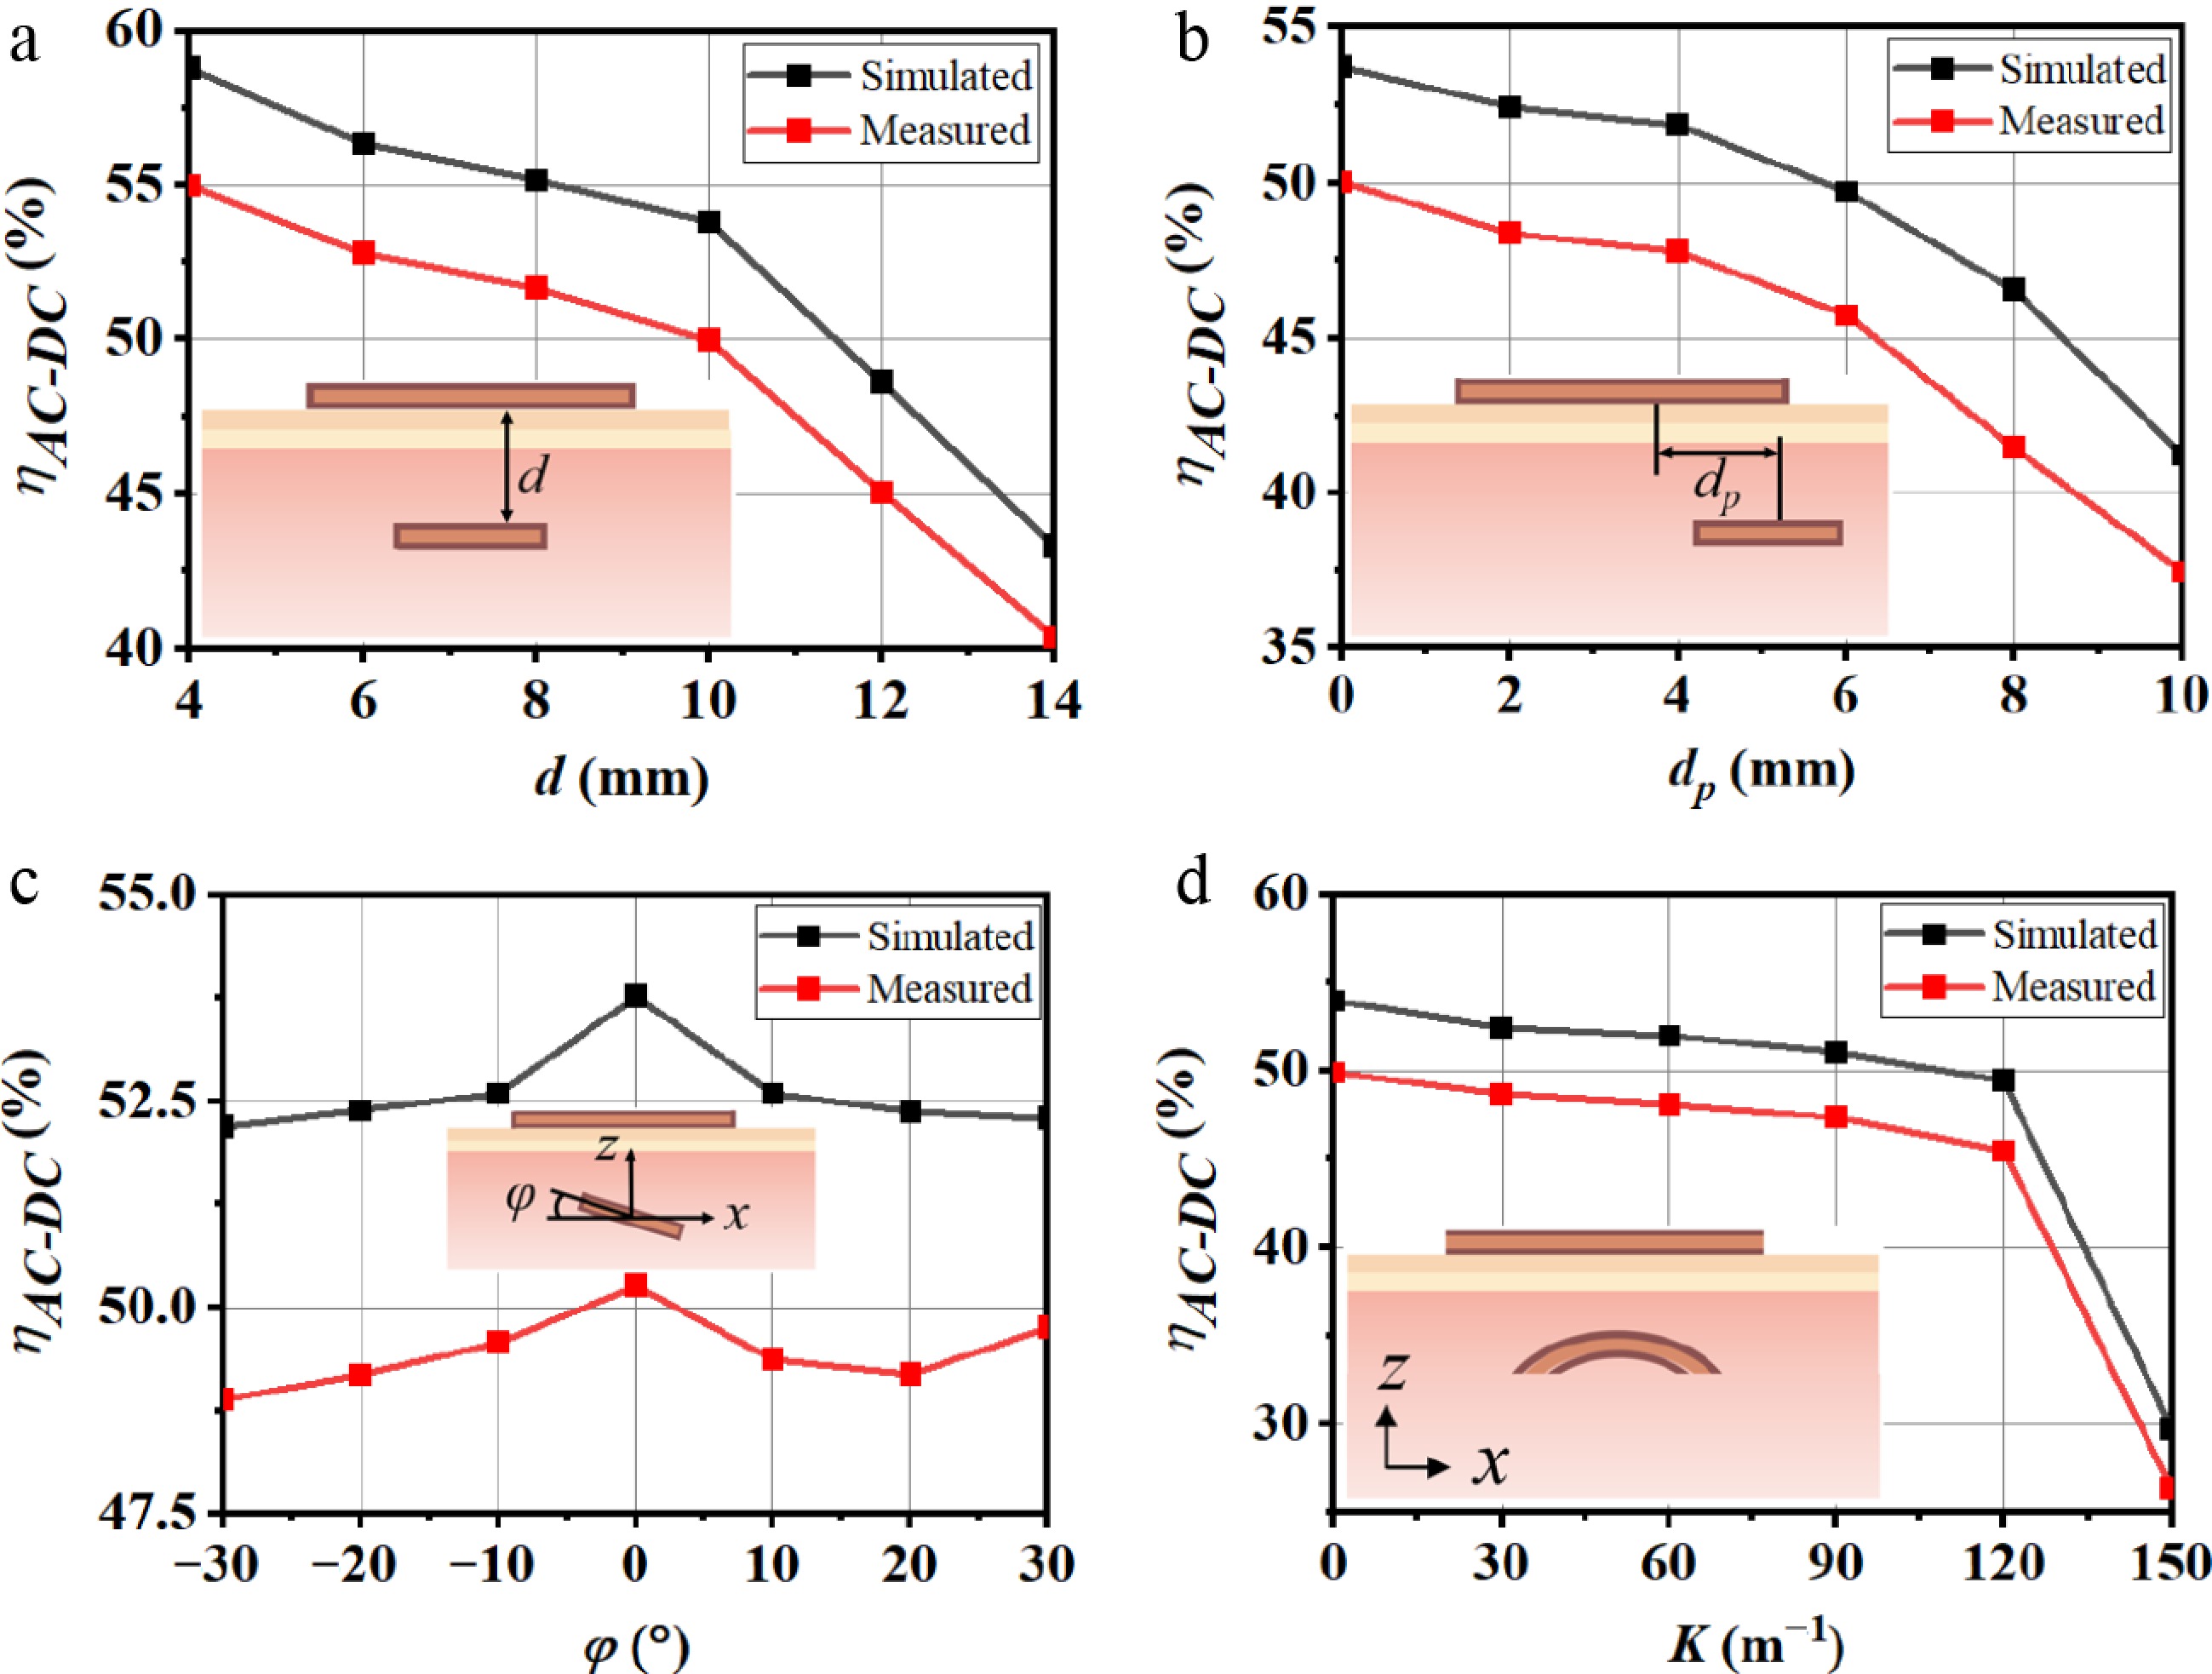
Figure 14.
Simulated and measured
$ {\eta }_{AC-DC} $ -
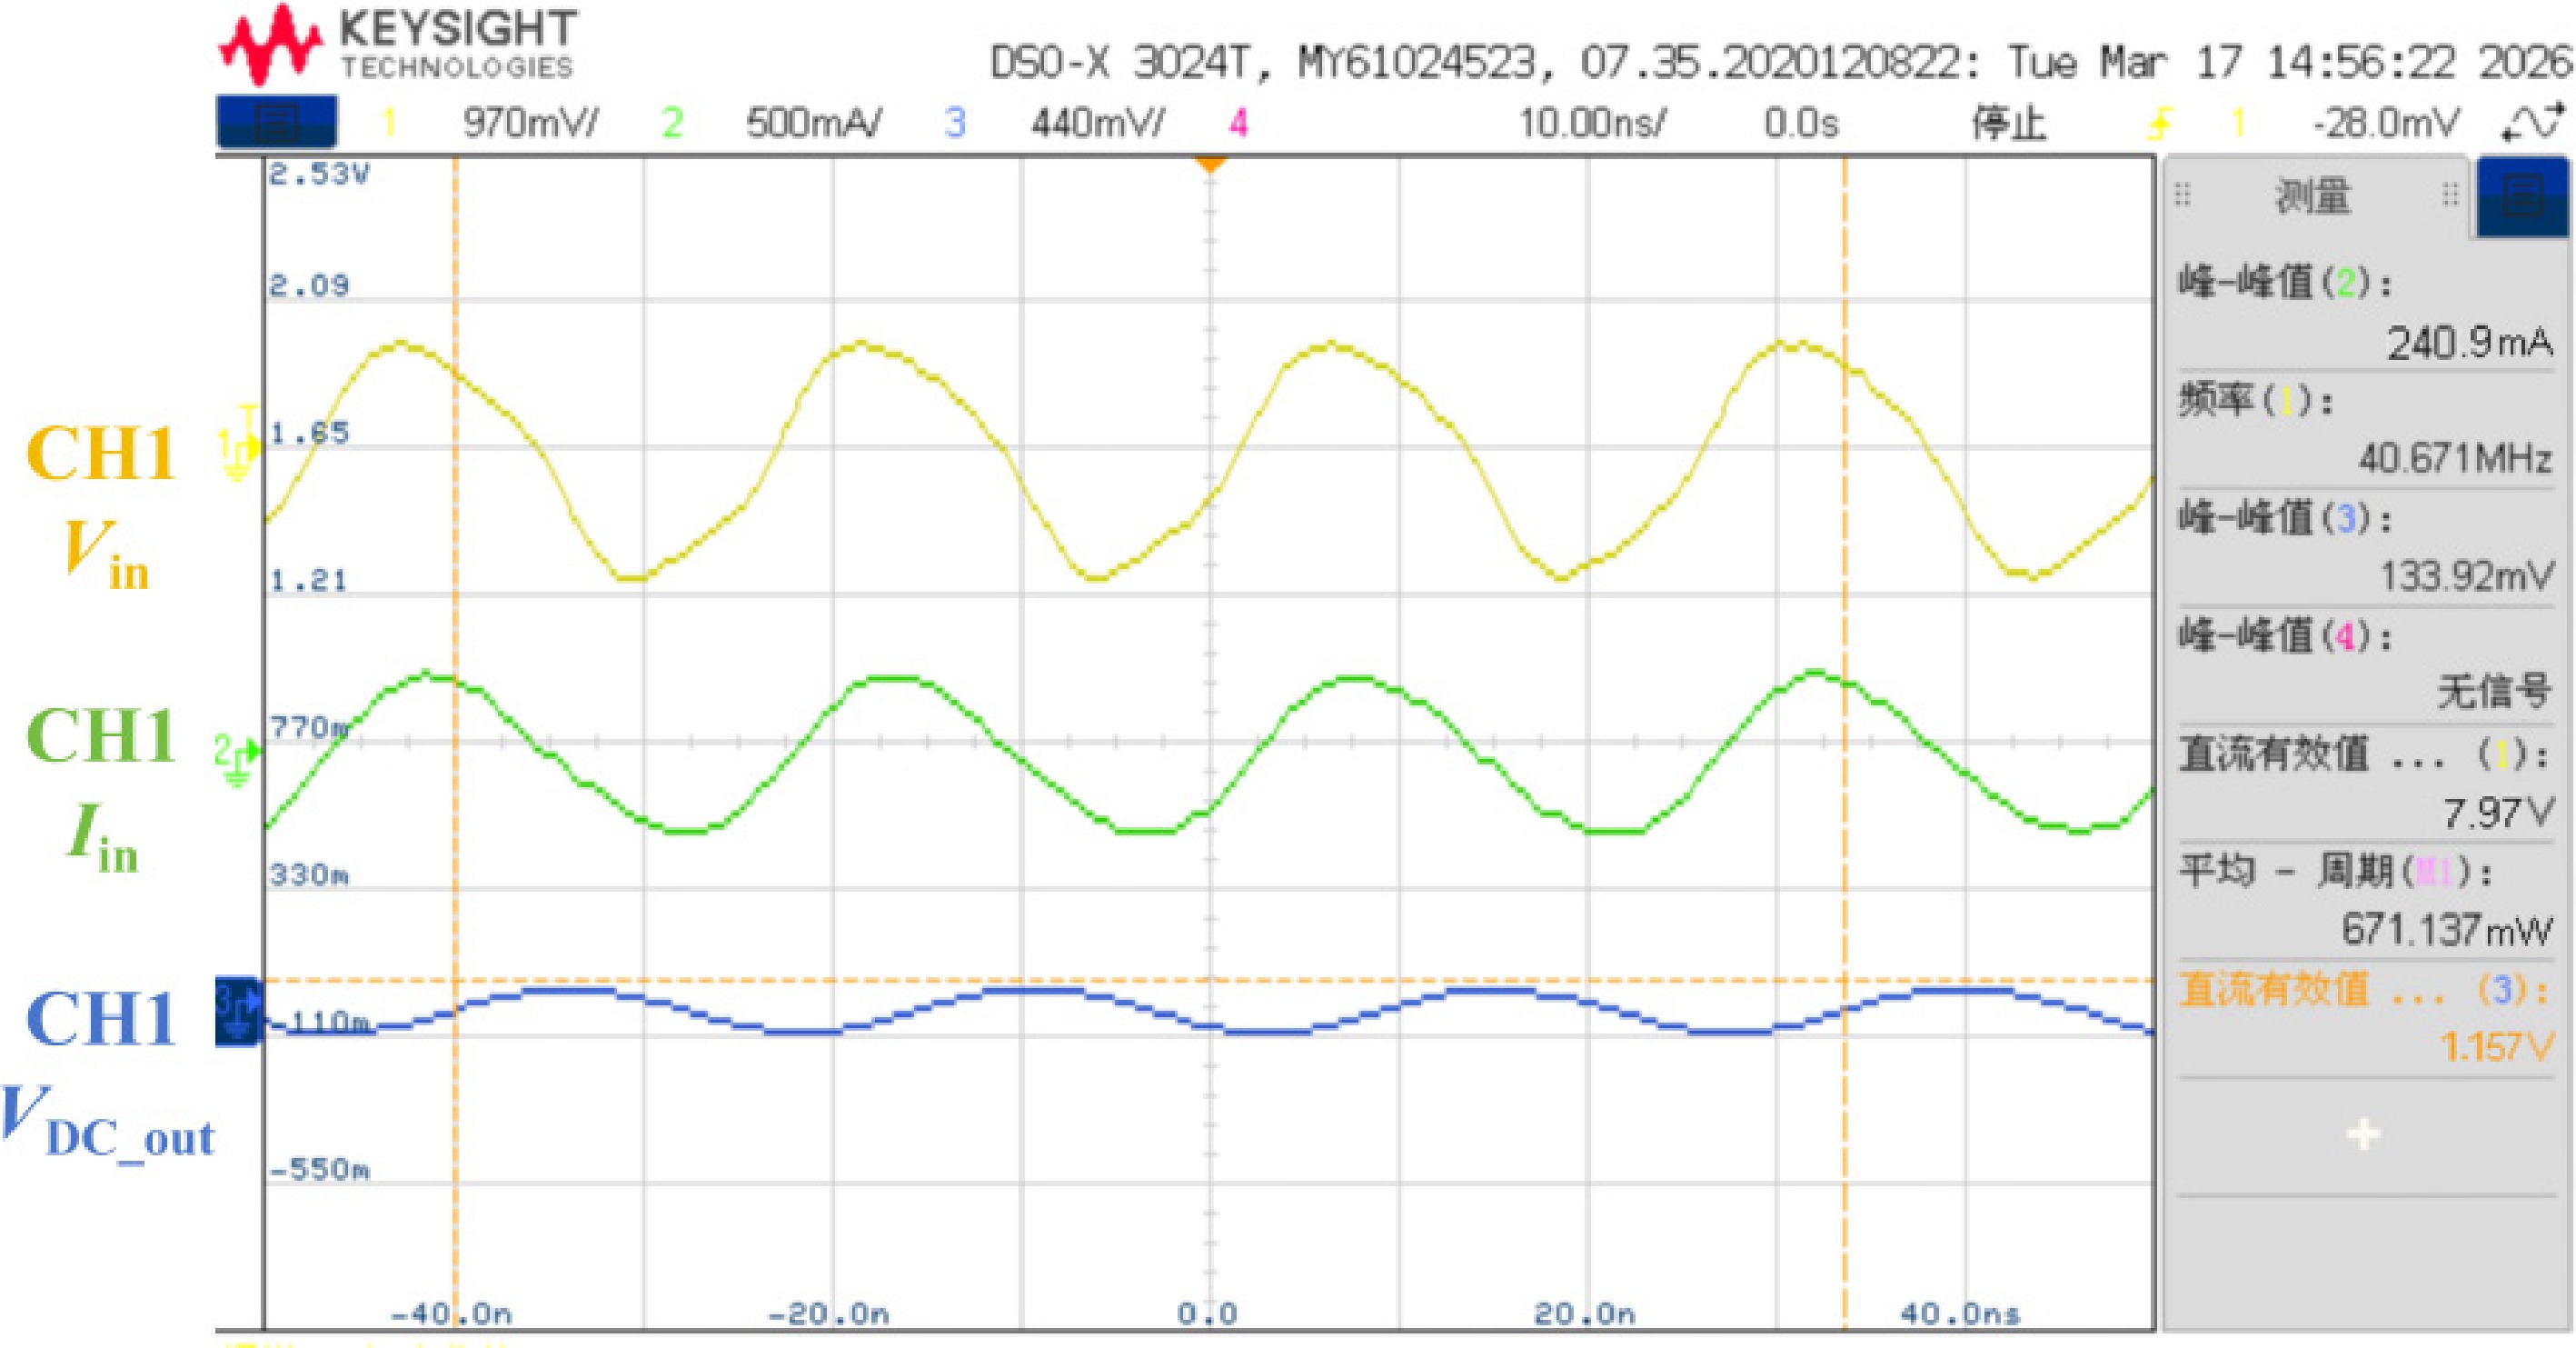
Figure 15.
Experimental waveform diagram at an implantation depth of d = 10 mm.
-
$ {\mathrm{r}}_{\text{out}} $ $ {\mathrm{r}}_{\text{in}} $ $ {\mathrm{r}}_{1} $ $ \mathrm{W} $ $ {\mathrm{W}}_{1} $ $ \mathrm{h} $ $ {\mathrm{h}}_{\text{PI}} $ 10 5 0.267 5 0.5 0.035 0.05 Table 1.
Parameters of the non-self-resonant rectifier toroidal coil.
-
Relative
permittivity$ {\varepsilon }_{r} $ Dielectric loss
tangentConductivity Density
(kg/m3)Skin 122.91 1.3655 0.37982 1,109 Fat 7.286 2.0703 0.034136 911 Muscle 82.115 3.6046 0.66986 1,090 Table 2.
Electromagnetic parameters of human tissues.
-
Ref. $ f $ Volume (mm3) Implant depth (mm) $ {\eta }_{AC-AC} $ $ {\eta }_{AC-DC} $ Input power (mW) SAR (W/kg) Max allowable received AC power (mW) 1 g-avg/10 g-avg [28] 39.86 249.5 10 47.2 NA 245/676 6.54/2.96 115/319 [29] 403 975.4 6 42.4 NA NA/159 NA/1.05 NA/67 [30] 13.56 1472 11 17 NA NA/ NA NA/ NA NA/NA Pro. 40.68 65.97+ 10 NA 49.98 330/889 4.84/2.25 165/444 Table 3.
Comparison of the proposed toroidal rectifier with other coils.
Figures
(15)
Tables
(3)