-
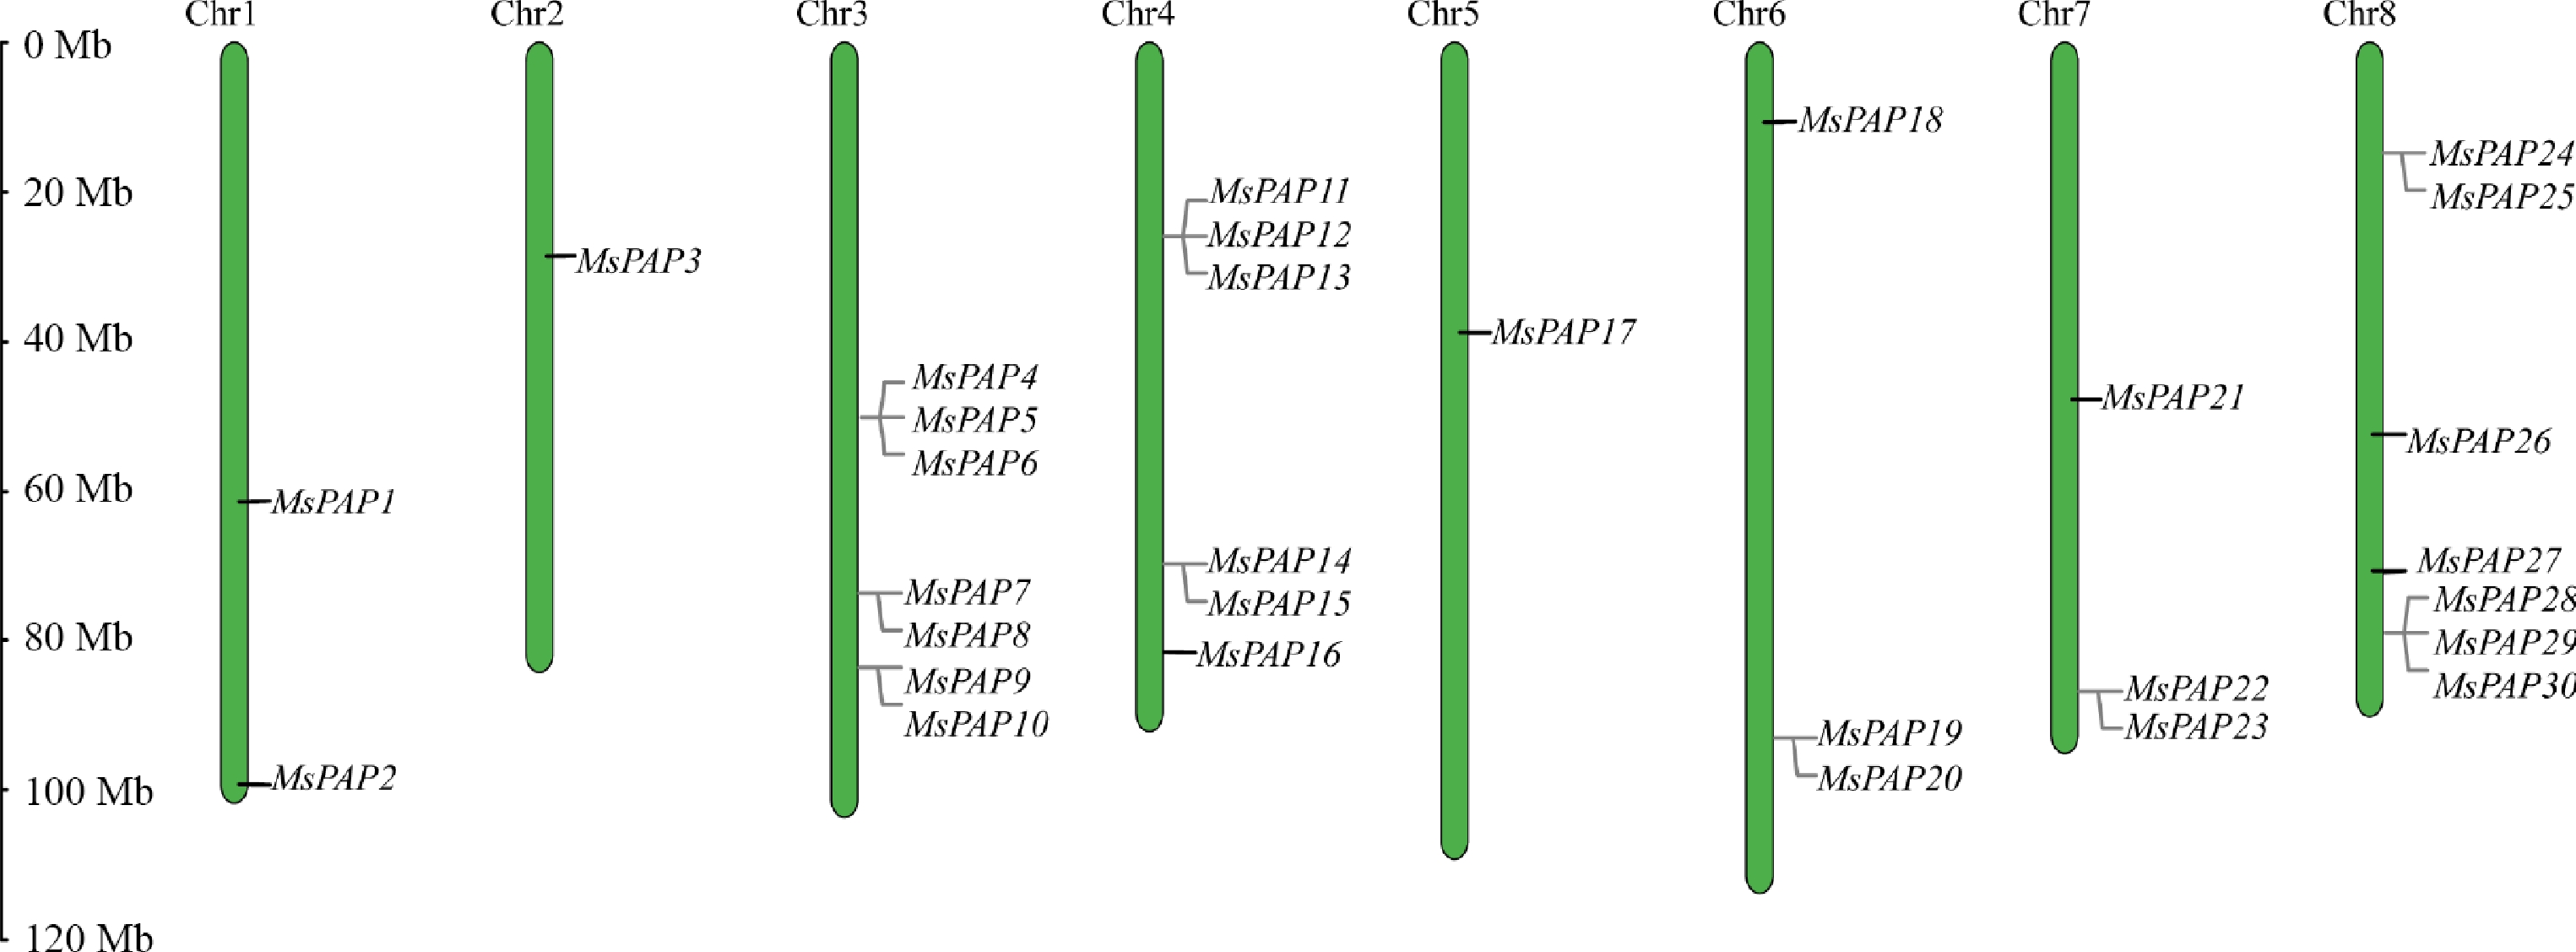
Figure 1.
The distribution of the MsPAP gene family on alfalfa chromosomes.
-
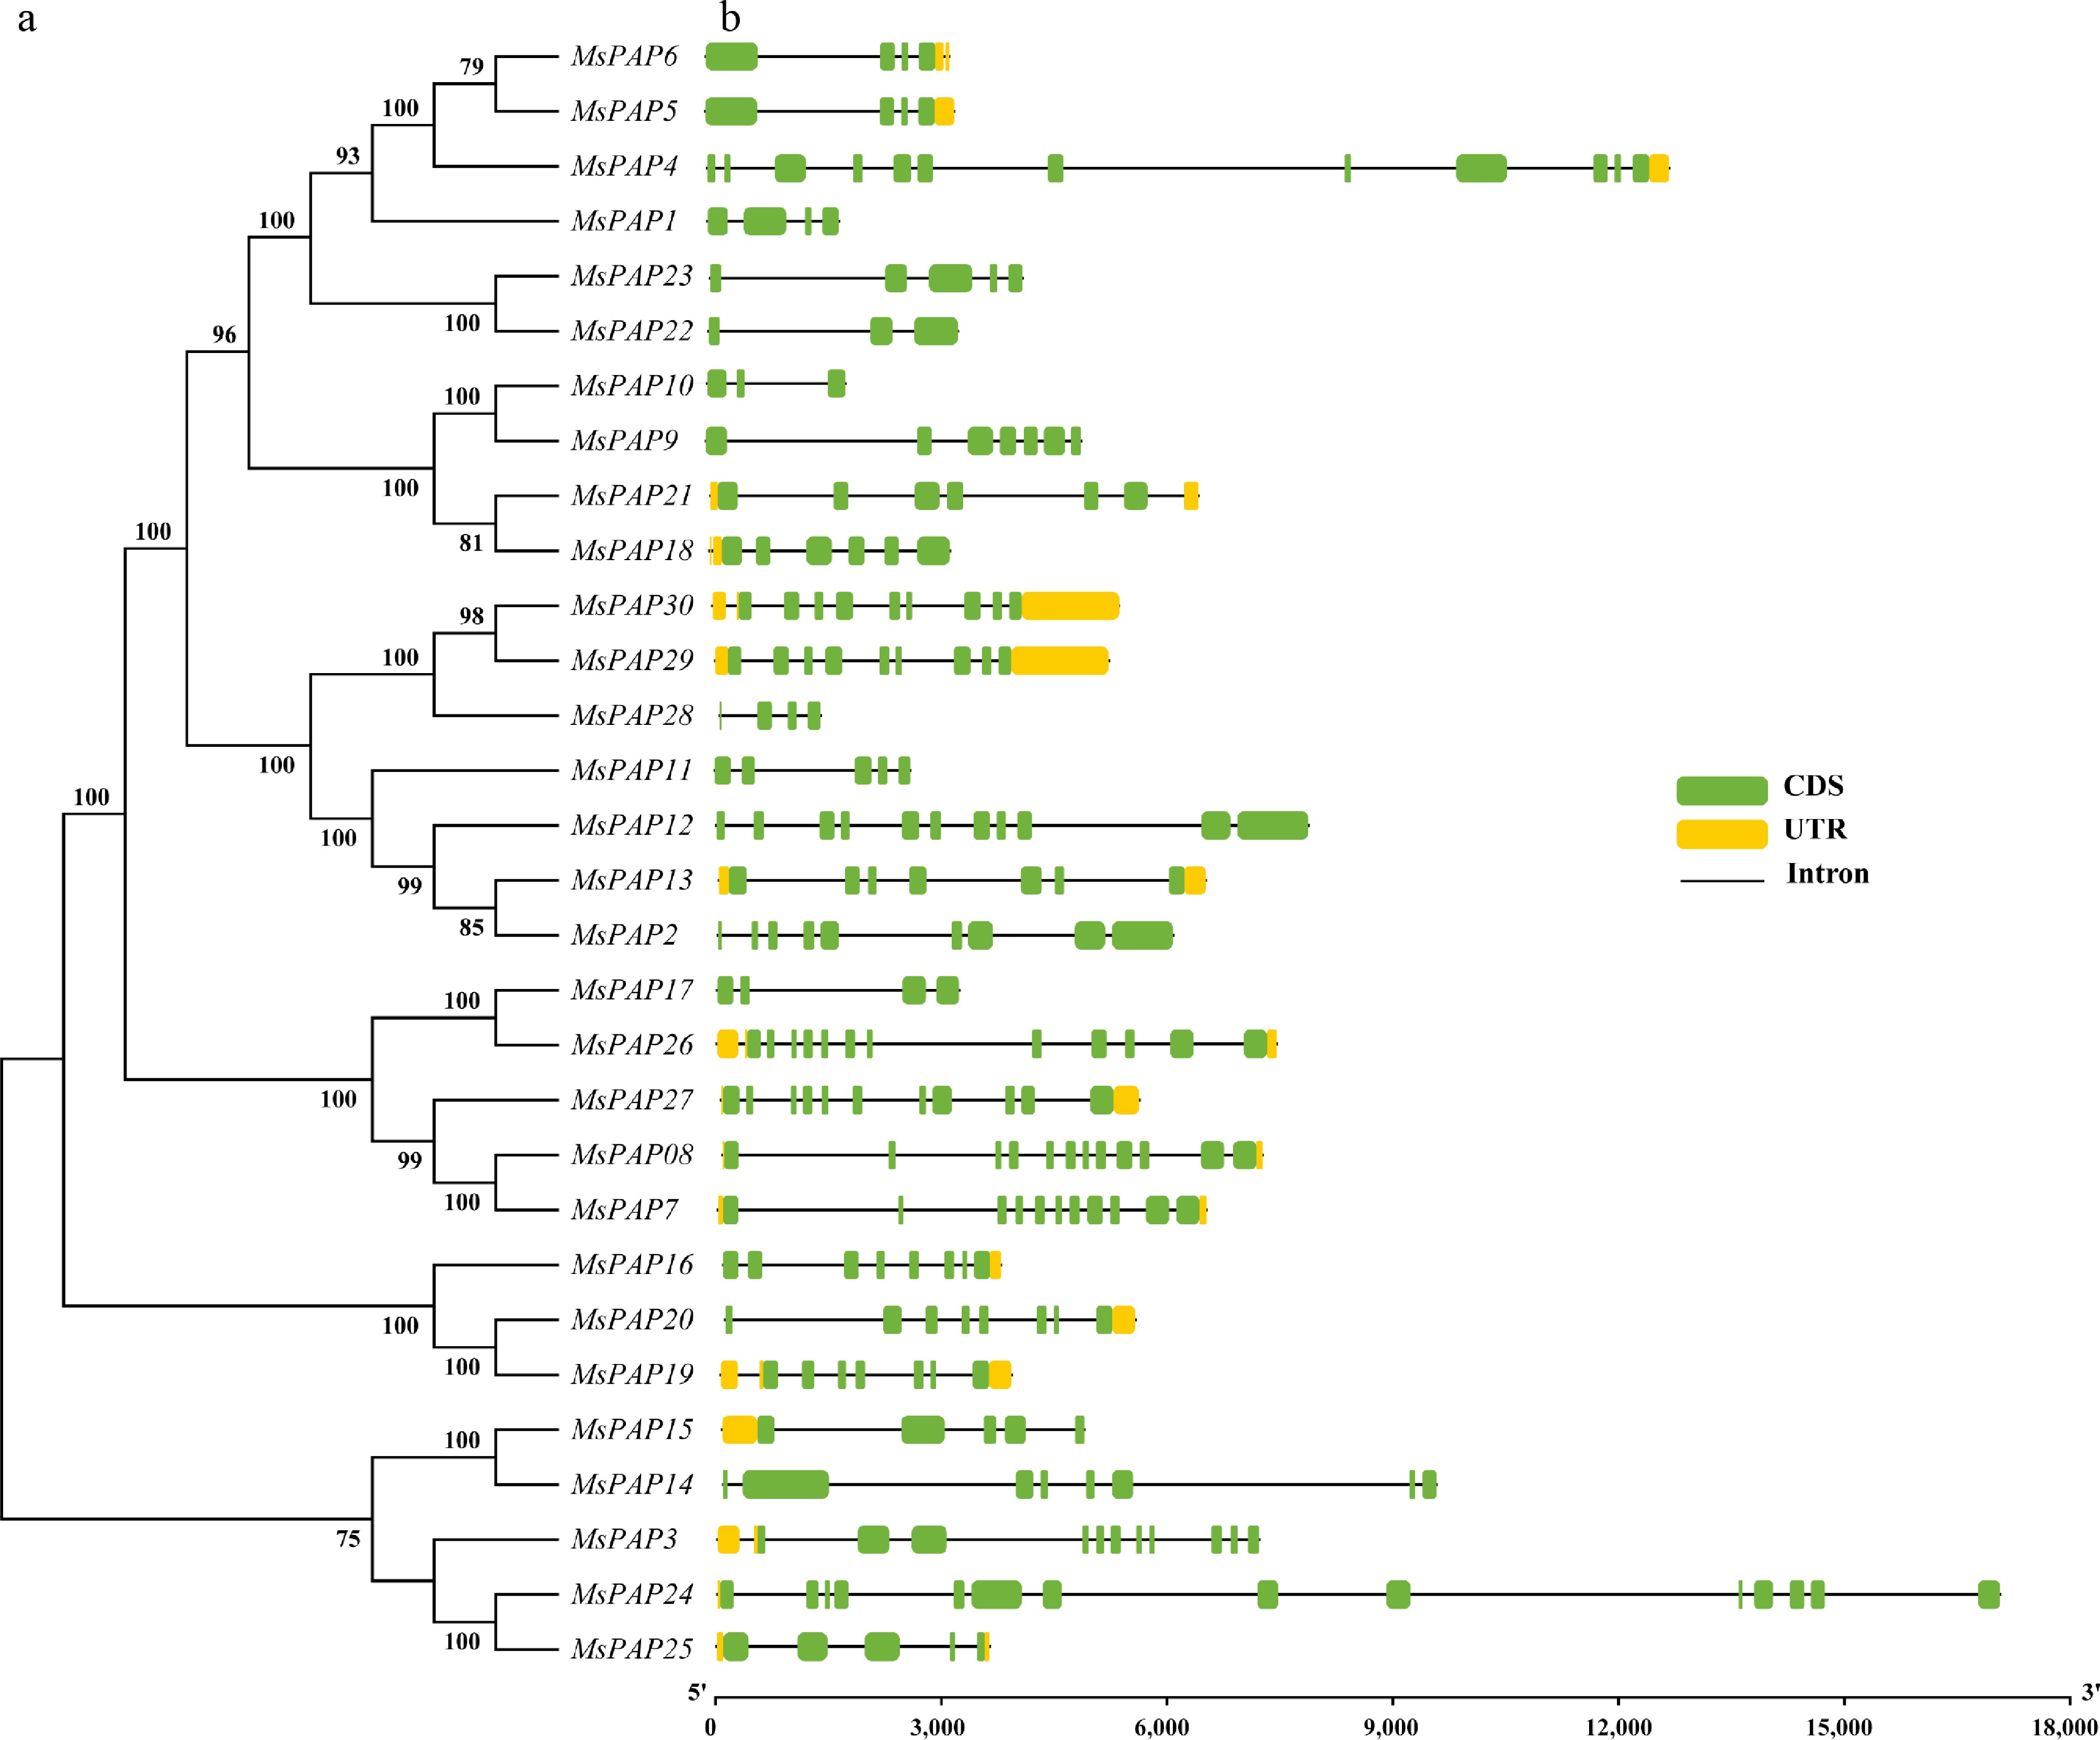
Figure 2.
Structures of MsPAP genes in alfalfa. (a) Phylogenetic tree of MsPAP proteins. (b) Schematic diagram of gene structure. Green boxes represent exons (CDS), black lines represent introns, and yellow boxes represent untranslated regions (UTRs). The lengths of exons and introns of each gene are displayed proportionally.
-
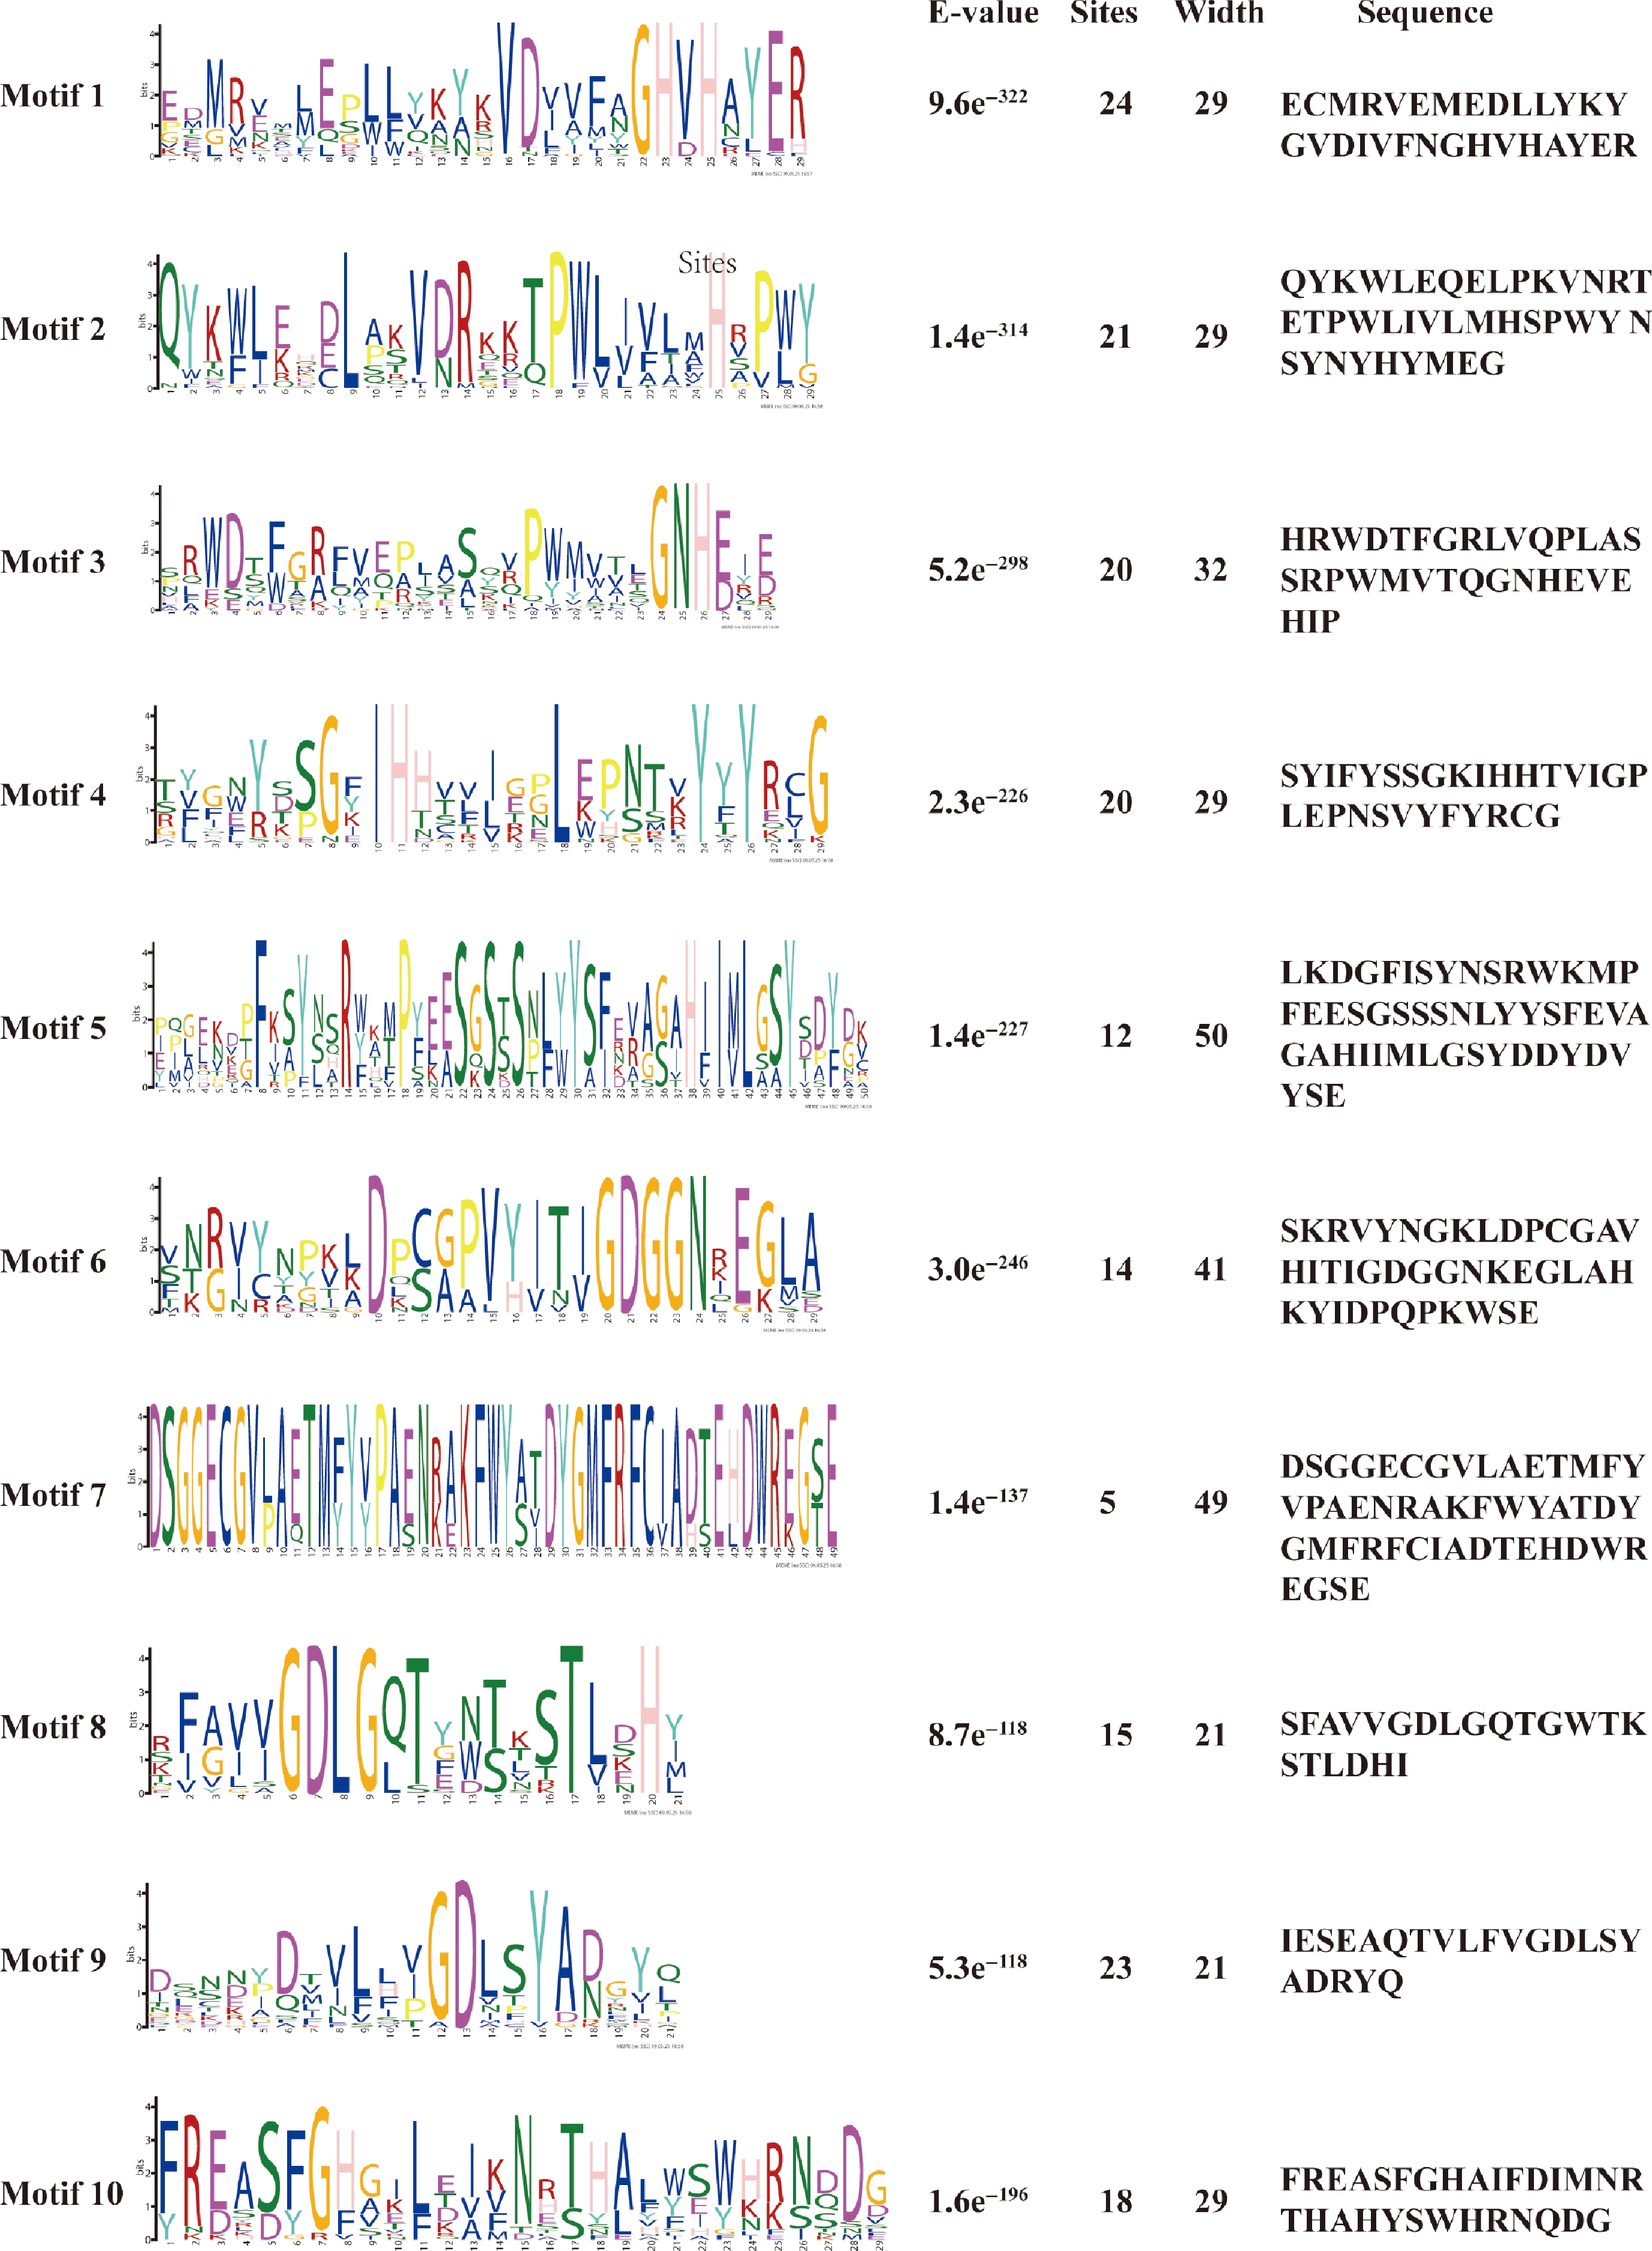
Figure 3.
Conserved protein motifs of the MsPAP gene family in alfalfa.
-
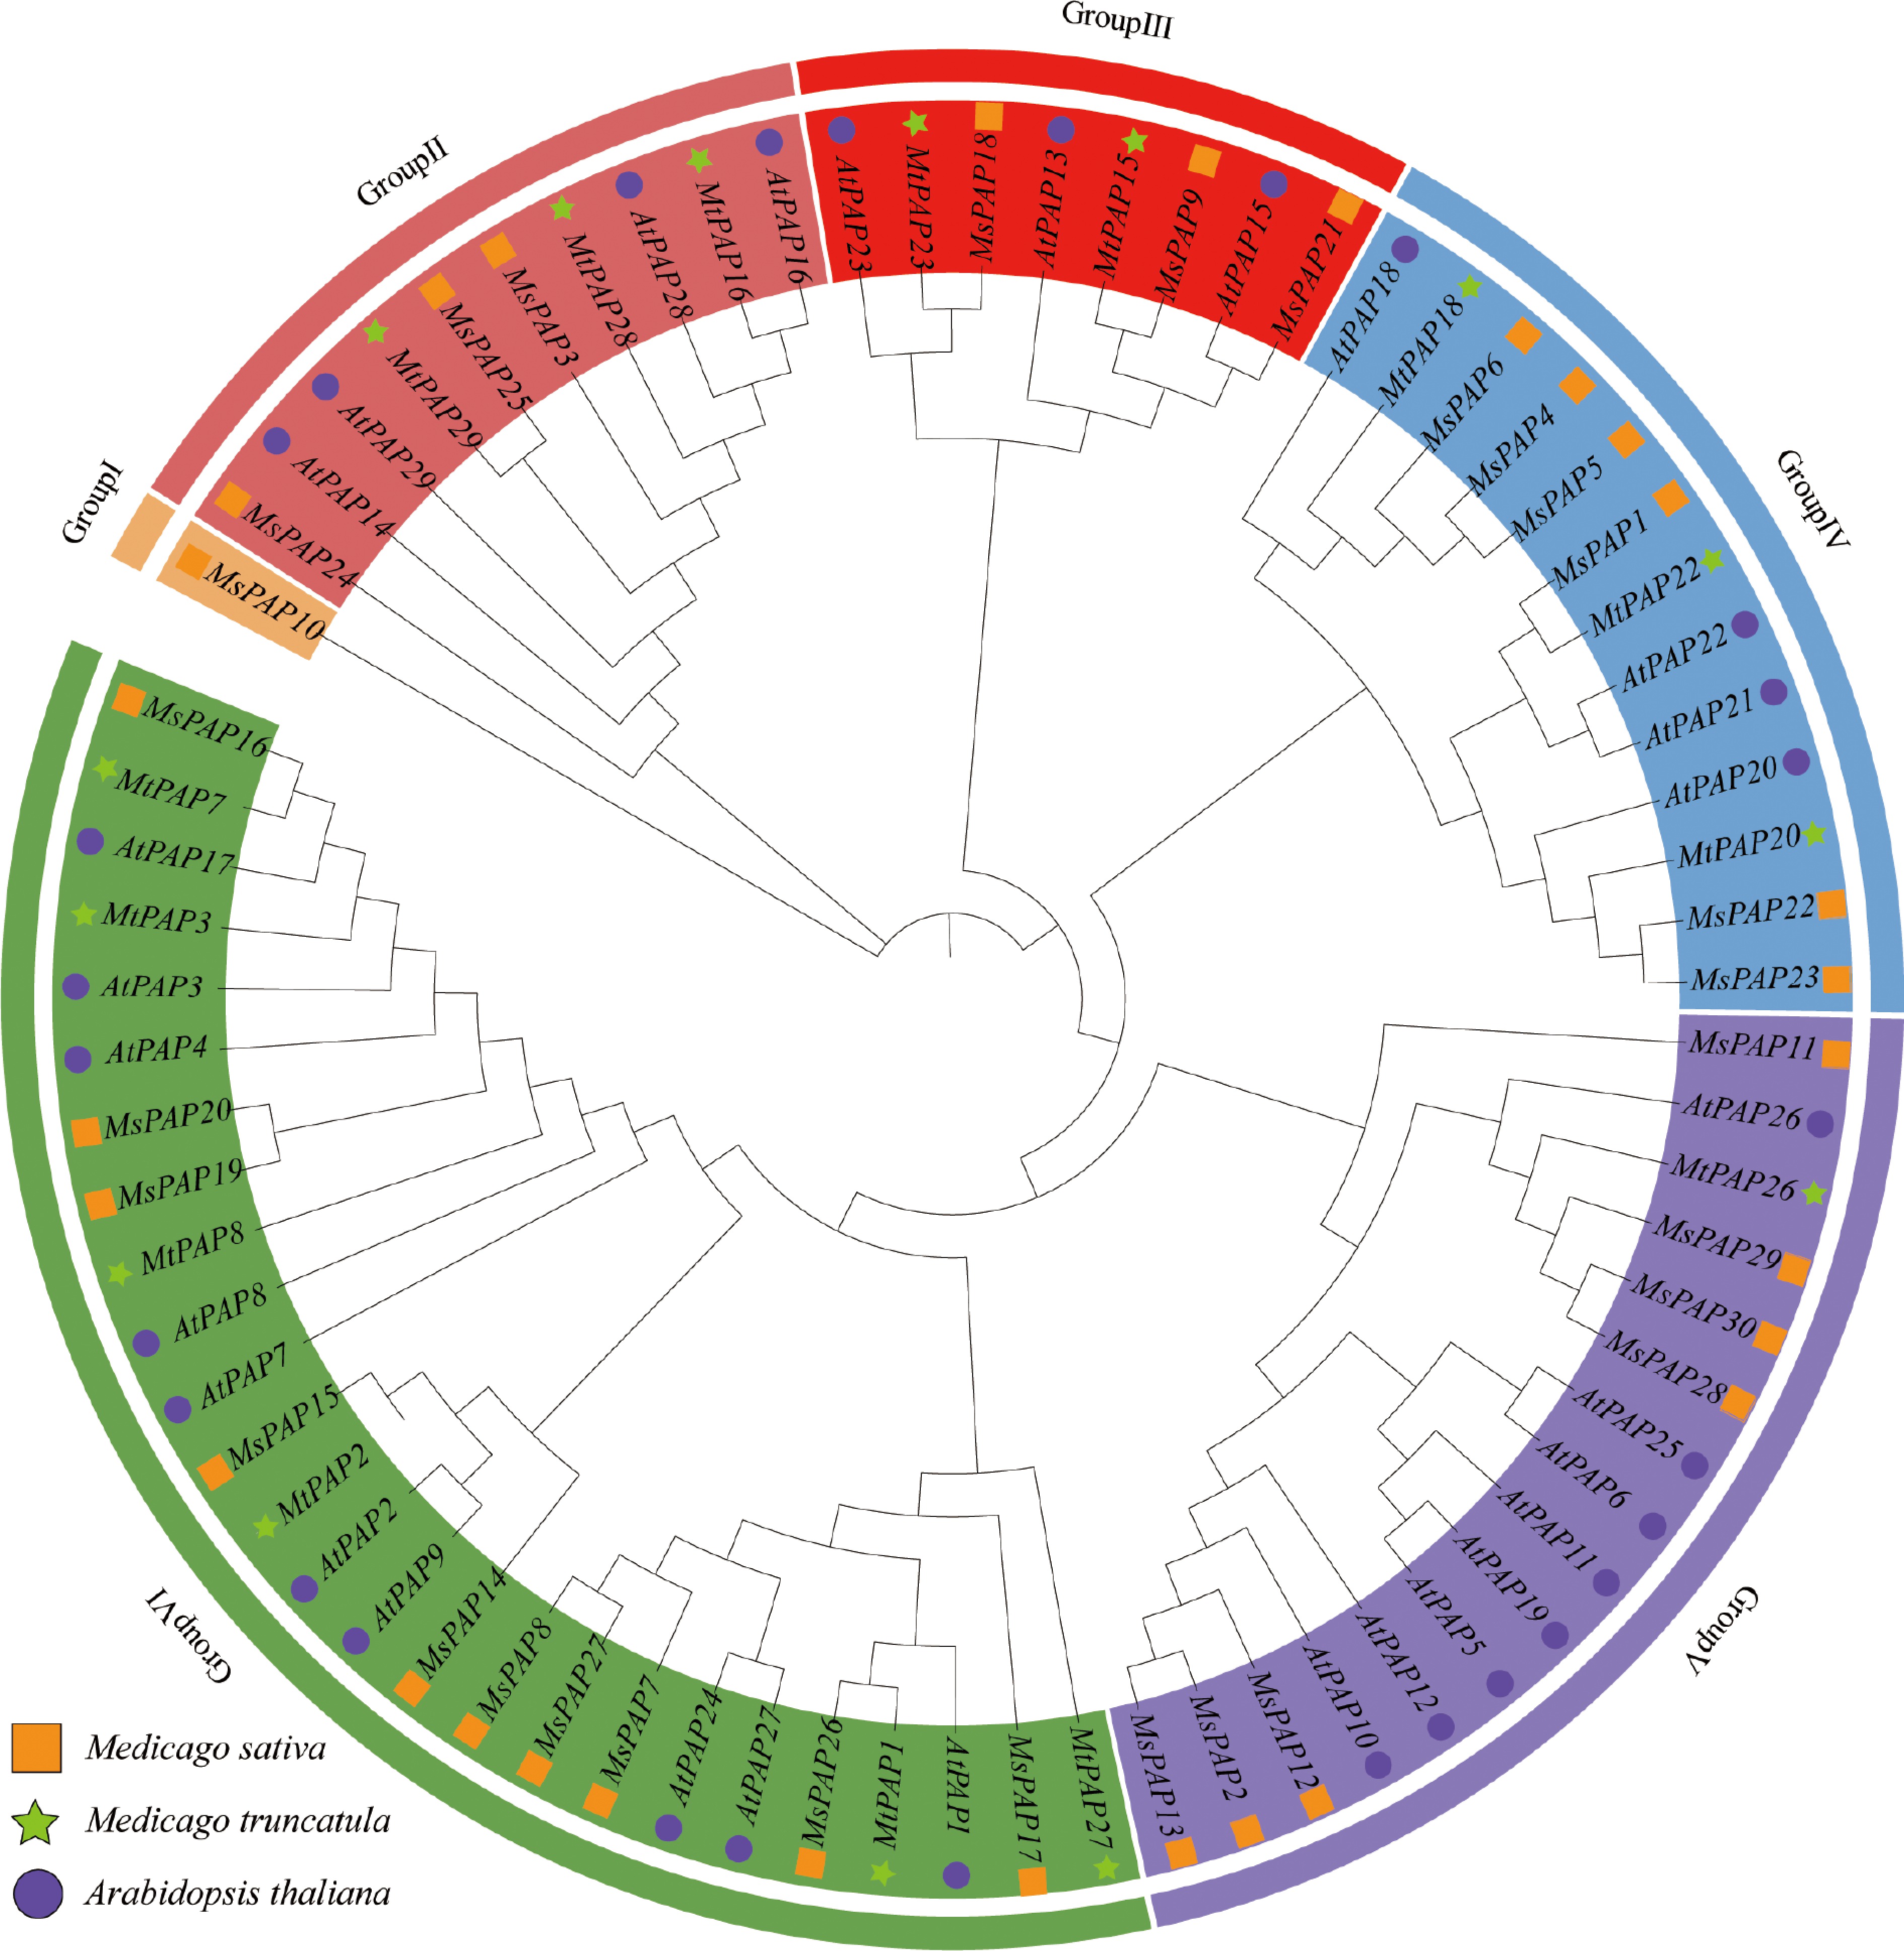
Figure 4.
Phylogenetic analysis of PAP proteins from A. thaliana, M. truncatula, and alfalfa.
-
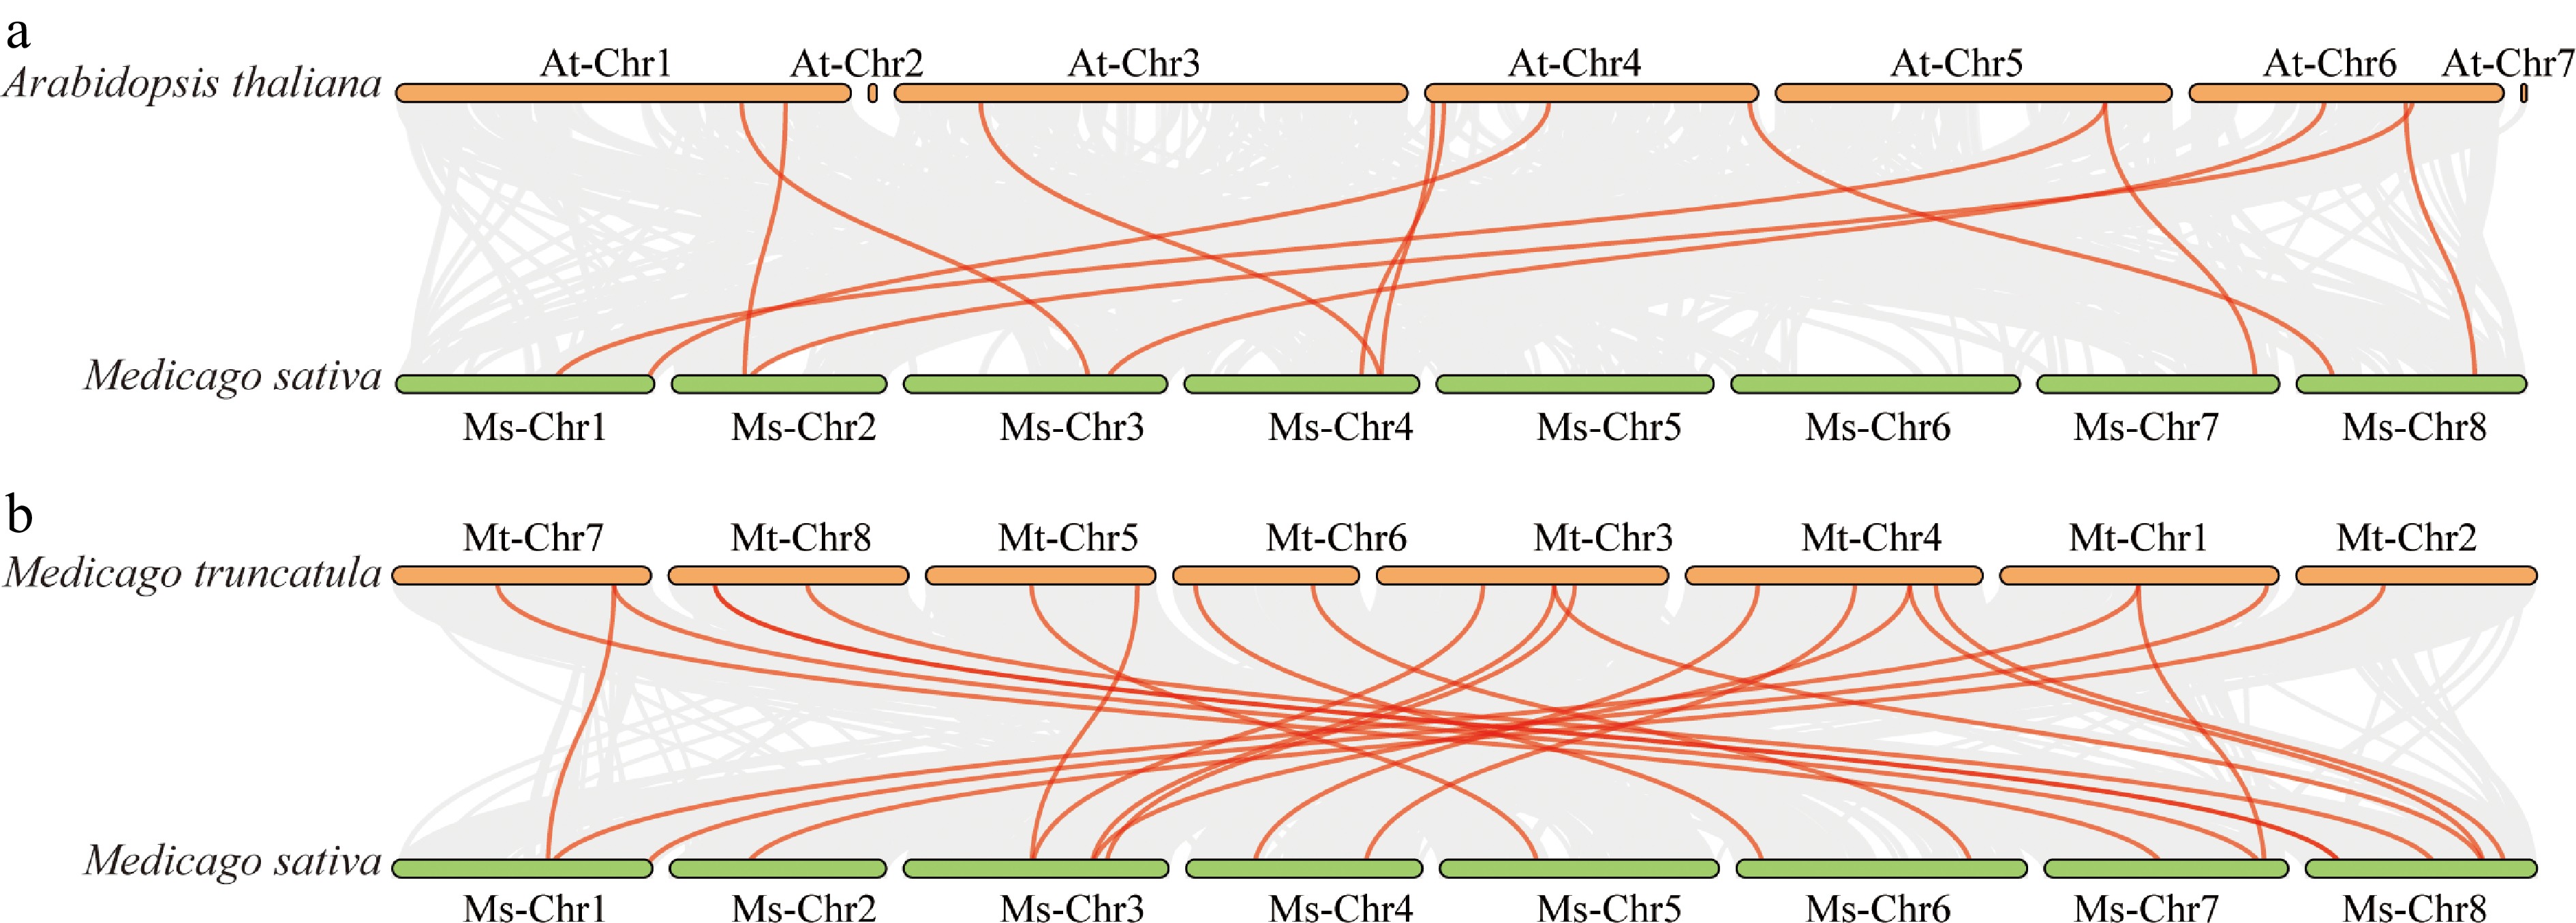
Figure 5.
Syntenic relationships of the PAP gene family in A. thaliana, M. truncatula, and alfalfa. (a) Syntenic relationships of MsPAP and AtPAP; (b) syntenic relationships of MsPAP and MtPAP.
-
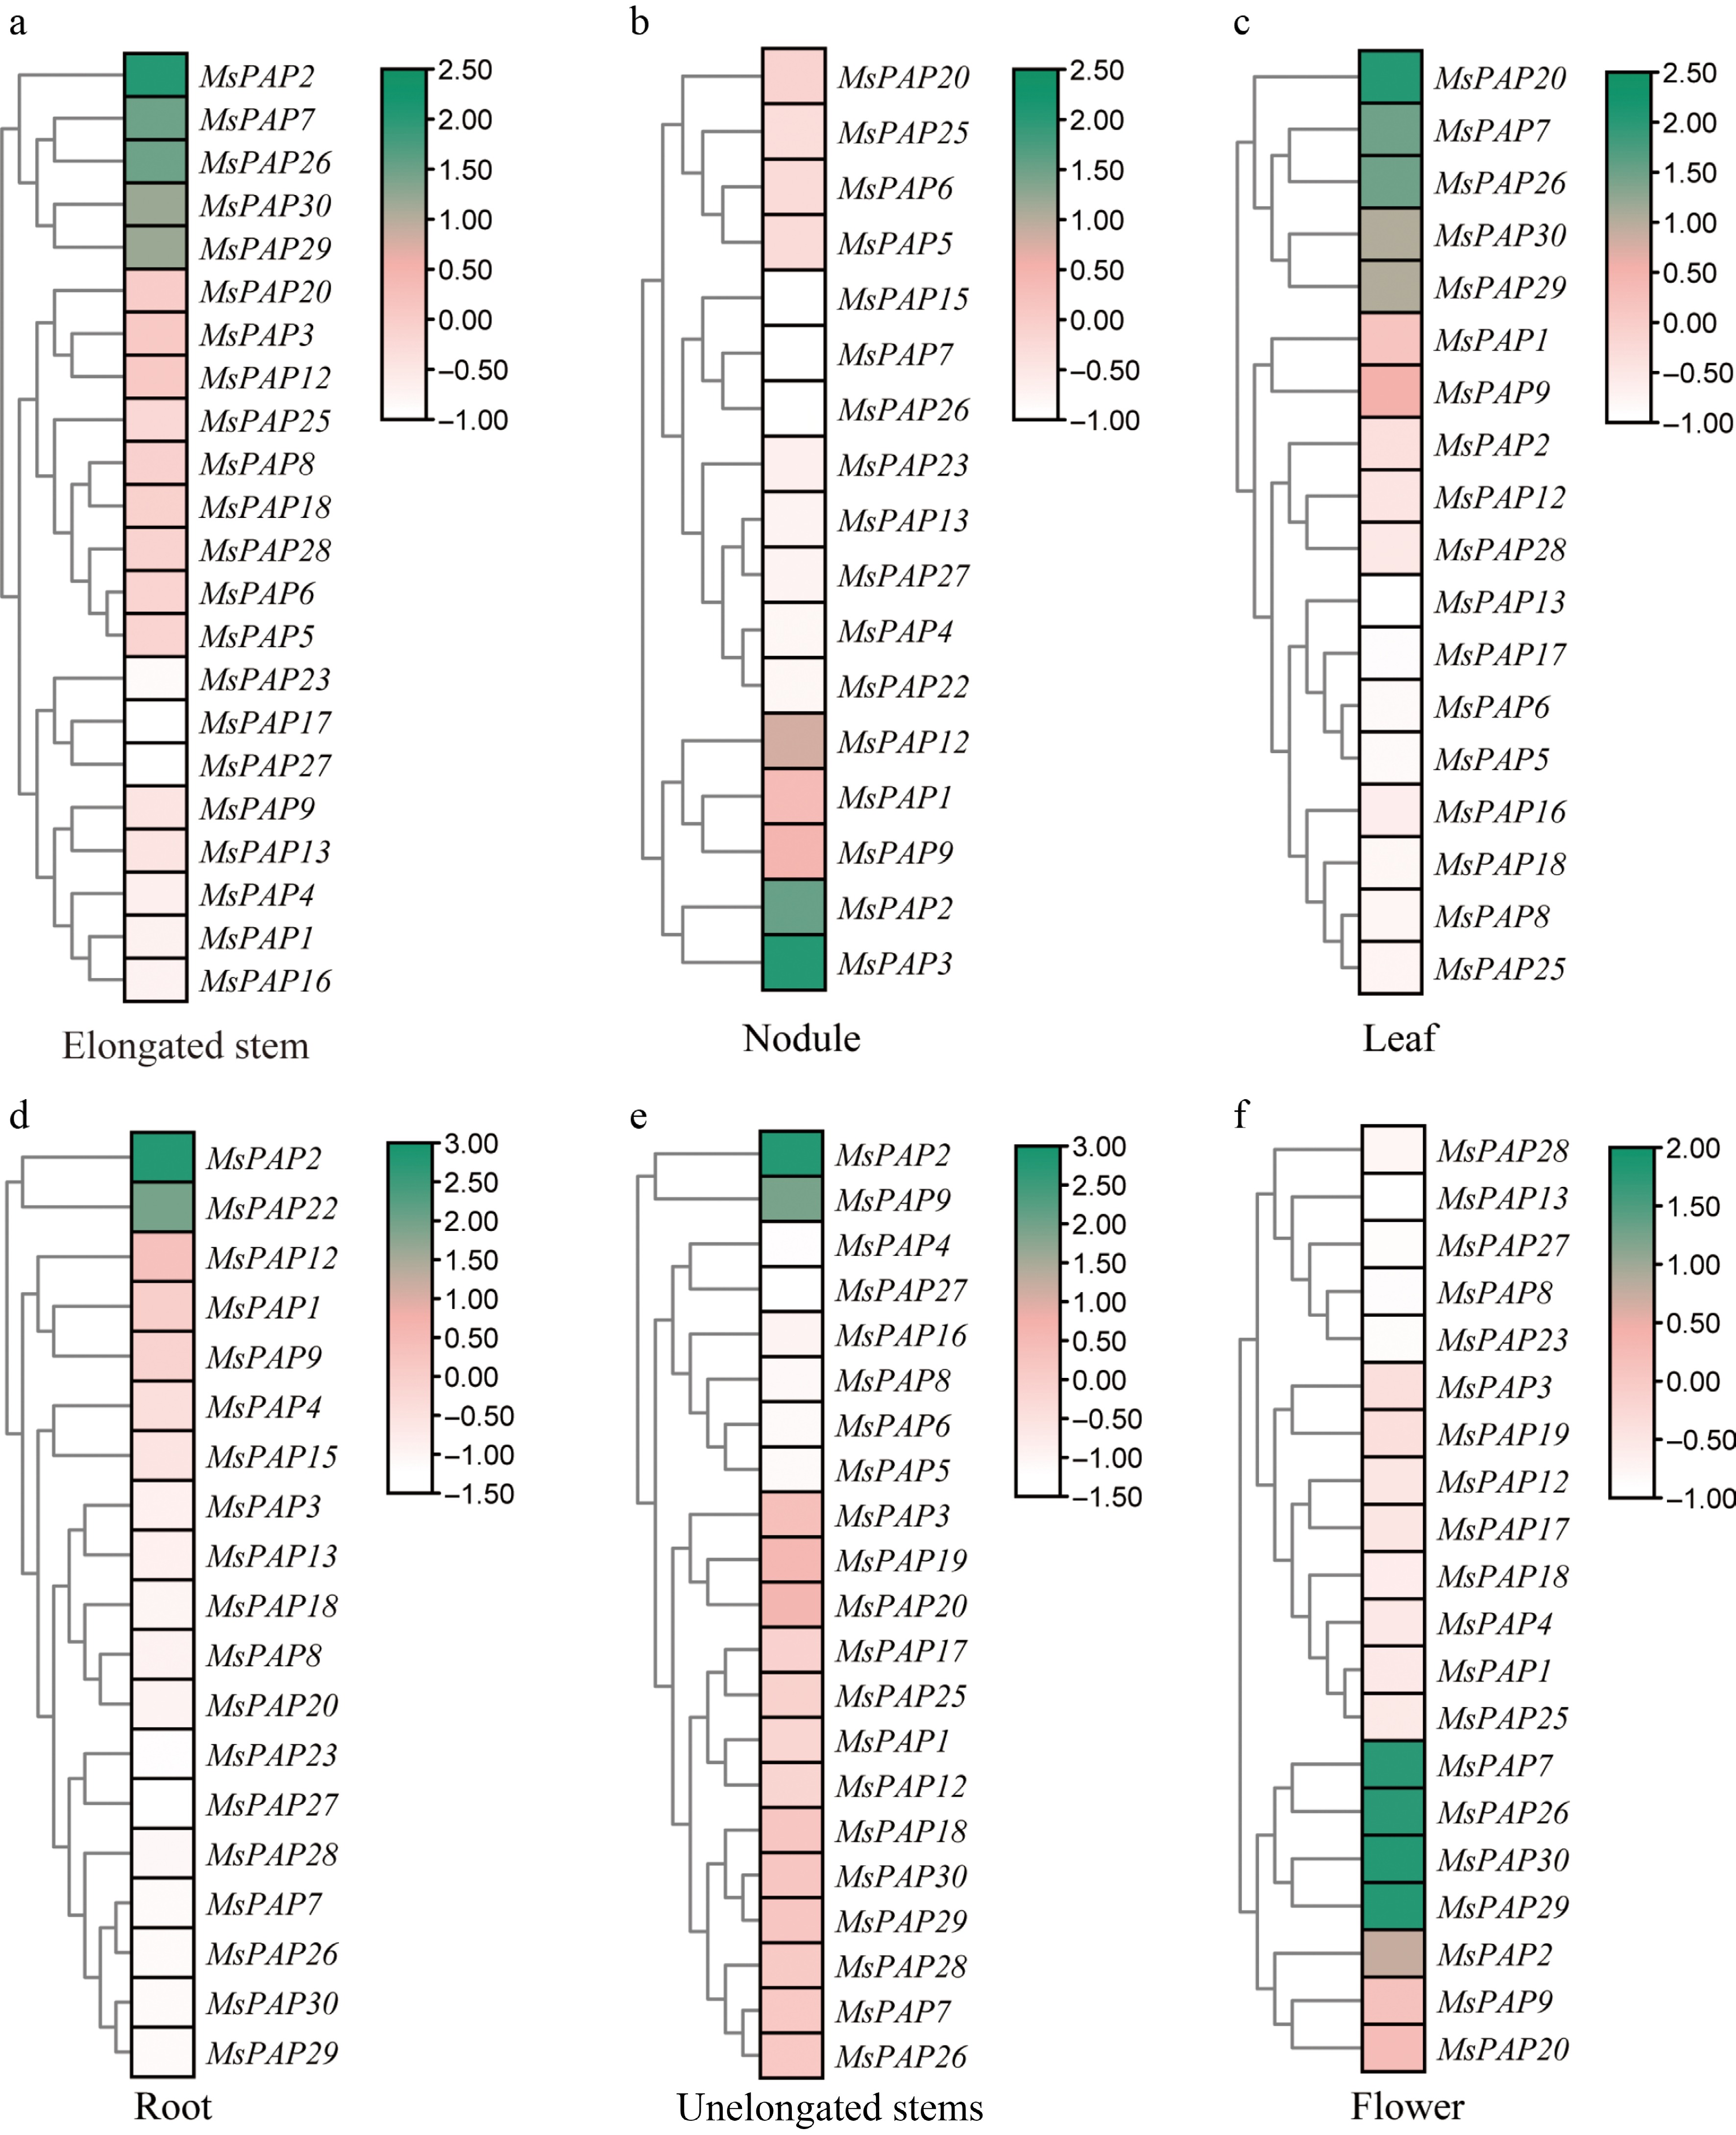
Figure 6.
Analysis of MsPAP genes' expression in different tissues of alfalfa. Hierarchical clustering heatmap of the transcriptional expression levels of the MsPAP gene family in the tissues of (a) elongated stems, (b) nodules, (c) leaves, (d) roots, (e) unelongated stems, and (f) flowers in alfalfa. The genes are arranged according to the results of the cluster analysis; the color gradient represents the relative expression levels (green indicates high expression, white indicates low expression), and the color scale on the right shows the range of expression values using FPKM-normalized values.
-
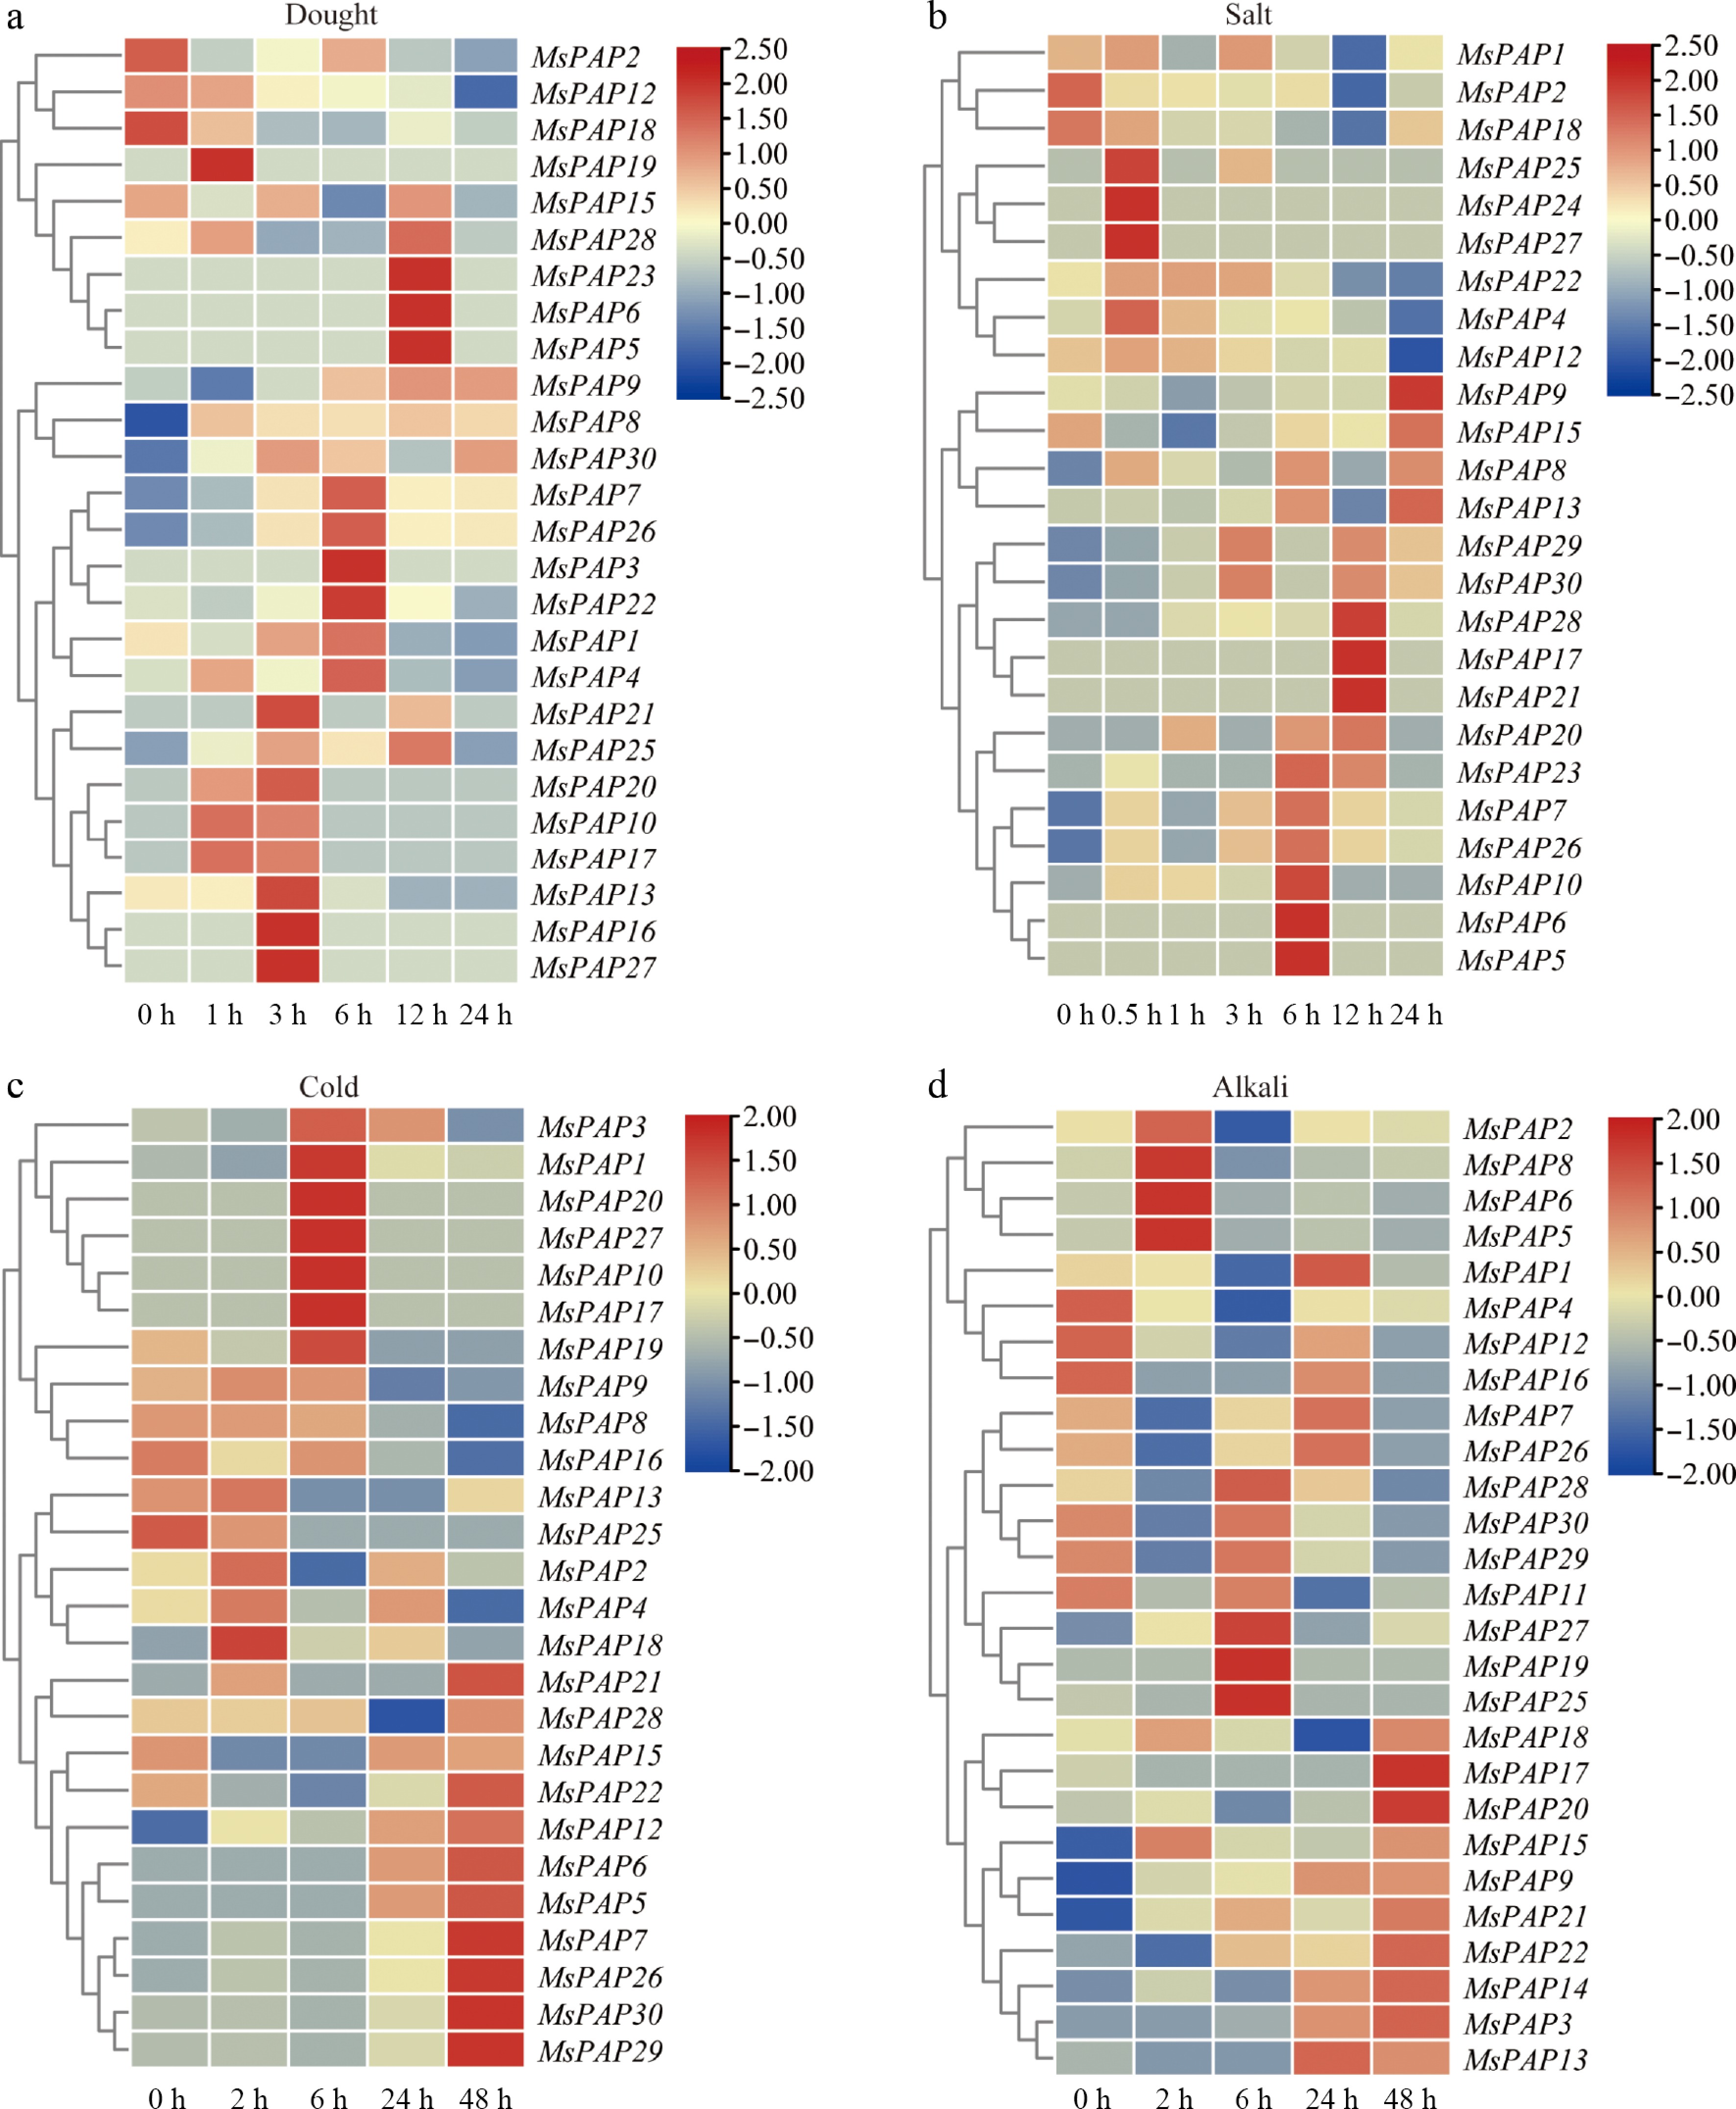
Figure 7.
Expression of MsPAP genes in alfalfa under cold, drought, alkali, and salt stress. Hierarchical clustering heatmap of the transcriptional expression levels of the MsPAP gene family in the stress under (a) drought, (b) salt, (c) cold, and (d) alkali. The color gradient represents the level of gene expression, where red typically indicates high expression and blue typically indicates low expression. The color scale represents log2(FPKM + 1).
-
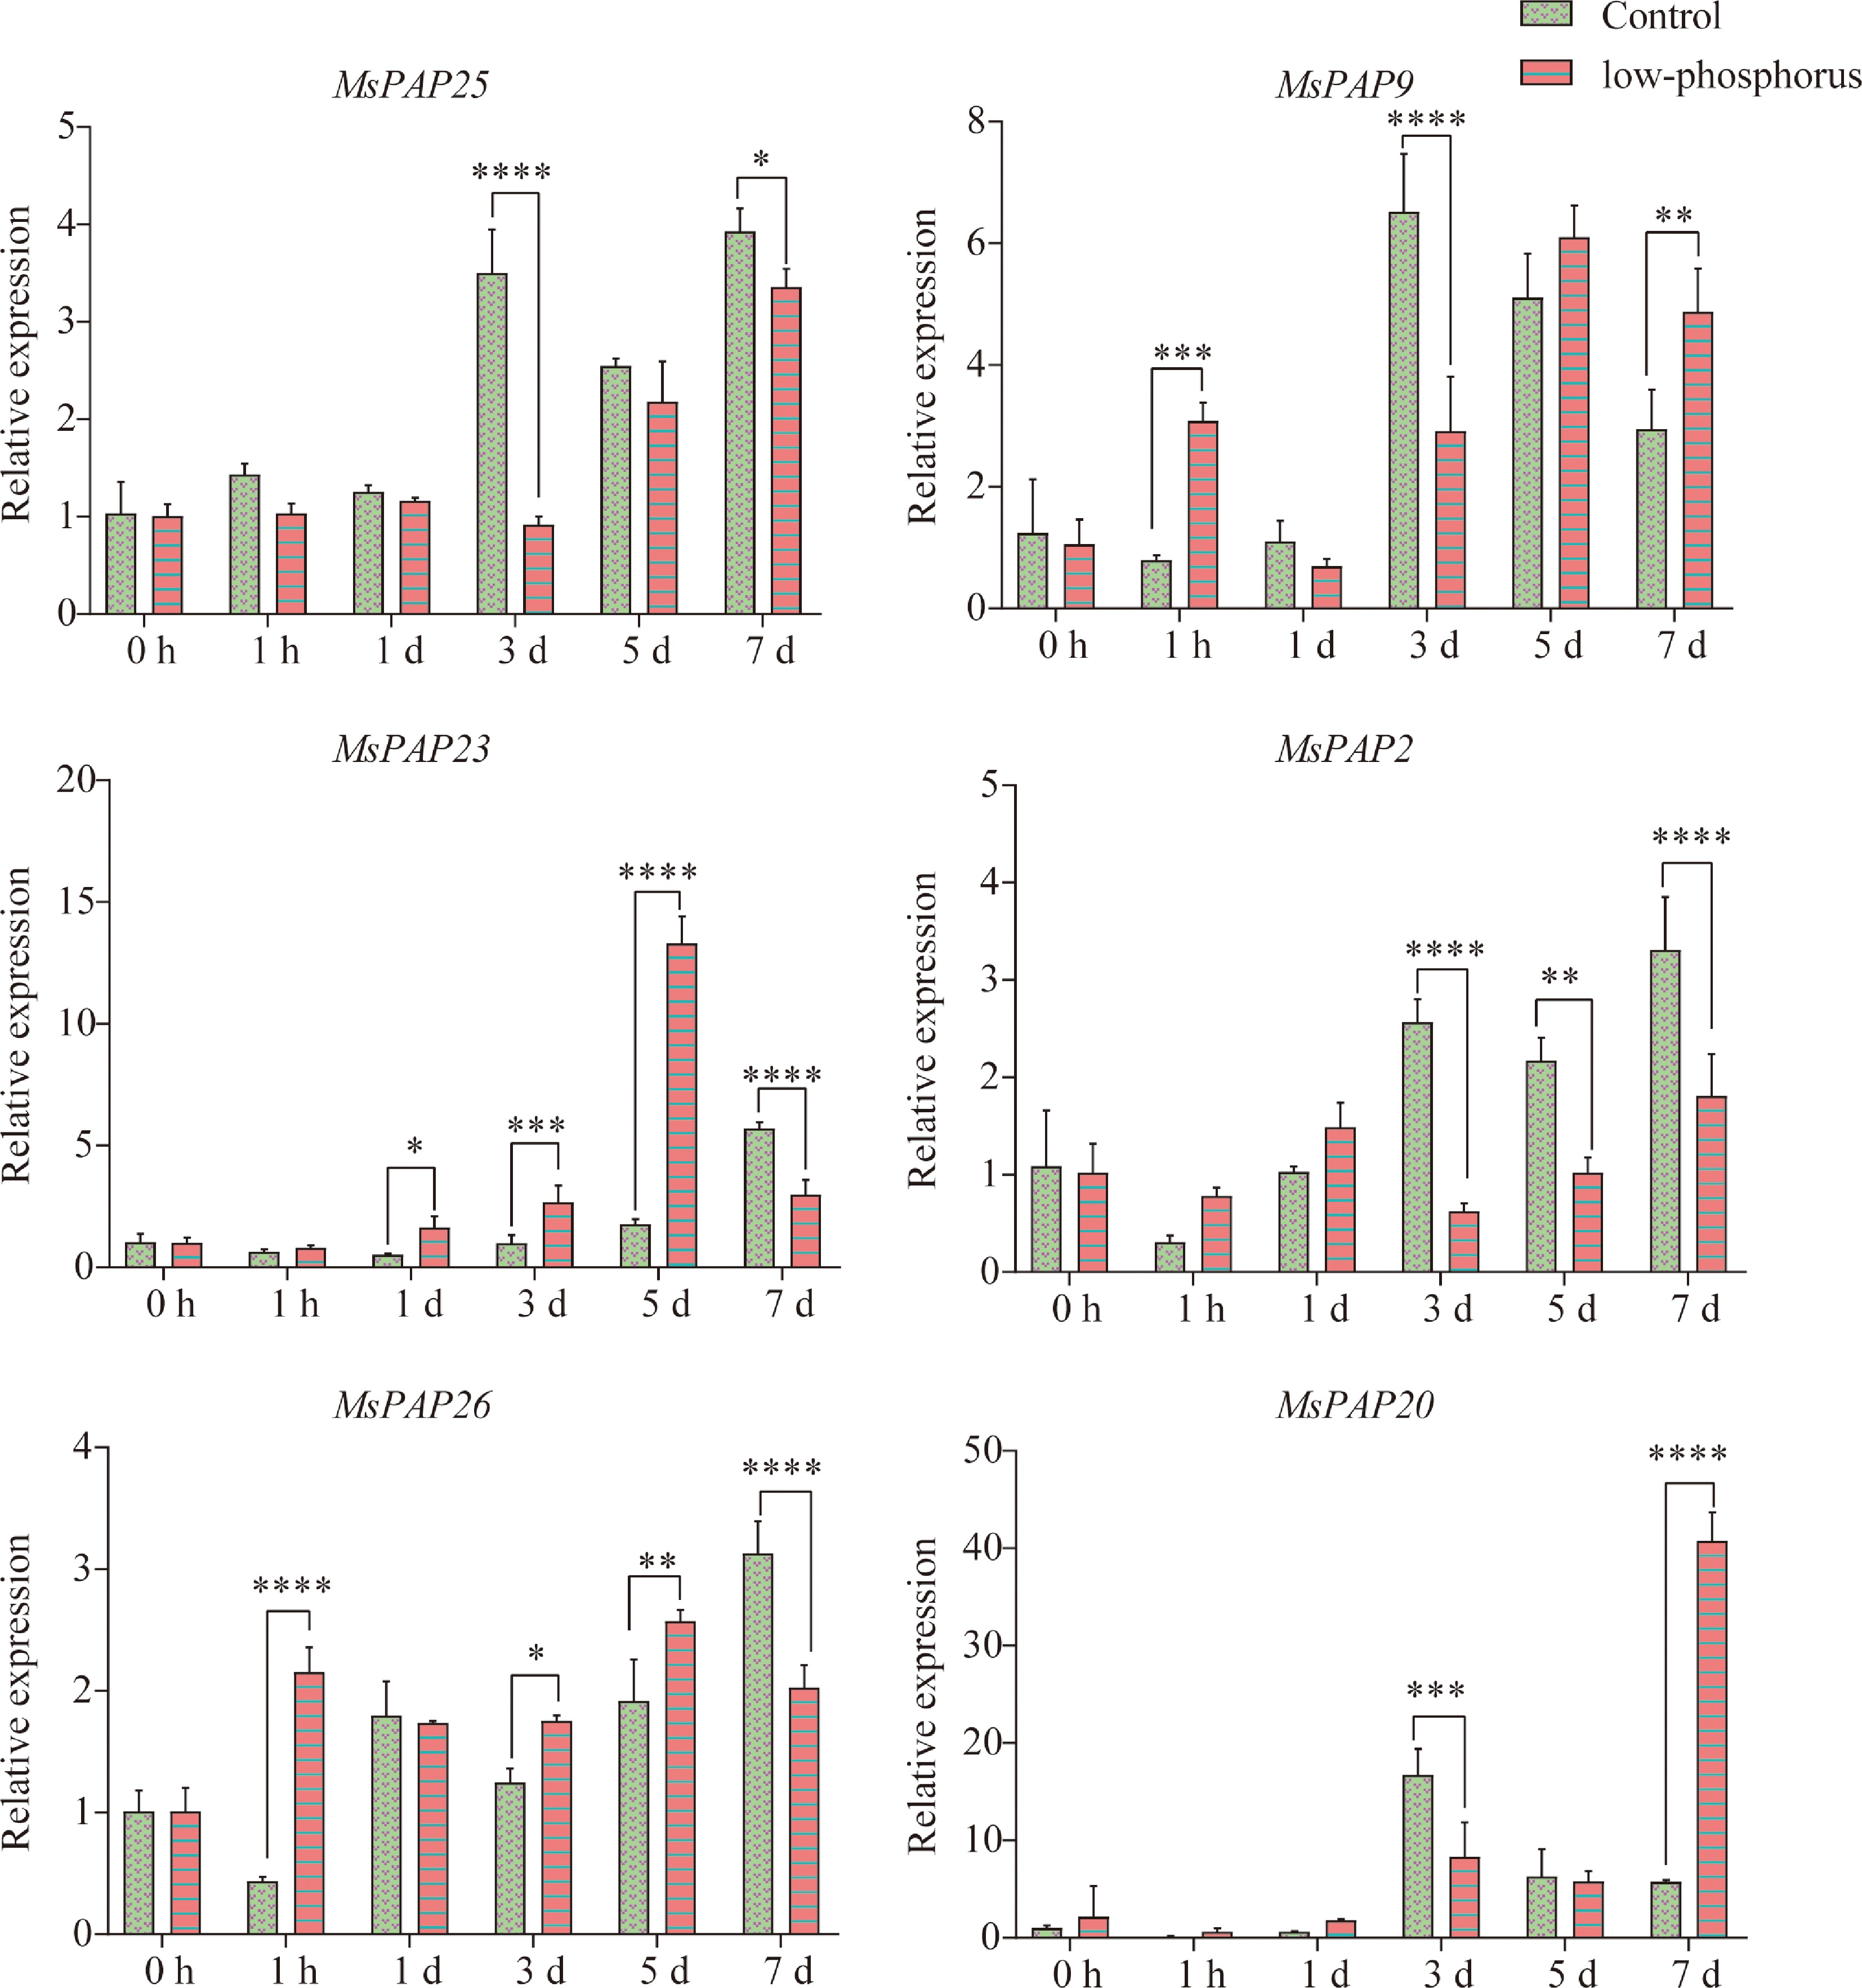
Figure 8.
Analysis of the relative expression levels of MsPAP family members under low-P stress. The abscissa represents different sampling time points: 0 and 1 h, and 1, 3, 5, and 7 d; the ordinate represents the relative expression level of each gene. Pink bars represent the 50-μmol·L−1 low-P treatment group (50 μmol·L−1 KH2PO4), and green bars represent the control group. The data are presented as the mean ± SD, n = 3. Significance of differences: *, 0.01 < p ≤ 0.05; **, 0.001 < p ≤ 0.01; ***, p ≤ 0.001; ****, p ≤ 0.0001, extremely significant. The y-axis shows relative expression (2−ΔΔCᴛ). Data are mean ± SD (n = 3), with the control (0 h) set to 1.
-
Gene name Gene ID Forward primer (5'→3') Reverse primer (5'→3') MsActin MS.gene75631 CAAAAGATGGCAGATGCTGAGGAT CATGCACCAGTATGACGAGGTCG MsPAP25 MsG0880042857.01.T01 TGACTTCTGCGGCAAGCTAA AGATGCTGATCATCGAGGCG MsPAP9 MsG0380016120.01.T01 AAAAGCTTCCGTGGAAACGC ACTCTTGGGGCCTGAAACTG MsPAP2 MsG0180006046.01.T01 CAGCCTGCTCCAGAGAACAA TCCAGAGAACGCAATCCACC MsPAP26 MsG0880044980.01.T01 TGCCCAGCTGAAAACAGACT CGCCCCCATTCAACAAAAGG MsPAP20 MsG0680034704.01.T02 GACTGGGGAAGGAGAGGTGA CTGCCCCACTAACCAGGAAC MsPAP23 MsG0780041115.01.T01 ACTGCCACATTCCAACCACT CCATGAGAGCCAAACGGAGT Table 1.
Primer sequences used for RT-qPCR analysis.
-
Gene ID Gene name No. of amino acids pI Molecular weight (kDa) Instability index Aliphatic index GRAVY Subcellular localization MsG0180003365.01.T01 MsPAP1 378 5.54 43.48 38.71 70.16 −0.604 Nucleus MsG0180006046.01.T01 MsPAP2 768 6.09 89.91 45.96 60.18 −0.829 Nucleus MsG0280008275.01.T01 MsPAP3 613 5.87 70.21 47.21 81.45 −0.521 Nucleus MsG0380014130.01.T01 MsPAP4 875 6.29 99.50 40.31 79.22 −0.432 Cytoplasm MsG0380014132.01.T02 MsPAP5 394 5.71 44.54 37.1 72.94 −0.469 Chloroplast, nucleus MsG0380014132.01.T01 MsPAP6 394 5.71 44.54 37.1 72.94 −0.469 chloroplast, nucleus MsG0380015680.01.T01 MsPAP7 588 6.32 66.70 31.07 66.85 −0.445 Vacuole MsG0380015682.01.T01 MsPAP8 620 6.42 69.64 35.58 67.02 −0.416 Nucleus MsG0380016120.01.T01 MsPAP9 543 5.3 61.13 38.53 74.07 −0.31 Extracellular space MsG0380016121.01.T01 MsPAP10 194 5.87 22.35 47.35 91.34 −0.287 Cytoplasm MsG0480019730.01.T01 MsPAP11 293 9.96 34.38 46.2 85.8 −0.324 Chloroplast MsG0480019732.01.T01 MsPAP12 931 7.18 106.78 33.67 81.46 −0.25 Nucleus, cytoplasm MsG0480019733.01.T01 MsPAP13 459 6.31 53.09 35.65 67.65 −0.441 Cytoplasm, vacuole MsG0480022236.01.T01 MsPAP14 727 5.39 81.34 36.25 72.85 −0.45 Nucleus MsG0480022238.01.T01 MsPAP15 456 9.17 51.70 32.09 83.99 −0.335 Cytoplasm MsG0480022891.01.T01 MsPAP16 409 4.87 46.74 35.7 90.49 −0.179 Cytoplasm MsG0580026511.01.T01 MsPAP17 317 5.27 36.15 40.86 66.47 −0.416 Nucleus MsG0680030857.01.T01 MsPAP18 548 5.79 61.07 44.46 71.35 −0.21 Vacuole MsG0680034704.01.T01 MsPAP19 331 5.36 37.47 37.2 80.94 −0.236 Extracellular space MsG0680034704.01.T02 MsPAP20 379 5.81 42.91 35.44 82.77 −0.194 Cytoplasm MsG0780038493.01.T01 MsPAP21 506 5.03 57.51 44.81 72.59 −0.293 Chloroplast, nucleus MsG0780041108.01.T01 MsPAP22 341 6.38 38.03 37.88 87.42 −0.085 Vacuole MsG0780041115.01.T01 MsPAP23 427 5.73 47.88 44.24 73.68 −0.371 Peroxisome MsG0880042856.01.T01 MsPAP24 1,066 6.32 120.13 39.49 86.41 −0.264 Plasma membrane MsG0880042857.01.T01 MsPAP25 449 7.16 49.54 36.85 77.75 −0.262 Mitochondria MsG0880044980.01.T01 MsPAP26 615 6.26 69.24 33.97 74.21 −0.342 Chloroplast MsG0880046225.01.T01 MsPAP27 555 6.98 62.13 32.36 75.17 −0.245 vacuole MsG0880046835.01.T01 MsPAP28 169 5.4 18.70 34.77 73.2 −0.322 Nucleus, cytoskeleton MsG0880046836.01.T01 MsPAP29 479 6.68 55.38 39.9 71.19 −0.405 vacuole MsG0880046836.01.T02 MsPAP30 479 6.68 55.38 39.9 71.19 −0.405 Vacuole Table 2.
The physicochemical characteristics of 30 members in the alfalfa MsPAP gene family.
Figures
(8)
Tables
(2)