-
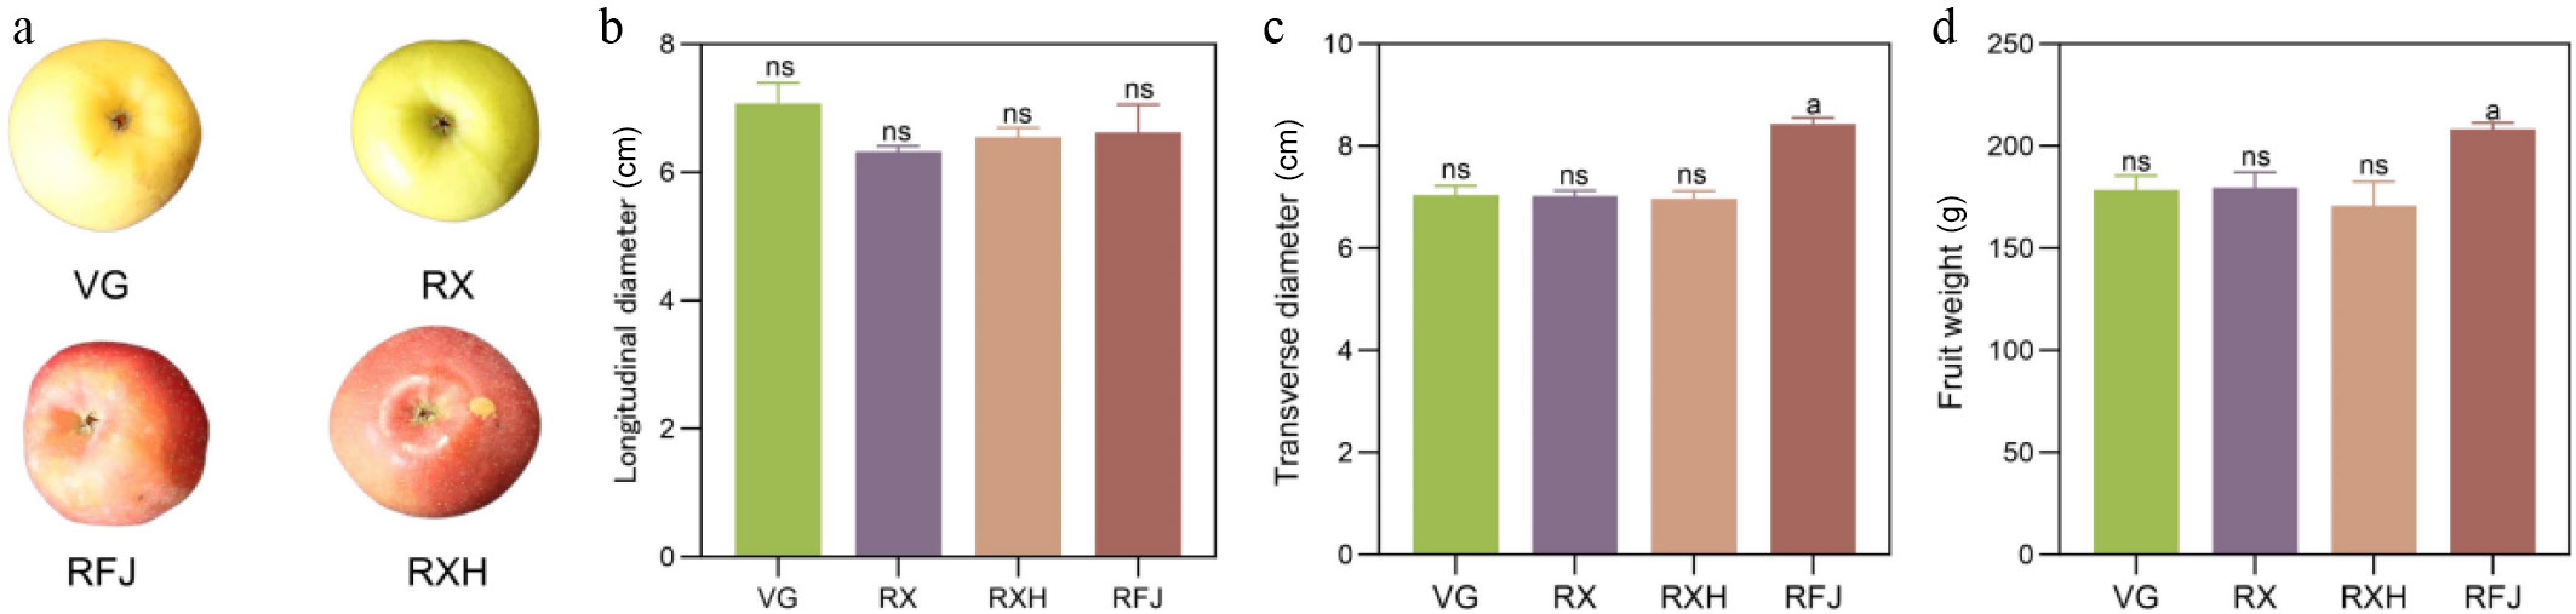
Figure 1.
Comparison of fruit phenotypic and physical characteristics among four apple cultivars. (a) Representative photographs of 'Golden Venus' (VG), 'Ruixue' (RX), 'Ruixianghong' (RXH), and 'Red Fuji' (RFJ) apple fruit grown in Zhaotong. Statistical comparisons of fruit (b) longitudinal diameter, (c) transverse diameter, and (d) single-fruit weight. Data represent mean ± SEM (n = 5). Different lowercase letters indicate statistically significant differences among cultivars according to one-way ANOVA with Tukey's HSD test (p < 0.05).
-
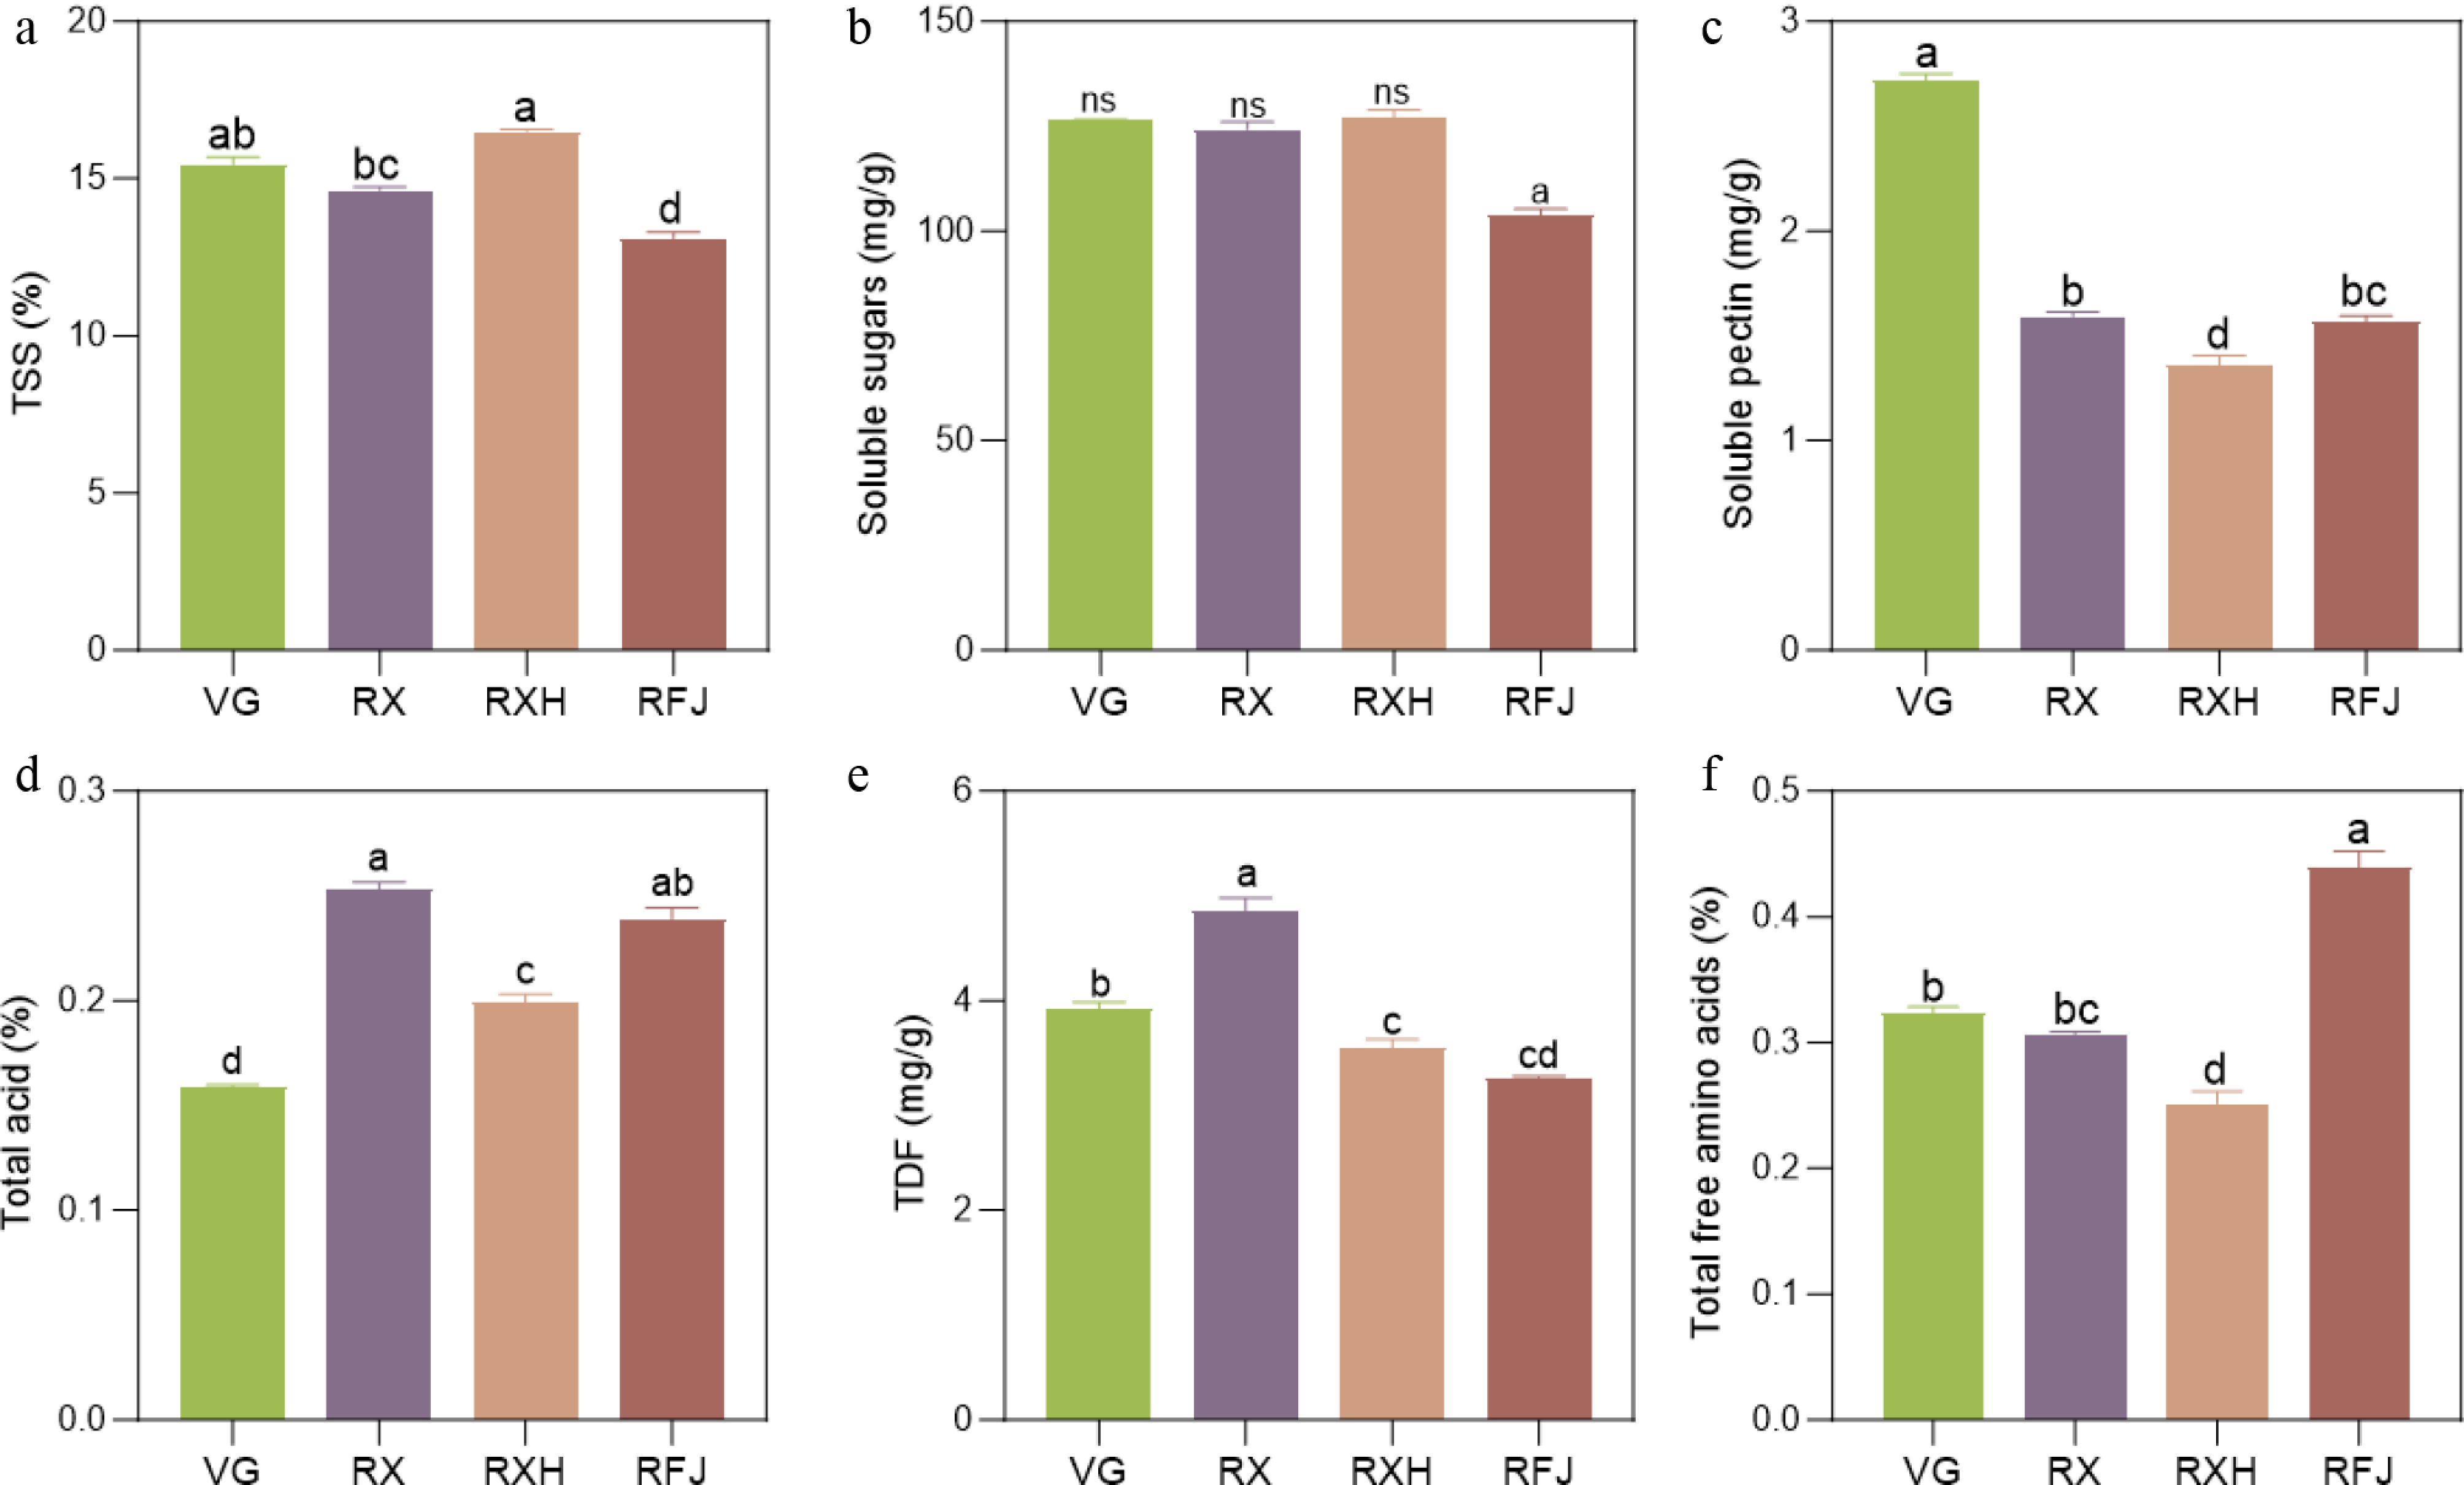
Figure 2.
Primary physicochemical and nutritional attributes among four apple cultivars. (a) Total soluble solids (TSS, %). (b) Total soluble sugars (mg/g FW). (c) Soluble pectin (mg/g FW). (d) Total titratable acidity (TA, % as malic acid equivalent). (e) Total dietary fiber (TDF, mg/g FW). (f) Total free amino acids (% FW). Data are presented as mean ± SEM (n = 5). Different lowercase letters indicate statistically significant differences among cultivars according to one-way ANOVA with Tukey's HSD test (p < 0.05).
-
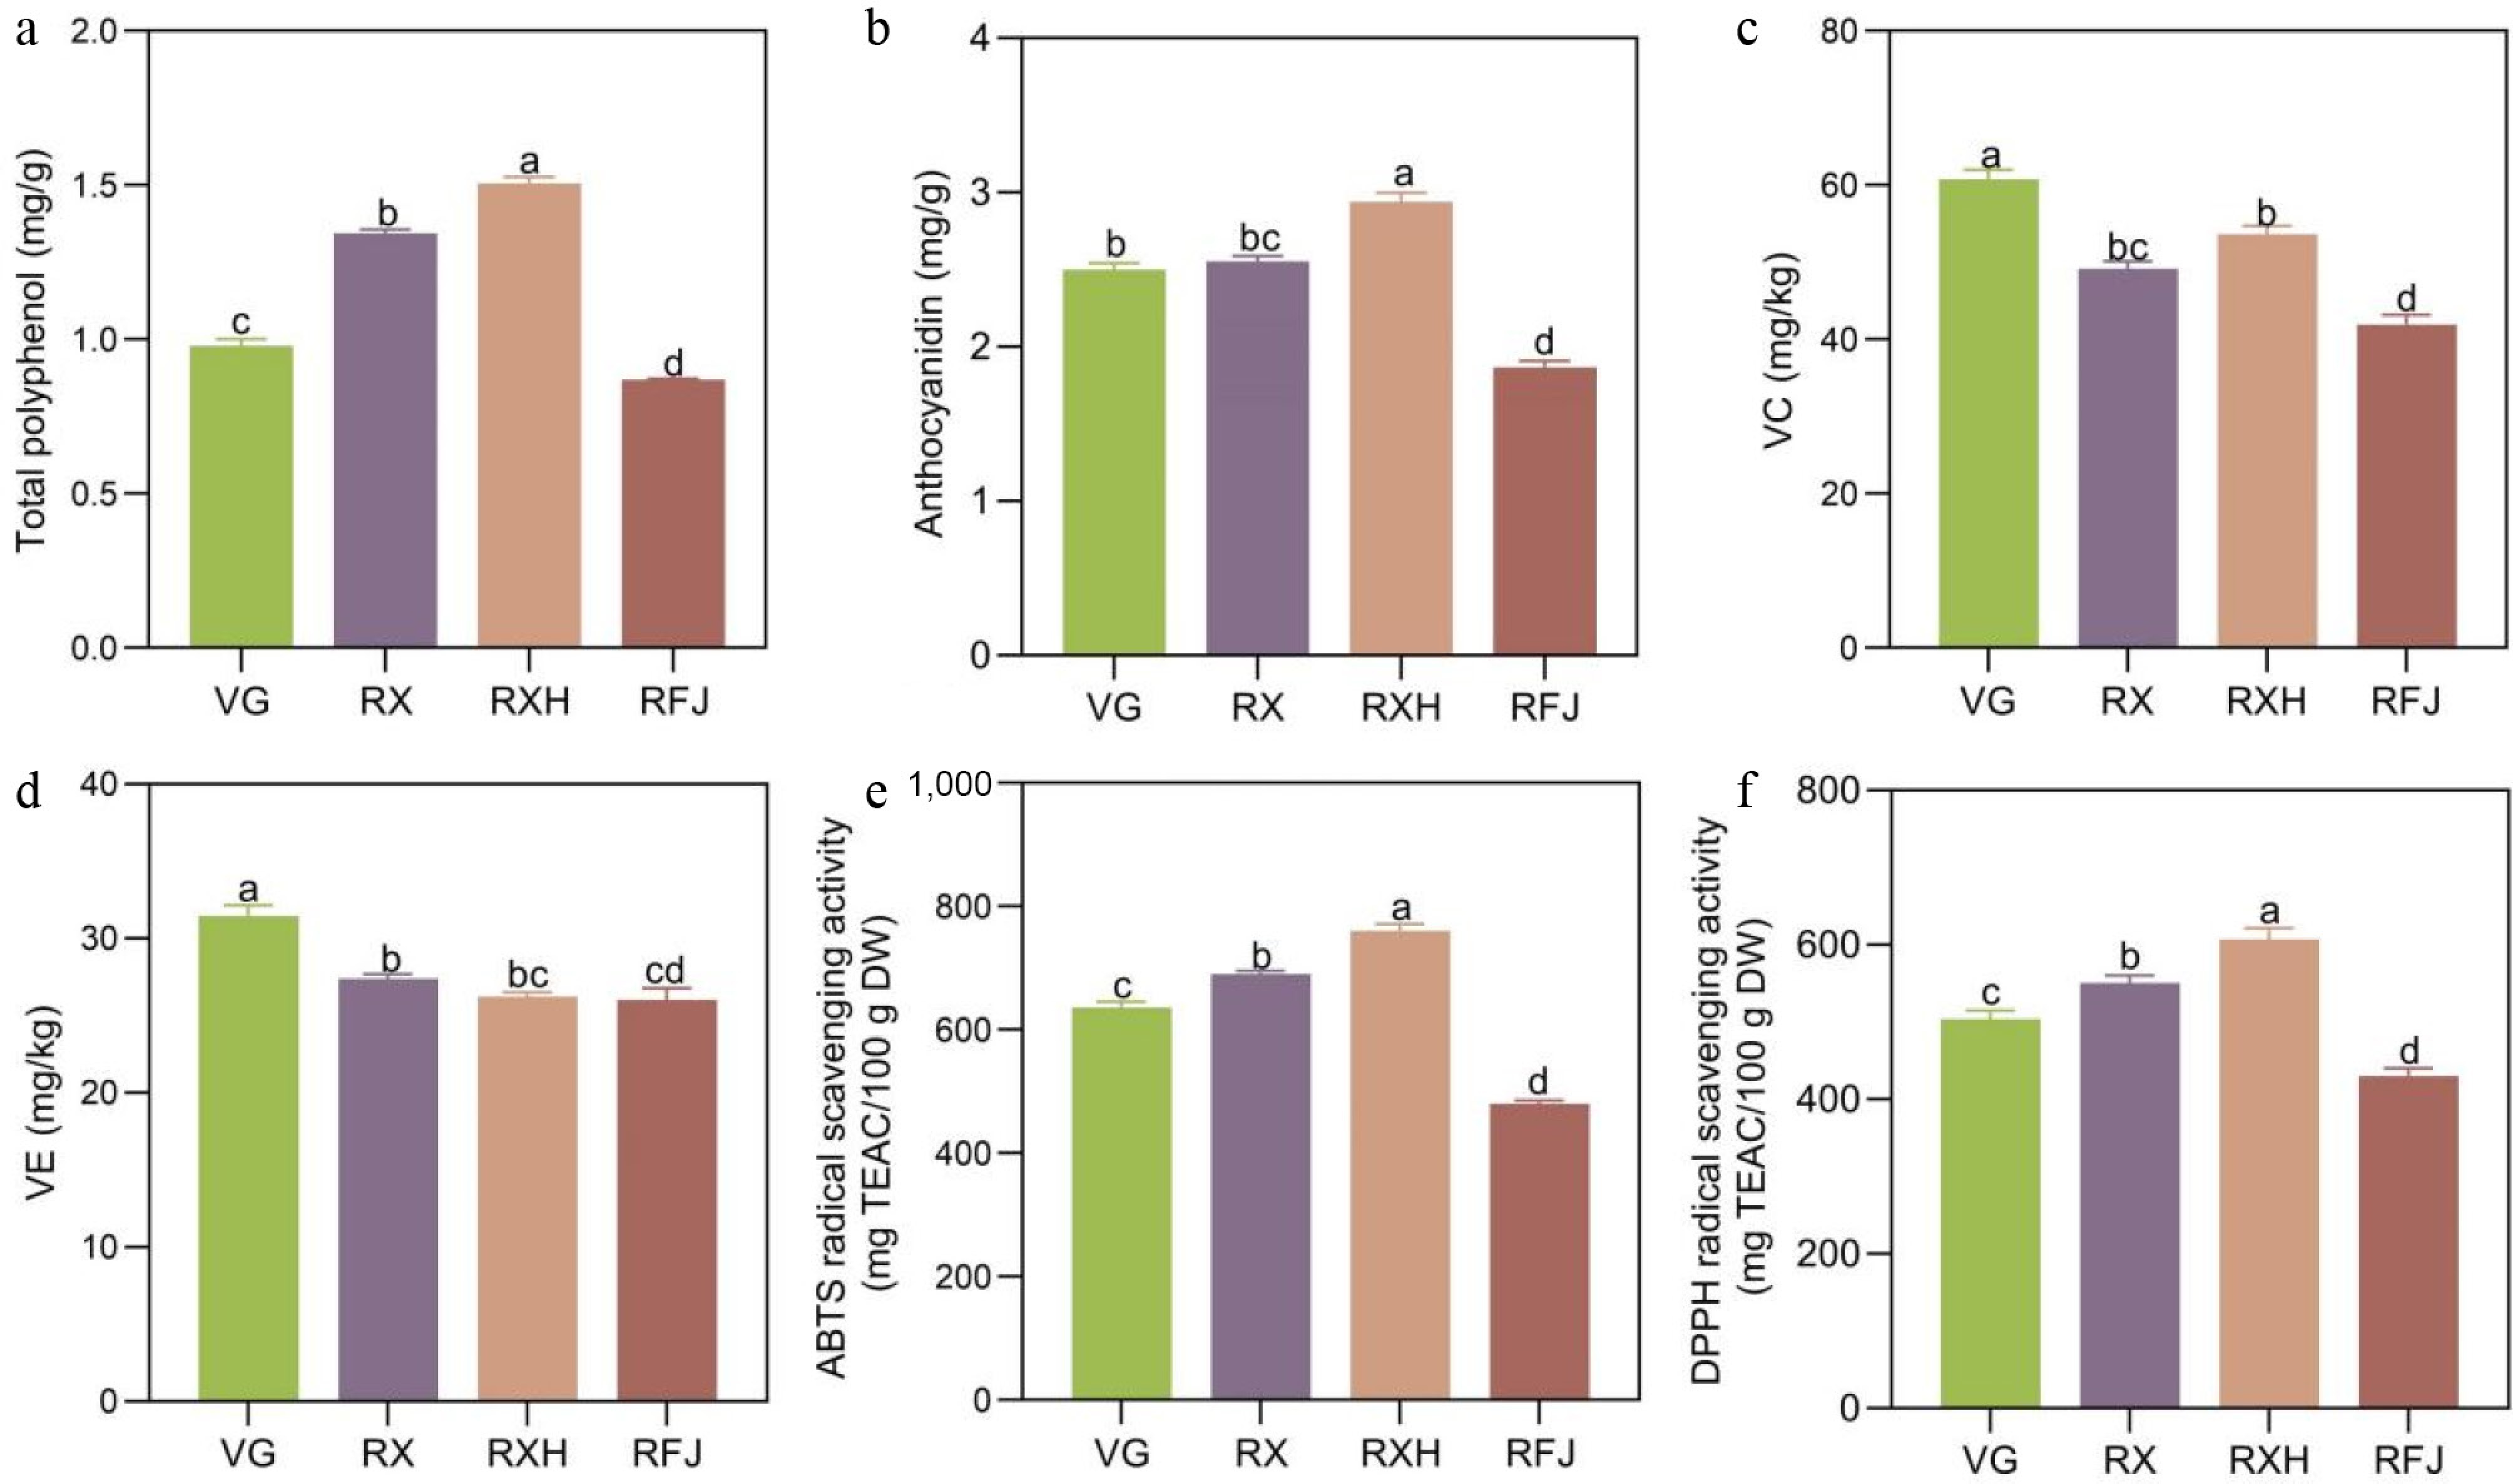
Figure 3.
Functional nutritional components and in vitro antioxidant activities among four apple cultivars. (a) Total phenolic content (TPC, mg/g FW). (b) Total anthocyanin content (TAC, mg/100 g FW). (c) Vitamin C (VC, mg/kg FW). (d) Vitamin E (VE, mg/kg FW). (e) ABTS radical scavenging activity (mg TEAC/100 g DW). (f) DPPH radical scavenging activity (mg TEAC/100 g DW). Data are expressed as mean ± SEM (n = 5). Different lowercase letters indicate statistically significant differences among cultivars according to one-way ANOVA with Tukey's HSD test (p < 0.05).
-
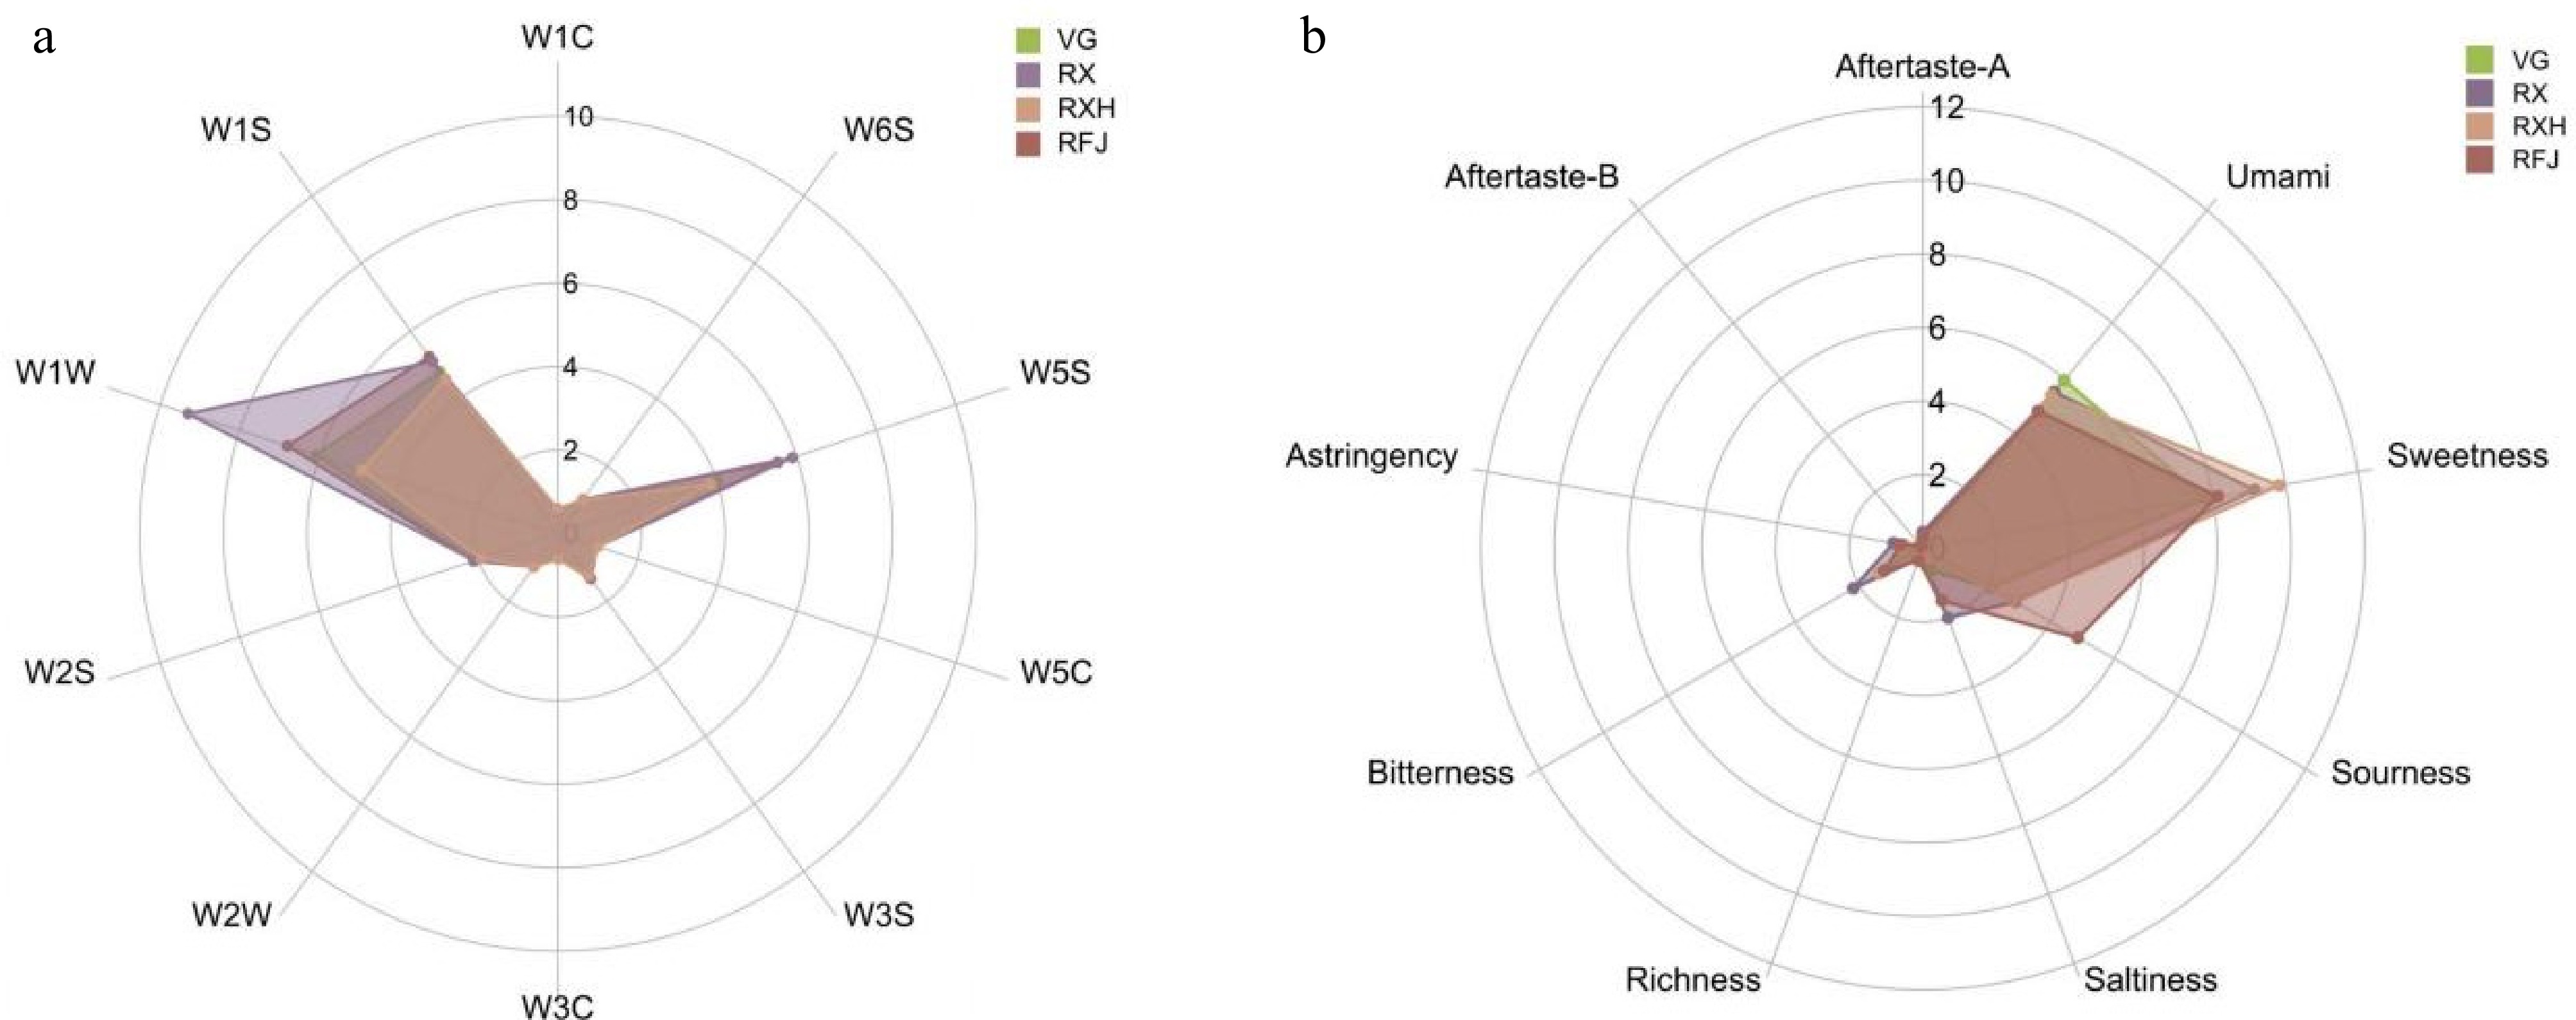
Figure 4.
Profiling of volatile and gustatory flavor characteristics among four apple cultivars. (a) Electronic tongue radar chart showing the gustatory taste profiles. (b) Electronic nose radar chart showing the volatile aroma sensor responses. Data are expressed as mean ± SEM (n = 5).
-
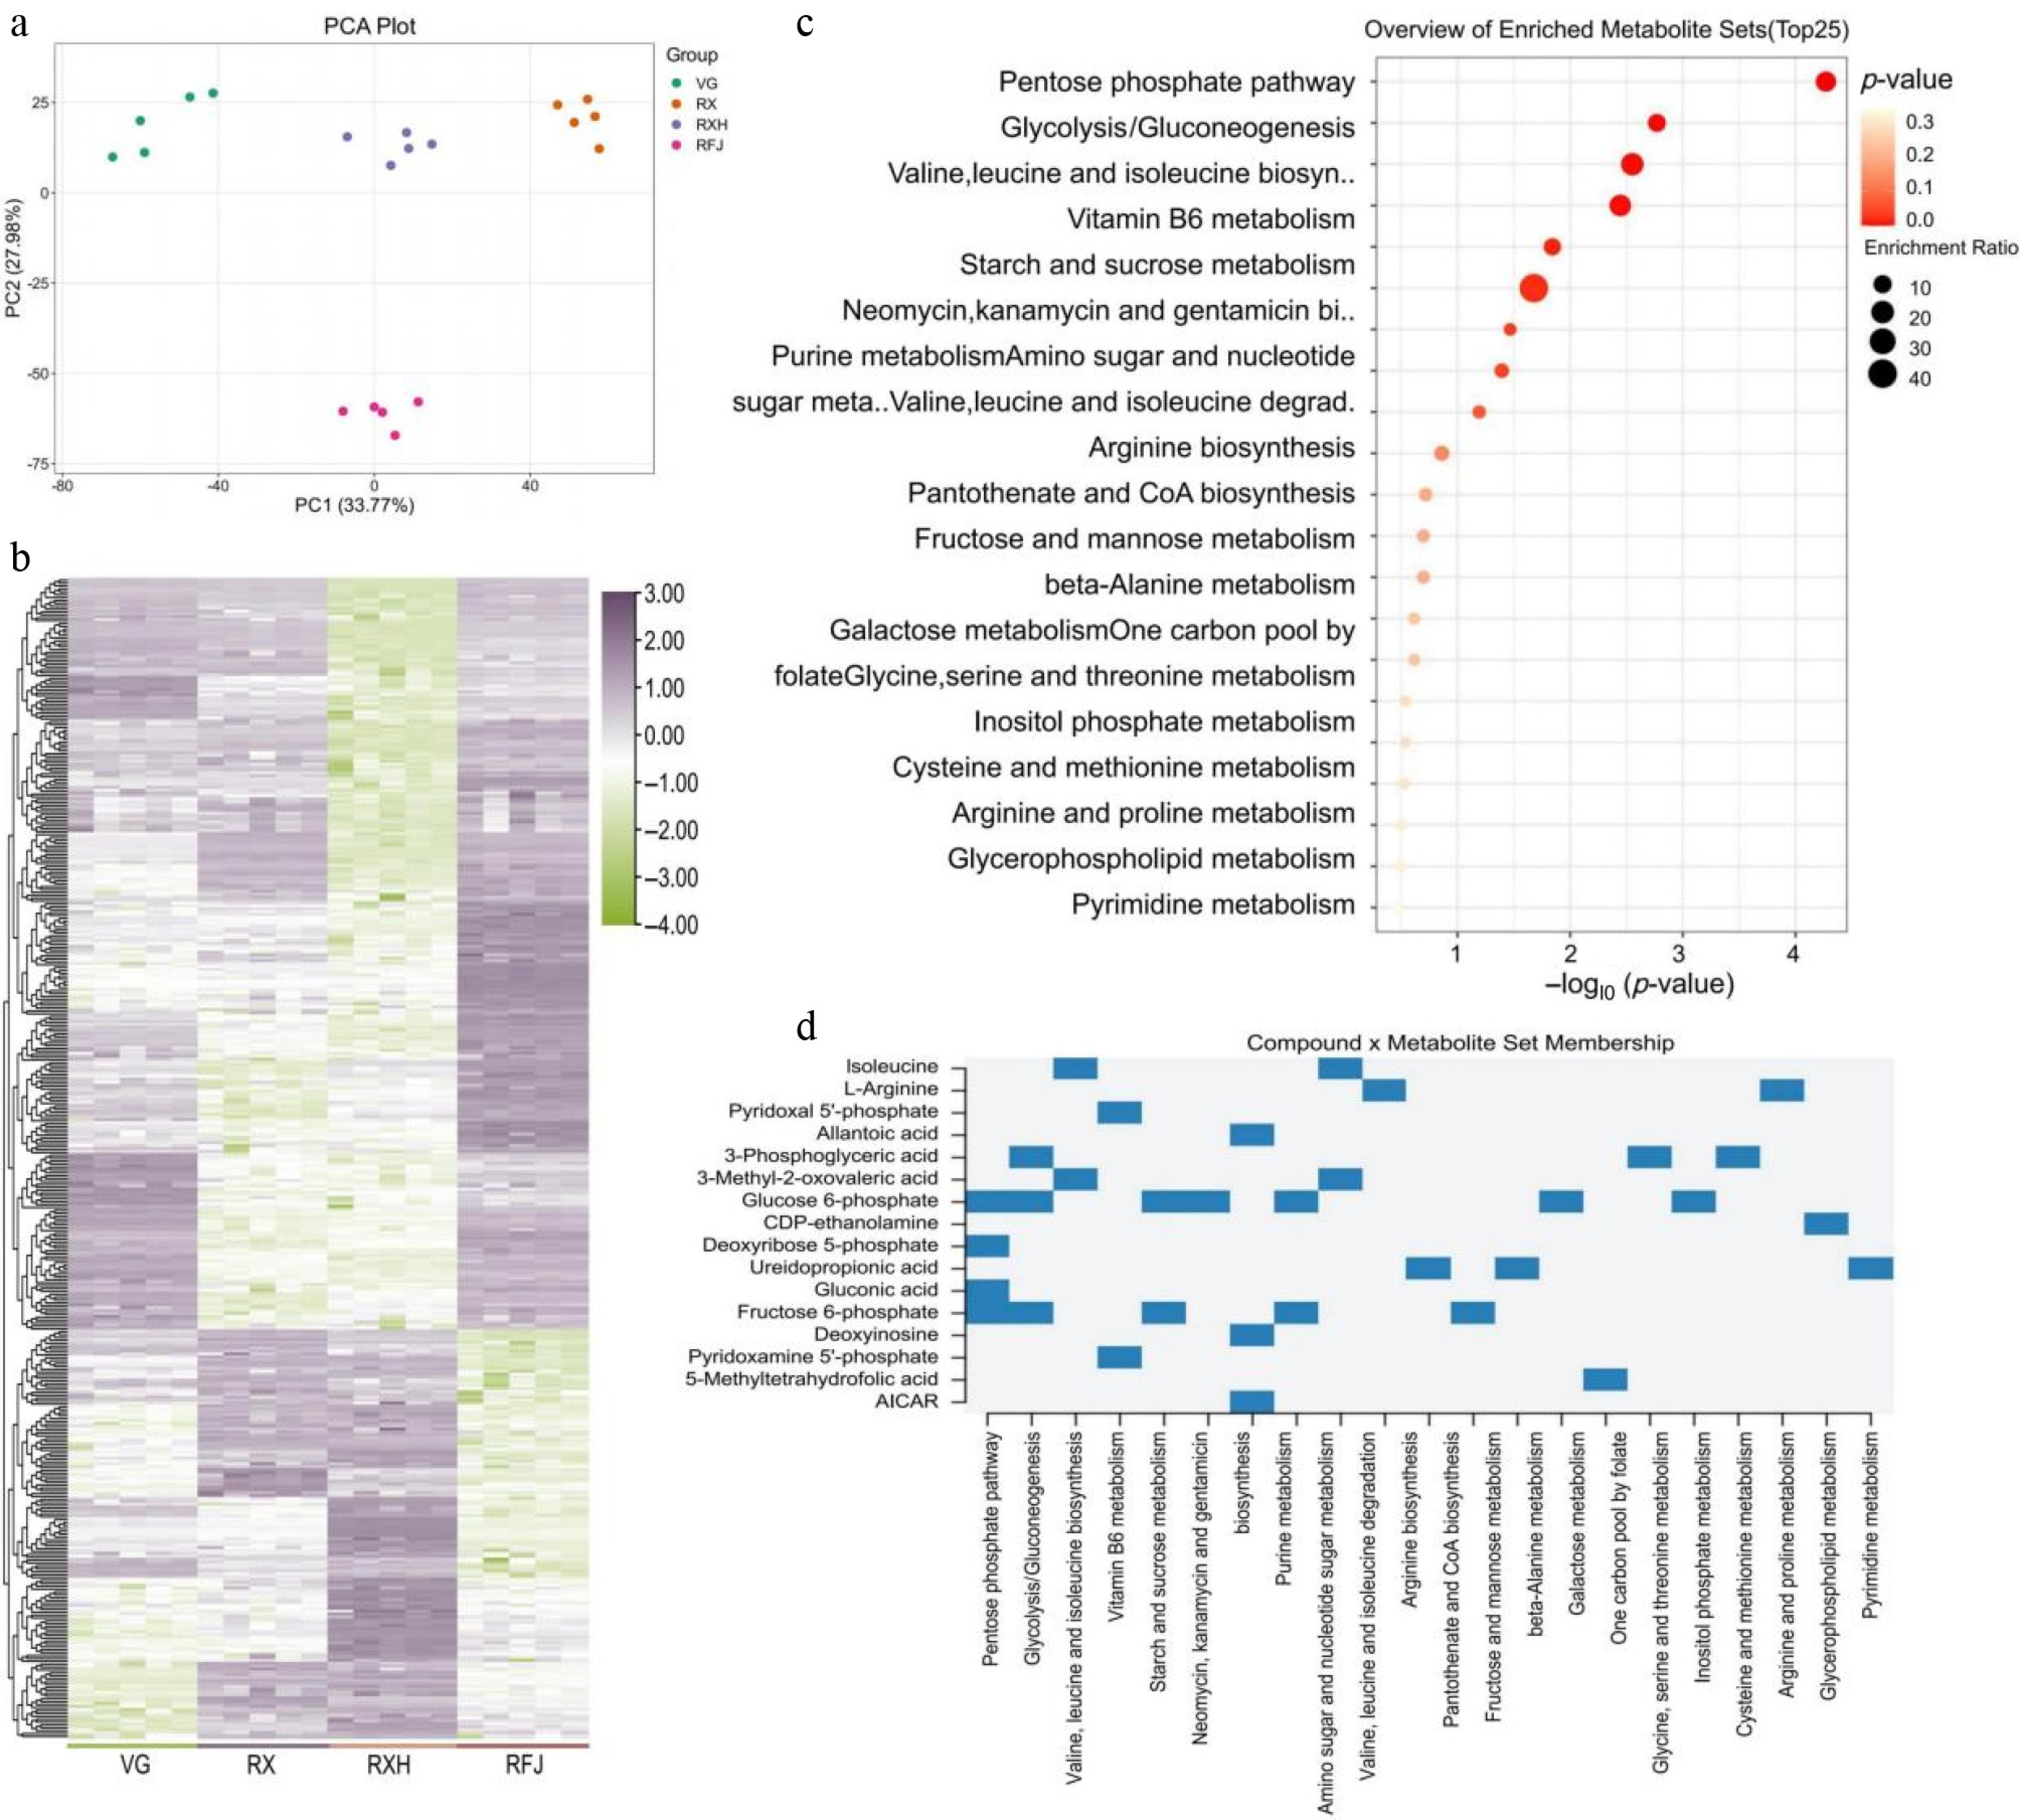
Figure 5.
Comparative untargeted metabolomic profiling and metabolic pathway enrichment among four apple cultivars. (a) Score scatter plot of principal component analysis (PCA) based on all identified metabolites in positive and negative ESI modes (n = 5). (b) Hierarchical cluster analysis (HCA) heatmap of differentially accumulated metabolites (DAMs; screening thresholds: VIP > 1.0, fold change ≥ 1.5 or ≤ 0.67, FDR-corrected p < 0.05). Columns represent biological replicates, and rows represent individual metabolites (Z-score standardized). (c) KEGG pathway enrichment bubble plot highlighting top-ranked metabolic pathways (p-values indicated by color gradient; enrichment ratio indicated by bubble diameter). (d) Network pathway-metabolite association matrix mapping key primary intermediates to enriched KEGG cascades.
-
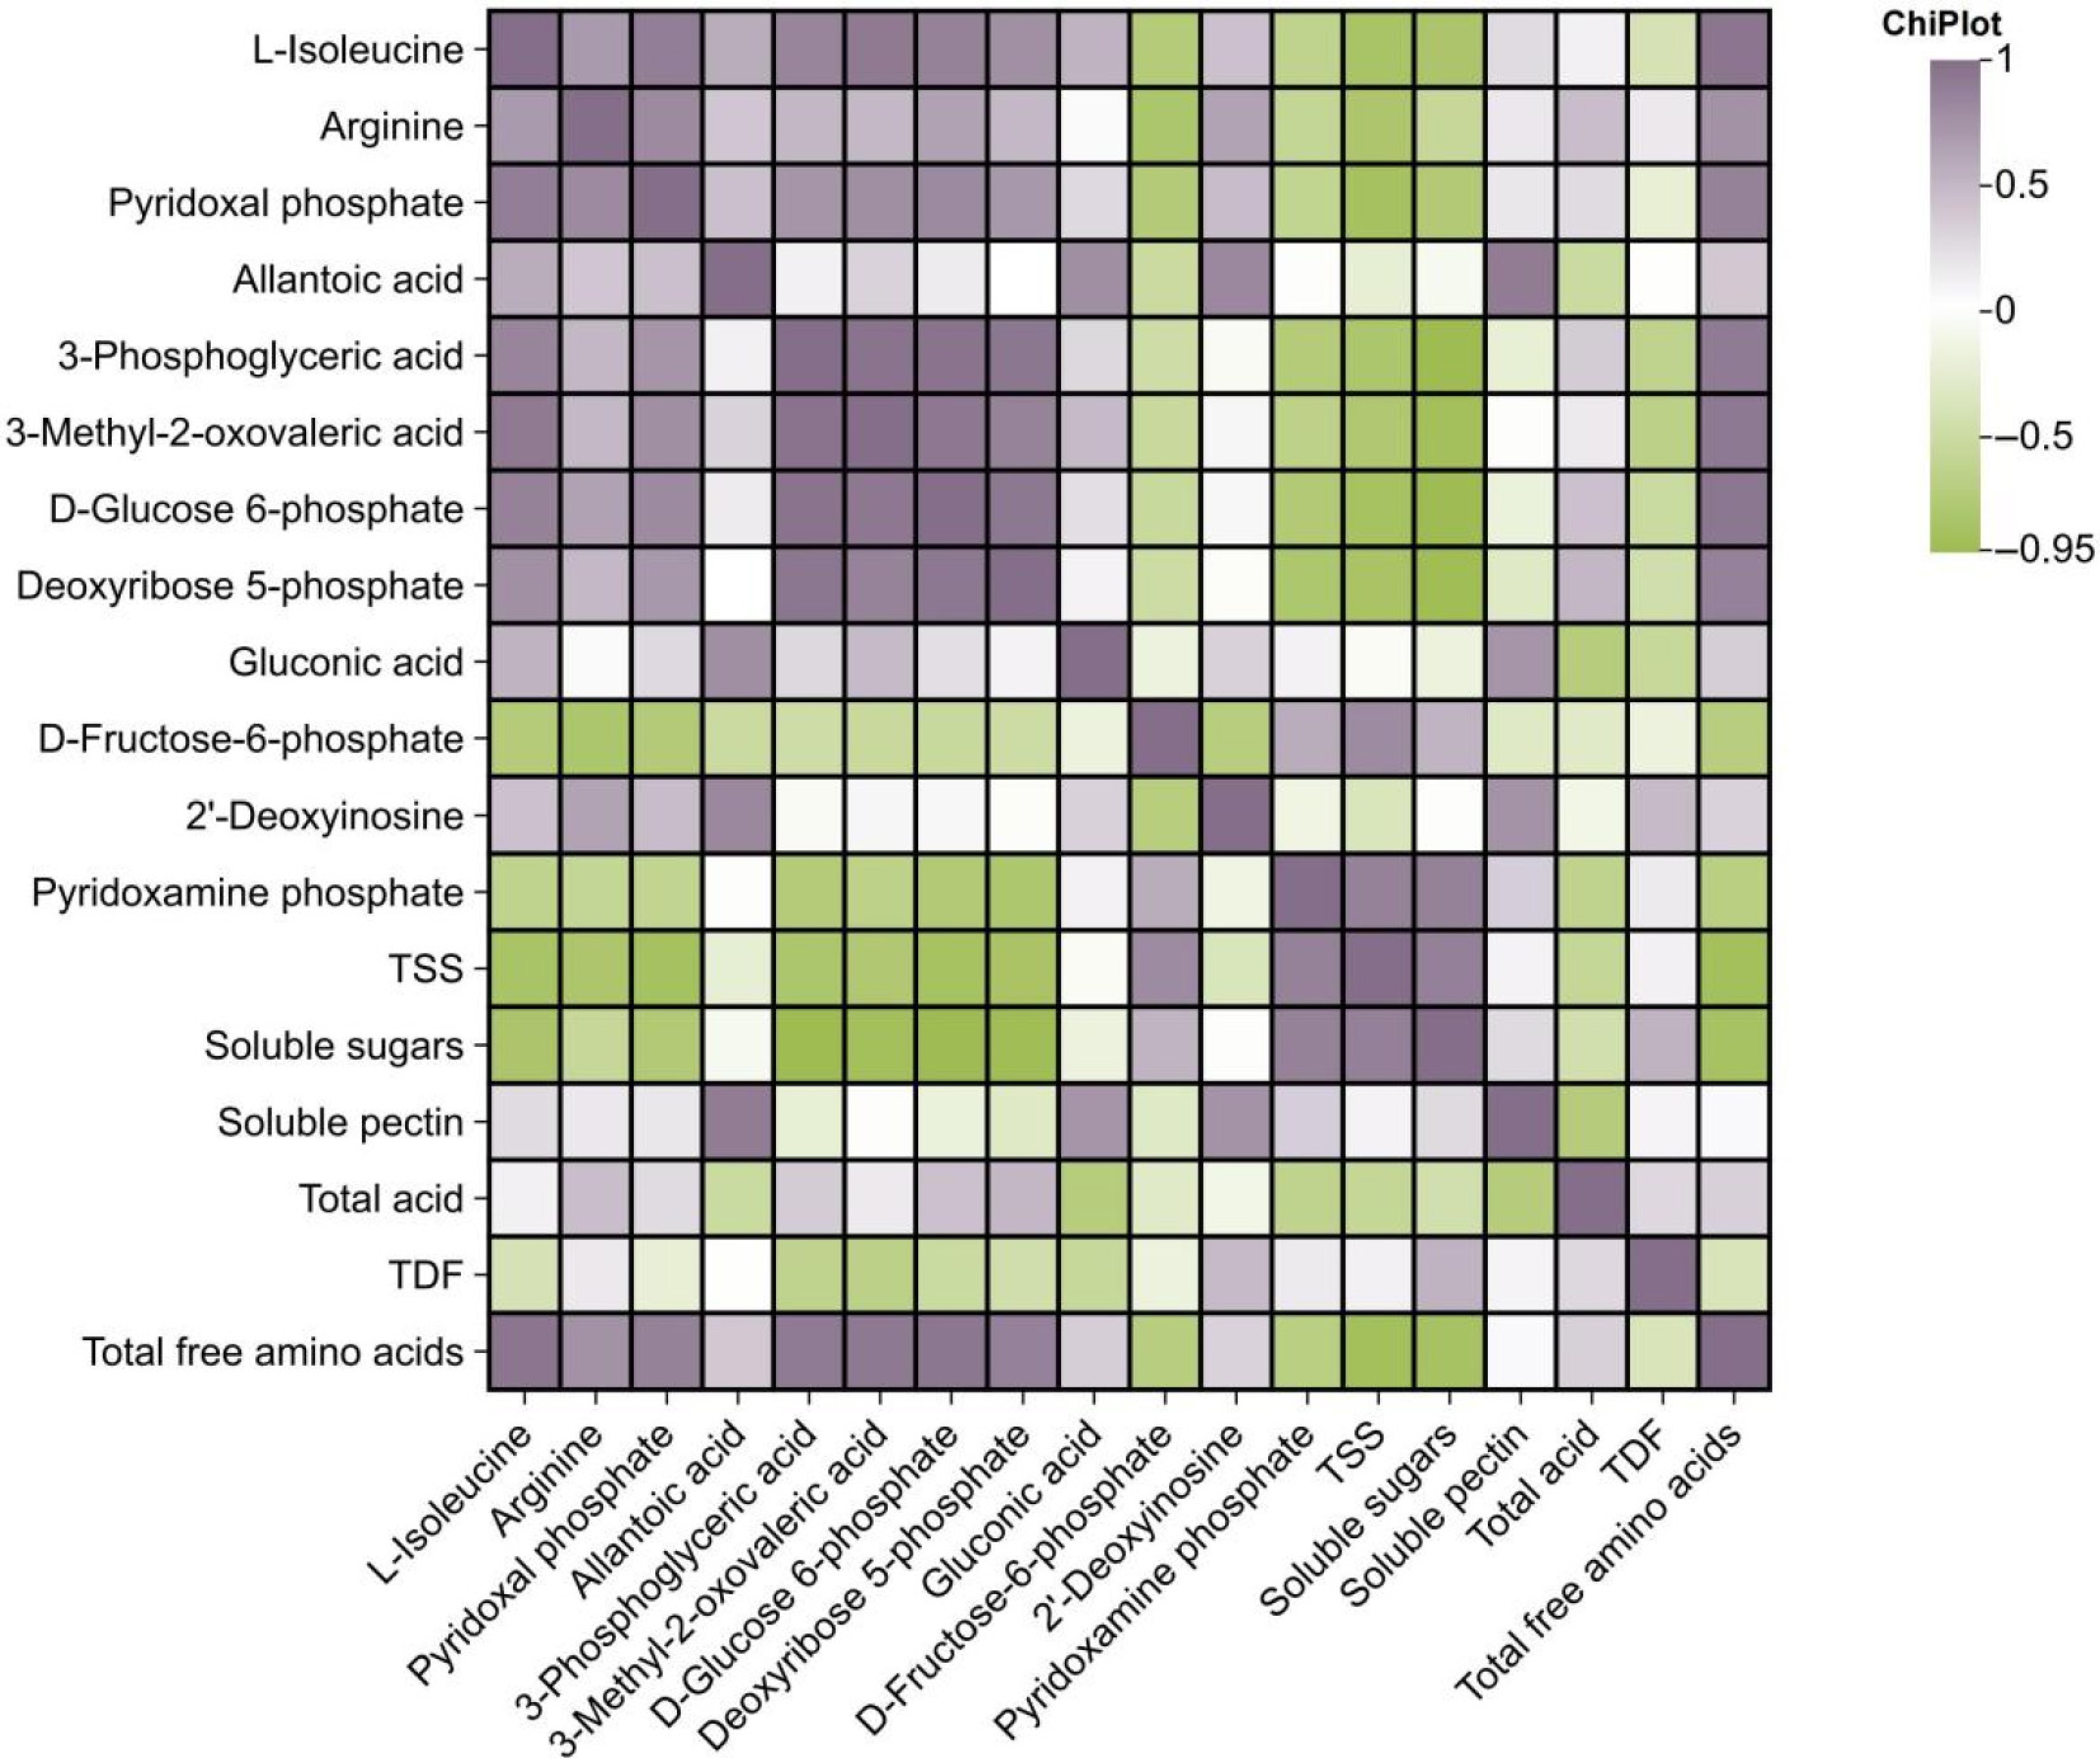
Figure 6.
Correlation matrix between primary quality traits and differentially accumulated metabolites (DAMs). Color scale corresponds to Pearson's correlation coefficients (n = 5). Significant correlations are established at p < 0.05.
-
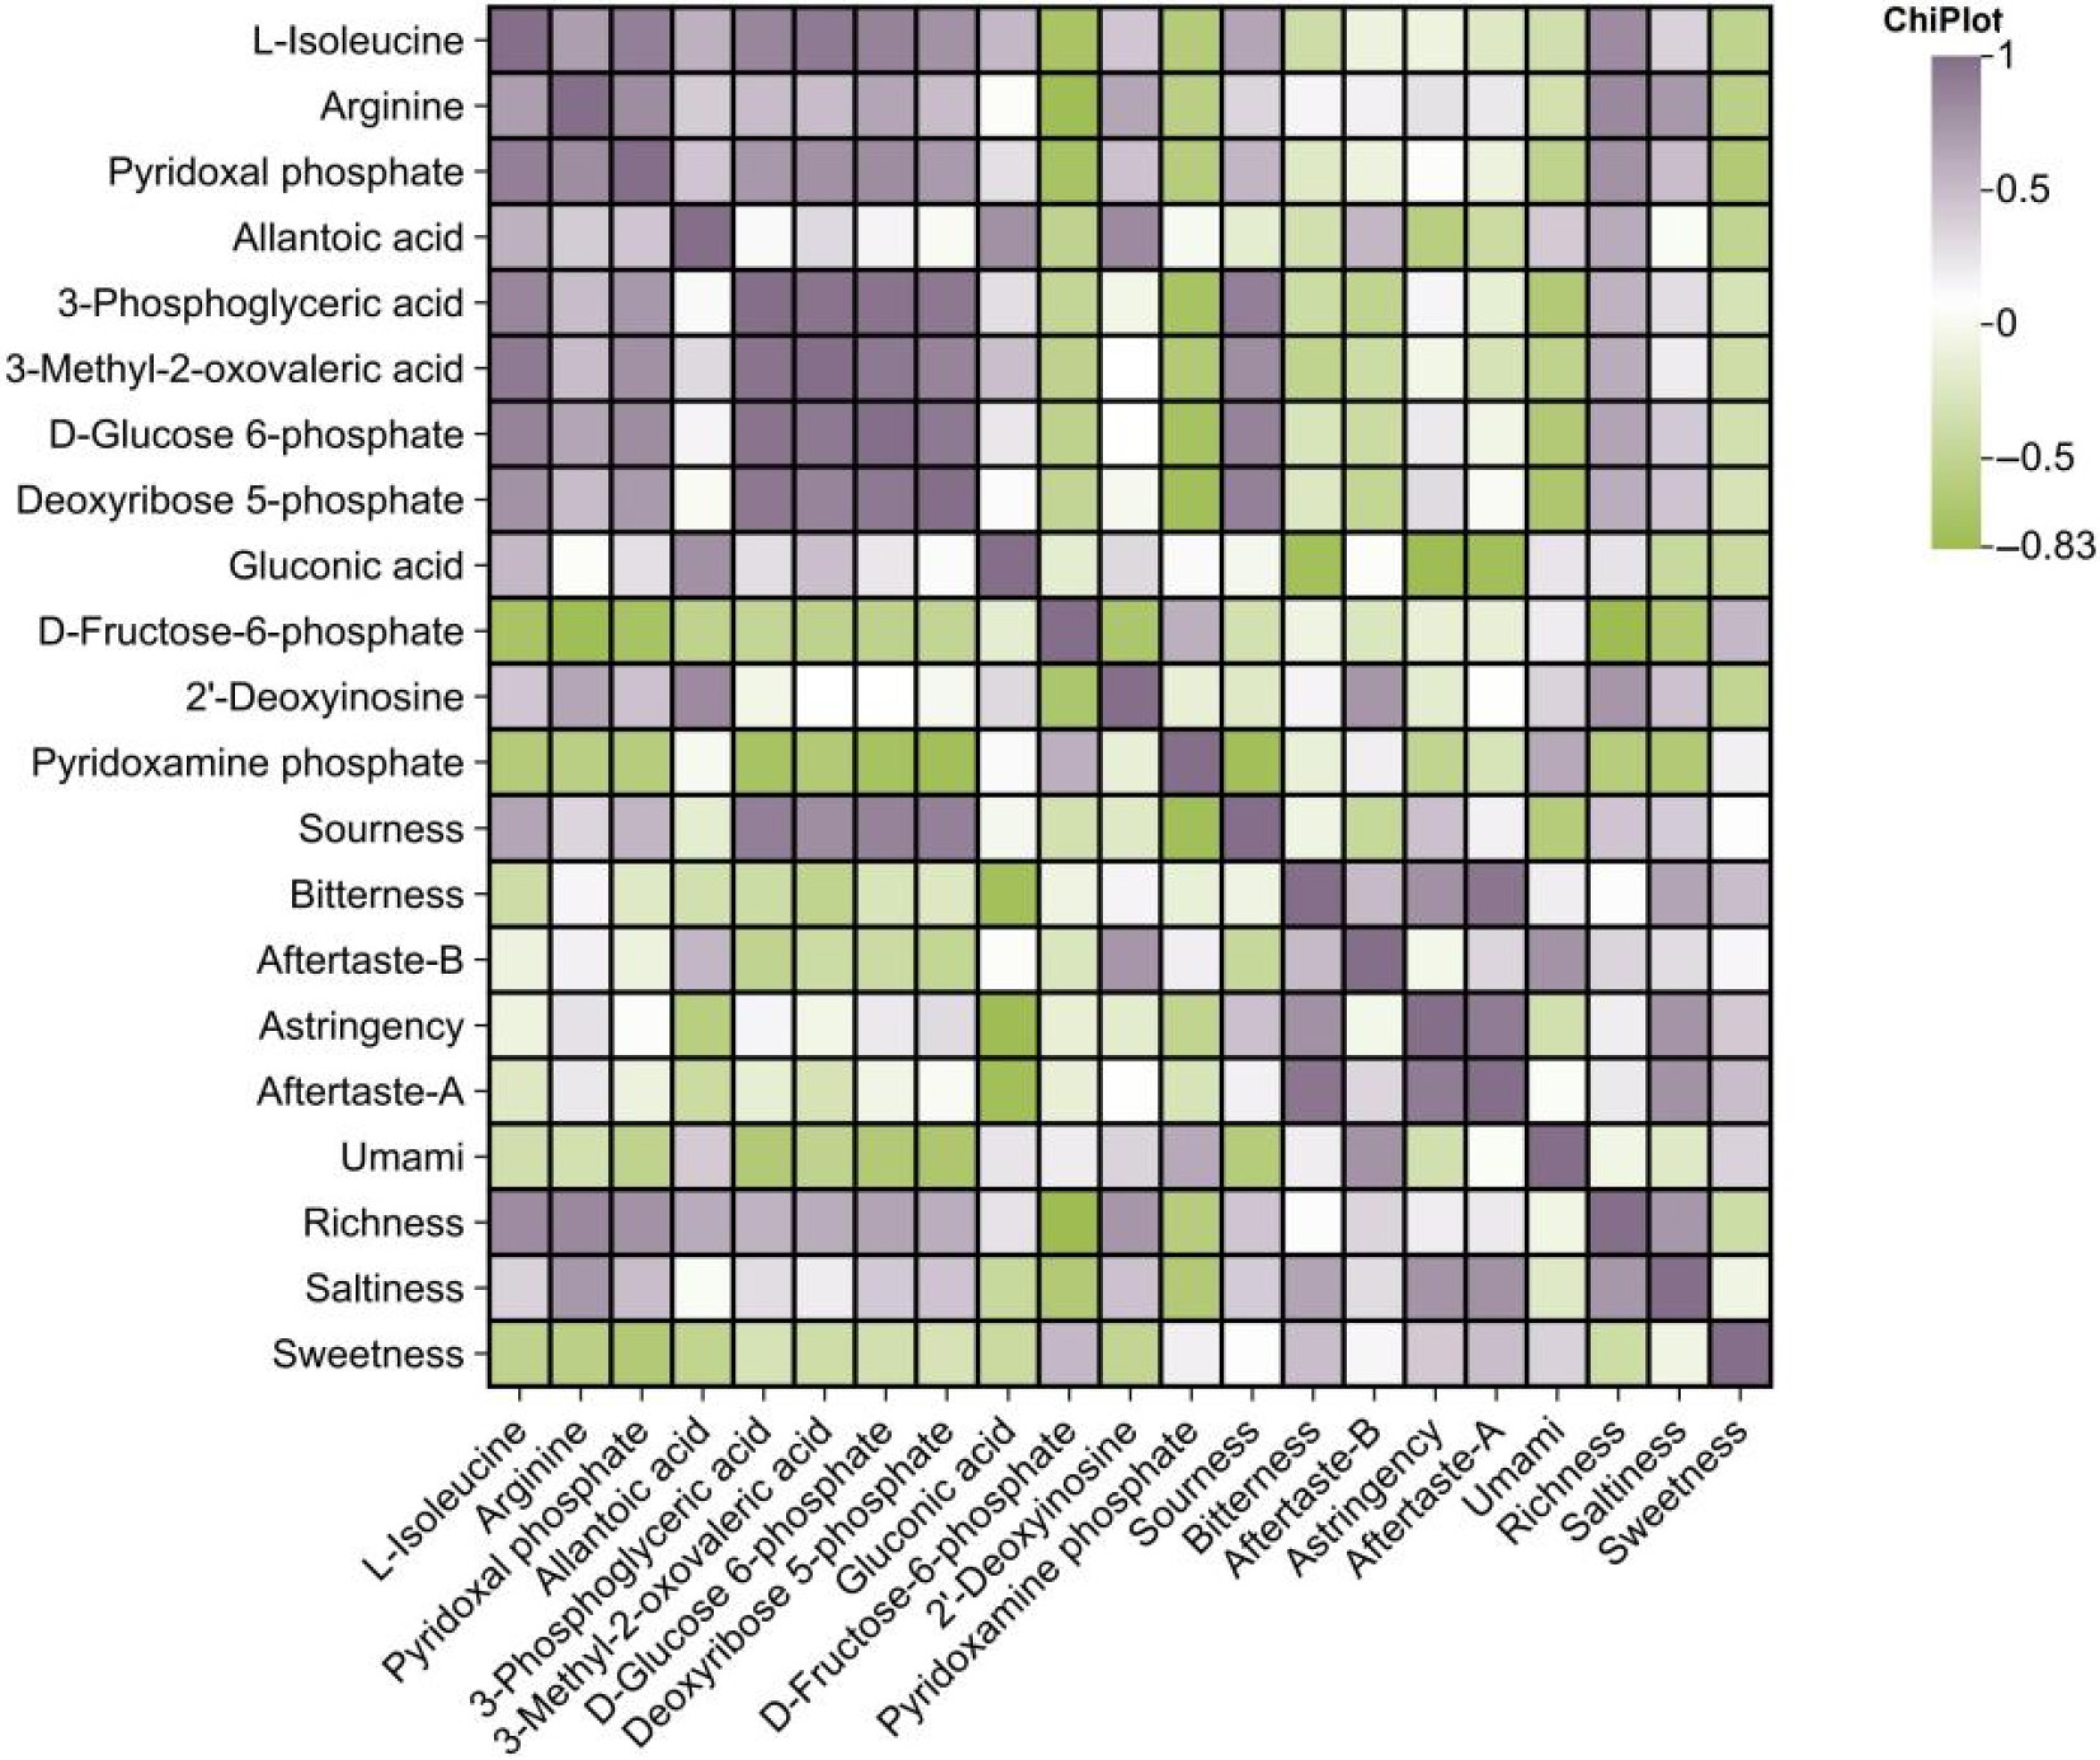
Figure 7.
Correlation matrix between electronic sensory attributes (electronic tongue) and core metabolites. Color intensity illustrates Pearson's correlation coefficients (n = 5). Significant correlations are established at p < 0.05.
Figures
(7)
Tables
(0)