ARTICLE   Open Access    

Exogenously applied methyl jasmonate increased the resistance of postharvest pear fruit to blue mold

More Information
  • Methyl jasmonate (MeJA) is a plant-signalling molecule that plays significant roles in stress reactions and defence responses. The goal of this study was to characterize the effects of exogenous MeJA application on the resistance of postharvest pear fruit to blue mould rot caused by Penicillium expansum and investigate the mechanism underlying the observed effects of MeJA application. MeJA treatment effectively reduced the lesion diameter of blue mould rot in pear fruit. Furthermore, MeJA significantly enhanced the activities of antioxidant and defence-related enzymes, such as polyphenol oxidase (PPO), superoxide dismutase (SOD), peroxidase (POD), catalase (CAT), β-1,3 glucanase (GLU) and chitinase (CHI); total phenol content also increased, and membrane lipid peroxidation decreased. MeJA treatment promoted the expression of PpPPO, Cu-ZnSOD, PpPOD, PpCAT, PpCHI and PpGLU. Overall, this experiment suggested that MeJA-induced pear fruit resistance against blue mould rot may be related to the enhanced activities of defence enzymes and gene expression.
  • The competition for consumer preference for fresh apples (Malus domestica) from exotic and tropical fruits is intense. Red-fleshed (RF) apple may not only provide a novel point of differentiation and enhanced visual quality, but also a source of increased concentration of potentially health-benefiting compounds within both the fresh fruit and snack/juice markets[1]. Two different types of RF apples have been characterised: Type 1 RF apple has red colouration not only in the fruit core and cortex, but also in vegetative tissues, including stems and leaves; Type 2 RF apples display red pigment only in the fruit cortex[1, 2]. To facilitate trade and lengthen the supply-window, harvested fruit are usually cold stored, which can induce a series of disorders, including physiological breakdown manifesting as a flesh browning disorder (FBD) in RF apples[3, 4]. FBD in RF apples can be caused by senescence, and there is also some evidence to suggest that a large proportion of RF apples are chilling-sensitive (Jason Johnston, Plant & Food Research Hawke's Bay, personal communication).

    Earlier studies suggested that Type 1 RF colour was determined by a promoter mutation of MdMYB10 that has a tandem replication of a myeloblastosis (MYB) binding cis-element (R6) within the promoter, resulting in autoregulation of MdMYB10[5]. However, van Nocker et al.[6] observed a large variation in the degree and pattern of red pigmentation within the cortex among the accessions carrying MdMYB10, and concluded that the presence of this gene alone was not sufficient to ensure the RF colour. A genome-wide association study (GWAS)[3], reported that, in addition to the MdMYB10 gene, other genetic factors (e.g. MdLAR1, a key enzyme in the flavonoid biosynthetic pathway) were associated with RF colour, too. Wang et al.[7] reported that many of the up-regulated genes in RF apples were associated with flavonoid biosynthesis (e.g., chalcone synthase (CHS), chalcone isomerase (CHI), dihydroflavonol 4-reductase (DFR), anthocyanin synthase (ANS), UDP-glucosyltransferase (UGT) and MYB transcription factors). Recently, MdNAC42 was shown to share similar expression patterns in RF fruit with MdMYB10 and MdTTG1, and it interacts with MdMYB10 to participate in the regulation of anthocyanin synthesis in the RF apple Redlove®[8].

    Several transcription factor genes (e.g., MYB, WRKY, bHLH, NAC, ERF, bZIP and HSF) were reported to be differentially expressed during cold-induced morphological and physiological changes in 'Golden Delicious' apples[9]. A study by Zhang et al.[10] showed that ERF1B was capable of interacting with the promotors of anthocyanin and proanthocyanidin (PA) MYB transcription factors, and suggested that ethylene regulation and anthocyanin regulation might be linked in either direction. It was reported that ethylene signal transduction pathway genes or response genes, such as ERS (ethylene response sensor), EIN3 (ethylene-insensitive3) and ERFs (ethylene response factors), may play an important role in the regulatory network of PA biosynthesis[11].

    Espley et al.[12] observed no incidence of FBD in cold-stored fruit of 'Royal Gala', but over-expression of MdMYB10 in 'Royal Gala' resulted in a high rate of FBD in RF fruit, which was hypothesised to be caused by elevated fruit ethylene concentrations before harvest and more anthocyanin, chlorogenic acid (CGA) and pro-cyanidins in RF fruit. In addition, the MYB10 transcription factor was shown to elevate the expression levels of MdACS, MdACO, and MdERF106 ethylene-regulating genes[12]. To elucidate the mechanism regulating the FBD of RF apples, Zuo et al.[13] analysed the transcriptome of tree-ripe apples at 0, 0.5 and 4 h after cutting, and reported that the differentially expressed genes at different sampling points were mainly related to plant–pathogen interactions.

    GWAS is a powerful technique for mining novel functional variants. One of the limitations of GWAS, using SNP arrays, is that they require genotyping of large numbers of individuals, which may be expensive for large populations. DNA pooling-based designs (i.e., bulk segregant analysis) test differential allele distributions in pools of individuals that exhibit extreme phenotypes (XP) in bi-parental populations, large germplasm collections or random mating populations[1416]. In addition to reducing the number of samples to be genotyped, the use of whole genome sequencing (WGS)-based XP-GWAS has the potential to identify small-effect loci and rare alleles via extreme phenotypic selection.

    In this WGS-based XP-GWAS, we investigated the genetic basis of RF and FBD by sequencing the pools of individuals that exhibited extreme phenotypes for these two traits, and analysed the differences in allele frequencies between phenotypic classes. This method combines the simplicity of genotyping pools with superior mapping resolution. We also examined the transcriptome from transgenic apple fruit harbouring the R6:MYB10 promoter as a model for red flesh in apple. Differences in gene expression of a highly pigmented line were compared with expression in control fruit and these genes were then used for comparison with the seedling population. Understanding the genetic basis of the link between RF and FBD will help in design of strategies for selection against FBD in high-quality Type 1 RF apple cultivars.

    A snapshot of visual variation in FBD and WCI is presented in Fig. 1. The average WCI and FBD across all ~900 seedlings ranged from 0 to 7, and from 0% to 58%, respectively. Based on the MLM analysis, the estimated narrow-sense heritability (h2) of WCI and FBD was 0.57 (standard error = 0.18) and 0.09 (standard error = 0.05), respectively. The estimated genetic correlation between WCI and FBD was 0.58, and several fruit quality traits displayed unfavourable correlations with WCI (Supplemental Fig. S1). Seedlings with higher WCI scores were generally characterised by poor firmness and crispness, plus higher astringency and sourness. Estimated phenotypic and genetic correlations between all pairs of traits are listed in Supplemental Table S1.

    Figure 1.  Transverse cross-sections of apple slices showing range in (a) flesh colouration, and (b) flesh browning disorder for Type 1 red-fleshed apple. The weighted cortical intensity (WCI) scores (0−9 scale) and the proportion of the cortex area showing symptoms of flesh browning disorder are also displayed.

    A few seedlings had no red pigment in the cortex, but the average WCI score across all seedlings was 2.25. About two-thirds of the seedlings did not display any FBD symptoms, but among the remaining seedlings, FBD ranged between 1% and 58% (Fig. 2). The average WCI score for the 'low' and 'high' WCI pool was 0.45 and 5.2, respectively, while the average FBD was 0% and 20.6% for the 'low' and 'high' FBD pool, respectively (Supplemental Table S2). The average WCI score of the seedlings in the FBD pools was similar (Low: 5.5; High: 4.6), while the average FBD of the high- and low-WCI pools was 4.5% and 0.1%, respectively.

    Figure 2.  The distribution of weighted cortex intensity (WCI) scores (a) and the internal flesh browning disorder IFBD%; (b) in the population of ~900 apple seedlings. The green and red circles highlight the individuals used to form the 'low' and 'high' pools of samples.

    After filtering, about 204,000 SNPs were used and the average sequencing depth of SNP loci was similar for the two pools (42 vs 44). There was a near-perfect correlation between the Z-test statistics and G-statistics, so only the latter are discussed hereafter. A plot of the G' values, smoothed over 2 Mb windows, is shown for all 17 chromosomes (Chrs) in Supplemental Fig. S2. XP-GWAS identified genomic regions significantly associated with FBD on 12 out of the 17 Chrs (Fig. 3), and putative candidate genes within ±1.0 Mb distanceof the significant G' peaks were identified (Table 1). Additional genomic regions, which did not meet the significance threshold but displayed distinguished G' peaks, were also identified across all chromosomes (Supplemental Table S3).

    Figure 3.  G'-statistics across the linkage groups (LG) showing significant association with the flesh browning disorder (FBD) in apple The horizontal red lines indicate the significance threshold. The putative candidate genes (refer to Table 1) underpinning various G' peaks are also shown.
    Table 1.  A list of the genomic regions associated with internal flesh browning disorder (FBD) in apples. Putative candidate genes residing within these regions are also listed using GDDH13v1.1 reference genome assembly.
    ChrGenomic region (Mb)Putative genes functions
    221.9–23.5Ethylene-responsive element binding factor 13 (MdERF13: MD02G1213600);
    33.1–4.9cinnamate 4-hydroxylase (C4H) enzyme (MD03G1051100, MD03G1050900 and MD03G1051000); MdWRKY2: MD03G1044400; MdWRKY33 (MD03G1057400)
    38.2–9.6ascorbate peroxidase 1 (MdAPX1: MD03G1108200, MD03G1108300)
    314.7–16.6senescence-related MdNAC90 (MD03G1148500)
    336.5–37.5Ethylene response sensor 1 (MdERS1: MD03G1292200); flavonoid biosynthesis protein MdMYB12 (MD03G1297100); Heat shock protein DnaJ (MD03G1296600, MD03G1297000); pectin methylesterase (MdPME) inhibitor protein (MD03G1290800, MD03G1290900, MD03G1291000).
    411.0–13.0phenylalanine and lignin biosynthesis protein MdMYB85 (MD04G1080600)
    422.1–24.4MYB domain protein 1 (MD04G1142200); HSP20-like protein (MD04G1140600); UDP-glucosyltransferase (UGT) proteins UGT85A7 (MD04G1140700, MD04G1140900); UGT85A3 (MD04G1140800); UGT (MD04G1141000, MD04G1141300); UGT85A2 (MD04G1141400); UGT85A4 (MD04G1141500); DNAJ heat shock protein (MD04G1153800, MD04G1153900, MD04G1154100)
    427.6–29.6HCT/HQT regulatory genes MD04G1188000 and MD04G1188400
    629.8–31.7Volz et al. (2013) QTL for IFBD; anthocyanin regulatory proteins MdMYB86 (MD06G1167200); triterpene biosynthesis transcription factor MdMYB66 (MD06G1174200); Cytochrome P450 (MD06G1162600; MD06G1162700, MD06G1162800, MD06G1163100, MD06G1163300, MD06G1163400, MD06G1163500, MD06G1163600, MD06G1163800, MD06G1164000, MD06G1164100, MD06G1164300, MD06G1164400, MD06G1164500, MD06G1164700)
    713.9–15.9heat shock protein 70B (MD07G1116300)
    717.4–19.0Drought-stress WRKY DNA-binding proteins (MdWRKY56: MD07G1131000, MD07G1131400)
    723.6–25.2MdPAL2 (MD07G1172700); drought-stress gene NGA1 (MD07G1162400); DNAJ heat shock family protein (MD07G1162300, MD07G1162200), stress-response protein (MdNAC69: MD07G1163700, MD07G1164000)
    97.9–11.8MD09G1110500 involved in ascorbate oxidase (AO); MdUGT proteins (MD09G1141200, MD09G1141300, MD09G1141500, MD09G1141600, MD09G1141700, MD09G1141800, MD09G1142000, MD09G1142500, MD09G1142600, MD09G1142800, MD09G1142900, MD09G1143000, MD09G1143200, MD09G1143400) involved in flavonoids biosynthesis; heat shock proteins 89.1 (MD09G1122200) and HSP70 (MD09G1137300); Ethylene-forming enzyme MD09G1114800; Anthocyanin regulatory protein MdNAC42 (MD09G1147500, MD09G1147600)
    914.9–16.5triterpene biosynthesis transcription factor protein MdMYB66 (MD09G1183800);
    111.7–3.0ethylene response factor proteins (MdEIN-like 3: MD11G1022400)
    1138.6–40.6Senescence-related gene 1 (MD11G1271400, MD11G1272300, MD11G1272000, MD11G1272100, MD11G1272300, MD11G1272400, and MD11G1272500); Chalcone-flavanone isomerase (CHI) protein (MD11G1273600) and MdbHLH3 (MD11G1286900, MDP0000225680); cytochrome P450 enzyme (MD11G1274000, MD11G1274100, MD11G1274200, MD11G1274300, MD11G1274500, and MD11G1274600); heat shock transcription factor A6B (MdHSFA6B: MD11G1278900) – involved in ABA-mediated heat response and flavonoid biosynthesis.
    122.2–3.5heat shock protein 70-1 ((MD12G1025600, MD12G1025700 and MD12G1026300) and heat shock protein 70 (MD12G1025800 and MD12G1025900 and MD12G1026000); ethylene (MD12G1032000) and auxin-responsive (MD12G1027600) proteins.
    127.2–8.4DNAJ heat shock domain-containing protein (MD12G1065200 and MD12G1067400)
    1327.5–30.5MD13G1257800 involved in polyphenol 4-coumarate:CoA ligase (4CL)
    1337.5–39.5pectin methyl esterase inhibitor superfamily protein MdPMEI (MD13G1278600)
    1425.4–27.5Drought-stress response gene MdWRKY45 (MD14G1154500); chalcone synthase (CHS) family proteins (MD14G1160800 and MD14G1160900); triterpene biosynthesis transcription factor MdMYB66 (MD14G1180700, MD14G1181000, MD14G1180900); anthocyanin biosynthesis protein (MdMYB86: MD14G1172900); cytochrome P450 proteins (MD14G1169000, MD14G1169200, MD14G1169600, MD14G1169700)
    150–1.5Ethylene synthesis proteins (MD15G1020100, MD15G1020300 and MD15G1020500); dihydroflavonol reductase (DFR) gene (MD15G1024100)
    154.6–6.8MdMYB73 (MD15G1076600, MD15G1088000) modulates malate transportation/accumulation via interaction with MdMYB1/10; MdNAC52: MD15G1079400) regulates anthocyanin/PA; heat shock transcription factor B4 (MD15G1080700); stress-response protein MdWRKY7 (MD15G1078200)
    1553.5–54.9MdC3H (MD15G1436500) involved in chlorogenic acid biosynthesis; MdEIN3 (MD15G1441000) involved in regulating ethylene synthesis and anthocyanin accumulation
    168.9–10.9SAUR-like auxin-responsive protein (MD16G1124300) and MdNAC83: (MD16G1125800) associated with fruit ripening; MD16G1140800 regulates proanthocyanidin; MdPAE genes (MD16G1132100, MD16G1140500) regulates ethylene production.
     | Show Table
    DownLoad: CSV

    The ethylene-responsive factor 13 (MdERF13: MD02G1213600) resided within the significant region (21.9–23.5 Mb) on Chr2, while the ascorbate peroxidase 3 (MdAPX3: MD02G1127800, MD02G1132200) resided in the prominent region between 9.45 and 11.28 Mb) (Fig. 3, Table 1). There were several genomic regions showing association with FBD on Chr3. The first region (8.2–9.5 Mb) flanked MdAPX1 (MD03G1108200, MD03G1108300), while MdERF3 (MD03G1194300) and heat shock protein 70 (HSP70: MD03G1201800, D03G1201700) resided within the prominent peak region (25.5–27.5 Mb). Another significant region (36.5–37.5 Mb) at the bottom on Chr3 harboured ethylene response sensor 1 (MdERS1: MD03G1292200), a flavonoid-biosynthesis related protein MdMYB12 (MD03G1297100), HSP DnaJ and pectin methyl esterase (PME) inhibitor proteins (Fig. 3, Table 1).

    The significant G' region (27.6–29.6 Mb) on Chr4 flanked the genes MD04G1188000 and MD04G1188400 involved in the biosynthesis of hydroxycinnamoyl CoA shikimate/quinate hydroxycinnamoyl transferase (HCT/HQT), while the adjacent region (22.1–24.3 Mb) harboured a cluster of UDP-glucosyltransferase (UGT) proteins and HSP (Table 1). Another region between 11.0 and 13.0 Mb encompassed phenylalanine and lignin biosynthesis gene MYB85 (MD04G1080600)[17]. The only significant region associated with FBD on Chr6 spanned between 29.8 and 31.7 Mb, which included a SNP earlier reported associated with FBD[4]. This region also harboured several MYB proteins (MdMYB86: MD06G1167200; MdMYB98: MD06G1172900; MdMYB66: MD06G1174200) and a large cluster of cytochrome P450 proteins (Table 1).

    A significant FBD-associated region (13.9–15.9 Mb) on Chr7 encompassed the HSP 70B (MD07G1116300), while another significant region between 23.6 Mb and 25.2 Mb flanked the gene coding for phenylalanine ammonia lyase 2 (MdPAL2: MD07G1172700), a drought stress gene NGA1 (MD07G1162400), DNAJ HSP, and stress-response protein (MdNAC69: MD07G1163700, MD07G1164000) (Fig. 3, Table 1). A large significant region spanning between 7.9 and 11.8 Mb on Chr9 encompassed the gene MD09G1110500 putatively involved in ascorbate oxidase (AO), HSP (HSP70: MD09G1137300; HSP89.1: MD09G1122200), an ethylene-forming enzyme (MD09G1114800), and MdNAC42 (MD09G1147500, MD09G1147600). Another significant genomic region on Chr9 was between 14.9 and 16.5 Mb, which harbours the MYB domain protein MdMYB66 (MD09G1183800) (Table 1).

    A sharp G' peak region (1.7–3.0 Mb) on Chr11 associated with FBD encompassed ethylene insensitive 3 (MdEIN3: MD11G1022400) along with a cluster of UGT proteins, WD-40, and bHLHL proteins (Table 1). A significant region between 38.6 and 40.6 Mb at the bottom of Chr11 was dominated by clusters of senescence-related genes and cytochrome P450 enzymes. This genomic region also flanked a chalcone-flavanone isomerase (CHI) family protein (MD11G1273600) and a bHLH protein (MdbHLH3: MD11G1286900, MDP0000225680), along with the heat shock transcription factor A6B (HSFA6B: MD11G1278900) (Table 1, Supplemental Table S3).

    The region (2.2–3.3 Mb) associated with FBD on Chr12 flanked genes for the HSP 70 and 70-1, NAC proteins, ethylene and auxin-responsive proteins (Table 1). An adjacent significant region (7.2–8.4 Mb) flanked DNAJ HSP, along with bZIP, bHLH and WD-40 repeat-like proteins (Table 1; Supplemental Table S3). There was a large genomic region on Chr13 showing a significant association with FBD. In this region, the first G' peak (27.5–30.5 Mb) harboured MD13G1257800, which regulates polyphenol 4-coumarate: CoA ligase (4CL) synthesis. The second G' peak region (32.6–34.7 Mb) corresponded to an earlier mapped QTL for flesh browning in white-fleshed apples[18].

    The significant region (25.4–27.5 Mb) on Chr14 harboured various genes for proteins with different putative functions, such as AP2 proteins, WD-40 repeat family proteins, bHLH proteins, MdNAC83 (MD14G1150900), MdWRKY45 (MD14G1154500), chalcone synthase (CHS) family proteins (MD14G1160800 and MD14G1160900), cytochrome P450 proteins, and several MYB domain proteins (MdMYB86: MD14G1172900; MdMYB98: MD14G1179000; MdMYB66: MD14G1180700, MD14G1181000, MD14G1180900) (Fig. 3, Table 1, Supplemental Table S3). A sharp G' peak (15.2–17.2 Mb) on Chr14 did not meet the significance threshold corresponding to the FBD QTL in white-fleshed apples[18].

    The upper 1.5 Mb region on Chr15 associated with FBD encompassed several transcription factor families, including WD-40 repeats, bHLH, bZIP, ethylene synthesis proteins, and dihydroflavonol reductase (DFR) protein (MD15G1024100) (Fig. 3, Table 1; Supplemental Table S3). Another significant region on Chr15 (4.6−6.8 Mb) harboured HSF B4, MdMYB73 (which interacts with MdMYB1/10 to modulate malate transportation) and MdNAC52 (MD15G1079400), which regulates anthocyanin and PA synthesis by directly regulating MdLAR[19]. A significantly associated region at the bottom of Chr15 (53.5–54.9 Mb) harboured MdNAC35 (MD15G1444700), MdC3H (MD15G1436500) involved in the production of p-coumarate 3-hydroxylase (C3H) enzyme, which plays a role in chlorogenic acid biosynthesis, and MdEIN3 (MD15G1441000).

    The significant region between 8.9 and 10.9 Mb on Chr16 harboured a gene for SAUR-like auxin-responsive protein (MD16G1124300) and MdNAC83 (MD16G1125800), both of which have been reportedly associated with apple fruit ripening[20]. This region also encompassed MD16G1140800, which regulates PA[11], and a gene for the pectin acetyl esterase protein MdPAE10 (MD16G1132100) involved in ethylene production and shelf-life[21]. A sharp G' peak region (20.4–22.4 Mb) in the middle of Chr16 flanked MdERF1B (MD16G1216900) and MdMYB15 (MD16G1218000 and MD16G1218900), involved in altering anthocyanin and PA concentrations[10] (Fig. 3, Table 1, Supplemental Table S3).

    The average sequencing depth of the SNP loci (~160,000) retained for marker-trait association was similar for the two WCI pools (41 vs 44). The significant regions were located on Chrs 2, 4, 6, 7, 10, 15 and 16 (Fig. 4). The genomic intervals within ±1.0 Mb of the significant G' peaks, and the putative candidate genes within those intervals, are listed in Table 2. Additional genomic regions, which did not meet the significance threshold but displayed distinct G' peaks, were also identified across most chromosomes ( Supplemental Fig. S2, Supplemental Table S3). A significant region on Chr4 encompassed chalcone synthase (CHS) genes, along with an ERF (MD04G1009000) involved in regulating PA biosynthesis[11].

    Figure 4.  G’-statistics across the linkage groups (LG) showing significant association with the weighted cortex intensity (WCI) in apple. The horizontal red lines indicate the significance threshold. The putative candidate genes (refer to Table 2) underpinning various G' peaks are also shown.
    Table 2.  A list of the genomic regions significantly associated with the weighted cortex intensity (WCI) in apples. Putative candidate genes residing within these regions are also listed using GDDH13v1.1 reference genome assembly.
    ChrGenomic region (Mb)Putative genes functions
    211.2–13.2UDP-glucosyltransferase (UGT) proteins (MD02G1153000, MD02G1153100, MD02G1153200, MD02G1153300; MD02G1153400; MD02G1153500; MD02G1153700; MD02G1153800; MD02G1153900);
    40–1.2Chalcone synthase (CHS) genes (MD04G1003000; MD04G1003300 and MD04G1003400); DNAJ heat shock protein (MD04G1003500); MdERF (MD04G1009000) involved in regulating PA biosynthesis.
    69.5–11.0Ubiquitin protein (MD06G1061100); stress-response WRKY protein MdWRKY21 (MD06G1062800);
    612.1–13.6pectin methylesterase inhibitor superfamily protein (MdPME: MD06G1064700); phenylalanine and lignin biosynthesis gene (MdMYB85)
    616.0–17.6MD06G1071600 (MDP0000360447) involved in leucoanthocyanidin dioxygenase (LDOX) synthesis
    624.0–26.0UDP-glycosyltransferase proteins (MD06G1103300, MD06G1103400, MD06G1103500 and MD06G1103600); auxin response factor 9 (MdARF9: MD06G1111100) and heat shock protein 70 (Hsp 70; MD06G1113000).
    74.1–5.6Ethylene insensitive 3 protein (MdEIN3: MD07G1053500 and MD07G1053800) involved in proanthocyanidins (PA) biosynthesis; ubiquitin-specific protease (MD07G1051000, MD07G1051100, MD07G1051200, MD07G1051500, MD07G1051300, MD07G1051700 and MD07G1051800).
    1015.9–18.3bHLH proteins (MD10G1098900, MD10G1104300, and MD10G1104600); UGT protein (MD10G1101200); UGT 74D1 (MD10G1110800), UGT 74F1 (MD10G1111100), UGT 74F2 (MD10G1111000).
    1035.6–38.6Stress-response WRKY proteins (MdWRKY28: MD10G1266400; MdWRKY65: MD10G1275800). ethylene responsive factors (MdERF2: MD10G1286300; MdERF4: MD10G1290400, and MdERF12: MD10G1290900) and a NAC domain protein (MdNAC73: MD10G1288300); polyphenol oxidase (PPO) genes ((MD10G1298200; MD10G1298300; MD10G1298400; MD10G1298500; MD10G1298700; MD10G1299100; MD10G1299300; MD10G1299400).
    1524.8–26.8heat shock factor 4 (MD15G1283700), drought-stress response WRKY protein 7 (MdWRKY7: MD15G1287300), MdMYB73 (MD15G1288600) involved in ubiquitination and malate synthesis
    1531.7–34.2MYB domain protein 93 (MdMYB93: MD15G1323500) regulates flavonoids and suberin accumulation (Legay et al. 2016); ubiquitin -specific protease 3 (MD15G1318500),
    161.5–3.4MYB domain proteins (MD16G1029400) regulates anthocyanin; senescence-associated gene 12 (MD16G1031600); ethylene response factor proteins (MdERF118: MD16G1043500, and MD16G1047700 (MdRAV1); MdMYB62 ( MD16G1040800) flavonol regulation; malate transporter MdMa2 (MD16G1045000: MDP0000244249), Ubiquitin-like superfamily protein (MD16G1036000),
    165.4–7.4MdMYB88 (MD16G1076100) regulates phenylpropanoid synthesis and ABA-mediated anthocyanin biosynthesis; MdMYB66 (MD16G1093200) regulates triterpene biosynthesis, MdWRKY72 (MD16G1077700) mediates ultraviolet B-induced anthocyanin synthesis.
     | Show Table
    DownLoad: CSV

    There were distinct G' peaks within a large genomic region (spanning between 9.0 and 18.0 Mb) significantly associated with WCI on Chr6 (Fig. 4). The G' peak region 12.1–13.6 Mb encompassed MdMYB85 (MD06G1064300), and a gene for a pectin methyl esterase

    (PME) inhibitor protein (MD06G1064700); while the region between 16.0 and 17.6 Mb flanked the genes involved in leucoanthocyanidin dioxygenase (LDOX) synthesis (Table 2). The auxin response factor 9 (MdARF9: MD06G1111100) and the HSP70 (MD06G1113000) resided in the significant region between 24.0 and 26.0 Mb on Chr6 (Table 2).

    The genomic region (4.1–5.6 Mb) with significant association with WCI on Chr7 flanked MdEIN3 (MD07G1053500, MD07G1053800), which plays an important role in the regulatory network of PA biosynthesis[11]. A significant region (35.6–38.7 Mb) on Chr10 encompassed gene clusters for bHLH and WRKY proteins along with an ethylene repressor factor (MdERF2: MD10G1286300) (Fig. 4, Table 2; Supplemental Table S3). This region also harboured MdERF4 (MD10G1290400), MdERF12 (MD10G1290900) and NAC domain genes (MdNAC73: MD10G1288300), which have been reported to be associated with fruit ripening[20]. In addition, there was a cluster of polyphenol oxidase (PPO) genes residing in this region (Table 2).

    On Chr15, the significant WCI-associated region spanning between 31.7 Mb and 34.2 Mb encompassed several TF families, including MdMYB93 (MD15G1323500) (Fig. 4, Table 2, Supplemental Table S3). A distinguished G' peak region (24.9–26.9 Mb) on Chr15 harboured genes for WD-40 repeat-like proteins, bHLH proteins, redox responsive transcription factor 1 (MD15G1283200), cytochrome P450 proteins, HSF4 (MD15G1283700), and MdWRKY7 (MD15G1287300). The MdMYB73 (MD15G1288600) residing in this region has been shown to interact with MdMYB1/10 and regulates several functions, including cold-stress response, ubiquitination and malate synthesis[22, 23].

    The significant 1.5–3.4 Mb region on Chr16 flanked an anthocyanin repressor MYB protein (MD16G1029400), senescence-associated gene 12 (MD16G1031600), malate transporter MdMa2 (MD16G1045000: MDP0000244249), and two ethylene response factor genes (MdERF118: MD16G1043500; MdRAV1: MD16G1047700), which interact in retaining flesh firmness[24]. The MdMYB62 (MD16G1040800) gene residing in this region is phylogenetically linked to MdMYB8 (MD06G1217200), which plays a major role in flavonoid biosynthesis[25]. Another significant region (5.4–7.4 Mb) on Chr16 harboured several bHLH genes, including MdMYB88 (MD16G1076100) involved in phenylpropanoid synthesis resulting in drought resistance[26] and ABA-mediated anthocyanin production[27]. The MdMYB66 (MD16G1093200) gene, which is involved in triterpene biosynthesis, and the MdWRKY72 (MD16G1077700) gene involved in anthocyanin synthesis, were also present in this region (Table 2, Fig. 4).

    The genomic regions tagged by XP-GWAS were enriched for regulatory functions, and several of these have a paralog (Table 3). For example, paralogues for a trio of genes (MdMYB86, MdMYB98 and Cytochrome 450) resided in the FBD-associated genomic regions on Chr6 and Chr14. Several pairs of genes resided together in the FBD-associated paralog regions; for example, MdNAC90 and germin-like protein 10 on Chr3 and Chr11; WRKY55 and WRKY70 on Chr1 and Chr7; and ERF1 and ERF5 on Chr4 and Chr6. The ethylene response factor MdERF1B had a paralog in the FBD-associated region on Chr13 and Chr16. Interestingly, three copies of MdNAC83 (Chrs 14, 16 17) and four copies of MdMYB66 (Chrs 4, 6, 9 and 14) resided in the FBD-associated regions. A pair of genes (RAV1 and MYB62) resided together in the WCI-associated paralog regions on Chrs13 and 16 (Table 3).

    Table 3.  A list of homologues genes/genomic regions associated with the internal flesh browning disorder (IFBD) and red flesh (WCI) in apples. Putative candidate genes residing within these regions are also listed using GDDH13v1.1 reference genome assembly.
    TraitChr (genomic region: Mb)Gene namePredicted gene IDPutative function
    IFBDChr6 (29.8–31.7 Mb)MdMYB66MD06G1174200Suberin/triterpene deposition
    IFBDChr14 (25.4–27.5 Mb)MdMYB66MD14G1180700, MD14G1181000, MD14G1180900Suberin/triterpene deposition
    IFBDChr4 (7.0–8.1 Mb)MdMYB66MD04G1060200Suberin/triterpene deposition
    IFBDChr9 (14.9–16.5 Mb)MdMYB66MD09G1183800Suberin/triterpene deposition
    IFBDChr6 (29.8–31.7 Mb)MdMYB86MD06G1167200Anthocyanin regulation
    IFBDChr14 (25.4–27.5 Mb)MdMYB86MD14G1172900Anthocyanin regulation
    IFBDChr6 (29.8–31.7 Mb)MdMYB98MD06G1172900Drought stress response
    IFBDChr14 (25.4–27.5 Mb)MdMYB98MD14G1179000Drought stress response
    IFBDChr6 (29.8–31.7 Mb)Cytochrome P450MD06G1162600, MD06G1162700, MD06G1162800, MD06G1163100, MD06G1163300, MD06G1163400, MD06G1163500, MD06G1163600, MD06G1163800, MD06G1164000, MD06G1164100, MD06G1164300, MD06G1164400, MD06G1164500, MD06G1164700Flavonoid and triterpenic metabolism
    IFBDChr14 (25.4–27.5 Mb)Cytochrome P450MD14G1169000, MD14G1169200, MD14G1169600, MD14G1169700Flavonoid and triterpenic metabolism
    IFBDChr3 (14.7–16.6 Mb)MdNAC90MD03G1148500Senescence-related
    IFBDChr11 (16.5–18.5 Mb)MdNAC90MD11G11679000Senescence-related
    IFBDChr14 (25.4–27.5 Mb)MdNAC83MD14G1150900Senescence/ripening-related
    IFBDChr16 (8.9–10.9 Mb)MdNAC83MD16G1125800Senescence/ripening-related
    IFBDChr17 (0–0. 7 Mb)MdNAC83MD17G1010300Senescence/ripening-related
    IFBDChr3 (14.7–16.6 Mb)Germin-like protein 10MD03G1148000Polyphenol oxidase
    IFBDChr11 (16.5–18.5 Mb)Germin-like protein 10MD11G1167000, MD11G1167100, MD11G1167400, MD11G1169200Polyphenol oxidase
    IFBDChr1 (26.9–28.5 Mb)MdWRKY55MD01G1168500Drought stress response
    IFBDChr7 (30.3–31.9 Mb)MdWRKY55MD07G1234600Drought stress response
    IFBDChr1 (26.9–28.5 Mb)MdWRKY70MD01G1168600Drought stress response
    IFBDChr7 (30.3–31.9 Mb)MdWRKY70MD07G1234700Drought stress response
    IFBDChr4 (7.0–8.1 Mb)MdERF1MD04G1058000Ethylene responsive factor
    IFBDChr6 (5.5–7.3 Mb)MdERF1MD06G1051800Ethylene responsive factor
    IFBDChr4 (7.0–8.1 Mb)MdERF5MD04G1058200Ethylene responsive factor
    IFBDChr6 (5.5–7.3 Mb)MdERF5MD06G1051900Ethylene responsive factor
    IFBDChr13 (18.0–20.0 Mb)MdERF1BMD13G1213100Ethylene response factor 1
    IFBDChr16 (20.4–22.4 Mb)MdERF1BMD16G1216900Ethylene response factor 1
    WCIChr13 (2.6–4.4 Mb)MdRAV1MD13G1046100Ethylene responsive factor
    WCIChr16 (1.5–3.4 Mb)MdRAV1MD16G1047700Ethylene responsive factor
    WCIChr13 (2.6–4.4 Mb)MdMYB62MD13G1039900Flavonol biosynthesis
    WCIChr16 (1.5–3.4 Mb)MdMYB62MD16G1040800Flavonol biosynthesis
    IFBDChr9 (7.9–11.8 Mb)MdNAC42MD09G1147500, MD09G1147600Anthocyanin accumulation
    WCIChr17 (11.4–12.4 Mb)MdNAC42MD17G1134400Anthocyanin accumulation
    IFBDChr9 (7.9–11.8 Mb)HSP 70MD09G1137300Heat stress response
    WCIChr17 (11.4–12.4 Mb)HSP 70MD17G1127600Heat stress response
    IFBDChr4 (11.0–13.0 Mb)MdMYB85MD04G1080600Phenylalanine and lignin biosynthesis
    WCIChr6 (12.1–13.6 Mb)MdMYB85MD06G1064300Phenylalanine and lignin biosynthesis
    IFBDChr15 (13.2–14.2 Mb)MdEBF1MD15G1171800Ethylene inhibition
    WCIChr8 (15.2–17.2 Mb)MdEBF1MD08G1150200Ethylene inhibition
    IFBDChr15 (53.5–54.9 Mb)MdEIN3MD15G1441000Ethylene insensitive 3 protein
    WCIChr8 (30.3–31.6 Mb)MdEIN3MD08G1245800Ethylene insensitive 3 protein
    IFBDChr11 (1.7–3.0 Mb)MdEIN3MD11G1022400Ethylene insensitive 3 protein
    WCIChr7 (4.1–5.6 Mb)MdEIN3MD07G1053500, MD07G1053800Ethylene insensitive 3 protein
    IFBDChr15 (4.6–6.8 Mb)MdMYB73MD15G1076600, MD15G1088000Cold-stress response & malate accumulation
    WCIChr15 (24.8–26.8 Mb)MdMYB73MD15G1288600Cold-stress response & malate accumulation
    IFBDChr15 (4.6–6.8M b)MdWRKY7MD15G1078200Anthocyanin accumulation
    WCIChr15 (24.8–26.8 Mb)MdWRKY7MD15G1287300Anthocyanin accumulation
    IFBDChr15 (43.5–45.5 Mb)MdMYB93MD15G1369700Flavonoid & suberin accumulation
    WCIChr15 (31.7–34.2 Mb)MdMYB93MD15G1323500Flavonoid & suberin accumulation
     | Show Table
    DownLoad: CSV

    Paralogs of several regulatory functions were also found in the regions associated with either FBD or WCI; for example, a significant region (7.9–11.8 Mb) harbouring a gene trio (MdNAC42, HSP70 and HSP89.1) on Chr9 was associated with FBD, but the paralogs of this trio also resided in a distinct G' region associated with WCI on Chr17 (Table 3, Supplemental Table S3). Some other examples included MdMYB85 (Chr4 for FBD, and Chr6 for WCI), MdEBF1 (Chr8 for WCI, and Chr15 for FBD), MdEIN3 (Chr8 for WCI, and Chr15 for FBD), and EIN3 (Chr7 for WCI, and Chr11 for FBD). A pair of genes (MdMYB73 and MdWRKY7) resided together in the separate regions associated with FBD (4.6–6.8 Mb) and WCI (24.8–26.8 Mb) within Chr15 (Table 3).

    The red pigmentation in fruit flesh differed amongst transgenic lines, with fruit from line A10 presenting the most deeply pigmented tissues (Supplemental Fig. S3), while those from lines A2 and A4 were similar in having a lower intensity of pigmentation. No pigmentation was observed in the flesh of control 'Royal Gala' (RG) fruit. RNAseq analysis of a representative transgenic line (A2) compared with RG revealed that a total of 1,379 genes were differentially expressed (log 2-fold), with 658 genes upregulated and 721 genes downregulated. This list was then assessed for commonality with the genomic regions and candidate genes from the XP-GWAS.

    Genes that contained mis-sense SNPs (which would result in a change in predicted protein) and that were also differentially expressed between A2 red-fleshed transgenic line and white-fleshed 'Royal Gala' (control) apples included anthocyanin-related flavanone 3-hydroxylase, chalcone synthase and dihydroflavonol 4-reductase (Table 2 & 4). Many more upstream DNA variants (e.g. in potential promoter-controlling elements) were seen in this group of differentially expressed genes (DEGs) that were also in regions underlying WCI or FBD. Genes encoding enzymes that may be involved in FBD, such as a Rho GTPase activating protein, peroxidase, lipoxygenase 1, and ethylene-forming enzyme (ACO4), were DEGs and showed mis-sense SNPs, including a potential stop codon in the Rho GTPase-activating protein (Table 4). This intersection between DNA change and differential expression warrants further research to evaluate the functions of these genes.

    Table 4.  List of candidate genes associated with WCI or FBD in the XP-GWA and R6:MdMYB10 apple datasets.
    Mutations in GWAS apple populationPredicted gene functionExpression in R6 and ‘Royal Gala’ apples
    GeneMissense
    SNPs
    SNP
    Stop
    Upstream
    variants
    DatasetLocusAnnotation and TAIR IDAverage
    RPKM
    R6 flesh
    Average RPKM
    WT flesh
    log2Fold
    Change
    MD02G11322001FBD Supplemental Table S3Chr02:9450615-11289014flavanone 3-hydroxylase
    (F3H, TT6, F3'H) AT3G51240
    387752.47
    MD02G11336003FBD Supplemental Table S3Chr02:9450615-11289014fatty acid desaturase 5
    (FAD5) AT3G15850
    18109.98
    MD02G11537001WCI Table 2Chr02:11278254-13234556UDP-Glycosyltransferase, lignin related AT2G1856010385341.03
    MD03G10592002FBD Supplemental Table S3Chr03:3177994-4910866Peroxidase AT5G053402514.21
    MD03G1143300422FBD Table 1Chr03:14797661-16611554bZIP transcription factor (DPBF2, AtbZIP67) AT3G44460114852-2.80
    MD03G1147700121FBD Table 1Chr03:14797661-16611554Rho GTPase activating protein AT5G22400205891.29
    MD04G1003400331WCI Table 2Chr04:1-1284894Chalcone synthase (CHS, TT4) AT5G1393014433122.34
    MD04G120410063FBD Table 1Chr04:27629536-29612282lipoxygenase 1 (LOX1, ATLOX1) AT1G550205462681.09
    MD06G1160700129FBD Table 1Chr06:29862341-31737341peptide met sulfoxide reductase AT4G251302121254562.04
    MD06G116140014FBD Table 1Chr06:29862341-31737341Pectin lyase-like protein AT5G63180614129530-2.22
    MD07G1240700126FBD Supplemental Table S3Chr07:30357332-31979025Fe superoxide dismutase 2 AT5G511001051826-3.99
    MD07G13069006FBD Supplemental Table S3Chr07:34607570-36531467UDP-glucosyl transferase 78D2 AT5G170506771112.78
    MD08G12491002WCI Supplemental Table S3Chr08:30486569-31607516HSP20-like chaperone (ATHSP22.0) AT4G102503186456.12
    MD09G111400032FBD Table 1Chr09:7999212-11883202fatty acid desaturase 5 (FAD5) AT3G158507608.68
    MD09G11468001FBD Table 1Chr09:7999212-11883202PHYTOENE SYNTHASE (PSY) AT5G1723038456160901.32
    MD10G132810045FBD Supplemental Table S3Chr10:40235258-41736791ethylene-forming enzyme (ACO4) AT1G050108769033910331.21
    MD15G10236001FBD Table 1Chr15:1-1487288jasmonic acid carboxyl methyltransferase (JMT) AT1G19640472111552.07
    MD15G10241008FBD Table 1Chr15:1-1487288dihydroflavonol 4-reductase (DFR, TT3, M318) AT5G428008723091.63
    MD17G11334004WCI Supplemental Table S3Chr17:11422073-12433463PHYTOENE SYNTHASE (PSY) AT5G172306001721.87
    MD17G12606002FBD Supplemental Table S3Chr17:31098955-32776972dehydroascorbate reductase 1 (DHAR3) AT5G167101867−1.78
     | Show Table
    DownLoad: CSV

    Several gene families (e.g. chalcone synthase, UGT, anthocyanin synthase, HSP, PAL, ERF, WRKY proteins, ABA, and bZIP transcription factors) residing in WCI-associated genomic regions have been reported to be associated with RF in apple[7, 12, 28]. Several of these genes are implicated in stress responses, suggesting that flavonoids and anthocyanin biosynthesis could also be associated with stress (e.g., drought, water loss) tolerance of RF apples[7].

    MdMYB73, which may play a role in the cold-stress response[23, 29], resided in the WCI-associated regions. Ethylene is among the various modulators of environmental stresses induced by factors such as drought and cold temperatures[9, 28]. Several ERF proteins (e.g. MdERF1B, MdERF3) interact with the promoters of MYB domain proteins to regulate anthocyanin and proanthocyanidin (PA) accumulation in apple[10, 11, 30]. The WCI-associated genomic regions in our study flanked several ERFs previously reported to have roles in anthocyanin and PA regulation. MdERF4 (MD10G1290400), one of the three ERFs residing in the WCI-associated region on Chr10, has high phylogenetic similarity with MdERF38, which interacts with MdMYB1 to regulate drought-related anthocyanin biosynthesis[31]. Some ERFs (e.g. MdERF2: MD10G1286300; MdERF4: MD10G1290400, and MdERF12: MD10G1290900) and MdNAC73 residing in the WCI-associated regions have been reported to be associated with fruit maturation[20] – suggesting an interaction between ethylene production and RF colour[12].

    The WCI-associated region on Chr15 included a gene MdMYB73 (MD15G1288600) involved in malate acid synthesis. Previous studies have reported that MdMYB1 regulates both anthocyanin and malate accumulation, and perhaps MdBT2 regulates MdMYB73-mediated anthocyanin accumulation[22, 23]. The malate transporter gene MdMa2 and the MdMYB7 gene, involved in the regulation of anthocyanin and flavanols in RF apple[32], resided together in the WCI-associated upper region of LG16. Taken together, these results support the hypothesis that there is interplay between anthocyanin and malate accumulation in the RF apple. There was a cluster of ubiquitin-specific proteases underpinning the WCI-associated regions on Chrs 7 and 15, which is supported by earlier reports suggesting that ubiquitin-specific proteases respond to auxin and might suppress anthocyanin biosynthesis proteins[33]. The auxin response factor 9 (MdARF9: MD06G1111100), which has also been shown to suppress anthocyanin biosynthesis in RF callus samples[33], also resided in the WCI-associated genomic region on LG7.

    Seedlings in both the low- and high-FBD pools carried the MdMYB10 gene, which suggests that MdMYB10 itself is not the causal factor of FBD in RF apples. Long-term cold storage generally results in senescence-related flesh breakdown, and several transcription factor genes (e.g. MYB, WRKY, NAC, ERF, cytochrome P450, and HSP) have been shown to express differentially during long-term cold storage[9]. The FBD-associated genomic regions in our study harboured several ERFs, suggesting that ethylene synthesis proteins may be contributing to cell wall disassembly, allowing PPO enzymes to come into contact with phenolic compounds and potentially leading to FBD symptoms[18].

    Pectin methyl esterase (PME) genes resided in the FBD-associated significant regions on Chrs 3, 13 and 17. Volatile generation and senescence degradation have been suggested to be bio-markers of FBD, and the expression levels of methyl esters were found to be associated with FBD and senescence in 'Fuji' apples after cold storage[34]. The MdPME2 gene has also been reported to be associated with apple flesh firmness and mealiness[21, 35]. The co-location of genes encoding cell wall-degrading enzymes (MdPME) and QTLs for FBD has been reported in apple[18, 36].

    The clusters of cytochrome P450 enzymes and senescence-related genes resided in some of the FBD-associated regions in this study. There are no earlier reports of the involvement of P450 enzymes in apple FBD expression, but some genes related to cytochrome P450 were found to be upregulated during litchi fruit senescence[37]. Pericarp browning in litchi is mainly attributable to the degradation of anthocyanin, and the ABA-initiated oxidation of phenolic compounds by PPO[37]. Flavonoids are among the major polyphenols in RF apples[5], and cytochrome P450 is part of the regulatory mechanism for flavonoid metabolism[38]. Association of FBD with the genomic region harbouring P450 would suggest its role in enhanced polyphenol synthesis causing FBD. The co-occurrence of a senescence-related gene MdNAC90 (MD03G1148500; MD11G11679000) and the PPO regulator germin-like proteins (in the FBD-associated paralog regions on Chrs 3 and 11) lends support to an interplay between senescence and oxidation of phenolics and anthocyanins.

    A significant region on Chr9 encompassed a cluster of UGT proteins, which play a role in the regulation of flavonoids and phenolic compounds, as well as converting phloretin to phloridzin[39]. Cytochrome P450, which resided within several FBD-associated regions, is reportedly involved in flavonoid metabolism, such as chlorogenic acid (CGA) acid and phloridzin, which have also been positively associated with suberin production and cell wall disassembly[40, 41].

    Reactive oxygen species (ROS) play an important role in regulating physiological processes in plants, such as senescence[37]. Legay et al.[42] suggested that MdMYB93 (MD15G1369700), found residing in the FBD-associated regions in this study, plays a critical role in remobilisation of flavonoid/phenolic compounds, which can be utilised for detoxification of ROS in the case of oxidative stress. However, flavonoid biosynthesis has also been linked with suberin production causing cuticle cracks in apples[42, 43], and the development of cuticular cracks could accelerate flesh browning as a result of an enhanced oxidative process[44].

    Several HSP (e.g. HSP70, HSP70-1, HSP60, HSP89.1, and HSP DNAJ) and HSF (e.g. HSF4, HSFB4, HSFA6B) resided in the FBD-associated genomic regions. Ferguson et al.[45] showed that, during summer, apple flesh temperature could reach as high as 43 °C, and that an increase in the expression of HSP in apples was associated with high daily flesh temperatures, suggesting a role of HSP to counter heat stress. HSPs have been reported to interact with AP2/ERFs and to play a role in flavonoid biosynthesis and drought tolerance in apple[46]. Heat stress affects lignin accumulation and its substrate, O-phenols, and has been reported to play role in enzymatic browning[47]. Additionally, HSF that regulate HSP expression have also been reported to be regulated by cold stress to generate heat-induced cold tolerance in banana[48]. HSF1 was shown to transcriptionally regulate the promoters of HSP to enhance chilling tolerance in loquat fruit[49]. Activity of the enzymes (PAL, C4H, 4CL) of the phenylpropanoid pathway was positively correlated with loquat fruit lignification, whilst suppression of their expression by heat shock treatment and low-temperature conditioning significantly reduced fruit lignification[50].

    Wang et al.[7] showed that ascorbate peroxidase (APX) was among the genes that were upregulated in RF apple compared with in white-fleshed apples. Several genes (e.g. MdAPX1, MdAPX3, MdAPX4, and MdDHAR1) involved in ascorbate synthesis resided in the genomic regions associated with FBD. Co-localisation of MdDHAR and ascorbic acid (AsA) synthesis genes in the FBD-linked genomic regions have been reported[51], suggesting that the low AsA content increases fruit susceptibility to FBD[52]. It has been shown that the expression of MdMYB1 and MdDHAR genes was strongly correlated in RF apples, and that AO and APX were upregulated by anthocyanin regulatory genes[31].

    There were several genes associated with CGA biosynthesis residing in the FBD-associated regions on various linkage groups, including the genes MYB19 (MD07G1268000) and MdC3H (MD15G1436500). Higher concentrations of CGA were reported in transgenic apple lines carrying MdMYB10[12], suggesting a role of CGA metabolism in the expression of FBD[53]. Interestingly, some of the FBD-associated regions (e.g. Chrs 9, 11, 13, 14 and 17) reported here in RF apples coincide with those reported earlier for FBD in white-fleshed apples[18, 36, 53], suggesting some common underlying genetic mechanisms.

    As discussed above, ERFs have been reported to be involved in the accumulation of anthocyanin and PA biosynthesis, while ethylene synthesis proteins also contribute to cell membrane breakdown, allowing the PPO enzyme to come into contact with phenolic compounds, potentially leading to FBD symptoms[12, 18]. We observed clusters of anthocyanin biosynthesis proteins (bHLH), ERFs (MdERF2, MdERF4, MdERF12) and PPO genes together in the genomic region associated with WCI on Chr10. The co-occurrence of these gene families perhaps facilitates potential interactions that contribute to the genetic correlation between WCI and FBD. We noted that genes involved in flavonoid regulation and ethylene synthesis occurred together in the FBD-associated regions on several chromosomes (e.g. MD16G1140800 and MdPAE10: MD16G1132100; MdERF1B: MD16G1216900 and MdMYB15: MD16G1218000, MD16G1218900) – suggesting these genes could be in linkage disequilibrium and this would contribute to the expression of WCI and FBD.

    MYB7 (MD16G1029400) resided in the WCI-associated upper region of Chr16, and the expression level of MYB7 was shown to be correlated with that of LAR1 in peach fruit[54]. The MdLAR1 protein (MDP0000376284), which is located about 1.2 Mb upstream of MYB7 (MD16G1029400), was reported to be associated with WCI and FBD in apple[3]. Mellidou et al.[36] reported that 4CL (MD13G1257800 in the FBD-linked region on Chr13), which catalyses the last step of the phenylpropanoid pathway, leading either to lignin or to flavonoids, was upregulated in browning-affected flesh tissues. The gene MdMYB85, involved in the regulation of flavonoid and lignin biosynthesis, resided in the WCI-associated region on Chr6 and FBD-associated paralogous region on Chr4. Metabolic interactions between anthocyanin and lignin biosynthesis have been reported for apple[55] and strawberry[56], while flesh lignification and internal browning during low-temperature storage in a red-fleshed loquat cultivar was shown to be modulated by the interplay between ERF39 and MYB8[57].

    The co-localisation of MdMYB66 and cytochrome P450 proteins, along with the anthocyanin regulatory protein MdMYB86, in paralogous FBD-associated genomic regions on Chr6 and Chr14 suggests that these genes interact as a 'hub' contributing to the WCI-FBD genetic link. The paralogs of some other genes were found to be residing in the regions associated with either WCI or FBD. For example, MdNAC42 and HSP70 co-localised in the FBD-associated region on Chr9, but this same pair of genes also resided in the most prominent region associated with WCI on Chr17. Similarly, paralogs of MdEIN3 resided in the WCI-associated region on Chr7 (MD07G1053500, MD07G1053800) and FBD-associated region on Chr11 (MD11G1022400). Interestingly, the paralogs of MdMYB73 and MdWRKY7 co-localised in the WCI- (24.6–26.8 Mb) and FBD-associated (4.6–6.8 Mb) regions on Chr15. The WCI-associated region at the bottom of Chr11 hosted a cluster of senescence-related genes, along with the anthocyanin biosynthesis gene MdbHLH3 (MD11G1286900), suggesting they might interact in the genetic nexus between FBD and WCI.

    FBD in RF apples can be caused by senescence, injury via extreme temperature exposure (chilling or heat), or enzymatic (cut fruit) reaction. Genes reported to be connected to all three factors were located in various FBD-associated genomic regions in this study. Postharvest strategies that both delay senescence and limit exposure to low temperatures may be needed to manage FBD. We also hypothesise that high ascorbic acid content could help to minimise expression of FBD in Type-1 RF cultivars. The adverse genetic correlation between WCI and FBD appears to arise from dual and/or interactive roles of several transcription factors, which would pose challenges for designing a conventional marker-assisted selection strategy. The use of bivariate genomic BLUP to estimate breeding values to simultaneously improve adversely correlated polygenic traits (e.g. WCI and FBD), could be an alternative approach[58, 59].

    A population of 900 apple seedlings composed of 24 full-sib families was generated in 2011 by selected crossings between six red-leaved pollen parents and six white-fleshed female parents. All six pollen parents inherited their red-leaf phenotype from the same great-grandparent 'Redfield'[1]. Each pollen parent was involved in four crosses, and the female parents were involved in three to six crosses each. Foliage colour of young seedlings is a phenotypic marker for Type 1 RF apple. The main purpose of this trial was to understand the flesh colour variation and FBD in the Type 1 RF seedlings, so only the seedlings with red foliage (i.e. carrying MdMYB10) were kept for this trial. The number of seedlings per family varied from 10 to 95. The seedlings were grafted onto 'M9' rootstock and were planted in duplicate at the Plant & Food Research orchard in Hawke's Bay, New Zealand (39°39′ S, 176°53′ E) in 2015.

    Phenotyping for RF and FBD was conducted over two consecutive fruiting seasons (2017 and 2018). Fruit were harvested once, when judged mature, based on a change in skin background colour from green to yellow, and when the starch pattern index (SPI) was between 1.0 and 2.0 (on a scale of 0 to 7). In each season, six fruit were harvested from each plant and stored for 70 d at 0.5 °C, followed by 7 d at 20 °C before fruit evaluation. Fruit were cut in half across the equator and the proportion of the cortex area (PRA) that was red in colour, and the intensity of the red colour (RI) (= 1 (low) to 9 (high)) was scored. A weighted cortical intensity (WCI) was then calculated (PRA × RI) as an estimation of the amount of red pigment in the fruit. The proportion of the cortex area showing symptoms of FBD was also recorded. WCI and FBD were averaged over all fruit for a particular seedling. Fruit were also assessed for the following eating quality traits on a 1 (lowest) to 9 (highest) scale: firmness, crispness, juiciness, sweetness, sourness and astringency, to understand the genetic correlations of eating-quality traits with WCI and FBD.

    The binary vector pSA277-R6:MYB10 was transferred into Agrobacterium tumefaciens strain LAB4404 by electroporation. Transgenic 'Royal Gala' plants were generated by Agrobacterium-mediated transformation of leaf pieces, using a method previously reported[5]. Wild-type 'Royal Gala' and three independent transgenic lines (A2, A4 and A10) of R6:MdMYB10 were grown under glasshouse conditions in full potting mix with natural light. The resulting fruit were assessed for flesh colour phenotypes at harvest (around 135 d after full bloom). Fruit peel and cortex from three biological replicates were collected and frozen in liquid nitrogen, with each replicate compiled from five pooled mature fruit for each transgenic line or wild-type control.

    Total RNA of 36 samples (3 R6:MYB10 lines and 1 wild type control, 3 time points, 3 biological replicates) was extracted, using Spectrum Plant Total RNA Kit (SIGMA). Removal of genomic DNA contamination and first-strand cDNA synthesis were carried out using the mixture of oligo (dT) and random primers according to the manufacturer's instructions (QuantiTect Reverse Transcription Kit, Qiagen). Real-time qPCR DNA amplification and analysis was carried out using the LightCycler 480 Real-Time PCR System (Roche), with LightCycler 480 software version 1.5. The LightCycler 480 SYBR Green I Master Mix (Roche) was used following the manufacturer's method. The qPCR conditions were 5 min at 95 °C, followed by 45 cycles of 5 s at 95 °C, 5 s at 60°C, and 10 s at 72 °C, followed by 65 °C to 95 °C melting curve detection. The qPCR efficiency of each gene was obtained by analyzing the standard curve of a cDNA serial dilution of that gene. The expression was normalized to Malus × domestica elongation factor 1-alpha MdEF1α (XM_008367439) due to its consistent transcript levels throughout samples, with crossing threshold values changing by less than 2.

    Individual fruit measurements were first averaged for each seedling. As the phenotyping was repeated over two years, we used a mixed linear model (MLM) accounting for this 'permanent environmental effect', as previously described[58]. Pedigree-based additive genetic relationships among seedlings were taken into account for estimation of genetic parameters using ASReml software[60]. Product-moment correlations between best linear unbiased predictions (BLUP) of breeding values of all seedlings for different traits were used as estimates of genetic correlation among traits.

    A selective DNA pooling procedure was adopted to construct DNA pools. A high-pool and a low-pool were constructed separately for the two traits (WCI and FBD). Genomic DNA was extracted from the leaves of selected seedlings, and quantified by fluorimetry using the picogreen reagent (Cat#P11496, Thermo). The low and high pools consisted of 35 seedlings each, and normalised amounts (~300 ng) of DNA from individuals were pooled. The pools were dried down with DNA Stable reagent (Cat#93021001, Biomatrica) in a centrifugal evaporator and shipped for sequencing. Each DNA pool was sequenced using paired-end 125 bp reads on the Illumina HiSeq 2500 platform. The quality of raw sequence reads was checked with FastQC/0.11.2 and MultiQC/1.2. Based on the quality control reports, the reads were aligned to the published apple reference genome GDDH13 v1.1[61] using the program bowtie2/2.3.4.3[62] with trimming from both ends before alignments and aligning in full read length ("-5 6 -3 5 –end-to-end"). The mapping results were marked for duplicate alignments, sorted, compressed and indexed with samtools/1.12[63]. Based on the alignment of binary alignment map (BAM) files of the high and low pools, single nucleotide polymorphism (SNP) identification was performed using samtools/1.12 ('samtools mpileup') and bcftools/1.12 ('bcftools call –mv')[63, 64]. Variant sites with missing genotype in any of the pools, or having the same genotype between the pools, were discarded. To minimise the influence of sequencing quality on association analysis, the identified SNPs were further filtered according to the following criteria: 1) a Phred-scaled quality score > 20; and 2) the read depth in each pool was neither < 35, nor > 500.

    The allele frequencies between each pair of bulk DNAs (low versus high WCI; low versus high FBD) were compared at each SNP locus. Differences in the allele frequencies between the low and high pool were expected to be negligible for unlinked SNP markers, but allele frequency differences would be larger for SNPs closely linked to the underlying quantitative trait loci (QTLs) contributing to the extreme phenotypes. A nonparametric test (G-statistic = 2 × Σni ln(ni/nexp), where ni (i = 1 to 4) represented counts of reference and alternate alleles at a particular SNP generated from sequencing of the low and high pool, and nexp was the expected allele count assuming no allele frequency divergence between the two DNA pools[65].

    We then calculated a modified statistic (G'), which took into account read count variation caused by sampling of segregants as well as variability inherent in short-read sequencing of pooled samples[65]. Using R package QTLseqr[66], firstly a G-statistic was calculated for each SNP marker, and then a weighted average using Nadaraya-Watson kernel was obtained to yield a G' statistic for a sliding genomic window of 2 Mb size. The Nadaraya-Watson method weights neighbouring markers' G-values by their distance from the focal SNP so that closer SNPs receive higher weights. The 95th percentile value of G' was used as a threshold to identify significant hotspots and to identify the putative candidate genes residing within the ±1 Mb region around the G' peak. For comparison purposes, a standard two-sided Z-test[14] was also performed to determine the significance of allele frequency differences at SNP loci between the pools for each trait.

    The GDDH gene models intersecting with the XP-GWA hotspots were pulled out with bedtools/2.30.0 ("bedtools intersect -wo -nonamecheck"). The selected genes were further blasted to TAIR10 ("-evalue 1e-5") and the annotated functions from Arabidopsis genes with the best blast score, the highest % identity, and the longest aligned length, were used. Then the expressions of genes located in the GWA hotspots were extracted from the RNAseq analysis of the R6:MdMYB10 representative transgenic line, and the log 2-fold change between the R6:MdMYB10 and 'Royal Gala' apples were calculated.

    This research was funded in 2017/18 by the Strategic Science Investment Fund of the New Zealand Ministry of Business, Innovation and Employment (MBIE) and from 2019 by the Plant & Food Research Technology Development – Pipfruit programme. We thank our colleague Jason Johnston for providing some pictures of the flesh browning disorder in red-fleshed apples. Richard Volz and Jason Johnston provided constructive comments and suggestions on the manuscript.

  • The authors declare that they have no conflict of interest.

  • Supplemental Table S1 Sequences of primers used in quantitative real-time RT-qPCR.
  • [1]

    Kan C, Gao Y, Wan C, Chen M, Zhao X, et al. 2019. Influence of different cold storage times on quality of "Cuiguan" pear fruits during shelf life. Journal of Food Processing and Preservation 43:e14245

    doi: 10.1111/jfpp.14245

    CrossRef   Google Scholar

    [2]

    Sun C, Fu D, Lu H, Zhang J, Zheng X, et al. 2018. Autoclaved yeast enhances the resistance against Penicillium expansum in postharvest pear fruit and its possible mechanisms of action. Biological Control 119:51−58

    doi: 10.1016/j.biocontrol.2018.01.010

    CrossRef   Google Scholar

    [3]

    Puel O, Galtier P, Oswald IP. 2010. Biosynthesis and toxicological effects of patulin. Toxins 2:613−31

    doi: 10.3390/toxins2040613

    CrossRef   Google Scholar

    [4]

    Li B, Chen Y, Zhang Z, Qin G, Chen T, et al. 2020. Molecular basis and regulation of pathogenicity and patulin biosynthesis inPenicillium expansum. Comprehensive Reviews in Food Science and Food Safety 19:3416−38

    doi: 10.1111/1541-4337.12612

    CrossRef   Google Scholar

    [5]

    Durrant WE, Dong X. 2004. Systemic acquired resistance. Annual Review of Phytopathology 42:185−209

    doi: 10.1146/annurev.phyto.42.040803.140421

    CrossRef   Google Scholar

    [6]

    Wasternack C. 2007. Jasmonates: an update on biosynthesis, signal transduction and action in plant stress response, growth and development. Annals of Botany 100:681−97

    doi: 10.1093/aob/mcm079

    CrossRef   Google Scholar

    [7]

    Liu Y, Yang X, Zhu S, Wang Y. 2016. Postharvest application of MeJA and NO reduced chilling injury in cucumber (Cucumis sativus) through inhibition of H2O2 accumulation. Postharvest Biology and Technology 119:77−83

    doi: 10.1016/j.postharvbio.2016.04.003

    CrossRef   Google Scholar

    [8]

    Boonyaritthongchai P, Supapvanich S. 2017. Effects of methyl jasmonate on physicochemical qualities and internal browning of ‘queen’ pineapple fruit during cold storage. Horticulture Environment & Biotechnology 58:479−87

    doi: 10.1007/s13580-017-0362-3

    CrossRef   Google Scholar

    [9]

    Asghari M, Hasanlooe AR. 2016. Methyl jasmonate effectively enhanced some defense enzymes activity and total antioxidant content in harvested "sabrosa" strawberry fruit. Food Science and Nutrition 4:377−83

    doi: 10.1002/fsn3.300

    CrossRef   Google Scholar

    [10]

    Pan L, Zhao X, Chen M, Fu Y, Xiang M, et al. 2020. Effect of exogenous methyl jasmonate treatment on disease resistance of postharvest kiwifruit. Food Chemistry 305:125483

    doi: 10.1016/j.foodchem.2019.125483

    CrossRef   Google Scholar

    [11]

    Saavedra GM, Figueroa NE, Poblete LA, Cherian S, Figueroa CR. 2016. Effects of preharvest applications of methyl jasmonate and chitosan on postharvest decay, quality and chemical attributes of Fragaria chiloensis fruit. Food Chemistry 190:448−53

    doi: 10.1016/j.foodchem.2015.05.107

    CrossRef   Google Scholar

    [12]

    Glowacz M, Roets N, Sivakumar D. 2017. Control of anthracnose disease via increased activity of defence related enzymes in 'Hass' avocado fruit treated with methyl jasmonate and methyl salicylate. Food Chemistry 234:163−67

    doi: 10.1016/j.foodchem.2017.04.063

    CrossRef   Google Scholar

    [13]

    Diethelm R, Miller MG, Shibles R, Stewart CR. 1990. Effect of salicylhydroxamic acid on respiration, photosynthesis, and peroxidase activity in various plant tissues. Plant and Cell Physiology 31:179−85

    doi: 10.1093/oxfordjournals.pcp.a077890

    CrossRef   Google Scholar

    [14]

    Cocetta G, Rossoni M, Gardana C, Mignani I, Ferrante A, et al. 2014. Methyl jasmonate affects phenolic metabolism and gene expression in blueberry (Vaccinium corymbosum). Physiologia Plantarum 153:269−83

    doi: 10.1111/ppl.12243

    CrossRef   Google Scholar

    [15]

    Jin P, Wang K, Shang H, Tong J, Zheng Y. 2009. Low-temperature conditioning combined with methyl jasmonate treatment reduces chilling injury of peach fruit. Journal of the Science of Food and Agriculture 89:1690−96

    doi: 10.1002/jsfa.3642

    CrossRef   Google Scholar

    [16]

    Guo J, Fang W, Lu H, Zhu R, Lu L, et al. 2014. Inhibition of green mold disease in mandarins by preventive applications of methyl jasmonate and antagonistic yeast Cryptococcus laurentii. Postharvest Biology and Technology 88:72−78

    doi: 10.1016/j.postharvbio.2013.09.008

    CrossRef   Google Scholar

    [17]

    Jiang L, Jin P, Wang L, Yu X, Wang H, et al. 2015. Methyl jasmonate primes defense responses against Botrytis cinerea and reduces disease development in harvested table grapes. Scientia Horticulturae 192:218−23

    doi: 10.1016/j.scienta.2015.06.015

    CrossRef   Google Scholar

    [18]

    Min D, Li F, Cui X, Zhou J, Li J, et al. 2020. SlMYC2 are required for methyl jasmonate-induced tomato fruit resistance to Botrytis cinerea. Food Chemistry 310:125901

    doi: 10.1016/j.foodchem.2019.125901

    CrossRef   Google Scholar

    [19]

    Yao H, Tian S. 2005. Effects of pre- and post-harvest application of salicylic acid or methyl jasmonate on inducing disease resistance of sweet cherry fruit in storage. Postharvest Biology and Technology 35:253−62

    doi: 10.1016/j.postharvbio.2004.09.001

    CrossRef   Google Scholar

    [20]

    Cao S, Zheng Y, Yang Z, Tang S, Jin P, et al. 2008. Effect of methyl jasmonate on the inhibition of Colletotrichum acutatum infection in loquat fruit and the possible mechanisms. Postharvest Biology and Technology 49:301−7

    doi: 10.1016/j.postharvbio.2007.12.007

    CrossRef   Google Scholar

    [21]

    Wang K, Jin P, Han L, Shang H, Tang S, et al. 2014. Methyl jasmonate induces resistance against penicillium citrinum in Chinese bayberry by priming of defense responses. Postharvest Biology and Technology 98:90−97

    doi: 10.1016/j.postharvbio.2014.07.009

    CrossRef   Google Scholar

    [22]

    Nicholson RL, Hammerschmidt R. 1992. Phenolic compounds and their role in disease resistance. Annual Review of Phytopathology 30:369−89

    doi: 10.1146/annurev.py.30.090192.002101

    CrossRef   Google Scholar

    [23]

    Eckardt NA. 2017. The plant cell reviews plant immunity: receptor-like kinases, ROS-RLK crosstalk, quantitative resistance, and the growth/defense trade-off. The Plant Cell 29:601−2

    doi: 10.1105/tpc.17.00289

    CrossRef   Google Scholar

    [24]

    Xu J, Duan X, Yang J, Beeching JR, Zhang P. 2013. Enhanced reactive oxygen species scavenging by overproduction of superoxide dismutase and catalase delays postharvest physiological deterioration of cassava storage roots. Plant Physiology 161:1517−28

    doi: 10.1104/pp.112.212803

    CrossRef   Google Scholar

    [25]

    Zhang W, Zhao H, Jiang H, Xu Y, Cao J, et al. 2020. Multiple 1-MCP treatment more effectively alleviated postharvest nectarine chilling injury than conventional one-time 1-MCP treatment by regulating ROS and energy metabolism. Food Chemistry 330:127256

    doi: 10.1016/j.foodchem.2020.127256

    CrossRef   Google Scholar

    [26]

    Yang J, Sun C, Zhang Y, Fu D, Zheng X, et al. 2017. Induced resistance in tomato fruit by γ-aminobutyric acid for the control of alternaria rot caused by Alternaria alternata. Food Chemistry 221:1014−20

    doi: 10.1016/j.foodchem.2016.11.061

    CrossRef   Google Scholar

    [27]

    Souza TP, Dias RO, Silva-Filho MC. 2017. Defense-related proteins involved in sugarcane responses to biotic stress. Genetics and Molecular Biology 40:360−72

    doi: 10.1590/1678-4685-gmb-2016-0057

    CrossRef   Google Scholar

    [28]

    Van Loon LC. 1997. Induced resistance in plants and the role of pathogenesis-related proteins. European Journal of Plant Pathology 103:753−65

    doi: 10.1023/A:1008638109140

    CrossRef   Google Scholar

    [29]

    Wang L, Jin P, Wang J, Jiang L, Shan T, et al. 2015. Methyl jasmonate primed defense responses against Penicillium expansum in sweet cherry fruit. Plant Molecular Biology Reporter 33:1464−71

    doi: 10.1007/s11105-014-0844-8

    CrossRef   Google Scholar

    [30]

    Balasundram N, Sundram K, Samman S. 2006. Phenolic compounds in plants and agri-industrial by-products: Antioxidant activity, occurrence, and potential uses. Food Chemistry 99:191−203

    doi: 10.1016/j.foodchem.2005.07.042

    CrossRef   Google Scholar

    [31]

    Liu H, Jiang W, Bi Y, Luo Y. 2005. Postharvest BTH treatment induces resistance of peach (Prunus persica L. cv. Jiubao) fruit to infection by Penicillium expansum and enhances activity of fruit defense mechanisms. Postharvest Biology and Technology 35:263−69

    doi: 10.1016/j.postharvbio.2004.08.006

    CrossRef   Google Scholar

    [32]

    Zhang X, Min D, Li F, Ji N, Meng D, et al. 2017. Synergistic effects of L-arginine and methyl salicylate on alleviating postharvest disease caused by Botrysis cinerea in tomato fruit. Journal of Agricultural and Food Chemistry 65:4890−96

    doi: 10.1021/acs.jafc.7b00395

    CrossRef   Google Scholar

    [33]

    Dietz KJ, Mittler R, Noctor G. 2016. Recent progress in understanding the role of reactive oxygen species in plant cell signaling. Plant Physiology 171:1535−39

    doi: 10.1104/pp.16.00938

    CrossRef   Google Scholar

    [34]

    Saavedra GM, Sanfuentes E, Figueroa PM, Figueroa CR. 2017. Independent preharvest applications of methyl jasmonate and chitosan elicit differential upregulation of defense-related genes with reduced incidence of gray mold decay during postharvest storage of Fragaria chiloensis Fruit. International Journal of Molecular Sciences 18:1420

    doi: 10.3390/ijms18071420

    CrossRef   Google Scholar

    [35]

    Li X, Li M, Wang J, Wang L, Han C, et al. 2018. Methyl jasmonate enhances wound-induced phenolic accumulation in pitaya fruit by regulating sugar content and energy status. Postharvest Biology and Technology 137:106−12

    doi: 10.1016/j.postharvbio.2017.11.016

    CrossRef   Google Scholar

    [36]

    Tang Y, Kuang J, Wang F, Chen L, Hong K, et al. 2013. Molecular characterization of PR and WRKY genes during SA- and MeJA-induced resistance against Colletotrichum musae in banana fruit. Postharvest Biology and Technology 79:62−68

    doi: 10.1016/j.postharvbio.2013.01.004

    CrossRef   Google Scholar

    [37]

    Wu F, Xiao L, Zhao X, Li S, Wang Y, et al. 2021. Effects of exogenous methyl jasmonate treatment on blue mold and storage quality of pear fruit. Acta Agriculturae Universitatis Jiangxiensis 43:1250−58

    Google Scholar

    [38]

    Dou Y, Routledge MN, Gong Y, Godana EA, Dhanasekaran S, et al. 2021. Efficacy of epsilon-poly-L-lysine inhibition of postharvest blue mold in apples and potential mechanisms. Postharvest Biology and Technology 171:111346

    doi: 10.1016/j.postharvbio.2020.111346

    CrossRef   Google Scholar

    [39]

    Singleton VL, Orthofer R, Lamuela-Raventós RM. 1999. Analysis of total phenols and other oxidation substrates and antioxidants by means of folin-ciocalteu reagent. Methods in Enzymology 299:152−78

    doi: 10.1016/S0076-6879(99)99017-1

    CrossRef   Google Scholar

    [40]

    Livak KJ, Schmittgen TD. 2001. Analysis of relative gene expression data using real-time quantitative PCR and the 2−ΔΔCᴛ method. Methods 25:402−8

    doi: 10.1006/meth.2001.1262

    CrossRef   Google Scholar

    [41]

    Chen M, Jiang Q, Yin X, Lin Q, Chen J, et al. 2012. Effect of hot air treatment on organic acid-and sugar-metabolism in Ponkan (Citrus reticulata) fruit. Scientia Horticulturae 147:118−25

    doi: 10.1016/j.scienta.2012.09.011

    CrossRef   Google Scholar

  • Cite this article

    Chen M, Luo Z, Zhao X, Li S, Wu F, et al. 2022. Exogenously applied methyl jasmonate increased the resistance of postharvest pear fruit to blue mold. Fruit Research 2:11 doi: 10.48130/FruRes-2022-0011
    Chen M, Luo Z, Zhao X, Li S, Wu F, et al. 2022. Exogenously applied methyl jasmonate increased the resistance of postharvest pear fruit to blue mold. Fruit Research 2:11 doi: 10.48130/FruRes-2022-0011

Figures(5)  /  Tables(1)

Article Metrics

Article views(5679) PDF downloads(820)

ARTICLE   Open Access    

Exogenously applied methyl jasmonate increased the resistance of postharvest pear fruit to blue mold

Fruit Research  2 Article number: 11  (2022)  |  Cite this article

Abstract: Methyl jasmonate (MeJA) is a plant-signalling molecule that plays significant roles in stress reactions and defence responses. The goal of this study was to characterize the effects of exogenous MeJA application on the resistance of postharvest pear fruit to blue mould rot caused by Penicillium expansum and investigate the mechanism underlying the observed effects of MeJA application. MeJA treatment effectively reduced the lesion diameter of blue mould rot in pear fruit. Furthermore, MeJA significantly enhanced the activities of antioxidant and defence-related enzymes, such as polyphenol oxidase (PPO), superoxide dismutase (SOD), peroxidase (POD), catalase (CAT), β-1,3 glucanase (GLU) and chitinase (CHI); total phenol content also increased, and membrane lipid peroxidation decreased. MeJA treatment promoted the expression of PpPPO, Cu-ZnSOD, PpPOD, PpCAT, PpCHI and PpGLU. Overall, this experiment suggested that MeJA-induced pear fruit resistance against blue mould rot may be related to the enhanced activities of defence enzymes and gene expression.

    • Pear is one of the most significant fruit crops worldwide. 'Cuiguan' pear (Pyrus pyrifolia cv. 'Cuiguan') is a famous early ripening pear variety cultivated in southern China that is known for its pleasant appearance, aroma and taste; however, its shelf life is short, as the quality of the fruit at room temperature can rapidly decrease[1]. Blue mould rot (Penicillium expansum) is considered an important disease in the ripening and postharvest storage of pear fruit[2], as it is responsible for inducing serious economic losses to the pear industry in China. P. expansum produces patulin, a mycotoxin that can contaminate fruit and thus have deleterious effects on humans and food safety[3,4]. Fungicides are the most effective means for controlling this disease. However, the problems of pesticide residues and pathogen resistance caused by the long-term use of fungicides are becoming increasingly clear. There is thus an urgent need to develop an easy and effective alternative strategy for managing postharvest fruit disease. Chemical elicitors inducing host disease resistance have received increased attention in recent years[5].

      Methyl jasmonate (MeJA) is a significant growth regulator of plants in induced resistance[6]. Salicylhydroxamic acid (SHAM) negatively regulates the physiological effects of endogenous jasmonic acid in plants by inhibiting the MeJA signalling pathway[7]. Previous experiments have shown that MeJA can be used as an exogenous signal elicitor to induce plant disease resistance in pineapple fruit[8], strawberry fruit[9] and kiwifruit[10]. Furthermore, MeJA can also act as an endogenous signalling molecule to transmit signals in plants to resist disease stress and improve the activity of defence enzymes, such as peroxidase (POD), polyphenol oxidase (PPO), superoxide dismutase (SOD), catalase (CAT), β-1,3 glucanase (GLU) and chitinase (CHI), inducing resistance against kiwifruit soft rot[10], Fragaria chiloensis fruit against grey mould decay[11] and avocado fruit against anthracnose[12]. SHAM could effectively restrain the alternative respiratory pathway and is widely used in a variety of cells or tissues[13].

      MeJA can induce a stress tolerance response in plants not only by improving the activity of defence enzymes but also by stimulating the expression of resistance genes[14]. The regulation of resistance-related genes by MeJA in plant defence responses has been widely reported. Previous studies have shown that MeJA treatment enhanced the expression of CAT, POD and APX enzyme-related genes in peach fruit and improved resistance to chilling injury[15]. In addition, MeJA treatment improved the expression of the PR5 (pathogenesis-related gene) and reduced the incidence of green mould decay in citrus fruits[16]. MeJA treatment enhanced the gene expression of PAL, CAT, SOD, GLU and CHI in grape berries; reduced the rate of fruit rot and increased the resistance to grey mould[17]; and increased PR expression in tomato fruit against Botrytis cinerea[18].

      We previously found that exogenous MeJA-primed defence responses improved resistance against Botryosphaeria dothidea in kiwifruit[10] and reduced blue mould decay incidence in pear fruit, although no direct inhibition of P. expansum was observed (data not published). However, the exact physiological and molecular mechanisms in pear fruit are not well understood. The aim of this study was to determine the effect of MeJA vapour exposure on the disease incidence of blue mould rot, defence-related enzyme activity and gene expression in artificially infected pear fruit.

    • The effects of MeJA treatment on the induction of pear fruit resistance are shown in Fig. 1 and Table 1. Lesion diameters of 100 μmol/L MeJA-treated fruits were obviously smaller than those of the other two groups, with induction effects up to 14.59%; however, the occurrence of blue mould rot was aggravated by 1,000 μmol/L MeJA and 100 μmol/L SHAM treatments. Treatment with 100 μmol/L MeJA for 12, 24, 36 and 48 h before inoculation enhanced the resistance of pear. Compared with the control (0 h), the lesion diameter of the MeJA treatment group was 19.45 mm at 36 h before inoculation, and the induction effect was highest at 15.23%, which was obviously higher than that of control and other MeJA treatments fruits (p < 0.05).
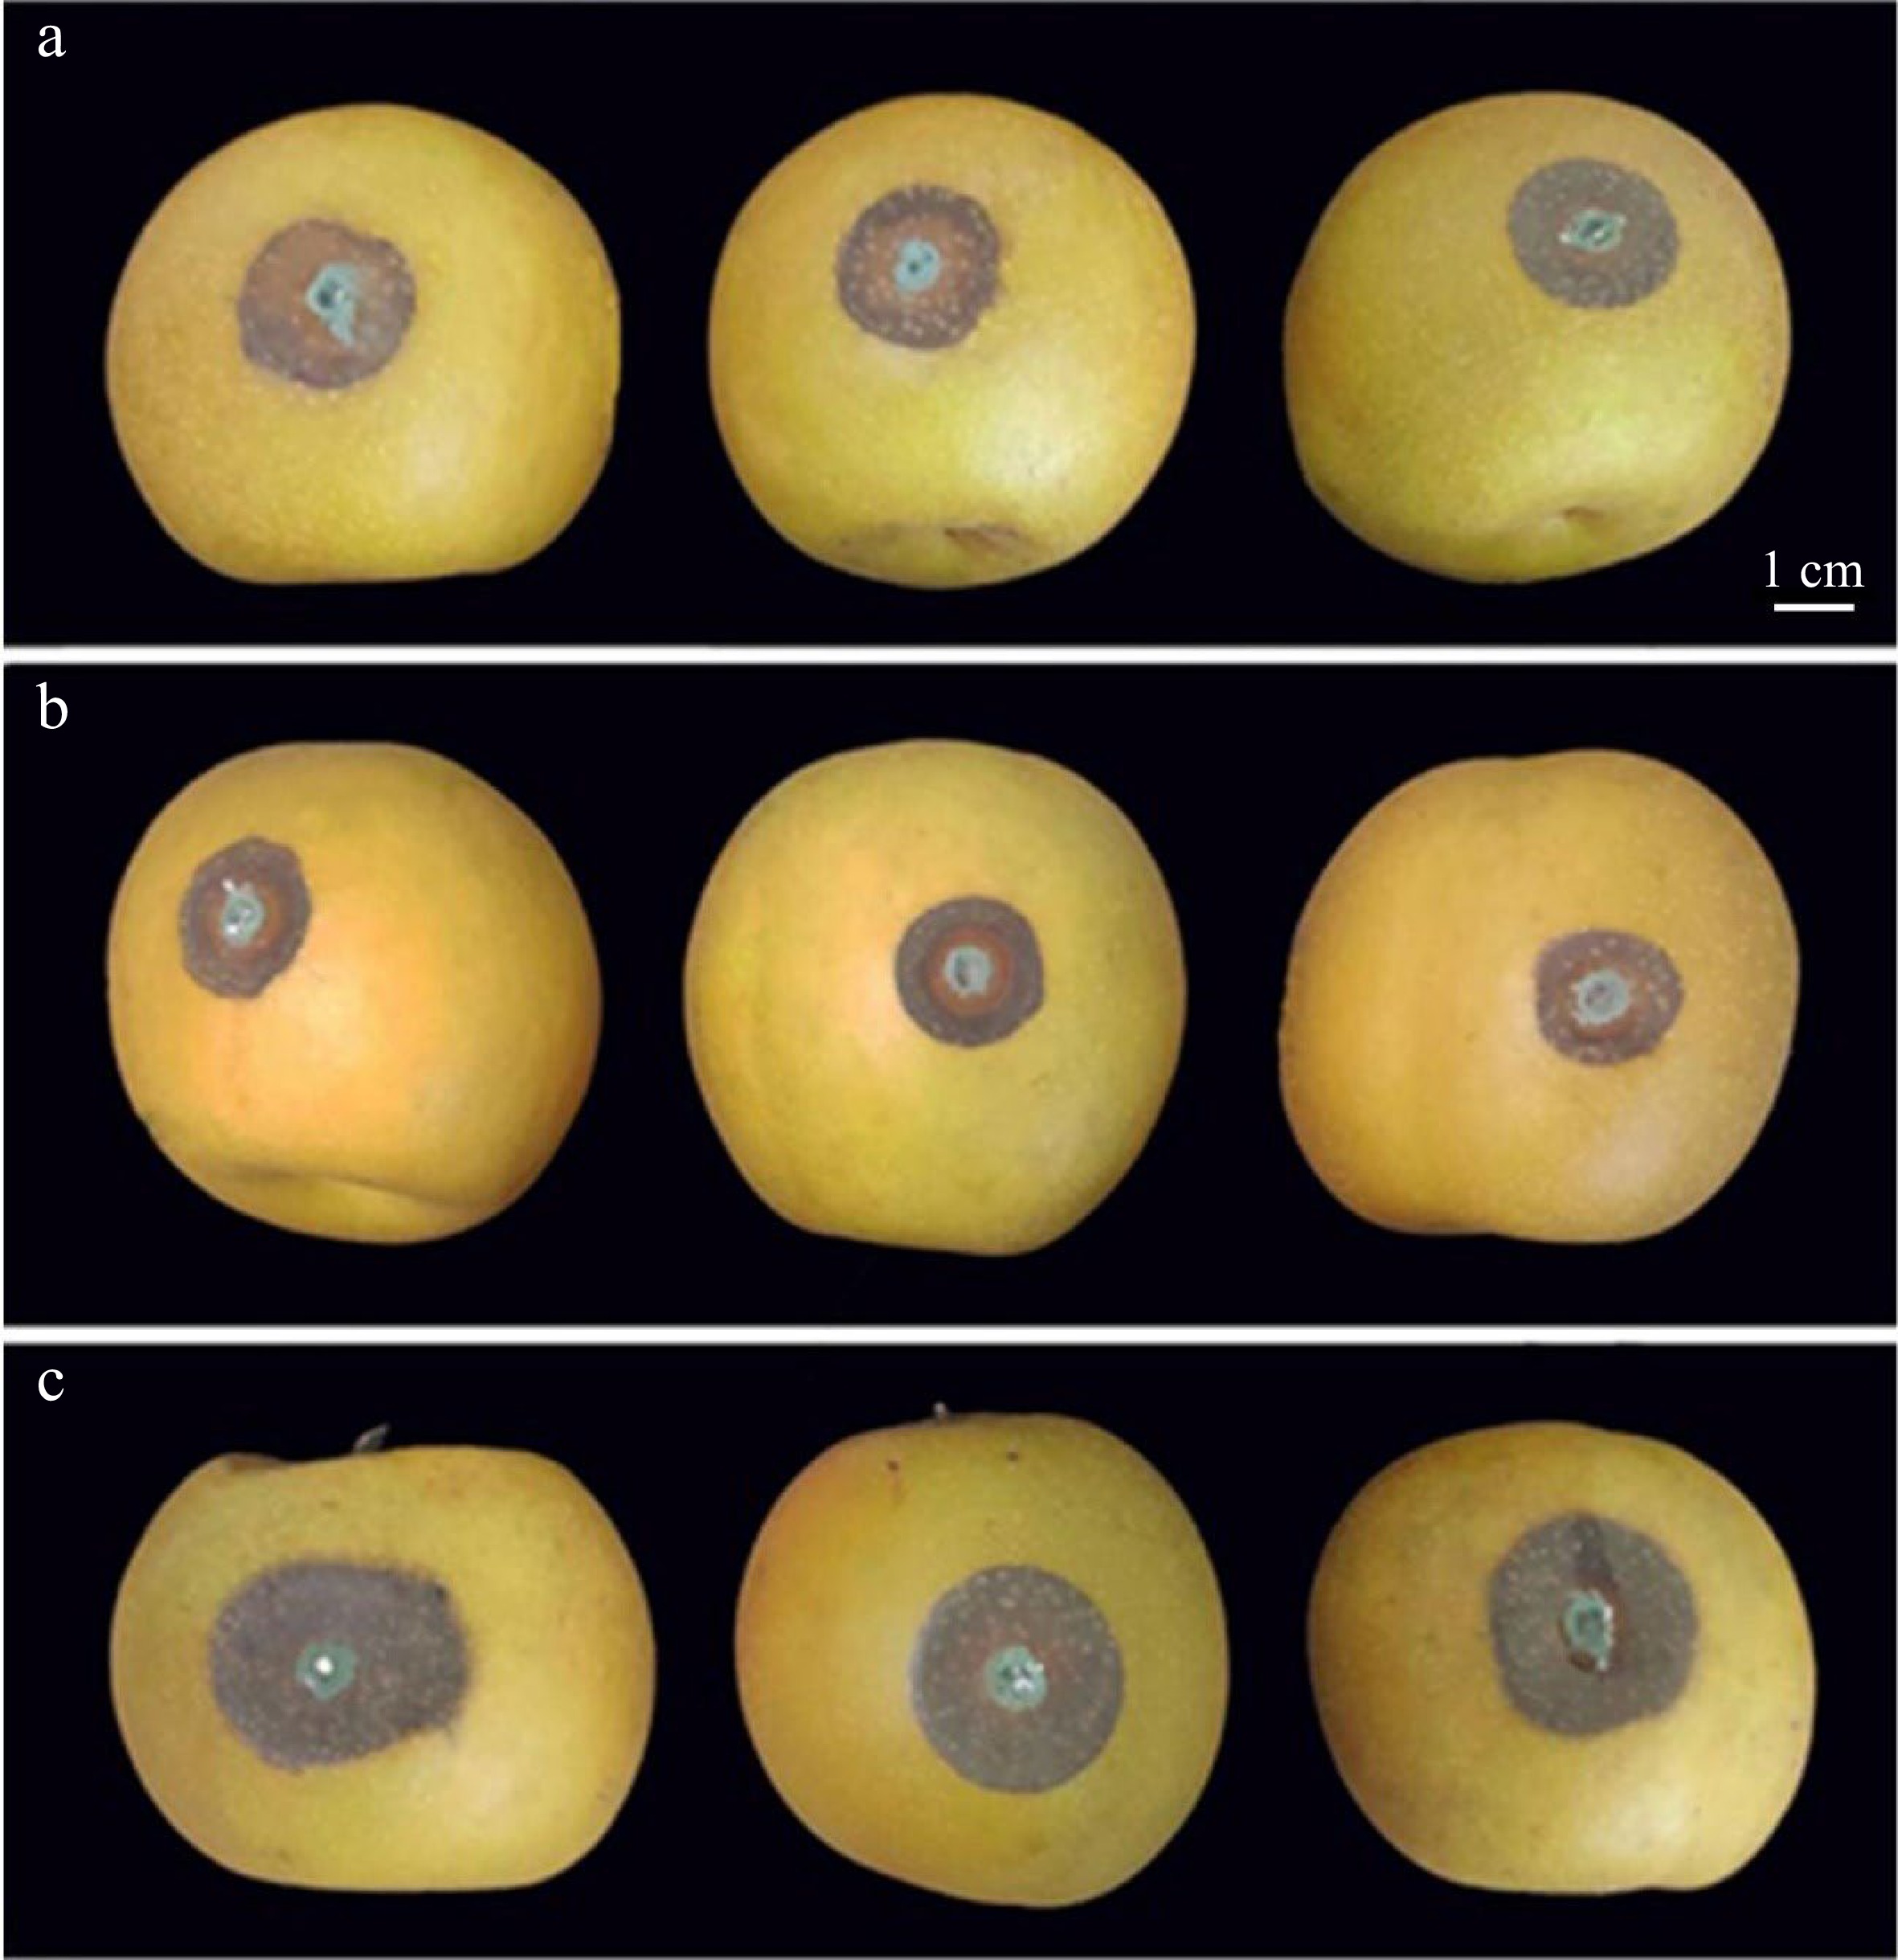
      Figure 1. 

      Symptoms in pear fruit of methyl jasmonate (MeJA) and salicylhydroxamic acid (SHAM) treatment followed by inoculation with Penicillium expansum. (a) Control; (b) 100 μmol/L MeJA treatment; (c) 100 μmol/L SHAM treatment. For experimental details see the Materials and Methods.

      Table 1.  Effects of MeJA treatment on induction resistance in pear fruit inoculated with Penicillium expansum.

      MeJA/SHAMLesion diameter
      (mm)
      Induction effect
      (%)
      MeJA treatment
      time (h)
      Lesion diameter
      (mm)
      Induction effect
      (%)
      CK17.50 ± 0.59ab0022.95 ± 0.45a0
      10 μmol/L MeJA16.89 ± 1.42b3.46 ± 2.39b1221.26 ± 0.83a7.34 ± 2.88b
      100 μmol/L MeJA14.94 ± 1.13c14.59 ± 1.57a2421.52 ± 1.12a6.26 ± 1.60b
      1,000 μmol/L MeJA20.09 ± 0.25a−14.80 ± 0.71c3619.45 ± 0.42b15.23 ± 1.46a
      100 μmol/L SHAM21.45 ± 0.86a−22.58 ± 0.84d4820.84 ± 0.25a9.20 ± 0.80b
      Values are the means of three replicates. Data in the table are mean ± SD. Different letters indicate significant difference (p < 0.05) between the treatments determined using the Duncan's multiple range test.
    • As shown in Fig. 2a, the MeJA treatment group exhibited a peak in PPO activity at 48 h after inoculation, which was significantly (1.45 and 1.78 times) higher than that of the control and SHAM groups, respectively. The POD activity was higher in the MeJA group fruits than in the control and SHAM group fruits from 48 h to 144 h after inoculation; specifically, the POD activity in the MeJA group fruits was as high as 1.17 and 5.25 times that in the control and SHAM groups at 96 h, respectively (Fig. 2b) (p < 0.05). The CAT activity of MeJA group fruits showed a slow increase reaching a peak after 96−120 h. In the MeJA treated fruits there was a significant increase over the control and the SHAM treated fruits (Fig. 2c). After 96 h of inoculation, the SOD activity reached its maximum (130.00 U/g FW), which was significantly higher than that of the control (121.07 U/g FW) and SHAM groups (105.82 U/g FW) (Fig. 2d) (p < 0.05).
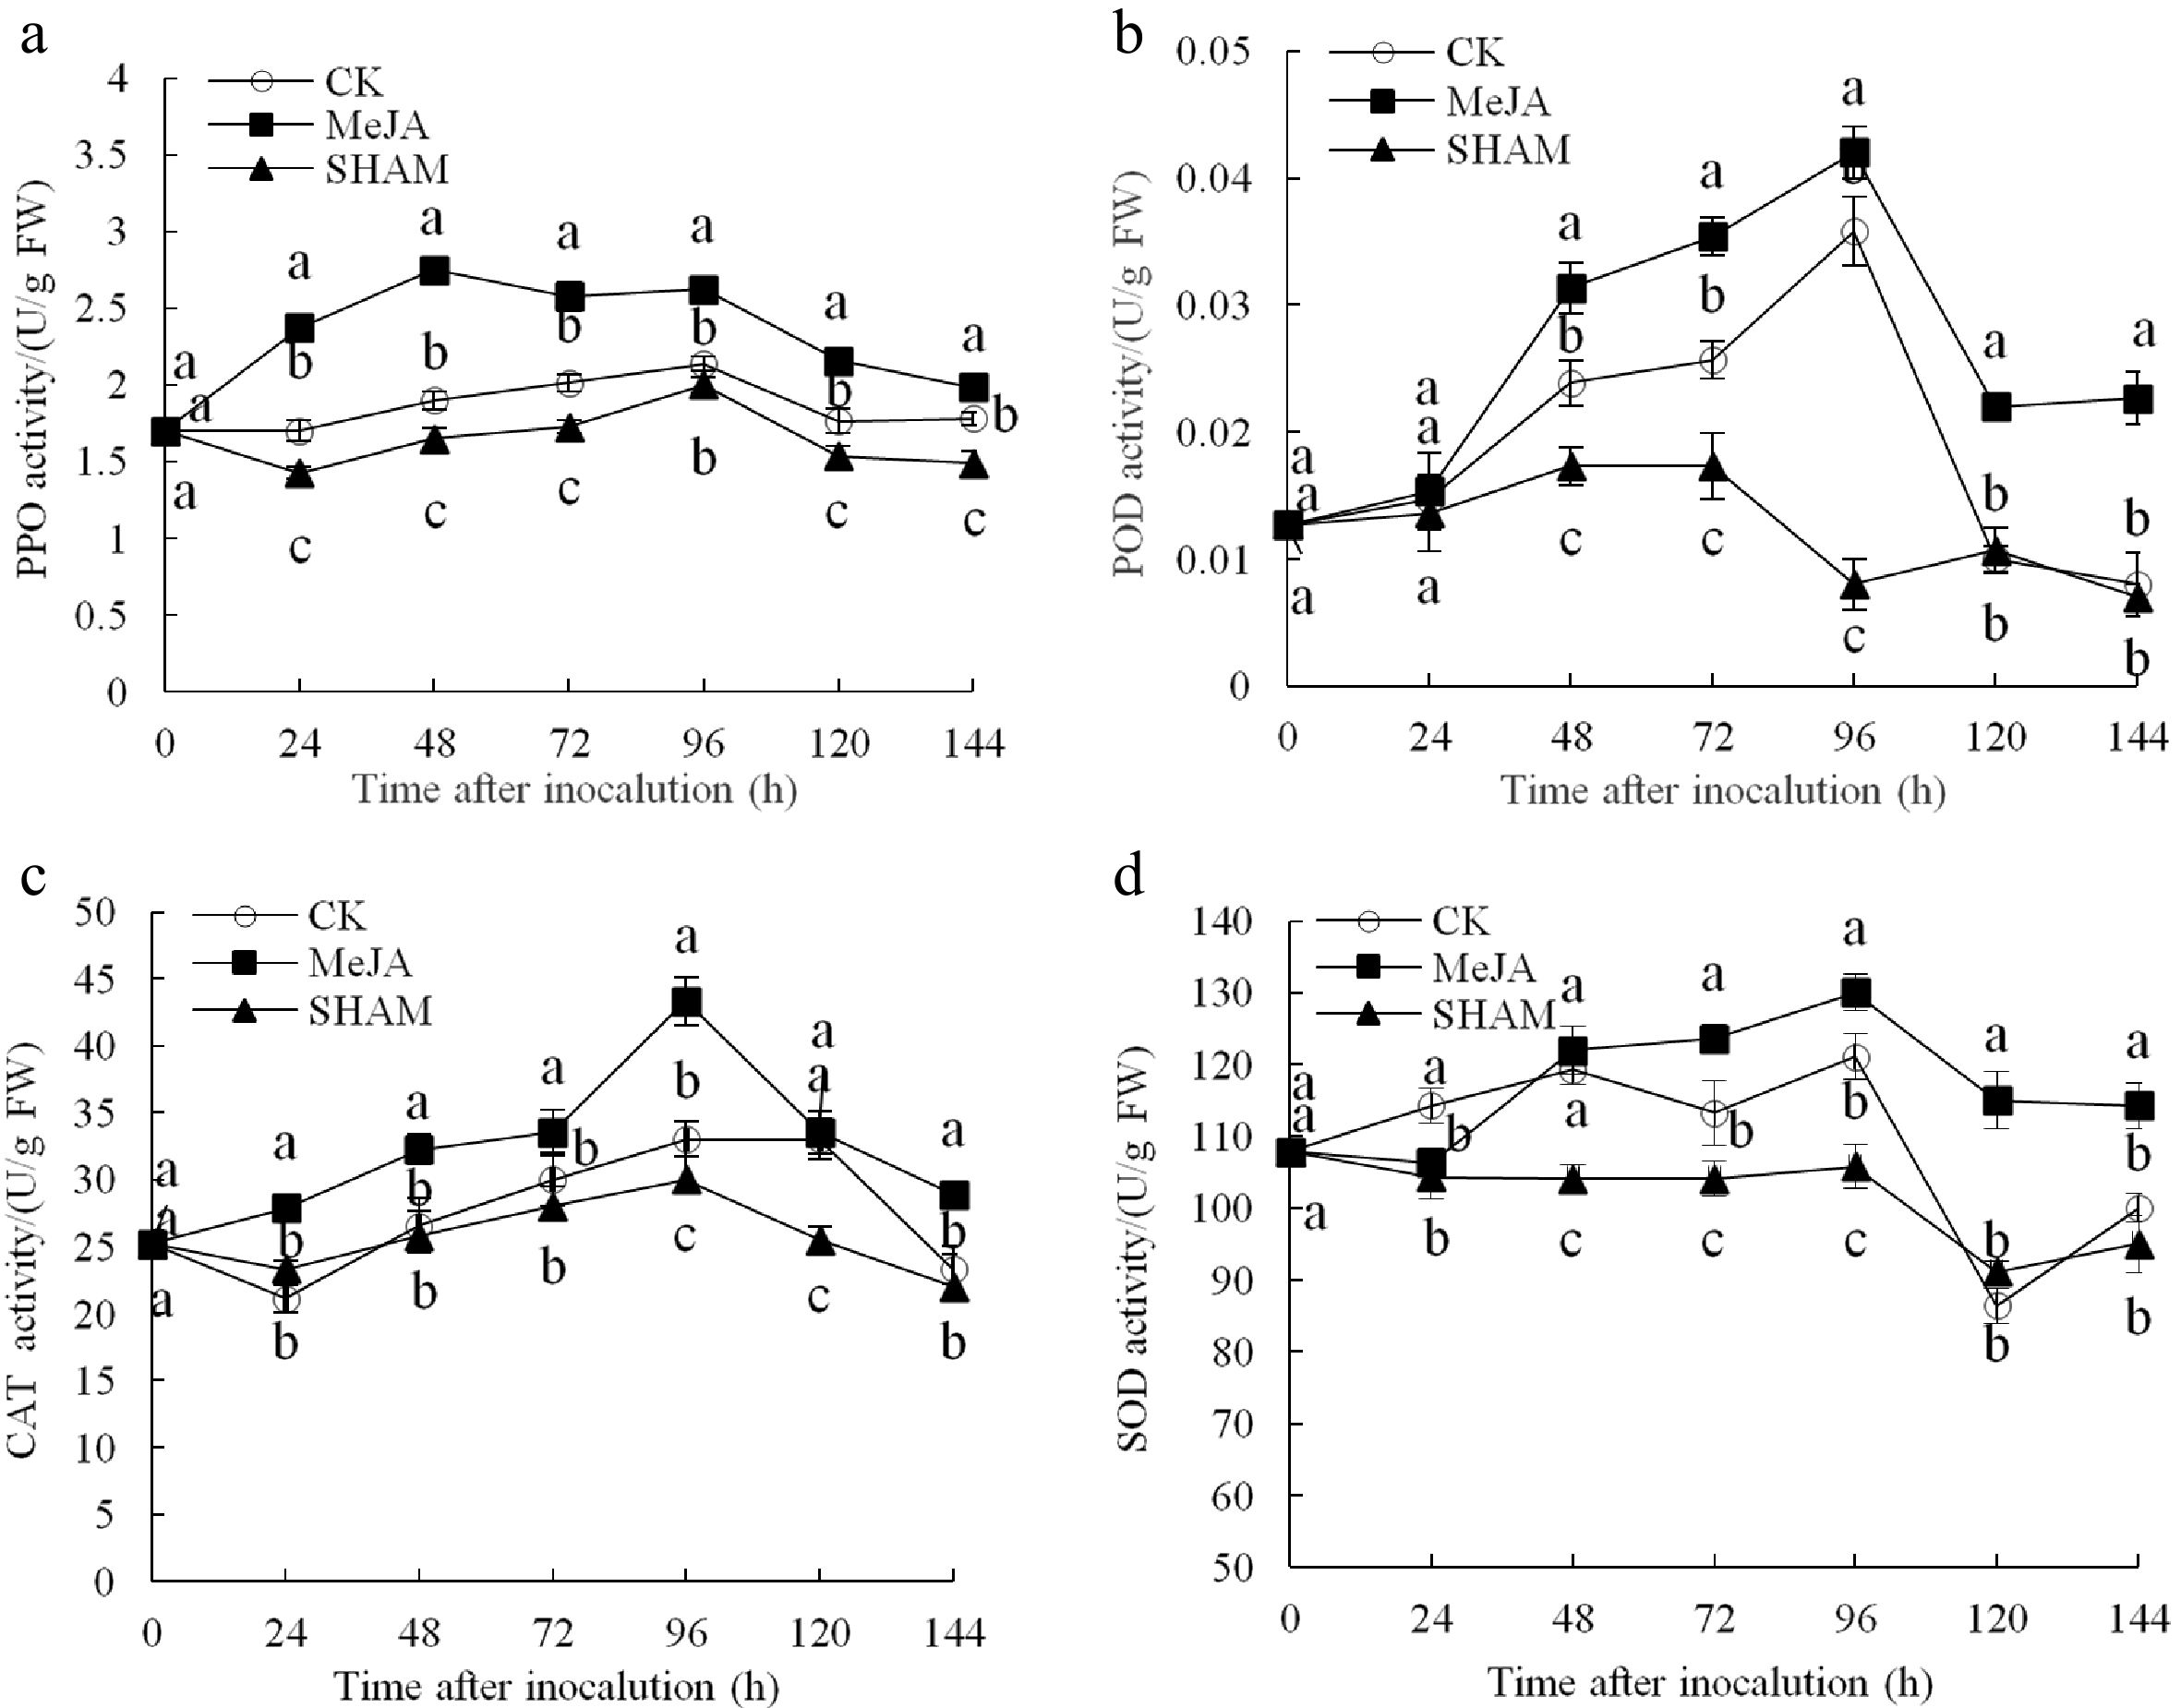
      Figure 2. 

      Changes in the activities of PPO (a), POD (b), CAT (c) and SOD (d) in pear fruit inoculated with Penicillium expansum after 100 μmol/L MeJA treatment for 36 h. Values are the means of three replicates and vertical bars indicate the standard errors.

    • The CHI activity of MeJA pear fruit was obviously higher than that of the other two groups, except at 24 h within 144 h after inoculation (Fig. 3a). The highest CHI activity observed was 232.72 U/g FW at 72 h after inoculation, which was 1.38 and 1.65 times that of the control and SHAM groups, respectively (p < 0.05). The GLU activity change is shown in Fig. 3b. The activity of GLU in the MeJA-treated group remained at a significantly higher level within 144 h and peaked at 72 h after inoculation, which was 1.15 times and 1.43 times that of the control and SHAM groups, respectively (p < 0.05).
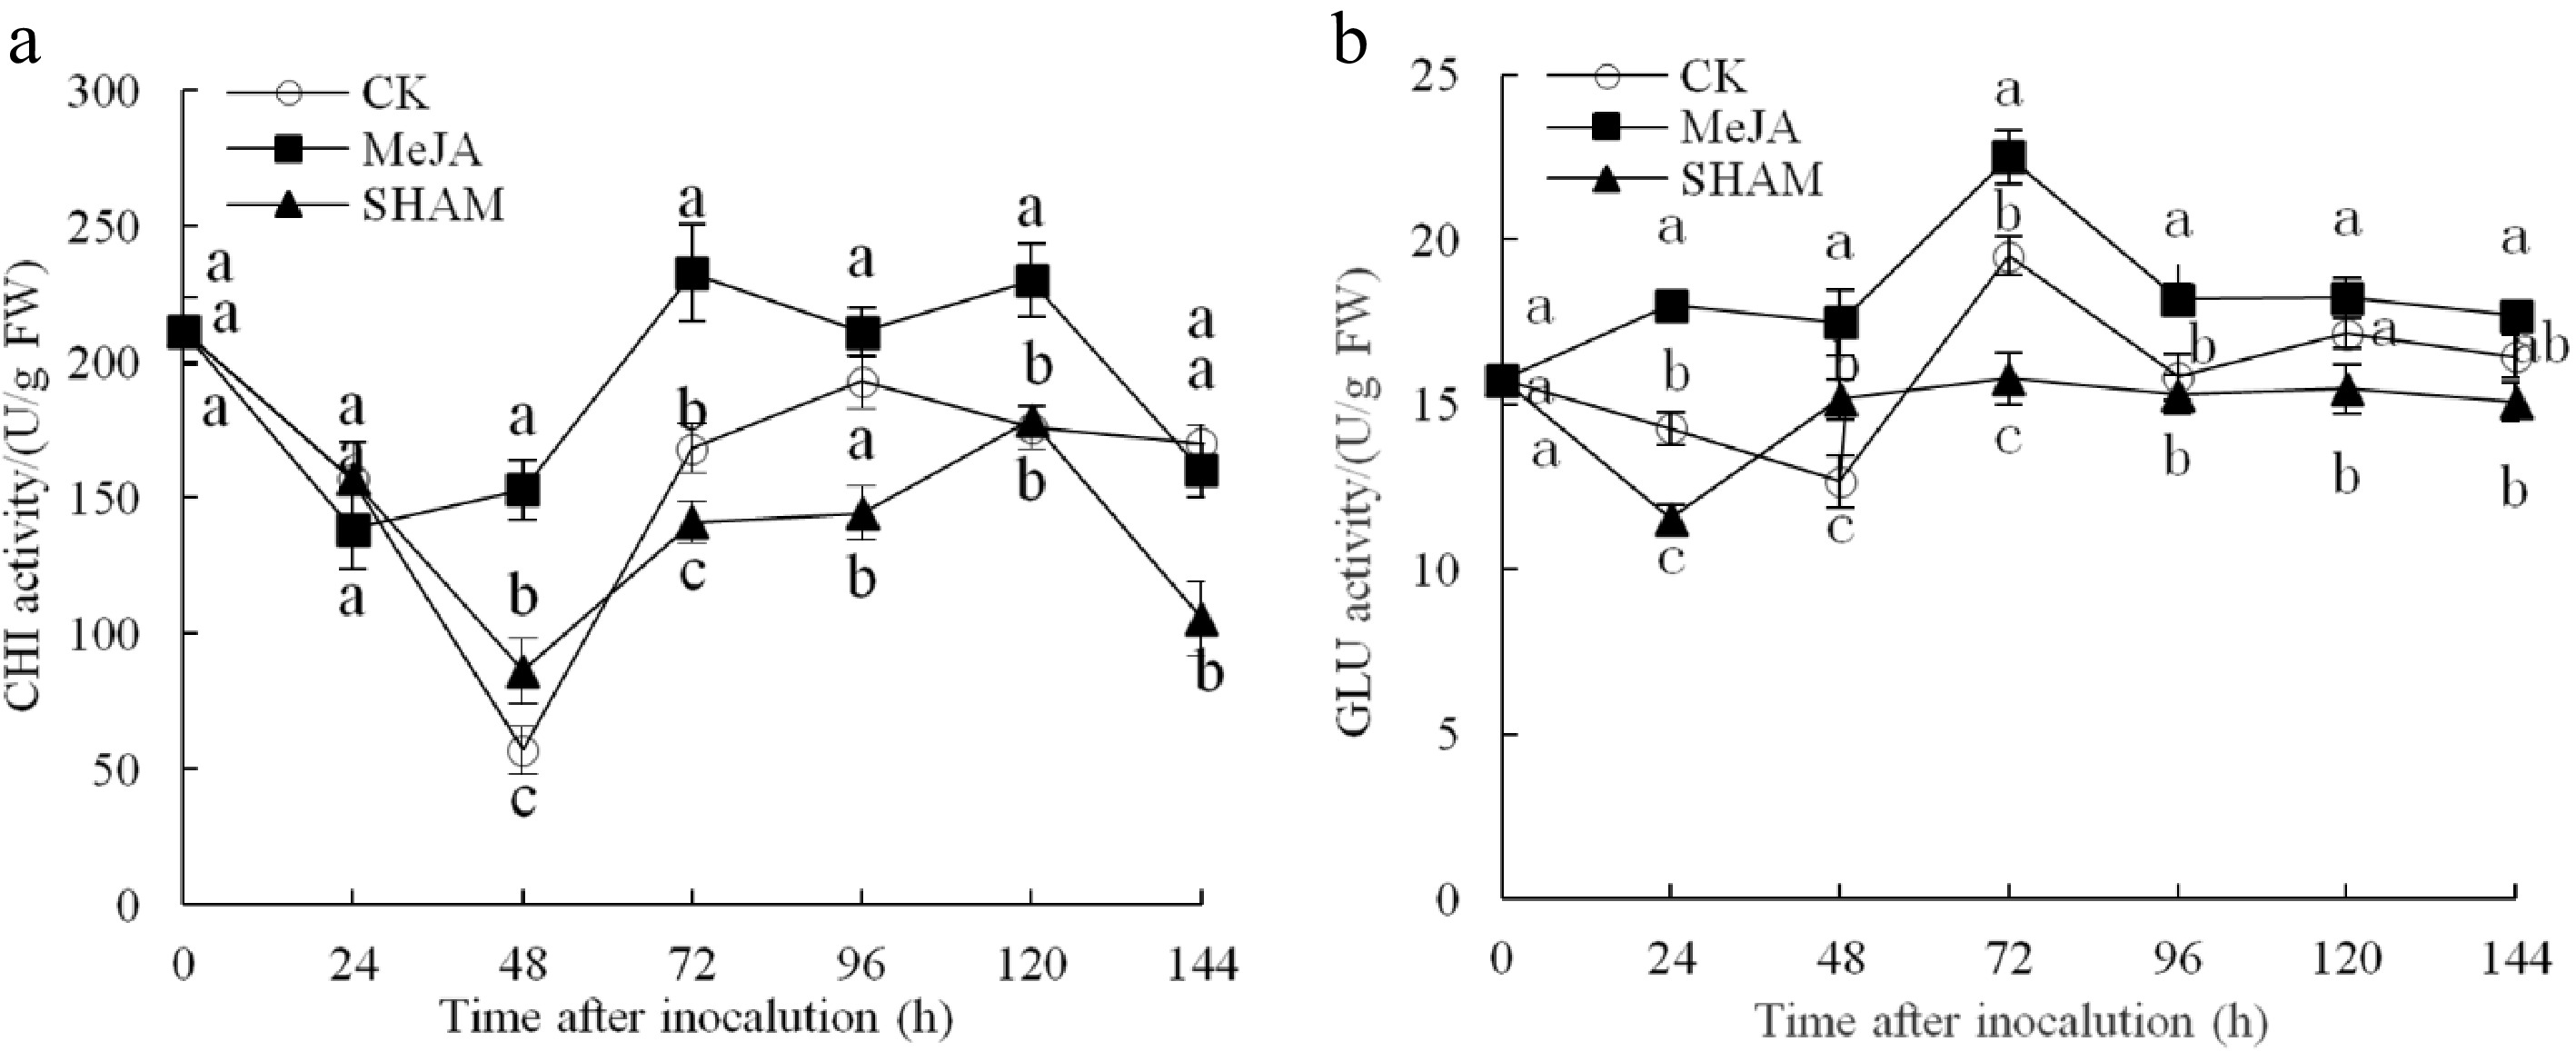
      Figure 3. 

      Changes in the activities of CHI (a) and GLU (b) in pear fruit inoculated with Penicillium expansum after 100 μmol/L MeJA treatment for 36 h. Values are the means of three replicates, and vertical bars indicate the standard errors.

    • The total phenol content continued to increase over time after inoculation in the three fruit groups, and the total phenol content in the MeJA group was higher than that in the other two groups from 72 to 120 h after inoculation (p < 0.05) (Fig. 4a). Figure 4b shows that the MDA content also continued to increase within 144 h after inoculation, which was significantly lower (by approximately 45.32% and 36.71%) in the MeJA-treated group compared with the control and SHAM groups, respectively (p < 0.05).
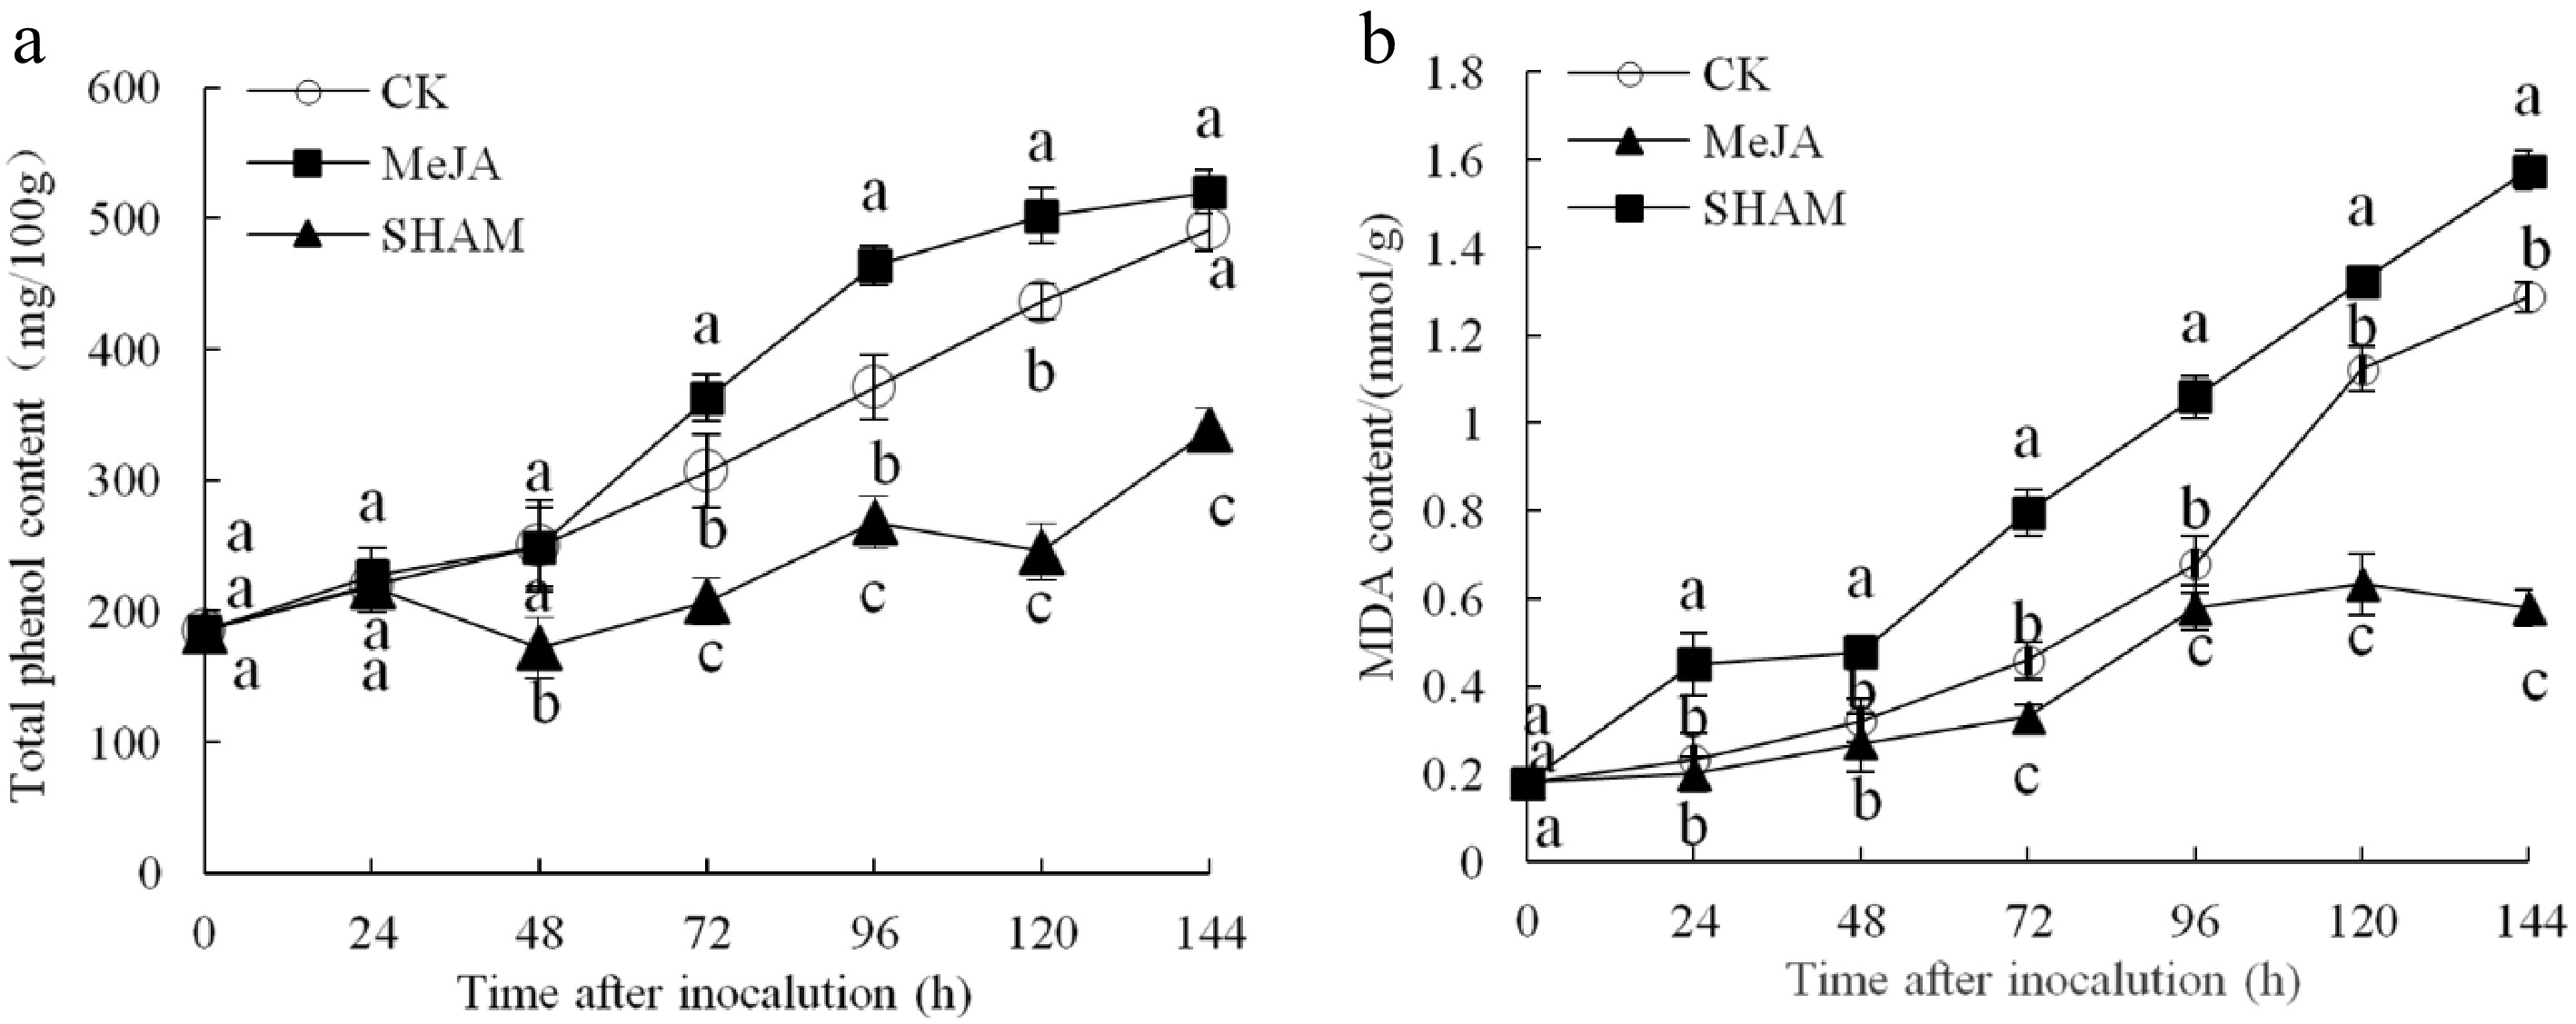
      Figure 4. 

      Changes in the contents of total phenol (a) and MDA (b) content in pear fruit inoculated with of Penicillium expansum after 100 μmol/L MeJA treatment for 36 h. Values are the means of three replicates, and vertical bars indicate the standard errors.

    • After inoculation, the expression levels of PpPPO, PpPOD, PpCAT, Cu-ZnSOD, PpCHI and PpGLU in pear fruit tissue are shown in Fig. 5. The relative expression levels of these genes in the MeJA group were higher than those in the control and SHAM groups in most cases within 144 h.
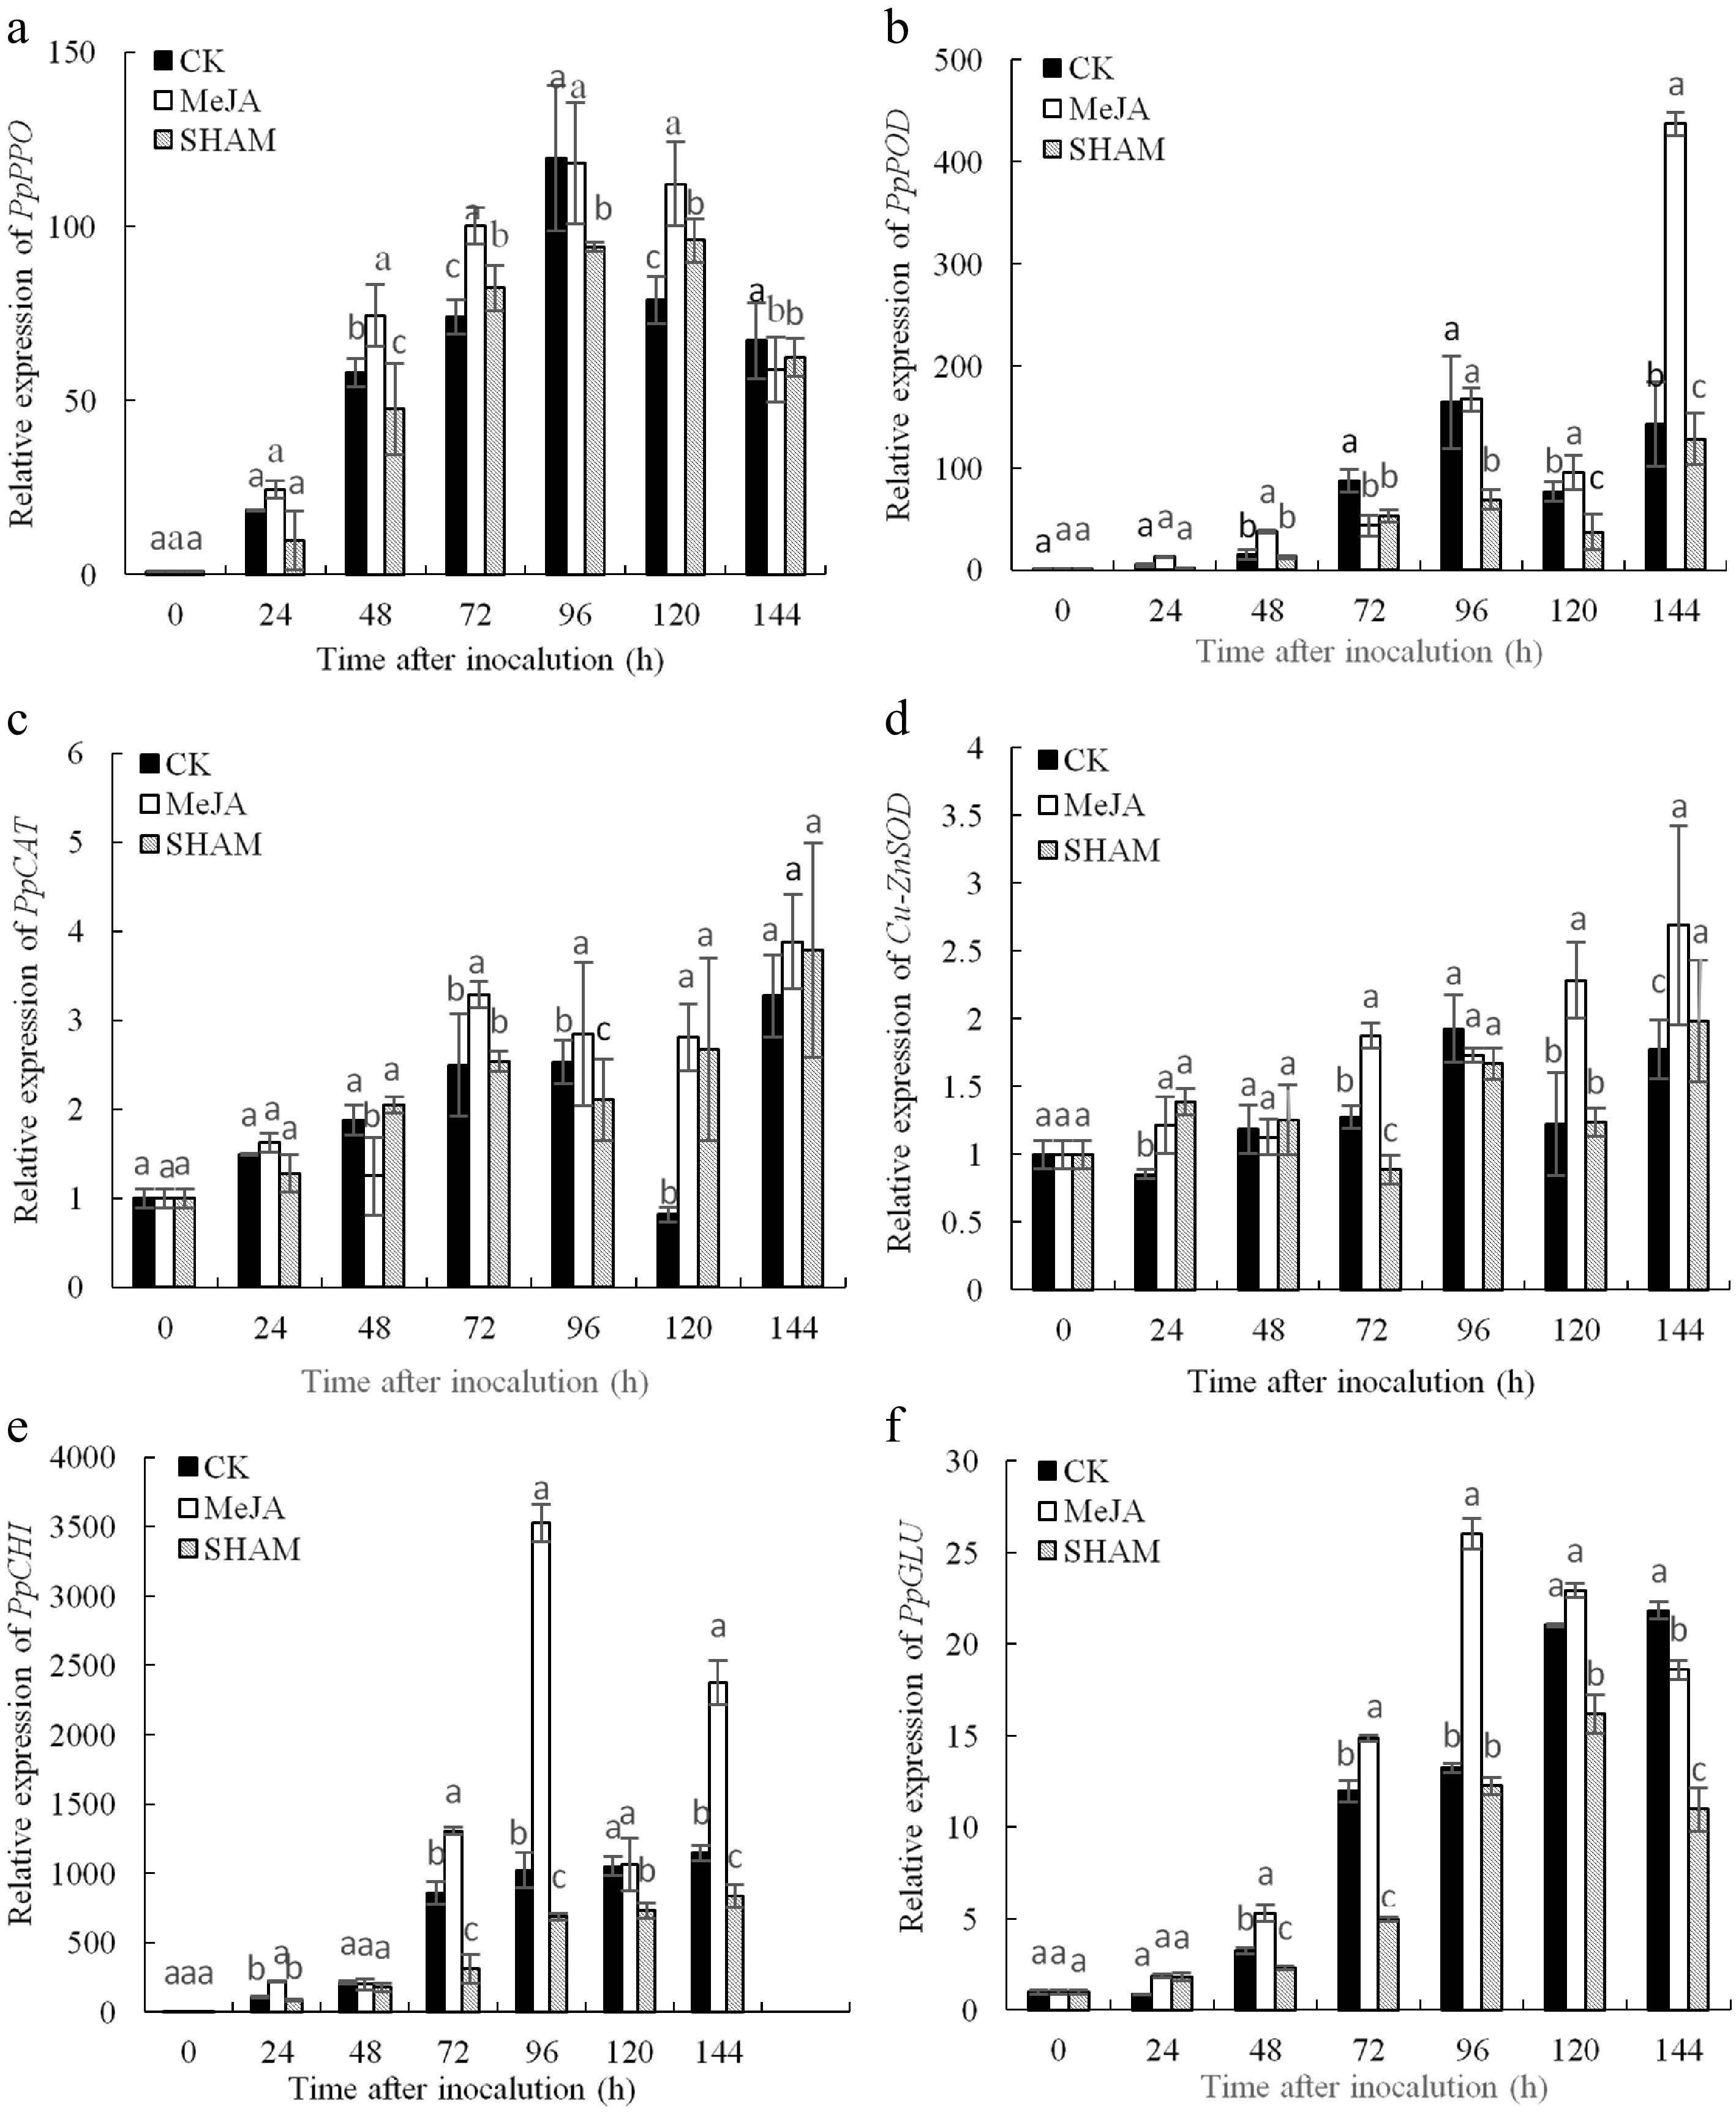
      Figure 5. 

      Expression analysis of defence-related genes including PpPPO (a), PpPOD (b), PpCAT (c) Cu-ZnSOD (d), PpCHI (e) and PpGLU (f) in pear fruit inoculated with Penicillium expansum after 100 μmol/L MeJA treatment for 36 h. Values are the means of three replicates and vertical bars indicate the standard errors. Different letters indicate significant differences (p < 0.05) between the treatments determined using the Duncan’s multiple range test.

      The expression level of PpPPO in the MeJA group was obviously higher than that in the control at 48 h, 72 h and 120 d, and the expression level of PpPPO in the MeJA treatment peaked at 96 h and was obviously higher than the SHAM treatment, except at 144 h (Fig. 5a) (p < 0.05). As shown in Fig. 5b, the expression level of PpPOD in MeJA group fruits was markedly higher than that of other groups at 48 h, 120 h and 144 h, whereas the expression of PpPOD in the SHAM group was lower than that in the control at 72−144 h. In addition, the highest value of PpPOD expression in the MeJA group appeared at 144 h, which was 3.06 and 3.40 times that of the control and SHAM treatment groups, respectively (Fig. 5b) (p < 0.05).

      As shown in Fig. 5c, the PpCAT gene expression level in the MeJA group was markedly higher than that in the control and SHAM groups at 72−96 h; although it reached a peak at 144 h, there were no significant differences among the three treatments (p < 0.05). The expression level of Cu-ZnSOD in the MeJA group was markedly higher, which was 1.52 and 1.36 times that of the control and SHAM groups at 72, 120 and 144 h, respectively, and the highest value was observed at 144 h (Fig. 5d) (p < 0.05).

      The change in PpCHI expression after inoculation in pear fruit is shown in Fig. 5e. The PpCHI expression level in the MeJA group was higher than that in the other two groups except at 48 h within 144 h after inoculation; the difference between MeJA treatment and control groups was significant at 24, 72, 96 and 144 h. PpCHI expression in the control was clearly higher than that in the SHAM treatment group at 72−144 h. The expression level of PpCHI peaked at 96 h in MeJA treatment fruits, which was 3.45 and 5.11 times that of the control and SHAM groups, respectively (p < 0.05). PpGLU gene expression in the MeJA group was obviously higher than that in the other two groups at 48−96 h, and its expression peaked at 96 h. The expression of PpGLU was lower in the SHAM group than in the control at 48−72 h and 120−144 h (Fig. 5f) (p < 0.05).

    • MeJA, a natural plant growth regulator, participates in the defence response and signalling of plants to external stress and induces the host immune response to reduce disease risk[6]. In this study, the results indicated that the induction effect of MeJA depended on treatment concentration and time before inoculation, and 'Cuiguan' pear fruits fumigated with 100 μmol/L MeJA for 36 h then inoculation were significantly improved the resistance to blue mould rot. Specifically, 10−100 μmol/L MeJA could effectively improve pear fruit resistance to blue mould rot, whereas 1,000 μmol/L MeJA treatment aggravated the occurrence of blue mould rot. Many previous studies showed that excessive MeJA treatment had opposite effects on fruit resistance to postharvest diseases. This conclusion was similar to the results obtained in kiwifruit[10], however, the optimum concentration of exogenous MeJA-induced resistance to Monilinia fructicola in sweet cherry fruit was 0.2 mmol/L[19], and 10 μmol/L MeJA treatment could significantly reduce the occurrence of loquat fruit decay caused by Colletotrichum acutatum[20]. Guo et al.[16] found that 100 μmol/L MeJA had the highest inhibitory effect on mandarin green mould disease. In addition, the suitable time between MeJA treatment and pathogen inoculation was 36 h in our test, whereas the optimum time for induction to Penicillium citrinum in Chinese bayberry[21], Botrytis cinerea in table grapes[17], and B. dothidea in kiwifruit[10] by MeJA treatment was 6, 12 and 24 h respectively. All of these results indicate that plant-induced resistance to the pathogen is maintained by plant and pathogen genetic factors that vary based on host-pathogen combinations.

      Plant-induced resistance refers to the ability of plants to increase their immune defence enzymes and plant protection factors and thus form a self-protecting natural barrier to prevent infection by pathogens[22]. SOD, POD, PPO and CAT, which are key antioxidant enzymes in the reactive oxygen species (ROS) system because of the protection they provide to plant tissues against pathogen infection[23], are commonly involved in the plant defence response, which plays a pivotal role in the postharvest control area[24, 25]. In this study, the activities of SOD, POD, PPO and CAT were effectively induced by MeJA in pear fruit. Previous studies on defence responses have also shown that the activation of defence enzymes was largely related to the induced resistance mechanisms of table grape fruit against B. cinerea[17], tomato against Alternaria alternata[26] and kiwifruit against B. dothidea[10]. Various defence-related proteins in plants have been identified as PR proteins, including CHI and GLU, and chitin and β-1,3-linked glucans in fungal cell walls can be catalysed to inhibit pathogen growth[27]. Their accumulation in diseased plant cells and functions in different plant-microbe interactions have been intensively studied[28]. Experiments have shown that MeJA treatment can increase the activities of CHI and GLU in sweet cherry fruits and reduce the incidence of blue mould[29]; MeJA treatment can also increase resistance to anthracnose disease in avocado fruits[12]. Similarly, this study also showed that the CHI and GLU activities in MeJA-treated pear fruits were significantly higher than those in control fruits. Thus, the enhanced defence-related enzyme activities and proteins that were observed in this study may contribute to this resistance induction.

      Total phenols, the most abundant secondary metabolite in plants, are antimicrobials and precursors of structural polymers, including lignin, or function as signal molecules, which have been shown to be involved in disease resistance in many plant–pathogen interactions[30]. Many studies have revealed that total phenols play a pivotal role in the plant's defence against diseases. For example, Min et al.[18] reported that MeJA treatment enhanced the accumulation of total phenolics and obviously inhibited the development of grey mould decay in tomato fruit. Moreover, total phenols were involved in the defence responses of peach fruit to P. expansum[31] and tomato fruit to B. cinerea[32]. MDA is one of the key factors of membrane lipid peroxidation and is an important indicator of disease resistance[33]. In our experiment, MeJA treatment significantly increased the total phenol content, but it inhibited MDA accumulation in pear fruit; similar results were observed in strawberry fruit against postharvest decay[34], pitaya fruit against wounding stress[35] and tomato fruit against grey mould treated with MeJA[18].

      As an important elicitor in the field of plant-induced resistance research, MeJA can not only increase the activity of defence enzymes and the total phenol content but can also regulate defence enzyme genes at a higher level, which is strongly related to increased resistance to pathogens in plants. Jin et al.[15] found that MeJA could effectively increase the gene expression of POD, CAT and APX and decrease chilling injury during storage in peach fruit. Furthermore, MeJA treatment successfully increased the expression of PR and polygalacturonase inhibiting proteins (PGIP) genes and reduced the incidence of grey mould decay in Fragaria chiloensis fruit, then MeJA had a long-lasting effect on the reduction of Botrytis cinereal incidence[34]. In this study, RT-qPCR was carried out to detect the expression of defence enzyme genes, including PPO, POD, CAT, SOD, CHI and GLU, to explain their roles in pear fruit-induced resistance to P. expansum. All six of the aforementioned genes were significantly upregulated by MeJA treatment, which indicated that comprehensive defence reactions were activated by MeJA in pear fruit; this finding may reflect a transient rise in the activity levels of related enzymes. Our results are consistent with previous studies suggesting that higher expression levels of PR genes may stem from MeJA-induced defences in banana fruit[36] as well as defence-related genes, such as CHI, GLU, SOD and CAT, in table grape fruit[17]. Recently, our study showed that 0.1 mmol/L MeJA treatment activated kiwifruit defence resistance to B. dothidea by inducing higher expression levels of genes such as POD, SOD, CHI and GLU[10]. These results indicate that the induction of these defence-related genes may play an important role in the mechanism by which MeJA inhibits P. expansum infection in pear fruit.

    • In summary, the incidence of blue mould rot in pear fruits was inhibited in the MeJA group. These results highlight the fact that enhanced defence-related enzyme activities, higher content of total phenol and higher gene expression levels may all be associated with increases in the defence resistance of 'Cuiguan' fruit to P. expansum.

    • 'Cuiguan' pear fruits were obtained from an orchard located in Xiajiang County, Jiangxi Province, China. The selected fruits were directly transferred to the postharvest laboratory at Jiangxi Agricultural University and sorted to obtain uniformly sized fruit without any mechanical wounds or disease symptoms for the following experimental procedures. The fruits were then stored in the laboratory to sweat for 24 h at 20 °C.

      The test pathogen strain P. expansum isolated from diseased 'Cuiguan' fruit showing symptoms characteristic of blue mould rot was supplied by the plant pathology laboratory of Jiangxi Agricultural University[37]. P. expansum was cultured and kept on potato dextrose agar medium (PDA) at 25 °C for 5 d. The spore suspensions were then measured by a haemocytometer, and the concentration was adjusted to 1.0 × 10⁶ spores/ml using sterile distilled water.

    • MeJA, SHAM and Tween 80 were supplied by Sigma Co. (Saint Louis, USA). The concentrations of MeJA used in the experiment were 10, 100 and 1,000 μmol/L. SHAM was first dissolved in 95% ethanol and then prepared with sterile water including 0.1% Tween 80 in 100 μmol/L SHAM reagent.

    • The pear fruits were randomly divided into five groups as follows: control, fruits exposed to air; 10 μmol/L MeJA, fruits exposed to 10 μmol/L; 100 μmol/L MeJA, fruits exposed to 100 μmol/L; 1,000 μmol/L MeJA, fruits exposed to 1,000 μmol/L; and SHAM, fruits exposed to 0.10 mmol/L (based on previous results). The filter paper was placed in a closed plastic box with liquid MeJA (6 L). The pear fruits were then treated for 36 h at 20 °C with a final vapour concentration (10, 100, 1,000 μmol/L), and 20 mL of 100 μmol/L SHAM was sprayed on the surface of pear fruits under the same conditions. The surfaces of pear fruit were inoculated with 10 μL of prepared spore suspension (1.0 × 10⁶ spores/mL) after disinfesting in 75% (v/v) ethanol and wounding (1-mm diameter with 1-mm depth) with a sterilized needle. All fruits were incubated in plastic boxes at 25 °C (day/night, 12-h photoperiod, 90% relative humidity). Each treatment had three replicates, and 10 fruits were used per replicate. After inoculation, observations of the disease were made and recorded daily.

      Pear fruits were fumigated with 100 μmol/L MeJA for 0, 12, 24, 36 and 48 h before inoculation. Other methods were the same as above.

    • After inoculation, the lesion diameter of pear fruit was measured using the cross method with a Vernier gauge. The induction effect of MeJA on pear fruit resistance against P. expansum was calculated using the following formula: Inducing effect (%) = (lesion diameter of control fruits − lesion diameter of treatment fruits)/lesion diameter of control fruits × 100.

    • Pears were treated with MeJA at 100 μmol/L for 36 h before inoculation. The control was treated with sterile water, and the negative control pear fruits were sprayed with 100 μmol/L SHAM. Other methods were the same as the description in chemical treatments. Fruit flesh (approximately 0.5 g in fresh weight) around diseased sites was excised every 24 h after inoculation. The fruit flesh was quickly mixed and frozen with liquid nitrogen and kept at −80 °C for biochemical measurement and gene expression analysis.

      To determine the activity of PPO and POD, crude enzyme solution was prepared as previously described[38]. Pear fruit tissue (1 g) was ground to powder using liquid nitrogen and homogenized in 10 mL of sodium phosphate buffer (0.1 mol/L, pH 6.8) containing 5% polyvinyl polypyrrolidone (PVPP). The homogenate was then centrifuged for 20 min at 4 °C. The supernatant liquid was used for analysis of PPO and POD activity following the method described by Pan et al.[10] and Dou et al.[38]. with slight modifications. The reaction mixture of PPO contained 4 mL of acetic acid-sodium acetate buffer (50 mmol/L, pH 5.5), 0.9 mL of pyrocatechol (50 mmol/L) and 0.1 mL of crude extract, and PPO activity was expressed as U/g FW based on fresh weight, where one unit (U) was determined as the absorbance increase 0.01 per min at 420 nm. The reaction mixture of POD contained 0.5 mL of supernatant (see above), 3.0 mL of guaiacol solution (25 mmol/L) and 200 μL of H2O2 solution (0.5 mol/L). POD activity was expressed as U/g FW based on fresh weight, where one unit (U) was expressed when the absorbance increased 0.01 per min at 470 nm.

      To determine CAT activity, 1 g of pear fruit tissue was ground to powder with liquid nitrogen and homogenized in 5 mL of sodium phosphate buffer (50 mmol/L, pH 7.5) including 5% PVPP. The homogenate was then centrifuged for 30 min at 4 °C. The CAT reaction system contained 0.1 mL of supernatant and 2.9 mL of H2O2 solution (20 mmol/L). The absorbance was recorded every 30 s for more than 5 min at 240 nm. The CAT activity was expressed as U/g FW based on fresh weight, and one unit (U) was defined as the change of 0.01 per min in absorbance[10,38].

      SOD activity was measured with a SOD assay kit (Jian Cheng Biotechnology Co., Ltd., Nanjing, China); CHI and GLU activity were determined using CHI and GLU assay kits, respectively (Solarbio, Beijing, China).

    • The total phenol content of pear fruit was measured using the Folin-Ciocalteu method according to a previous study[39]. One gram of frozen pear fruit tissue was extracted with 8 mL of methanol and extracted by ultrasound at 50 °C for 30 min. The extracts were centrifuged for 20 min at 4 °C. The reaction mixture (0.5 mL supernatant, 0.5 mL Folin-Ciocalteu and 5 mL distilled water) was placed in the dark for 10 min and then mixed with 1 mL of 10% Na2CO3 for 60 min at room temperature, and the absorbance was determined at 765 nm. The total phenol content was calculated according to a standard curve made with gallic acid and defined as 100 grams of fresh gallic sample.

      MDA content was determined via the method of Pan et al.[10]. One gram of pear fruit tissue was homogenized in 8 mL of trichloroacetic acid (TCA, 100 g/L), the homogenate was centrifuged for 20 min at 4 °C, 2 mL of supernatant liquid was mixed with 2 mL of 0.67% (w/v) thiobarbituric acid (TBA), and the mixture was boiled in 100 °C water for 30 min and centrifuged again after cooling. Finally, the supernatant was used to measure the absorbance at 450, 532 and 600 nm. The MDA content was calculated according to the following formula:

      MDA(molkg1)=[6.452×(A532A600)0.559×A450]×VtVs×W×100

      where Vt = total volume of extract (mL); Vs = the extract volume (mL); W = fresh weight of sample (kg); and A532, A600 and A450 represent the absorbance values at 532 nm, 600 nm and 450 nm, respectively.

    • The total RNA of pear fruit tissue was isolated using an RNA extraction kit (Huayueyang Biotech Co., Ltd., Beijing, China). The total RNA concentration was measured by a spectrophotometer. First-strand cDNA was synthesized with a Prime Script RT reagent kit (TaKaRa, Dalian, China) following the manufacturer's protocols. The prepared cDNA was kept at −80 °C for RT-qPCR.

      The expression levels of six defence-related genes were analysed using RT-qPCR with SYBR® Premix (Takara, Dalian, China). The specific primers of these genes for RT-qPCR were obtained from the literature (Table 1). The PCR program was set as follows: 95 °C for 30 s, followed by 40 cycles at 95 °C for 5 s, 60 °C for 30 s and 55 °C for 30 s. The 10-μL reactions included 3.4 μL of ddH2O, 1 μL of diluted cDNA strand, 5 μL of SYBR® Premix Ex Taq (TaKaRa, Dalian, China), and 0.3 μL of each primer. The expression levels of defence-related genes were normalized by actin and calculated using the 2−ΔΔCᴛ method[40, 41], and 3 replicates were measured for each sample. The RT-qPCR analysis was based on the primer sequences shown in Supplemental Table S1.

    • SPSS 17.0 (SPSS Inc., Chicago, IL, USA) was used to process and analyse the data, and significant differences were determined by the Duncan multiple-range test at p = 0.05.

      • This work was funded by the National Natural Science Foundation of China (32160399) and Jiangxi Province Fruit and Vegetable Postharvest Processing Key Technology and Quality and Safety Collaborative Innovation Center Project (JXGS-03).

      • The authors declare that they have no conflict of interest.

      • Copyright: 2022 by the author(s). Exclusive Licensee Maximum Academic Press, Fayetteville, GA. This article is an open access article distributed under Creative Commons Attribution License (CC BY 4.0), visit https://creativecommons.org/licenses/by/4.0/.
    Figure (5)  Table (1) References (41)
  • About this article
    Cite this article
    Chen M, Luo Z, Zhao X, Li S, Wu F, et al. 2022. Exogenously applied methyl jasmonate increased the resistance of postharvest pear fruit to blue mold. Fruit Research 2:11 doi: 10.48130/FruRes-2022-0011
    Chen M, Luo Z, Zhao X, Li S, Wu F, et al. 2022. Exogenously applied methyl jasmonate increased the resistance of postharvest pear fruit to blue mold. Fruit Research 2:11 doi: 10.48130/FruRes-2022-0011

Catalog

  • About this article

/

DownLoad:  Full-Size Img  PowerPoint
Return
Return