













-
Timely and accurate diagnosis of early pregnancy of cows is critical for cattle farms. Early detection of pregnancy in cows allows farmers to shorten calving intervals, identify non-pregnant animals promptly, and rebreed them sooner, reducing feeding costs. The methods for pregnancy diagnosis have been developed based on the behavioral and physical changes of the pregnant cows, such as sudden increased walking activity, and the appearance of reproductive organs[1,2]. Meanwhile, the changes of hormones or metabolites in serum or urine of pregnant cows such as estradiol, progesterone, early pregnancy factors (EPF), and pregnancy-associated glycoprotein (PAGs) have been used to develop ELISA or RIA kits for early pregnancy diagnosis[3−6].
The rectal palpation of the uterine contents is a routine procedure to detect the pregnancy of cows, which is usually performed from 40- to 60-d post artificial insemination (AI). The pregnancy of cows can be detected by B-mode ultrasonography as early as 26-d post AI, which is reliable, and relatively simple, but requires high value equipment and skilled personnel[7]. Other diagnostic methods for early pregnancy, such as near-infrared spectroscopy and digital recording tools, could not meet the needs of large-scale farms due to the low accuracy and high economic cost[8,9]. Therefore, it is important to search for simple procedures with low cost for early pregnancy detection.
Currently, the hormones and proteins in the urine or blood have been used as detection targets to develop cow early pregnancy rapid test kits. The level of progesterone in cow blood or milk could be tested at least 21- to 24-d post AI[10]. However, at certain times during the estrous cycle of the cow, the progesterone level may also be elevated, thus high progesterone does not always indicate the pregnancy and could cause false positives.
Pregnancy associated glycoproteins (PAGs) are glycoproteins that are generated by mononuclear and binuclear cells in the placenta and uterus[11]. For bovine species, 22 PAG genes have been identified[12]. For cows, PAGs can be detected in the blood of females as early as 15- to 22-d post AI[13]. On the 22-d of pregnancy, the level of PAG could be higher than 2 ng·mL−1 which was significantly different between pregnant and non-pregnant cows[14,15]. Detection of PAGs as a method for pregnancy diagnosis is more accurate from day 28 and onward and remained at a high level[16]. After calving, PAG levels in maternal blood begin to decline toward baseline levels but remain relatively high for 80–100 d postpartum[16]. Therefore, testing prior to 90-d after calving may result in a false positive result[16]. Similar to progesterone testing, there are no false negatives associated with PAG testing. The other molecules to detect are early pregnancy factors (EPF), which appear in the serum of pregnant animals to inhibit the maternal immune response and maintain pregnancy during embryonic development[17]. It can be detected in humans, sheep, cows, and pigs[18−20]. For cows, EPF can be detected in milk and serum as early as 24 h after fertilization[21]. At the end of pregnancy, or 24 to 48 h after embryo death, the EPF concentration rapidly declines, so the change of EPF in milk or serum can be applied to examine early embryonic development and pregnancy diagnosis[22]. However, EPF is not specifically generated during pregnancy, but can also appear in the serum of patients and some animals with tumors[23]. EPF and PAGs have been used as markers for the early pregnancy of cows in recent years with obvious limitations. The efforts to look for unique biomarkers in the serum or urine of pregnant cows should be continued with advanced methodology to promote the efficiency and accuracy of early pregnancy methods for cows[24].
Proteomics and metabolomics are sensitive enough to detect the subtle differences in biological samples at the molecular level with high throughput. With these powerful methods, researchers have discovered biomarkers in body fluids to achieve rapid diagnosis of diseases and explore various physiological processes[25,26]. A total of 784 blood samples from 30 pregnant women were collected and analyzed using non-targeted metabolomics[27]. The results revealed dynamic shifts in metabolite profiles throughout gestation, with two to three metabolites identified as potential predictive markers for delivery timing[27]. Meanwhile, proteomics and metabolomics have been used to screen the early gestation markers for sows and ewes and demonstrated several protein candidates for the development of pregnancy testing kits[28,29]. In previous research, 2-D gel electrophoresis, label-free liquid chromatography tandem-mass spectrometry (LC−MS/MS), and iTRAQ proteomics were applied to examine the proteins in uterine or endometrial tissue of cows at early gestation and several differentially expressed proteins (DEPs) were identified which may be related to the implantation and development of embryos[30]. Recently, multi-omics studies have been applied to identify low-abundance biomarkers (e.g., proteins, miRNAs) in female serum to predict successful embryo implantation, pregnancy, and health outcomes[31−33]. These advances suggest the potential to redefine 'early' pregnancy diagnosis for cows and develop cost-effective assays for on-farm use. However, few studies using proteomics or multi-omics have been performed to detect the DEPs related to cow pregnancy.
To identify novel markers for early pregnancy in cows, serum samples from pregnant and non-pregnant cows were collected on the 28-d post AI, and then analyzed by the latest Four-Dimensional Data-Independent Acquisition (4D-DIA) proteomics and Liquid Chromatography Mass Spectrometry (LC/MS) metabolomics. The results revealed that levels of 43 metabolites and 18 proteins were significantly altered in cow serum during early pregnancy. The levels of the top five differentially expressed proteins were further measured in pregnant and non-pregnant cow serum using ELISA kits. It was found that the levels of APOA1, HGR, CFH, and MYH1 in the serum of pregnant cows were significantly elevated compared to those in non-pregnant cows. Thus, these four proteins could serve as potential markers to detect pregnancy of cows at an earlier stage.
-
The experiments were conducted using adult cows (Bos taurus) at the experimental facilities in Yongning, Ningxia, China (latitude 38°12' N, longitude 105°81' E) in July 2023. All the experimental procedures involving animal handling were performed in accordance with the guidelines of the Institutional Animal Care and Use Committee at the China Agricultural University. For the current experiment, 30 Simmental cows, 3 years old with similar body weights, and housed in the same facility were selected. The cows received CIDR-PG treatment according to a previous study[34] and then artificial insemination was performed as described in Fig. 1. Whole blood samples were collected on the 28-d post AI. The samples were collected in coagulant tubes, allowed to clot at 4 °C for 2 h, and then centrifuged at 4,000 rpm for 10 min. The serum was subsequently isolated and stored at −80 °C for further analysis.
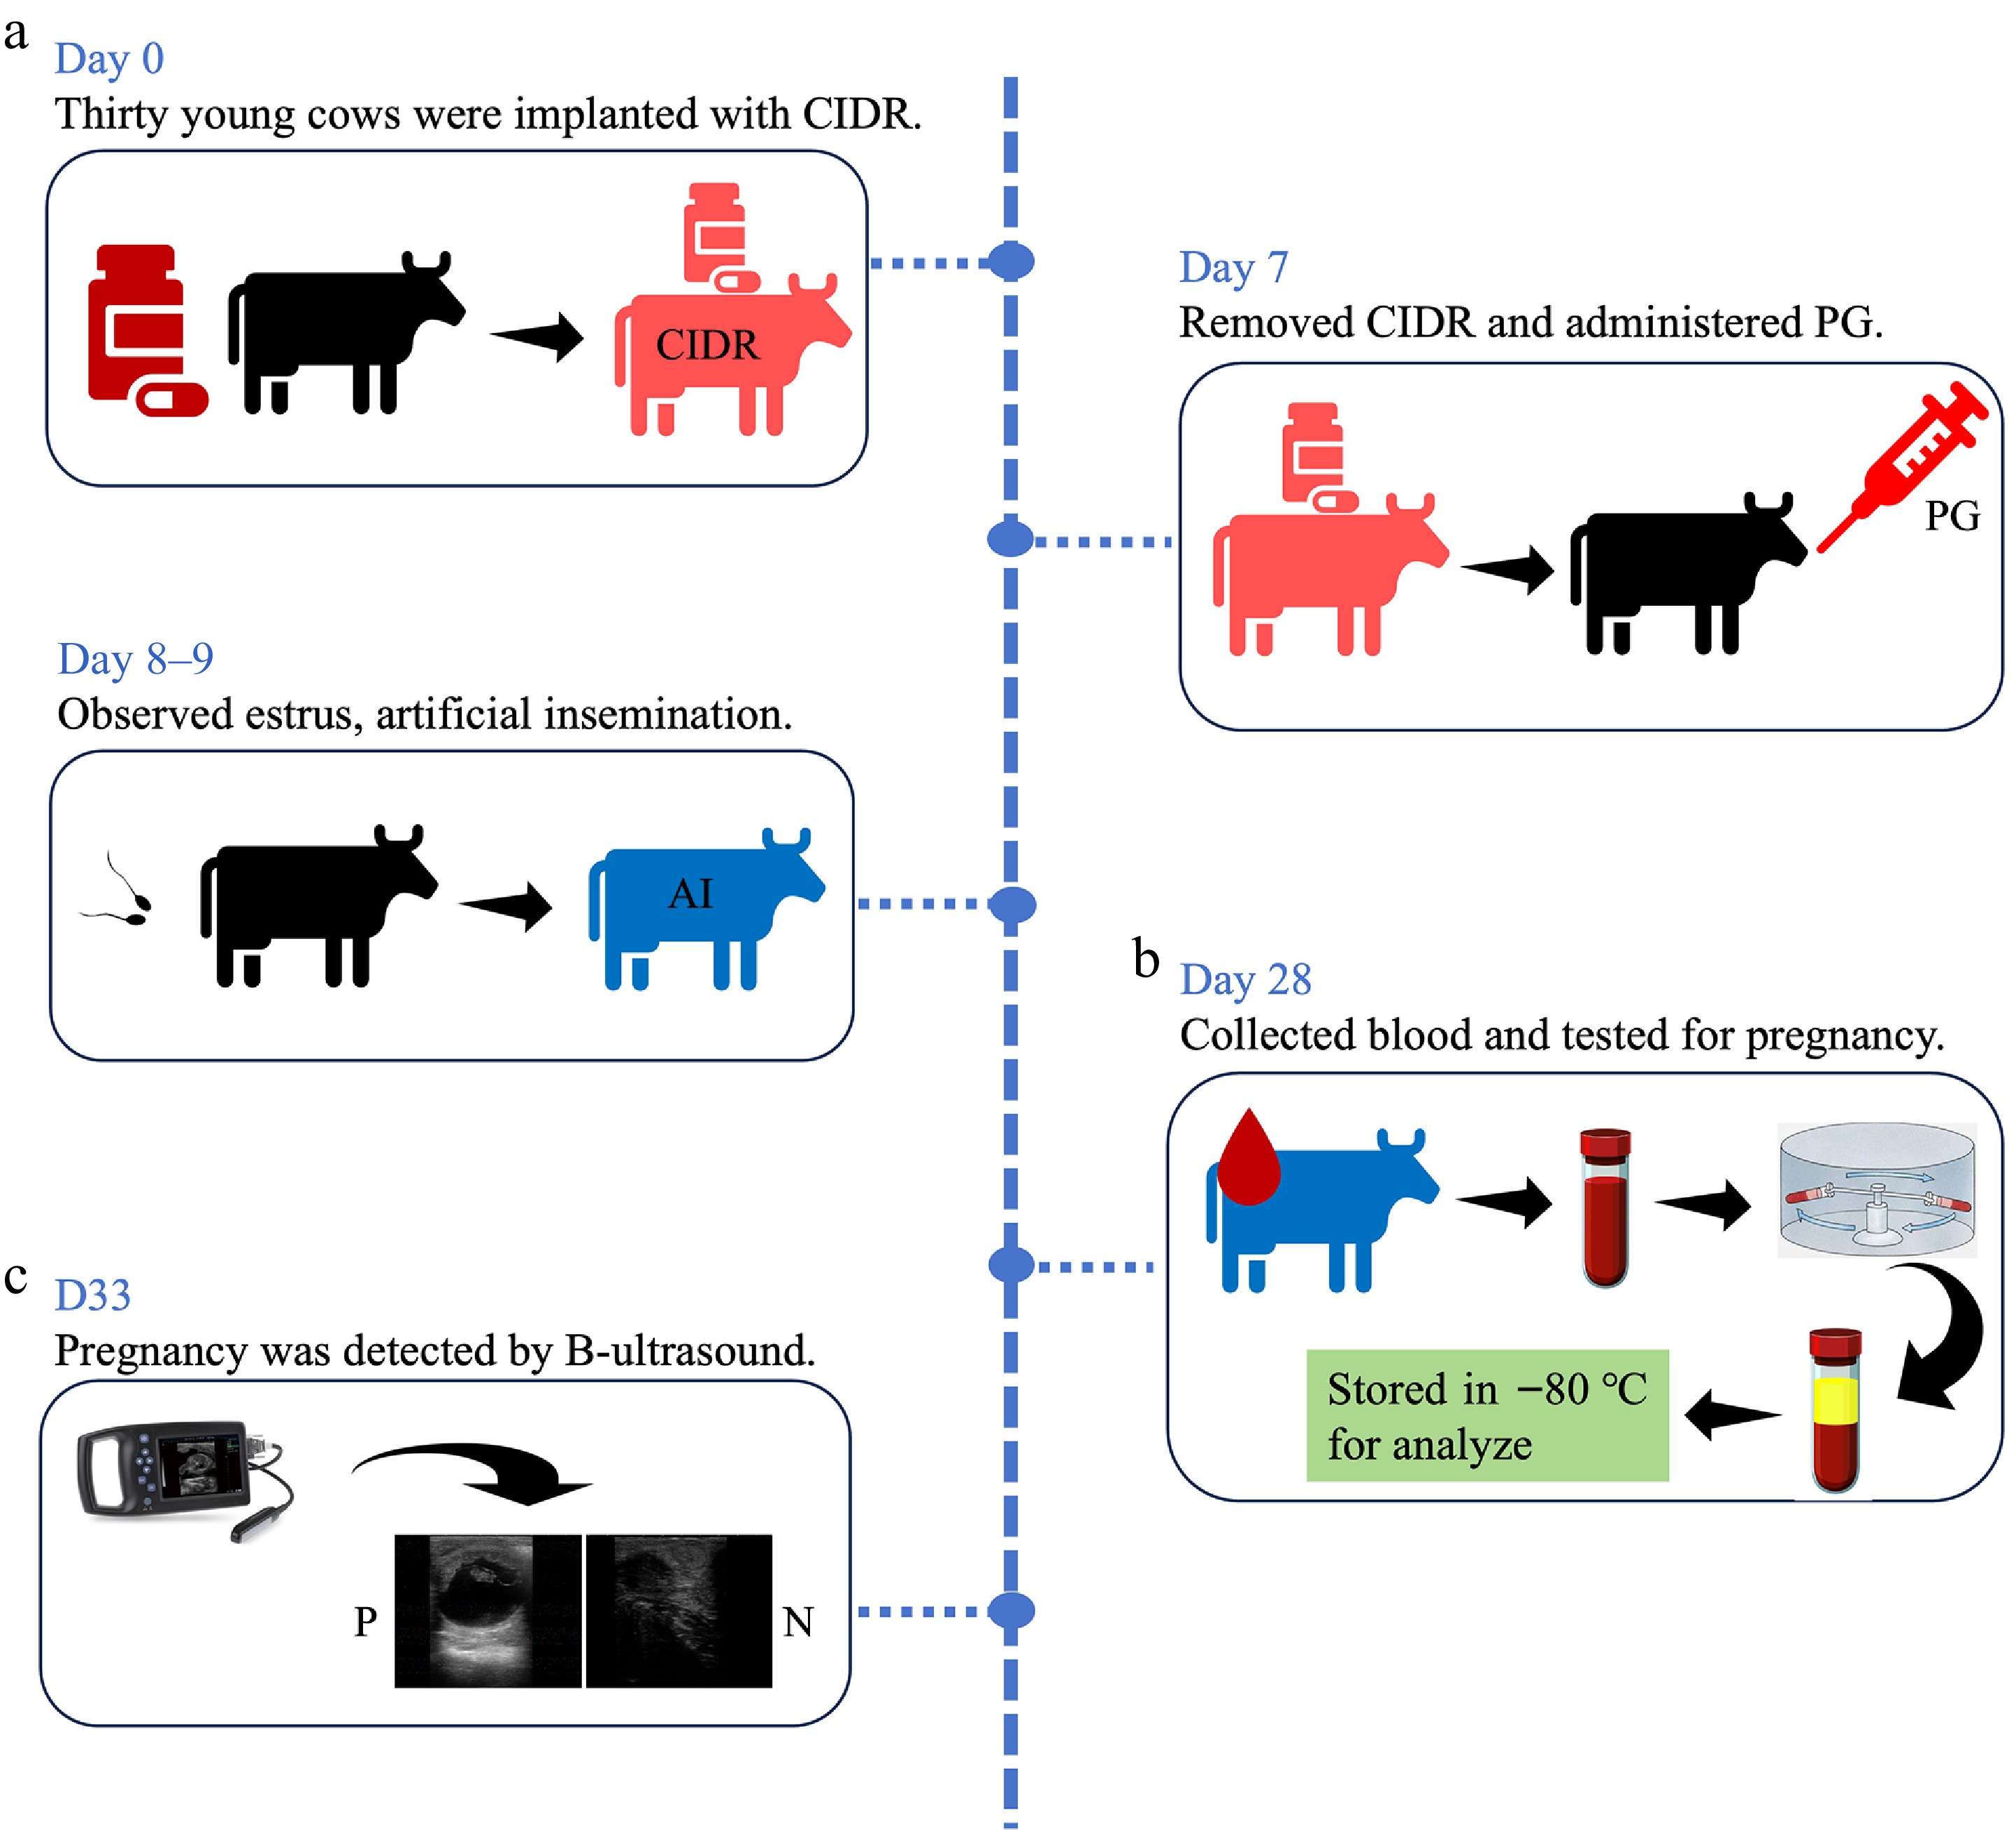
Figure 1.
Experimental design and pregnancy diagnosis. (a) Experimental design for AI and sample collection for each group. (b) Results for pregnancy diagnosis using rapid visual test kits. (c) The results for pregnancy diagnosis using B mode ultrasound.
Metabolomic analysis of cow serum
Serum sample preparation and quality control
-
Serum samples from six pregnant cows (P1, P2, P3, P4, P5, and P6) and six non-pregnant cows (N1, N2, N3, N4, N5, and N6) were used for metabolome examination. To ensure the accuracy of the metabolome analysis, a pooled quality control (QC) sample was prepared by combining equal volumes of all samples and was analyzed using the same procedures and conditions.
LC-MS/MS examination
-
Metabolite extraction was conducted following the protocol outlined in our previous study[29]. Briefly, 100 μL serum from each sample was taken out and aliquoted into 1.5 mL centrifuge tubes containing 0.02 mg/mL L-2-chlorophenylalanine in a 400 μL solution (acetonitrile : methanol = 1:1 (v:v)). Then, the samples were vortexed for 30 s, sonicated at 4 °C (40 kHz) for 30 min, and then stored at −20 °C for 30 min. Afterward, the samples were centrifuged at 13,000 g for 15 min. The supernatant was carefully discarded, and the remaining pellet was dried under a gentle stream of nitrogen gas. The dried supernatant was dissolved in 100 μL of solvent, subjected to ultrasonication (40 kHz) for 5 min, and centrifuged again at 13,000 g for 10 min. The final supernatant was transferred to sample vials for analysis. Finally, the metabolite profiling was performed using a SCIEX UPLC-Triple TOF 5600 system equipped with an ACQUITY HSS T3 column (Waters Corporation, USA). Data acquisition was carried out in Data-Dependent Acquisition (DDA) mode.
Data preprocessing and metabolite annotation
-
Raw data from LC/MS analysis was processed using Progenesis QI software (Waters Corporation, USA). A three-dimensional data matrix was generated and exported in CSV format. To ensure data integrity, internal standard peaks, and false-positive peaks were systematically removed from the matrix. Metabolites were identified using the HMDB (
www.hmdb.ca ), Metlin (https://metlin.scripps.edu ), and Majorbio databases. Additionally, to minimize errors arising from procedural or instrumental variations, variables with a relative standard deviation (RSD) greater than 30% in the QC samples were excluded from further analysis. This rigorous filtering process ensured the reliability and precision of the metabolomic data.Differential metabolite identification and pathway analysis
-
Intergroup differences were analyzed using the post-QC data matrix. Then, the Orthogonal partial squares least discriminant analysis (OPLS-DA), Student's t-test, and fold-change analysis were all performed using the R package (Version 1.6.2). Metabolites with variable importance in projection (VIP) > 1 and p < 0.05 were typically considered significantly different. VIP scores quantify the contribution of each variable using OPLS-DA model with R2 = (0, 0.4531), Q2 = (0, −0.2938). All metabolites were screened and mapped to biochemical pathways through metabolic enrichment and pathway analysis using the Kyoto Encyclopedia of Genes and Genomes (KEGG) database (
www.genome.jp/kegg ).Proteomic analysis of cow serum
Serum samples selection
-
Serum samples from three pregnant and three non-pregnant cows, were selected for proteomic profiling. Proteins in the serum were extracted using a lysis buffer containing 0.5% sodium deoxycholate with 1× phosphatase inhibitor cocktail (Sigma-Aldrich, USA). Protein concentration was quantified via BCA assay (Thermo Fisher Scientific, USA) and then validated by Coomassie-stained SDS. Protein quantification was performed using sodium dodecyl sulfate-polyacrylamide gel electrophoresis (SDS-PAGE).
Proteolytic hydrolysis and peptide quantification
-
Proteolytic hydrolysis was performed following the protocol described in our previous study[29]. Briefly, protein samples were mixed with lysis buffer and triethylammonium bicarbonate buffer (TEAB) to achieve a final concentration of 100 mM. Iodoacetamide was then added to a final concentration of 40 mM, and the reaction proceeded at room temperature for 40 min. Pre-cooled acetone (6:1 v/v) was added to each tube, and samples were incubated at −20 °C for 4 h. After incubation, the samples were centrifuged at 10,000 g for 20 min to pellet precipitated proteins. Following trypsin digestion, peptides from each sample were concentrated via vacuum concentration (Christ, Germany), and then extracted and redissolved with 0.1% trifluoroacetic acid (TFA). The supernatant was desalted using a Sep-Pak C18 filter cartridge (Waters, USA). Finally, peptide quantification was performed according to the manufacturer's protocol for the peptide analysis kit (Thermo Fisher Scientific, USA).
4D-DIA mass examination
-
Based on peptide quantification results (including iRT peptides for retention time calibration), samples were dissolved in mass spectrometry loading buffer (2% ACN, 0.1% formic acid). The samples were then analyzed using an EASY-nLC system (Thermo, USA) coupled to a mass spectrometer (timsTOF Pro2, Bruker, German). Then, data-independent acquisition (DIA) was performed in DIA-PASEF mode as previously described, using the online platform of Majorbio Cloud Platform (
www.majorbio.com )[29,35]. MS spectra were acquired across a mass range of 400−1,200 m/z and an ion mobility range of 0.57−1.47 Vs·cm−2, with both accumulation and ramp times set to 100 ms. Each acquisition cycle consisted of one full MS scan followed by ten PASEF MS/MS scans, with dynamic exclusion set at 0.4 min.Protein identification and annotation
-
The DIA-PASEF raw data was processed using Spectronaut software (Version 14) with a spectral library generated from DDA-PASEF data. Retention time calibration was performed using iRT peptides. For quantitative analysis, we applied the following stringent criteria: maximum of six peptides per protein, maximum of three fragment ions per peptide, protein false discovery rate (FDR) ≤ 1%, peptide FDR ≤ 1%, peptide confidence ≥ 99%, and XIC width tolerance ≤ 75 ppm. Additionally, peak areas were extracted for quantification, with shared peptides and post-translationally modified peptides systematically excluded from the analysis.
Differential protein analysis and enrichment analysis
-
Protein expression differences between groups were assessed through sample correlation analysis and principal component analysis (PCA) using R packages (v1.6.2) as previously described[35]. Differential expression of proteins (DEPs) was determined with the following criteria: p < 0.05, fold change (FC) > 1.5 or < 0.67 (equivalent to |log2FC| > 0.58). For more stringent identification of top DEPs was performed based on thresholds of fold change (> 1.2 or < 0.83) (|log2FC| > 0.26) and p < 0.05. Functional annotation of all identified proteins was performed using Gene Ontology Enrichment Analysis (GO) (
http://geneontology.org ) and KEGG pathway enrichment analysis (www.genome.jp/kegg ).Serum protein quantification and statistical analysis
-
All 30 serum samples were subjected to quantitative analysis of the levels of APOA1, HGR, CFH, MYH1, and A2M using commercially available ELISA kits (Sailuofei Biotechnology, Wuhan, China) according to the manufacturer's protocols. Statistical comparisons between groups were performed using two-tailed Student's t-tests, with significance thresholds set for p < 0.05 or for p < 0.01.
-
To confirm the pregnancy status of the cows, all 30 cows underwent examination at 33-d post AI, using a real-time B-type ultrasound scanner. The results indicated that 22 cows were not pregnant, while eight were pregnant (Fig. 1). Based on the ultrasound findings, the serum samples were categorized into either the pregnant (P) or non-pregnant (N) group for further analysis.
Metabolomic analysis of serum
-
To assess the metabolomics of cow serum at 28-d post AI, six serum samples from pregnant cows and six non-pregnant cows were analyzed by LC/MS. As shown in Fig. 2a, the correlation of samples was demonstrated by PLS-DA score plot, which shows a significant degree of separation between the P and N. A total of 1,377 metabolites were detected in the serum of pregnant and non-pregnant cows (Supplementary Table S1). Of these, 824 metabolites were identified as positive ions, with 446 found in the KEGG database. Meanwhile, 553 metabolites were identified as negative ions, of which 302 were found in the KEGG database. Notably, there were five unique metabolites in the pregnant group and four unique metabolites in the non-pregnant group (Fig. 2b & c). All metabolites were further examined using the KEGG and HMDB databases. As shown in Fig. 2d, according to KEGG compound classification, the most abundant compounds were phospholipids and amino acids. KEGG Pathway analysis revealed that lipid and amino acid metabolism were the most prominent pathways (Fig. 2e). Meanwhile when metabolites were examined in the HMDB database (Fig. 2f), 501 compounds were identified as lipids and lipid-like molecules, which are the most abundant compounds.
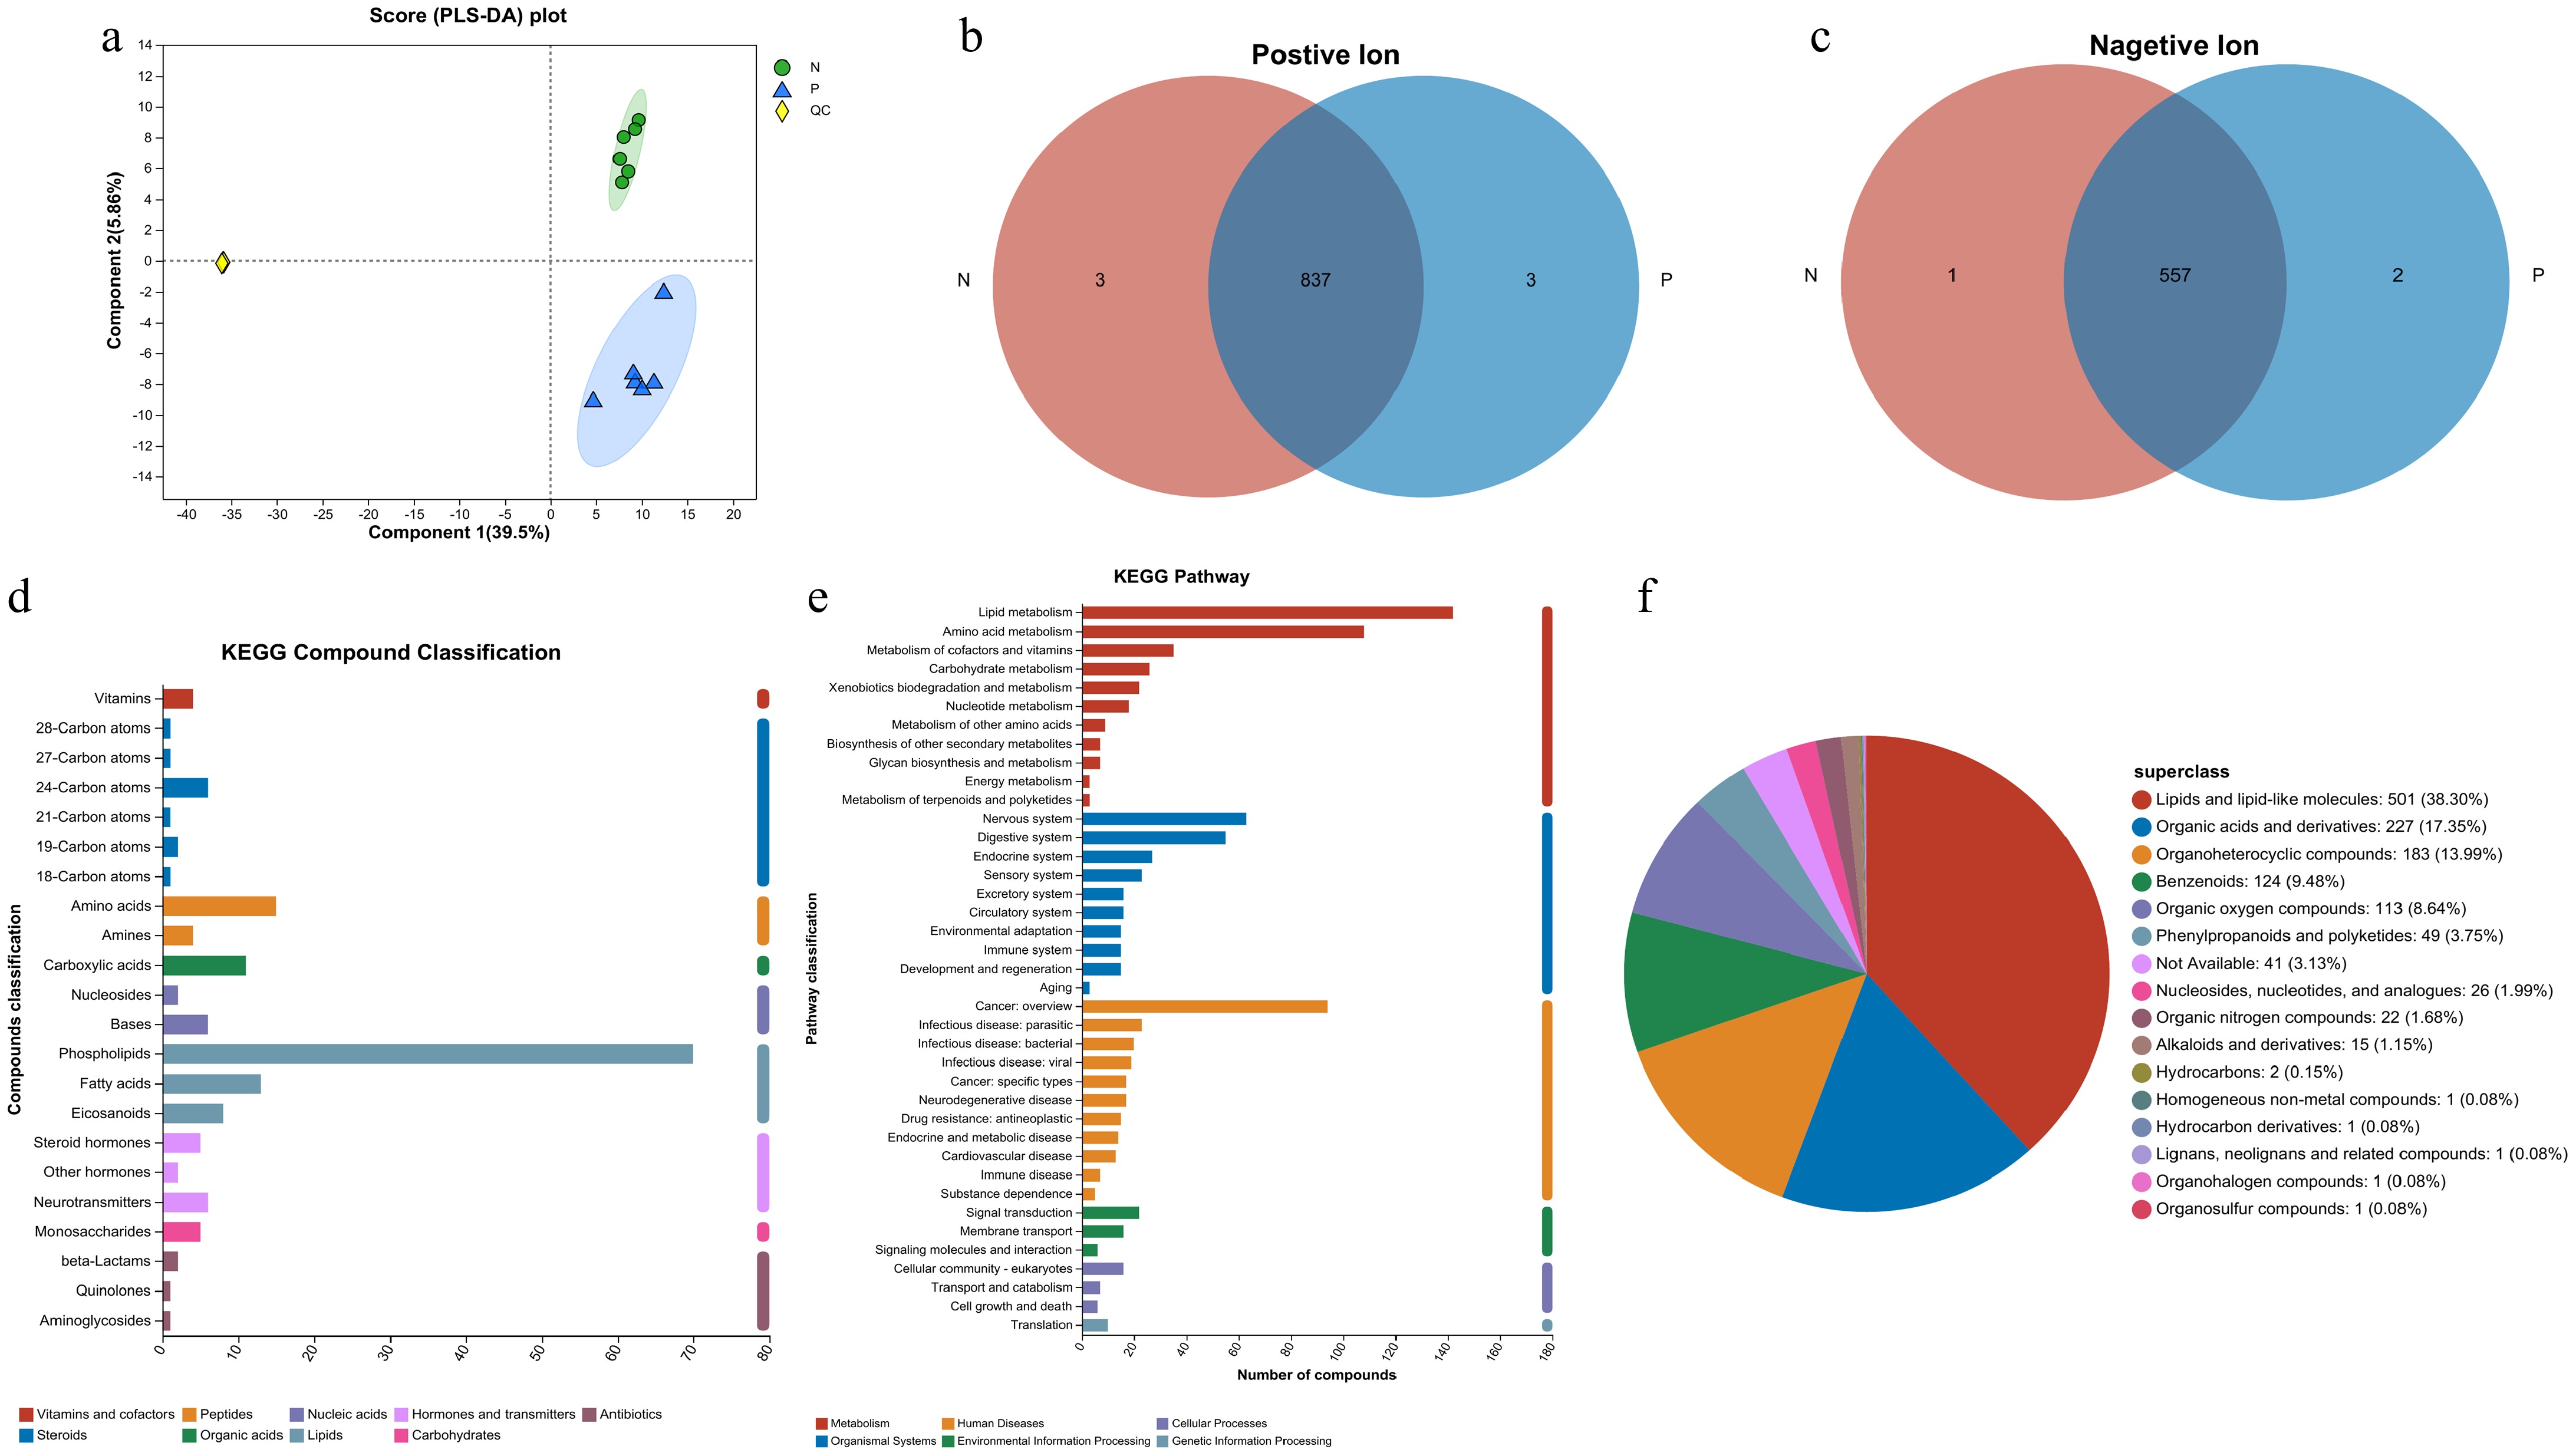
Figure 2.
Analysis of the metabolites detected in the serum samples. (a) PLS-DA analysis score chart. (b), (c) Venn diagrams for sample comparison (P represents the pregnant cows and N represents the non-pregnant cows). (d) Classification of metabolites based on KEGG Compounds analyses. (e) Classification of pathways based on KEGG. (f) Pie chart of compounds classification based on the HMDB database.
Differential metabolite examination
-
The difference of metabolites between the two groups was examined, it was found that 20 metabolites in the serum of pregnant cows were elevated compared to those of non-pregnant cows. Conversely, the concentration of 23 metabolites was lower in pregnant cows than in non-pregnant cows (Fig. 3a). The detailed metabolites are listed in Table 1. Based on pathway analysis using the KEGG database, these differential metabolites were clustered, and lipid metabolism emerged as one of the top pathways (Fig. 3b & c). Subsequently, variable importance in projection (VIP) was calculated for all 43 differential metabolites as shown in Fig. 3d, 2-Amino-3,4-dimethylimidazo[4,5-f] quinoline, Henagliflozin, and Tetradecanoylcarnitine were identified as the top three metabolites. Figure 2e−j displays the VIP values of the top six metabolites. It is evident that the lipid metabolism and amino acid metabolism of cows change after pregnancy. However, the fold changes of all differential metabolites were not sufficient to serve as a biomarker for the development of a visual diagnostic kit for pregnancy.
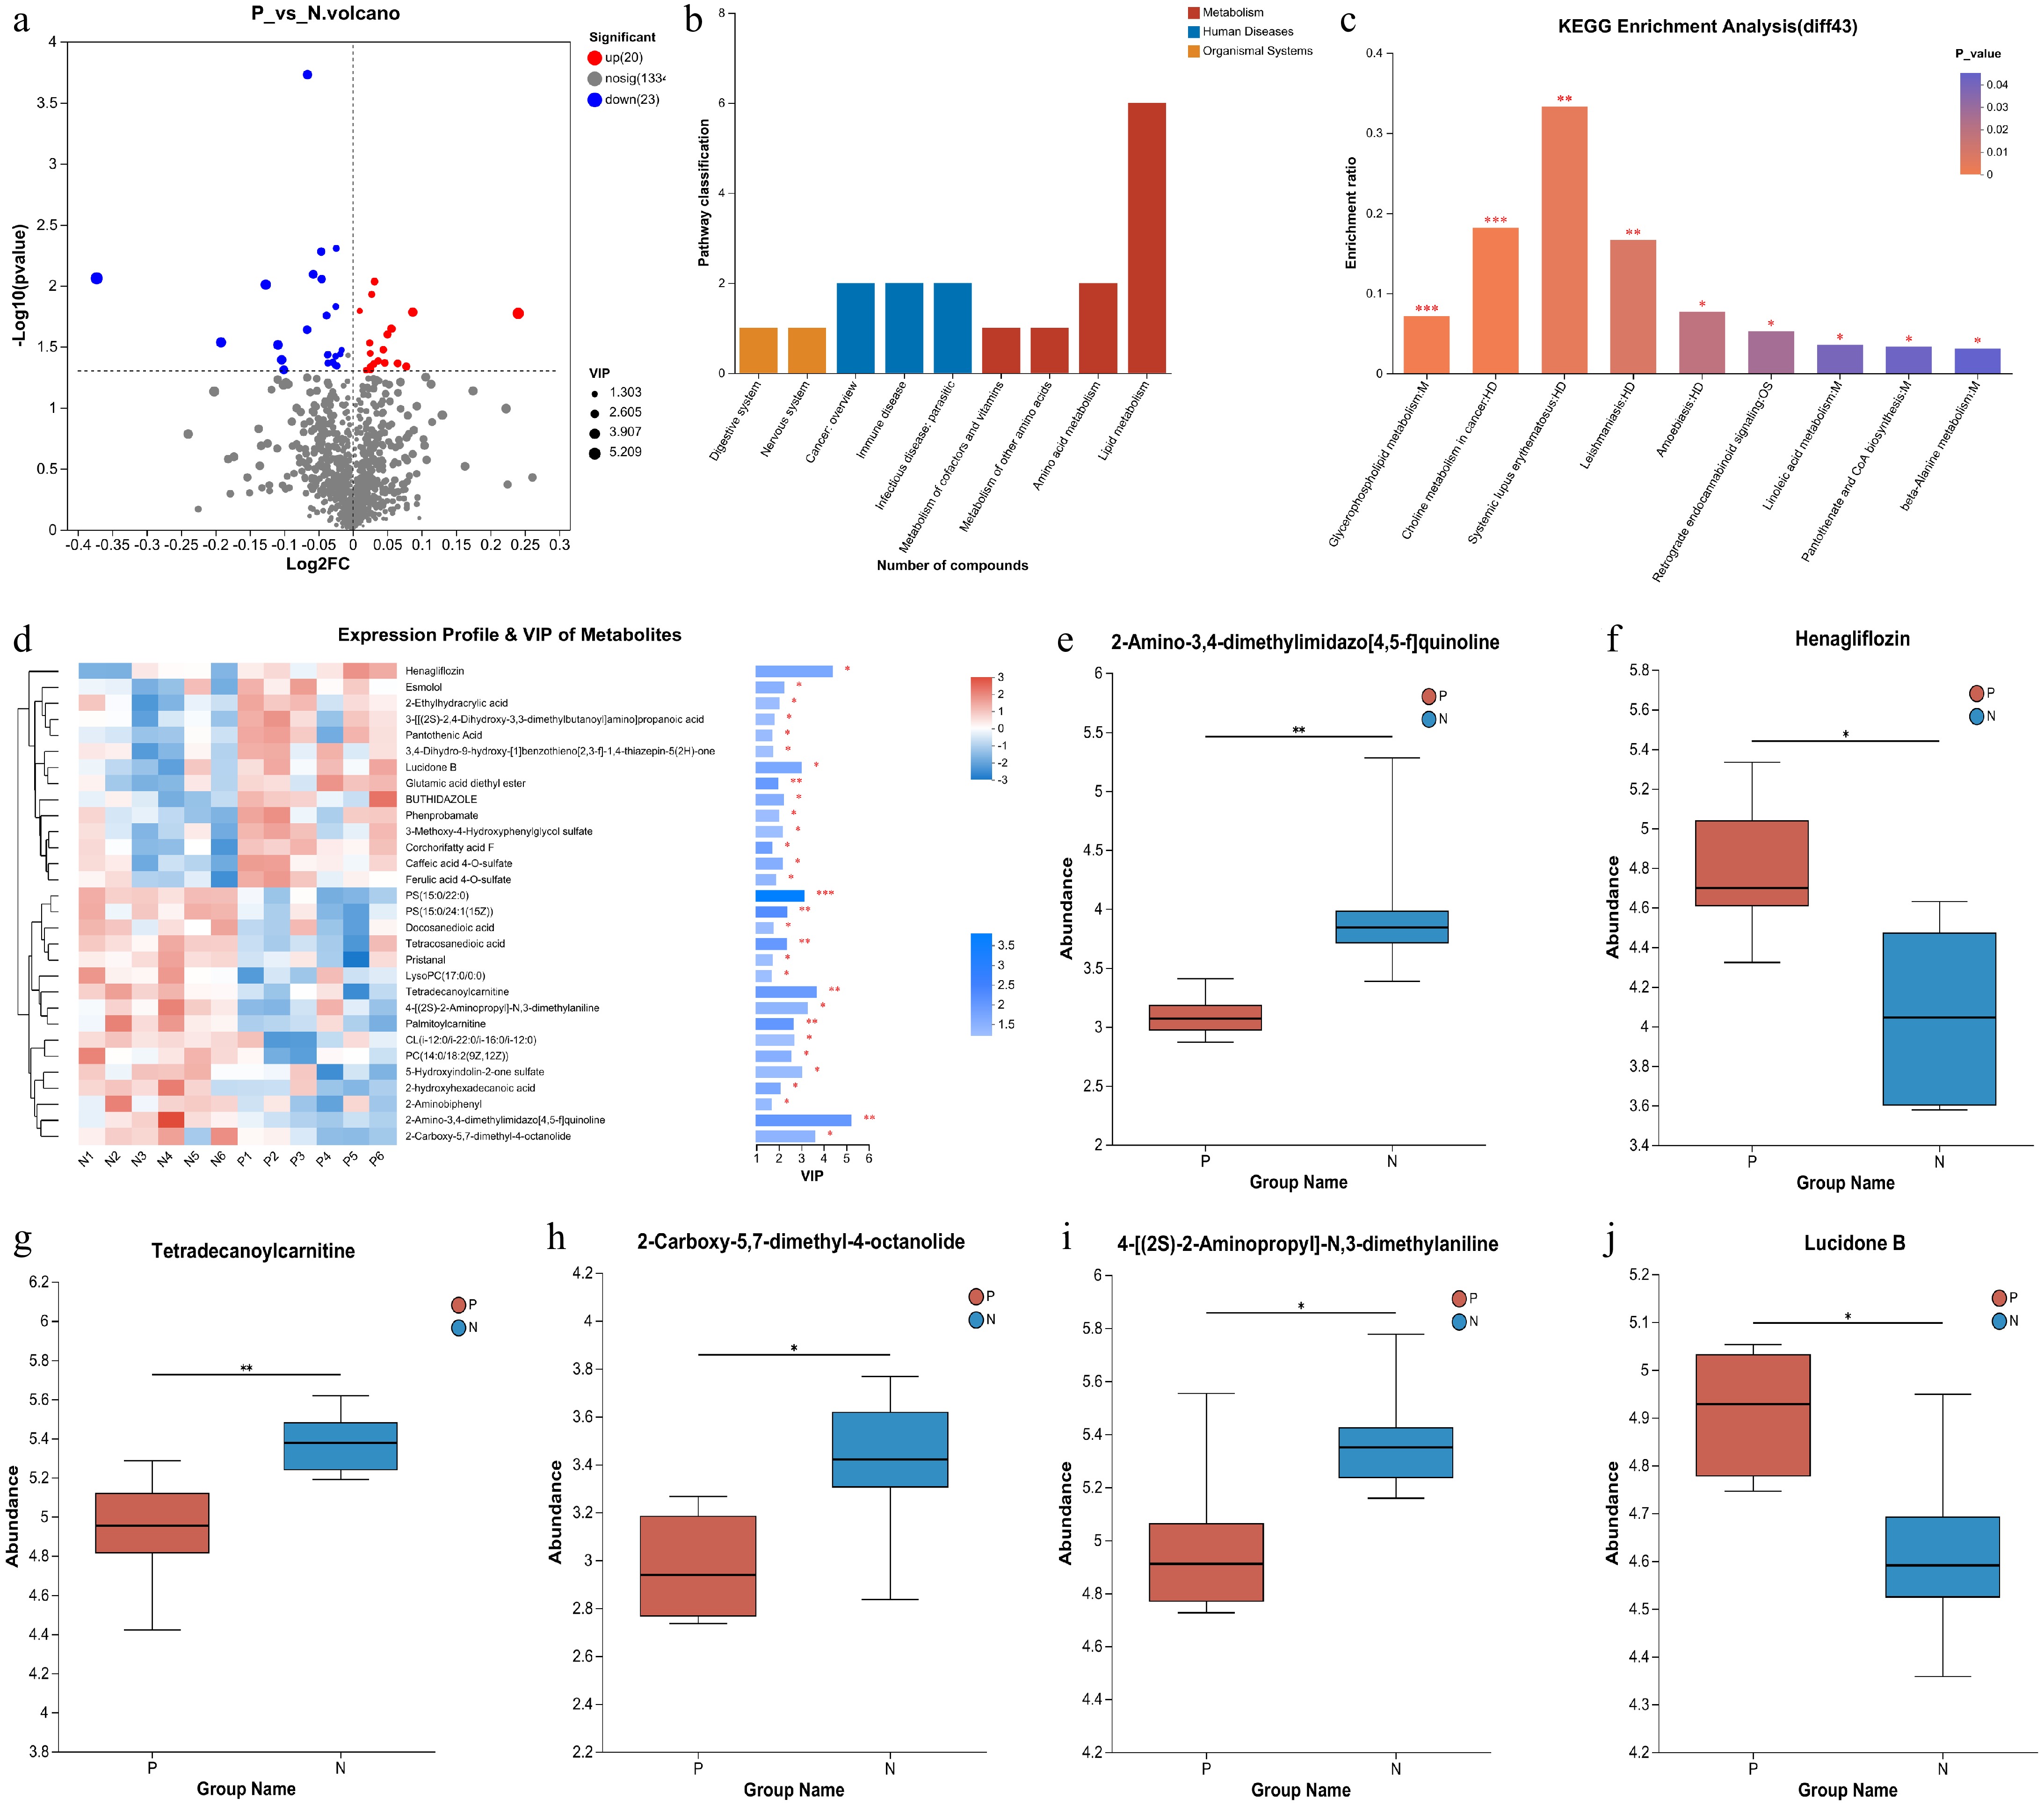
Figure 3.
Analysis of the differential metabolites between pregnant and non-pregnant cows at 28-d post AI. (a) Volcano plot for differential metabolites. The red dots represent the up-regulated metabolites and the blue dots represent the down-regulated metabolites. (b) KEGG classification of the 43 differential metabolites. (c) KEGG pathway enrichment analyses of the 43 differential metabolites. (d) Expression profile of the 43 differential metabolites and their VIP values. (e)−(j) The differential metabolites ranked as the top six based on their VIP values.
Table 1. Differential metabolites between pregnant and non-pregnant cows at 28-d post AI.
Metabolite Regulate p-value FC (P/N) Glutamic acid diethyl ester Up 0.009258 1.0222 2-Amino-3,4-dimethylimidazo[4,5-f]quinoline Down 0.008703 0.7724 Xi-4-Hydroxy-4-methyl-2-cyclohexen-1-one Down 0.01485 0.983 4-Heptenoic acid Down 0.03647 0.9874 CL(i-12:0/i-22:0/i-16:0/i-12:0) Down 0.04905 0.9328 PC(14:0/18:2(9Z,12Z)) Down 0.02298 0.9549 Corchorifatty acid F Up 0.0118 1.0192 12-hydroxyicosanoic acid Down 0.03376 0.9888 Palmitoylcarnitine Down 0.008085 0.9609 4-[(2S)-2-Aminopropyl]-N,3-dimethylaniline Down 0.03061 0.9273 Tetradecanoylcarnitine Down 0.009815 0.916 Harmalol Down 0.03669 0.9754 Butyl 4-aminobenzoate Down 0.03791 0.9828 Cerulenin Up 0.04648 1.0181 4-(1-Hydroxy-2-methoxyethyl)-5-(hydroxymethyl)-2-methylpyridin-3-ol Down 0.04323 0.9752 LysoPC(17:0/0:0) Down 0.04554 0.9841 2-Aminobiphenyl Down 0.03701 0.9748 3-[[(2S)-2,4-Dihydroxy-3,3-dimethylbutanoyl]amino]propanoic acid Up 0.04388 1.0214 Caffeic acid 4-O-sulfate Up 0.02259 1.04 3,4-Dihydro-9-hydroxy-[1]benzothieno[2,3-f]-1,4-thiazepin-5(2H)-one Up 0.04879 1.018 3-Allylphenol sulfate Up 0.02949 1.0172 BUTHIDAZOLE Up 0.02255 1.0395 P-coumaroyltriacetic acid lactone Up 0.01615 1.007 Pristanal Down 0.04499 0.9827 Tetracosanedioic acid Down 0.008841 0.9692 Docosanedioic acid Down 0.04257 0.9799 2-Hydroxymyristic Acid Down 0.004952 0.9834 2-hydroxyhexadecanoic acid Down 0.01758 0.9739 Henagliflozin Up 0.01689 1.1815 PS (15:0/22:0) Down 0.0001862 0.9553 PS (15:0/24:1(15Z)) Down 0.00526 0.9687 Phenprobamate Up 0.04342 1.0463 2-Naphthalenesulfonic acid Up 0.04935 1.0135 Esmolol Up 0.02516 1.0356 2-Carboxy-5,7-dimethyl-4-octanolide Down 0.02919 0.8756 4-Methyl-1,4-dihydropyridine-3,5-dicarbaldehyde Up 0.03592 1.0178 Ferulic acid 4-O-sulfate Up 0.03354 1.0312 3-Methoxy-4-Hydroxyphenylglycol sulfate Up 0.04608 1.0554 Ascorbic acid 2-sulfate Up 0.04618 1.018 Lucidone B Up 0.01651 1.0623 2-Ethylhydracrylic acid Up 0.04302 1.0328 Pantothenic Acid Up 0.04141 1.0259 5-Hydroxyindolin-2-one sulfate Down 0.04056 0.9308 Proteomics of serum from pregnant and non-pregnant cows
-
The protein level in the serum of pregnant and non-pregnant cows at 28-d post AI were analyzed using 4D-DIA proteomics. A total of 341 proteins were identified (listed in Supplementary Table S2), and six unique proteins for each group of cows (Fig. 4a). KEGG pathway analysis was then conducted, revealing that these proteins could be enriched in 20 signaling pathways including immune system, endocrine system, signal transduction, etc. (Fig. 4b). Meanwhile, the localization of these proteins was also examined, showing that 155 were extracellular proteins and 71 were cytoplasmic proteins (Fig. 4c). The differential proteins between pregnant and non-pregnant cows were determined. As shown in Fig. 4d, the level of eight proteins were elevated, while 10 proteins were down-regulated in the serum of pregnant cows compared to non-pregnant cows. Detailed information on these 18 differential proteins are listed in Table 2. The level of all 18 differential proteins are presented in Fig. 4e, with the top five differential expressions of proteins (DEPs) being apolipoprotein A1 (APOA1), histidine-rich glycoprotein (HRG), complement factor H (CFH), alpha-2-macroglobulin variant 4 (A2M), and myosin heavy chain1 (MYH1). The KEGG pathway enrichment analysis indicates that these DEPs were involved in signaling pathways related to amino sugar and nucleotide sugar metabolism, gap junction, and arginine and proline metabolism as shown in Fig. 4f.
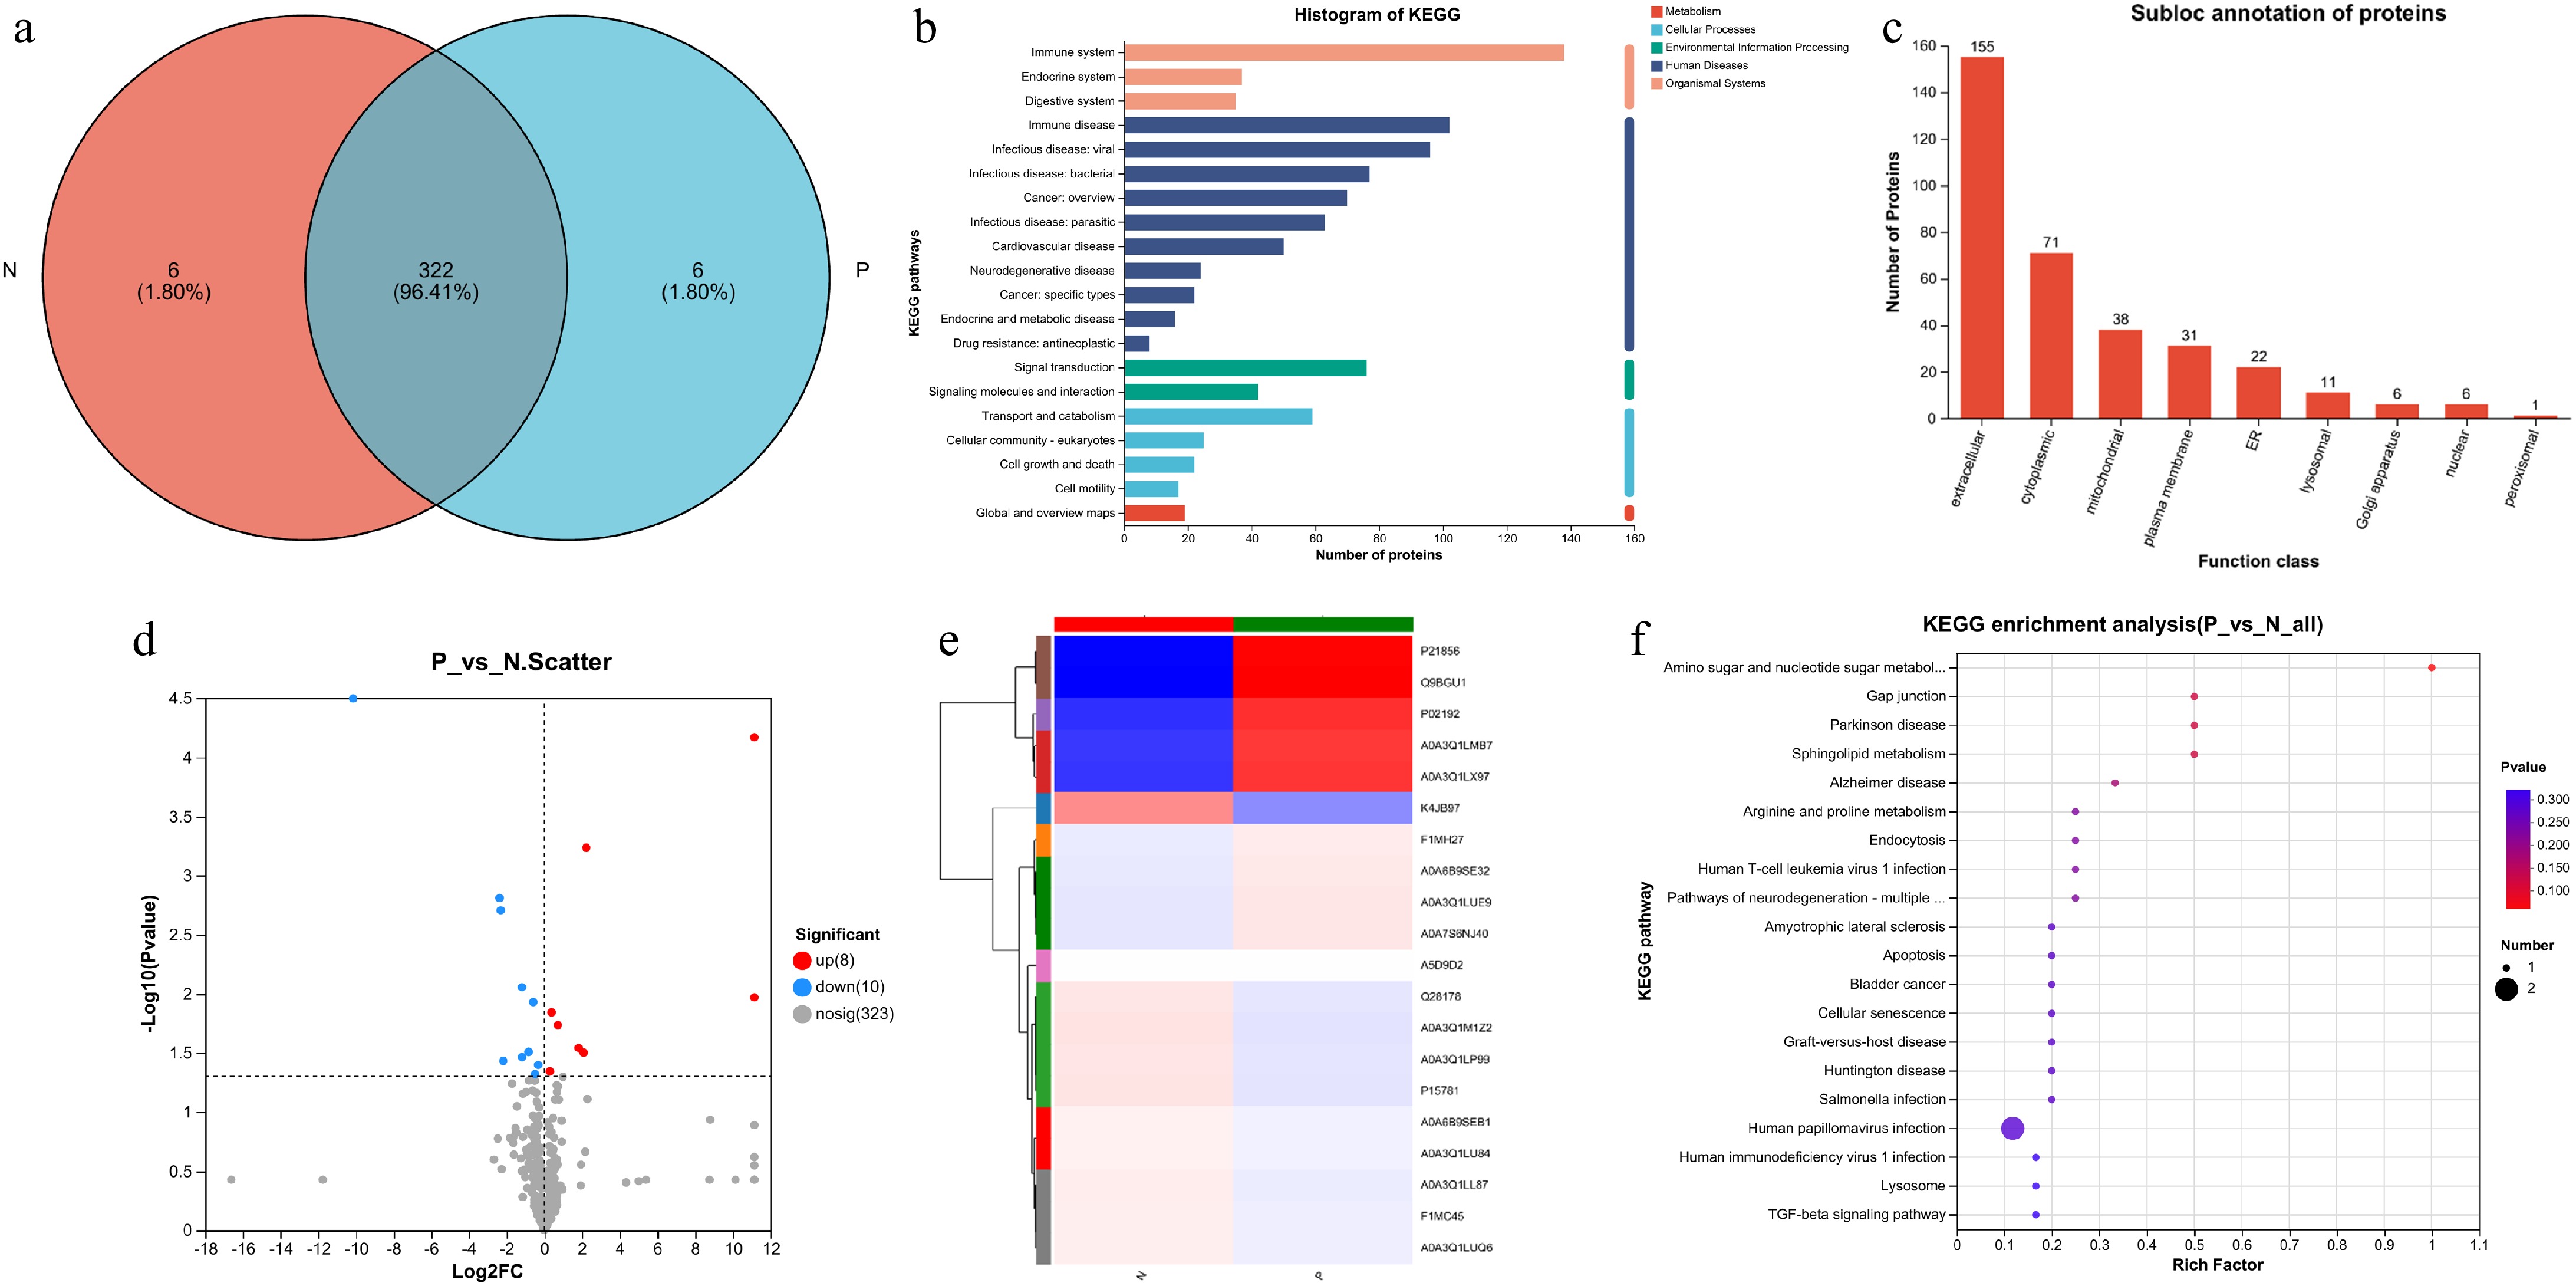
Figure 4.
Proteomic analysis of serum from cows. (a) Venn diagrams for the comparison of samples. (b) Total protein function annotation based on KEGG pathway enrichment analysis. (c) Subcellular localization analysis of the proteins. (d) Volcano plot of proteins detected in cows. The red dots represent the up-regulated proteins and the blue dots represent the down-regulated proteins. (e) Heatmap of all the 18 differential proteins between the two groups. (f) KEGG pathway enrichment analysis for all the 18 differential proteins between the two groups.
Table 2. Differential proteins between pregnant and non-pregnant cows at 28-d post AI.
Accession number Description Relative abundance (P) Relative abundance (N) FC (P/N) p value (P/N) P15497 Apolipoprotein A1 174,509.6198 218,067.4792 0.8003 0.04 A0A6B9SEB1 Ig lamda chain variable region 15,494.6764 35,129.2435 0.4411 0.03427 A0A3Q1LUE9 Ig-like domain-containing protein 36,403.3216 7,784.272 4.677 0.000571 K4JB97 Alpha-2-macroglobulin variant 4 20.7204 23,522.3625 0.000881 2.20E-05 P19035 Apolipoprotein C-III 3,963.2901 5,955.4715 0.6655 0.01173 A0A3Q1LS74 Complement factor H 4,146.1947 3,191.1589 1.299 0.01435 A0A3Q1LU84 Ig-like domain-containing protein 368.7632 838.5748 0.4397 0.008791 F1MH27 chitinase 452.6277 128.7039 3.517 0.02871 A0A6B9SE32 Ig lamda chain variable region 271.1981 64.0567 4.234 0.03137 Q28178 Thrombospondin-1 50.6508 229.5105 0.2207 0.03698 P20959 Insulin-like growth factor-binding protein 3 86.1332 121.951 0.7063 0.04771 Q3SYR5 Apolipoprotein C-IV 54.5581 97.5879 0.5591 0.03094 A0A3Q1LP99 Proteolipid protein 1 12.841 63.9644 0.2008 0.001958 Q3T0A3 Complement factor D 29.4928 24.0432 1.227 0.04539 P15467 Ribonuclease 4 31.1259 18.9549 1.642 0.01838 P15781 Pulmonary surfactant-associated protein B 3.0214 15.637 0.1932 0.001538 Q9BGU1 Histidine-rich glycoprotein 606.8527 0 2260 0.000058 A0A3Q1LMB7 Myosin Heavy Chain 1 19.9331 0 2260 0.01072 Evaluation of DEPs in pregnant and non-pregnant cows by ELISA
-
To verify the DEPs detected by proteomics, the level of APOA1, HGR, CFH, MYH1, and A2M in serum were examined using ELISA with additional samples. As shown in Fig. 5a−d, the levels of APOA1, HGR, CFH, and MYH1 in the serum of all pregnant cows were significantly higher than those of the non-pregnant cows at 28 d post AI. However, there was no difference in the A2M level in the serum of pregnant and non-pregnant cows (Fig. 5e).
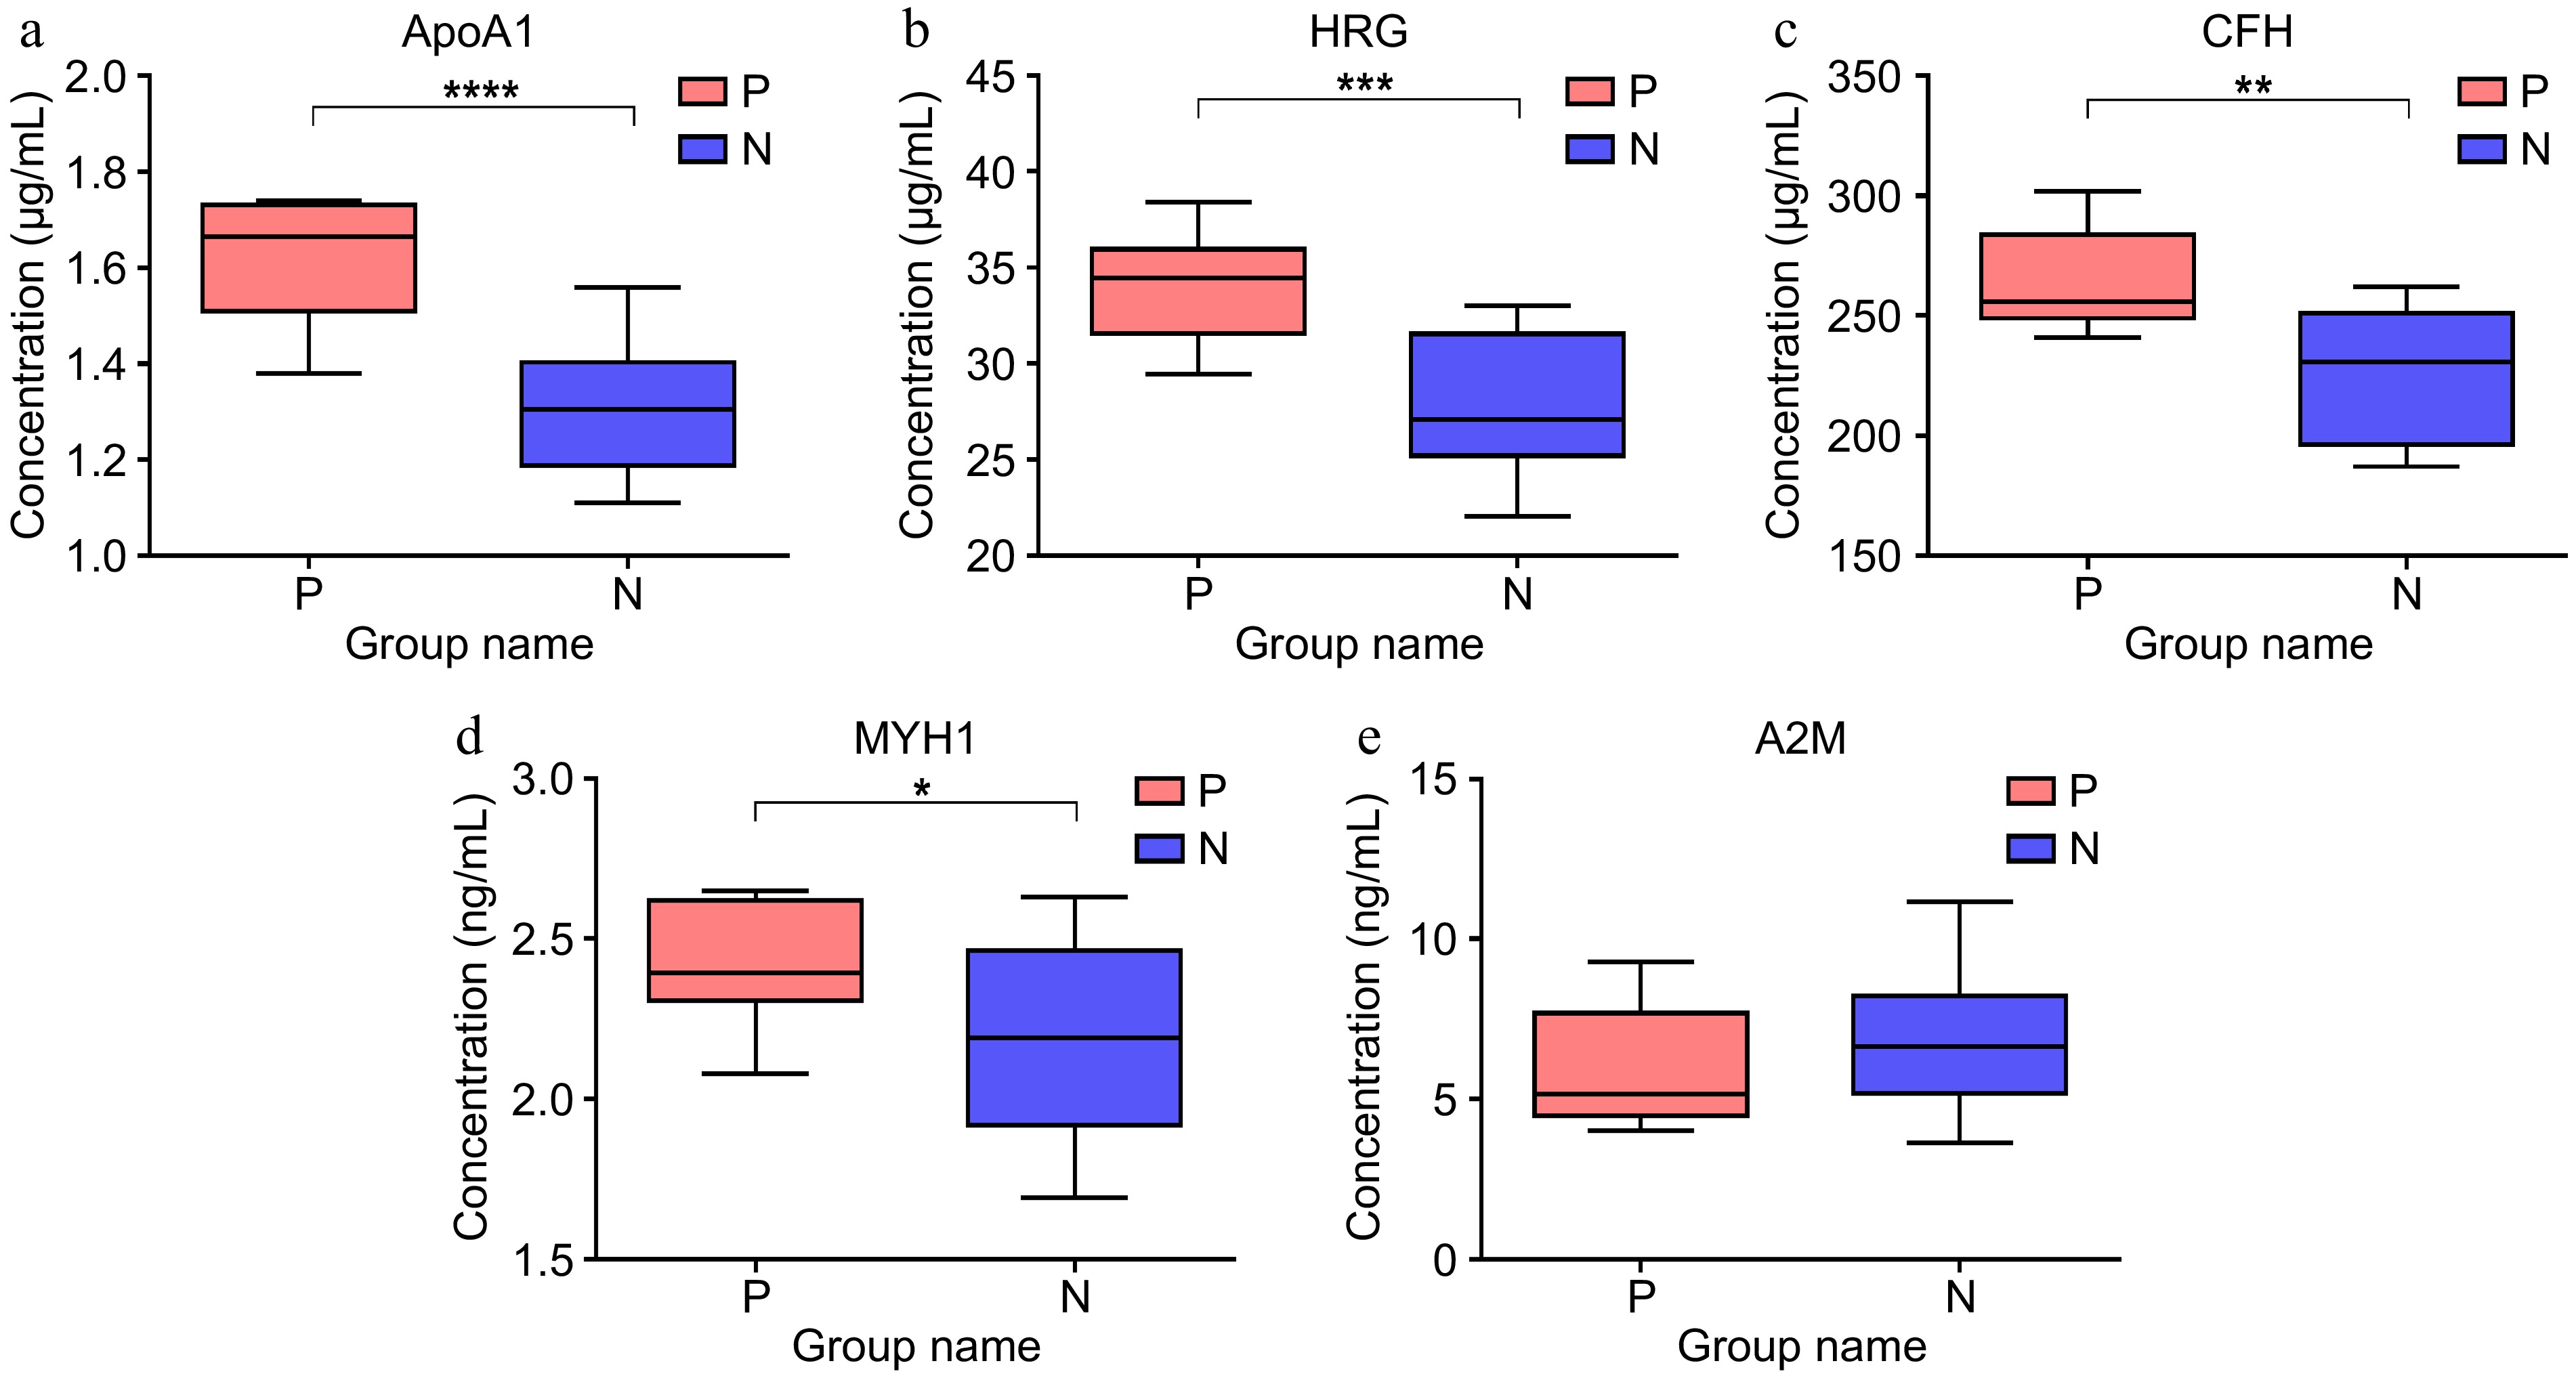
Figure 5.
The level of protein in the serum of pregnant (n = 8), and non-pregnant cows (n = 22) at 28-d post AI examined by ELISA. (a) Level of Apolipoprotein A-Ι (APOA1). (b) Level of Histidine-rich glycoprotein (HRG). (c) Level of Complement factor H (CFH). (d) Level of Myosin heavy chain1 (MYH1). (e) Level of Alpha-2-macroglobulin variant 4 (A2M).
-
Timely and accurate diagnosis of pregnancy in cows can help producers to shorten calving intervals and ultimately reduce the feeding costs of cow farms. With the advancement of metabolomics and proteomics methods, thousands of biomolecules in a sample can now be detected, and various markers for diagnosing specific physiological processes or diseases in animals have been identified. This study was conducted to identify new markers for early pregnancy diagnosis in cows. During the early stages of pregnancy, females undergo significant physiological and metabolic changes to accommodate the implantation and growth of the fetus. Thus, unique molecules that appear in the serum or urine of pregnant females could serve as markers for early pregnancy diagnosis. Serum samples from the cows were collected on 28-d post AI, and their pregnancy status was confirmed by ultrasound on 33-d post AI. Metabolomics and proteomics were then conducted, identifying 1377 metabolites and 321 proteins in current experiments. Although the levels of 43 metabolites were significantly different between pregnant and non-pregnant cows, their foldchanges (< 2) were not sufficient for further investigation. While, among the 18 differentially expressed proteins, the top five proteins including A2M, APOA1, CFH, HRG, and MYH1 were selected for ELISA examination using additional samples. The results show that the levels of APOA1, CFH, HRG, and MYH1 in the serum were significantly different between pregnant and non-pregnant cows at 28-d post AI. It can be proposed that APOA1, CFH, HRG, and MYH1 could serve as protein markers to develop rapid examination kits for detecting early pregnancy in cows.
Pregnancy and immunity activities are closely linked, and the occurrence of pregnancy inevitably triggers an immune response. Among the differentially expressed proteins mentioned above, research has shown that HRG and CFH are involved in the regulation of immune activities. Firstly, HRG has been reported to play an important role in several key processes, including fibrinolysis and blood coagulation, the establishment of the immune system, and angiogenesis, all of which are critical for establishing and maintaining pregnancy[36]. The level of HRG in the blood is significantly decreased in the late stage of pregnancy[37]. In addition, HRG is associated with pregnancy diseases such as hypertension and eclampsia during pregnancy[38], making it a potential indicator for these conditions during pregnancy[36,39].
For the current study, the level of HRG in pregnant cows was elevated, which is consistent with its role in pregnancy observed in other species. Meanwhile, the complement signaling pathway, a crucial immune regulation pathway, is closely related to maternal pregnancy. CFH can bind to receptors on host cells to regulate adhesion, phagocytosis, and cell activation[40]. In this study, the level of CFH in the serum of pregnant cows was elevated. Research has shown that the activation of the complement factor is closely related to maternal pregnancy, and the CFH in pregnant women is significantly higher than that in non-pregnant women[41]. While overactivation of complement factors can lead to pregnancy disorders such as eclampsia and gestational diabetes, CFH is not an independent risk factor for eclampsia and gestational diabetes[42−45]. Few studies have investigated the role of CFH in regulating physical activities. In cows, one study found that the complement system including CFH was down-regulated by heat stress[46]. Thirdly, A2M macroglobulin has been identified as a regulator of proteolysis, protease inhibitor, and it can also enhance the migration and proliferation of immune cells[47,48]. In the current study, there was no significant difference of A2M protein in the serum of pregnant and non-pregnant cows using ELISA. However, studies have shown that A2M is involved in the body's immunomodulatory response and immune tolerance. During pregnancy, the mother needs to establish immune tolerance for the fetus, and A2M may help achieve this by inhibiting certain inflammatory mediators[49,50]. As a member of the A2M family, pregnancy zone protein (PZP) can bind to a variety of pregnancy-related macromolecules and has a unique expression pattern in the reproductive and cardiovascular tissues, which may be related to induced pregnancy[51]. The levels of HRG, CFH, and A2M were altered in the serum of pregnant cows, and they all participate in the regulation of pregnancy and immune activities. However, more research is needed to fully elucidate their function in cows. Another noticeable protein is APOA1, which has been identified as a key protein component of plasma lipoprotein. Its primary function is to transport lipid substances and stabilize lipoprotein structures[52]. APOA1 and APOE, secreted by the placenta, play a crucial role in maintaining cholesterol homeostasis between the mother and fetus[53]. The lipid transport function of APOA1 relies on the assistance of ABCA1, which is predominantly expressed on the apical side of the placenta[54]. However, there is currently no research on the function of APOA1 in the physiological activities of cows. The last DEP is MYH1, which belongs to the myosin heavy chain family. MYH1 is highly expressed in the fast IIX/D type muscle fibers of vertebrates and serves as a major muscle contractile protein[55]. It is essential for the formation and development of muscle fibers, and its complex interactions with other genes indicate its importance in regulating muscle development and energy metabolism during fetal development[55]. A study has found that the gene expression of MYH1 is closely related to the beef quality of longissimus lumborum muscle after castration[56]. MYH1 is clearly involved in muscle development, but there are no reports indicating a direct relationship between the MYH1 protein and maternal pregnancy.
-
Accurate pregnancy diagnosis as early as possible is essential for successful reproductive management in cow farms. In the current study, serum samples from pregnant and non-pregnant cows were collected on the 28-d post AI. Metabolomics and proteomics were used to identify specific molecular indicators associated with pregnancy establishment in cows. A total of 43 metabolites and 18 proteins were found to be differentially expressed in the serum of pregnant cows compared to non-pregnant cows. Among these DEPs, the top five proteins were further examined using ELISA with additional samples. The levels of APOA1, CFH, HRG, and MYH1 in the serum of pregnant cows were significantly altered. Therefore, APOA1, CFH, HRG, and MYH1 can be used as biomarkers of early pregnancy in cows.
This research was funded by the Biological Breeding-Major Projects in National Science and Technology (2023ZD04049), China Agriculture Research Systems of MOF and MARA (CARS-37), the 2115 Talent Development Program of China Agricultural University, the Innovative Project of State Key Laboratory of Animal Biotech Breeding (Grant No. 2024SKLAB 1-6), and the Open Project Program of International Joint Research Laboratory in Universities of Jiangsu Province of China for Domestic Animal Germplasm Resources and Genetic Improvement.
-
All procedures were reviewed and preapproved by the Institutional Animal Care and Use Committee at the China Agricultural University (Identification No.: AW11014202-1-2, approval date: April 2, 2023). The research followed the 'Replacement, Reduction, and Refinement' principles to minimize harm to animals. This article provides details on the housing conditions, care, and pain management for the animals, ensuring that the impact on the animals was minimized during the experiment.
-
The authors' contribution to the paper is as follows: study conception and design: Zhang L, Su H; data collection: Zhai Y, Xia F, Shi L, Yang S, Wang L; analysis and interpretation of results: Jiang B, Zhai Y; draft manuscript preparation: Zhai Y, Ji P, Lv X, Sun W, Wang F, Liu G, Zhang L. All authors reviewed the results and approved the final version of the manuscript.
-
The authors confirm that the data supporting the findings of the current study are available within the article or the supplementary information.
-
The authors declare that they have no conflict of interest.
- Supplementary Table S1 The overview of serum metabolites information detected by LC/MS method in 6 pregnant and 6 non-pregnant cows.
- Supplementary Table S2 The overview of protein function detection using 4D-DIA proteomics methods in 6 pregnant and 6 non-pregnant cows.
- Copyright: © 2025 by the author(s). Published by Maximum Academic Press on behalf of Nanjing Agricultural University. This article is an open access article distributed under Creative Commons Attribution License (CC BY 4.0), visit https://creativecommons.org/licenses/by/4.0/.
-
About this article
Cite this article
Zhai Y, Xia F, Shi L, Yang S, Wang L, et al. 2025. Identification of four early pregnancy markers for cows by proteomics and metabolomics. Animal Advances 2: e023 doi: 10.48130/animadv-0025-0021 

Identification of four early pregnancy markers for cows by proteomics and metabolomics
- Received: 18 December 2024
- Revised: 10 May 2025
- Accepted: 13 May 2025
- Published online: 28 August 2025
Abstract: Accurate and timely diagnosis of pregnancy in cows is crucial for optimizing reproductive management practices on cattle farms. Therefore, the present study aimed to identify molecular changes in the serum of pregnant and non-pregnant cows using the latest proteomics and metabolomics techniques, with the goal of discovering early pregnancy biomarkers in female cattle. Firstly, the serum samples of cows were collected and isolated on the 28-d post artificial insemination (AI). The pregnancy status of these cows was subsequently determined based on the echogenic appearances in the uterus via ultrasound examination on the 33-d post AI, and then the samples were accordingly classed as pregnant (n = 8) or non-pregnant (n = 22). For metabolomic analysis, samples from six cows in each group were selected, while for proteomic examination, samples from three cows in each group were chosen. Proteomic analysis identified 341 proteins, with KEGG pathway enrichment revealing their involvement in 20 signaling pathways, including immune and endocrine systems, signal transduction, and others. Among the proteins, eight proteins were found to be elevated and ten proteins were down-regulated in the serum of pregnant cows. The levels of the top differential proteins such as APOA1, HRG, CFH, A2M, and MYH1 between pregnant and non-pregnant cows were further measured by ELISA. The ELISA results revealed that the levels of APOA1, HGR, CFH, and MYH1 in the serum of pregnant cows were significantly higher than those in non-pregnant cows (p < 0.05). Metabolome analysis demonstrated 20 up-regulated and 23 down-regulated metabolites in the serum of pregnant cows. However, none of these differential metabolites were deemed suitable as pregnancy markers. Overall, our findings show those four proteins hold potential as biomarkers for examining the early pregnancy status of cows.
-
Key words:
- Cow /
- Early pregnancy diagnosis /
- Proteomics /
- Metabolomics /
- Protein markers