


-
Due to the unique construction age, structure, and materials of large Ming and Qing ancient architectural buildings, they have a high fire incidence rate. A large number of fires have previously occurred in Chinese cultural relics and ancient buildings, and the extremely valuable ancient buildings once burned in a fire, are a significant loss of human cultural heritage. Therefore, it is necessary to conduct a fire risk assessment on ancient buildings.
The Fire Command Center is the fire and emergency command department of the cultural heritage unit of the ancient building clusters responsible for the operation and planning of fire safety actions. It is a process of comprehensive thinking on a series of issues such as emergency deployment of ancient building clusters fires based on the comprehensive analysis and judgment of fire risk and hazards, and forming a judgment concept. Fire risk assessment is an important component of the fire emergency command center, and the evaluation criteria directly affect the effectiveness of fire and firefighting command in ancient building clusters. In future fire drills, only by strengthening and enhancing the 'evaluation' ability can we stand invincible. Therefore, analyzing and evaluating the factors related to fire hazards in ancient architectural clusters are of great significance.
The assessment of fire hazards is a reflection of the scientific calculation ability of various factors, so the comprehensive impact of hierarchy and fuzziness must be considered in fire hazard risk assessment. Based on constructing a fire risk assessment index system for the ancient buildings, this article establishes a fire hazard assessment model, and then combines the fuzzy comprehensive evaluation method to evaluate large Ming and Qing ancient buildings clusters.
The common fire risk assessment is divided into qualitative assessment, semi-quantitative assessment, and quantitative assessment according to the indicator processing method. Currently, semi-quantitative assessment methods are mostly used for risk assessment of ancient buildings, which use multiple risk assessment tools and comprehensively considers the impact of multiple factors. Li[1] synthesized a comprehensive fire science, safety science, fuzzy mathematics, fire safety, the fire risk and other disciplines and set up the Anhui Ancient Building Fire Protection System, which evaluated Anhui ancient building fire safety protection work integration. Wei et al.[2] applied the entropy method mutation theory to a typical wooden structure complex in the South China, to track and evaluate the risk of fire development. Based on the factors of the fire spread and development, they had established a fire risk evaluation index system for the wooden structure complex from the safety management, the surrounding environment, the wooden fire resistance facilities, the electrical fire protection, and the complex fire protection mechanism, which possess five second-level indicators and 15 three-level indicators[2]. Yan & Wan[3] used a combination of Analytic Hierarchy Process (AHP) and Principal Component Analysis (PCA) to assign weights for comprehensive evaluation and analysis. The evaluation results showed that fire protection management capability, fire handling capability, and fire extinguishing equipment were the most weighted disaster-causing factors, but the number of evaluation indicators was slightly insufficient. Xie[4] conducted a comprehensive evaluation analysis using Analytic Hierarchy Process and Fuzzy Comprehensive Evaluation Method. The evaluation results showed that the top three disaster-causing factors with the highest weight were electricity management, the temporary evacuation routes, and fireproof water supply systems. This method was applied to guide the rectification of fire hazards, the safety risk results before and after the rectification were compared, and the comparison results showed that the safety situation had significantly improved. Yan et al.[5] used the Pressure-Status-Response (PSR) model to build an evaluation framework and determined the weights of each indicator through expert scoring and the Analytic Hierarchy Process. Cai et al.[6] proposed the Particle Swarm Optimization (PSO) optimization method based on the Analytic Hierarchy Process, using particle iteration to solve the judgment matrix. The accuracy of the results before and after optimization were compared and analyzed, which showed that the weight calculation of the optimized indicator system was more accurate, and then preventive suggestions were proposed for factors with larger weights. Ju et al.[7] established a Forest Evaluation Model using the Analytic Hierarchy Process (AHP), validated the effectiveness and scientificity of the results using the historical disaster data, and graded the membership degrees of each indicator. However, owing to the dynamic characteristics of forests, this method lacks data dynamization and the automatic integration of evaluation.
Zhang et al.[8] improved Gustav’s method from the shortcomings of considering single factors and the high overlap of factor weights. They combined expert scoring and Analytic Hierarchy Process to construct a fire risk assessment model. The suggestions such as adding evacuation routes and strengthening fire equipment had been proposed from the evaluation results.
Principles for constructing an evaluation index system:
(1) Comprehensiveness. Starting from the requirements of fire preparedness, comprehensively consider various factors that affect fire risk hazards, and conduct a comprehensive evaluation of the entire spectrum of large Ming and Qing ancient architectural clusters as much as possible.
(2) Scientificity. The indicators for risk warning analysis of ancient building fires should distinguish between primary and secondary factors, so that the indicator system is relatively simple and does not affect the overall evaluation.
(3) Independence. Each evaluation indicator should maintain relative independence and each indicator should be able to independently reflect the overall ability without any mutual inclusion.
(4) Objectivity. When determining evaluation indicators, the influence of subjective factors should be removed, and the meaning of the indicators should be as clear as possible, which can truly represent the essence of fire planning ability.
Taking the large Ming and Qing ancient architectural buildings as the research object, this article focuses on their diverse functions and structural forms, a risk assessment system is constructed by combining fuzzy mathematics methods and analytic hierarchy process, six criteria layers and 28 indicators were determined through the expert scoring and the Analytic Hierarchy Process. Various indicator data were fuzzified to determine the final risk model and propose prevention suggestions for high-risk areas, which provides a reasonable decision-making reference for scientific prevention. By combining MHMapGIS visualization technology, this evaluation method was developed into a software program for the online spatial analysis, achieving real-time online evaluation[9].
-
The fuzzy comprehensive evaluation method[10,11] is a comprehensive evaluation method based on fuzzy mathematics. The biggest feature of this evaluation method is that it can convert qualitative evaluation indicators into quantitative evaluation indicators on the fuzzy mathematics theory. This article combines the fuzzy mathematics method with the Analytic Hierarchy Process, fully combining the advantages of AHP in easily solving multi-level and multi-objective problems and the ability of fuzzy mathematics to better solve fuzzy and difficult to quantify problems. At the same time, it also avoids the shortcomings of AHP, such as strong subjectivity. It has the characteristics of clear results and strong systematicity, making it more suitable for multi-objective decision-making and solving various uncertain problems.
The large Ming and Qing ancient architectural buildings have a high system complexity and a large amount of analysis work, therefore the Analytic Hierarchy Process (AHP) was adopted. However, for the evaluation indicators of fire risk, some are quantitative objective data, while others are qualitative textual descriptions, requiring a method to transform qualitative indicators into quantitative indicators. Moreover, the risk level of fire is also a fuzzy concept, and there is no clear boundary between safety and danger. Therefore, a fuzzy comprehensive evaluation method combining fuzzy mathematics and AHP was adopted. The index system after the fuzzification treatment had better adaptability to the risk assessment of the entire region and its constituent individuals.
-
The Analytic Hierarchy Process (AHP) structure consists of three layers: target layer (A), criterion layer (B), and indicator layer (C). The target layer is the risk analysis of large palace fires. The selection of the criterion layer and indicator layer should ensure the fairness, objectivity, and operability of the indicator system, and follow the principles of hierarchical integrity, qualitative representativeness, feasibility and availability, and objective quantification.
Considering that most ancient buildings in China occupy a large area were relatively old and had a strong historical element, six levels were selected based on the actual situation, including the value index, the possibility of fire occurrence, the fire spread speed, the rescue speed index, the fire perception ability, and the evacuation speed index. The value index included the quantity and value of antiquities. Most ancient buildings in China were made of brick and wood structures, which have low fire resistance levels and high fire loads. Therefore, the possibility of fire occurrence needs to include a series of factors such as the building materials, the fire resistance levels, the building structures, and the wire distribution that might cause fires.
The factors that trigger fires in ancient buildings are the rapid spread of fires and the poor sensitivity of fire detectors. On the one hand, there is a lack of corresponding flame retardant treatment and there are flammable materials such as the curtain fabrics and wood inside the building, which could cause fires to spread rapidly, on the other hand, the number of fire detectors are limited, their distribution is incomplete, and a few traditional fire detectors are not sufficient to cope with complex environments. Therefore, in the criterion layer of fire spread speed and perception ability index, a series of indicators such as the building flame retardant grade, the quantity of cotton and linen products, the temperature and humidity need to be included. In addition, the rescue and evacuation work in the event of a fire can not be ignored. Some large ancient architectural buildings are also important tourist attractions with high pedestrian traffic, which makes rescue and evacuation work difficult. Therefore, in the rescue and evacuation speed index criterion layer, the relevant indicators such as the number of firefighters, the building area, and fire accessibility needs to be included[12].
Referring to the relevant literature, the Delphi method was used to organize the fire risk indicator system to further refine the risk indicators[13−16]. That involves organizing, summarizing, and adding up the opinions of various experts, and then anonymously providing feedback on the indicators to the experts for a second round of consultation. Based on the final opinions, the indicator system was revised and improved. The final fire risk indicator system is shown in Table 1.
Table 1. Hierarchy model.
Target layer A Criterion layer B Indicator layer C Fire risk warning
analysisValue index B1 Number of cultural Antiques C11 Cultural Antiques value C12 Probability of fire occurrence B2 Building materials C21 Fire resistance rating C22 Building age C23 Wire distribution C24 Natural and coal gas C25 Temperature C26 Fire spread speed B3 Building materials C31 Building layers C32 Flame retardant level C33 Degree of building openness C34 Quantity of cotton and linen
yarn C35Plant density C36 Wind C37 Rescue speed index B4 Number of firefighters C41 Emergency equipment C42 Water system distance C43 Fire accessibility C44 Road traffic density C45 Fire perception ability B5 Number of fire detectors C51 Number of fire alarms C52 Evacuation speed index B6 Building area C61 Tourist density C62 Road accessibility C63 Number of staff C64 Building height C65 Number of road exits C66 Constructing a judgment matrix
-
By comparing two elements at a certain level, the judgment matrix for that level was obtained[14]. Since the fact that there were only two indicators in the value index and the fire perception ability index in the criterion layer of Table 1, the weights could be simply determined to be 0.5 each. The other four criterion layers mutually compared and judged the two indicators using a 1−9 scale, calculating the judgment matrix, and finally obtaining the corresponding weights of each indicator in each layer. Due to the large number of indicators selected in the indicator layer, a relatively simple criterion layer was chosen as an example for taking the calculation, the judgment matrix obtained through expert scoring and reference to the literature is shown in Table 2.
Table 2. Criterion layer's judgment matrix about A.
A B1 B2 B3 B4 B5 B6 B1 1 1/2 2 2 1/2 2 B2 2 1 2 3 2 3 B3 1/2 1/2 1 2 1/3 2 B4 1/2 1/3 1/2 1 1/2 1/2 B5 2 1/2 3 2 1 2 B6 1/3 1/3 2 2 1/2 1 Consistency check
-
Taking the judgment matrix of the criterion layer regarding A from Table 2 as an example, the hierarchical single rank was calculated and the consistency test was performed. The steps were as follows:
(1) The judgment matrix A is represented in the following column form, with:
$ {\text{A = }}\left[ {\begin{array}{*{20}{c}} 1&{1/2}&2&2&{1/2}&2 \\ 2&1&2&3&2&3 \\ {1/2}&{1/2}&1&2&{1/3}&2 \\ {1/2}&{1/3}&{1/2}&1&{1/2}&{1/2} \\ 2&{1/2}&3&2&1&2 \\ {1/3}&{1/3}&2&2&{1/2}&1 \end{array}} \right] $ (1) (2) The weight vector of judgment matrix A was calculated using the geometric average method, giving Eqn (2):
$ W = \dfrac{{{{\left( {P_{j = 1}^n{a_{ij}}} \right)}^{\frac{1}{n}}}}}{{\displaystyle\sum\limits_{k = 1}^n {\left( {P_{j = 1}^n{a_{kj}}^{\frac{1}{n}}} \right)} }} = \left[ {\begin{array}{*{20}{c}} {0.16} \\ {0.30} \\ {0.12} \\ {0.09} \\ {0.21} \\ {0.12} \end{array}} \right] $ (2) In the formula: aij represents the elements in the i-th row and j-th column of matrix A.
(3) Perform the consistency examination on the judgment matrix, determine the maximum eigenvalue of the judgment matrix, calculate its consistency index CI and consistency ratio CR, and obtain:
$ {\lambda _{max}} = \sum\limits_{i = 1}^n {\dfrac{{{{\left[ {Aw} \right]}_i}}}{{n{w_i}}}} $ (3) In the formula:
$ \omega $ $\begin{split} {\left[ {Aw} \right]_i} =\;& \left[ {\begin{array}{*{20}{l}} {0.16 + 0.30/2 + 0.12*2 + 0.09*2 + 0.21/2 + 0.12*2} \\ {0.16*2 + 0.30 + 0.12*2 + 0.09*3 + 0.21*2 + 0.12*3} \\ {0.16/2 + 0.30/2 + 0.12 + 0.09*2 + 0.21/3 + 0.12*2} \\ {0.16/2 + 0.30/3 + 0.12/2 + 0.09 + 0.21/2 + 0.12/2} \\ {0.16*2 + 0.30/2 + 0.12*3 + 0.09*2 + 0.21 + 0.12*2} \\ {0.16/3 + 0.30/3 + 0.12*2 + 0.09*2 + 0.21/2 + 0.12} \end{array}} \right]\\ =\;& \left[ {\begin{array}{*{20}{c}} {1.08} \\ {1.91} \\ {0.84} \\ {0.50} \\ {1.22} \\ {0.80} \end{array}} \right] \\{\lambda _{max}} =\;& \dfrac{1}{6}\left( {\dfrac{{1.08}}{{0.16}} + \dfrac{{1.91}}{{0.30}} + \dfrac{{0.84}}{{0.12}} + \dfrac{{0.50}}{{0.09}} + \dfrac{{1.22}}{{0.21}} + \dfrac{{0.80}}{{0.12}}} \right) = 6.36 \end{split}$ $ CI = \dfrac{{{\lambda _{max}} - n}}{{n - 1}} = \dfrac{{6.36 - 6}}{{6 - 1}} = 0.072 $ (4) At this point, when n = 6, looking up the table and obtaining the random consistency index RI = 1.24, the consistency ratio CR is:
$ CR = \dfrac{{CI}}{{RI}} = \dfrac{{{\lambda _{max}} - n}}{{RI*\left( {n - 1} \right)}} = \dfrac{{0.072}}{{1.24}} = 0.0581 \lt 0.1 $ (5) Therefore, this plan meets the requirements of consistency testing.
For the weight calculation of indicator layer C with respect to criterion layer B (Eqn (2)), the weights of indicator layer C were normalized. For example, the weight of building materials is 0.1164, the fire resistance rating is 0.1352, the building age is 0.0541, the wire distribution is 0.2822, the natural and coal gas is 0.3337, the temperature 0.0784 in the proportion of weight to the likelihood of fire occurrence. The above criterion layer calculation can be used as an example, and relevant software such as Matlab used for the calculation. The CR values all meet the consistency examination. The weights of each indicator are shown in Table 3.
Table 3. Weights of various indicators.
Target layer Criterion layer Indicator layer Fire risk warning analysis Value index 0.16 Number of cultural antiques 0.5 Cultural antiques value 0.5 Probability of fire occurrence 0.30 Building materials 0.1164 Fire resistance rating 0.1352 Building age 0.0541 Wwire distribution 0.2822 Natural and coal gas 0.3337 Temperature 0.0784 Fire spread
speed 0.12Building materials 0.0581 Building layers 0.0441 Flame retardant level 0.1002 Degree of building openness
0.0923Quantity of cotton and linen
yarn 0.2843Plant density 0.2843 Wind 0.1367 Rescue speed
index 0.09Number of firefighters 0.1831 Emergency equipment 0.0895 Water system distance 0.1594 Fire accessibility 0.3264 Road traffic density 0.2416 Fire perception ability 0.21 Number of fire detectors 0.5 Number of fire alarms 0.5 Evacuation speed index 0.12 Building area 0.0851 Tourist density 0.2941 Road accessibility 0.1518 Number of staff 0.1419 Building height 0.1125 Number of road exits 0.2146 -
Since this risk indicator system consists of two different components, qualitative and quantitative, specific quantification could not be achieved. Therefore, it was necessary to map indicator characteristics to the same numerical range for subsequent weight processing. The fire risk indicator system for this fire adopts the unit system, which means that based on the given data, a decimal value of 0−1 is obtained after data processing. The higher the value, the higher the corresponding index. For example, when calculating the value index, the higher the value obtained, the higher the comprehensive value of the cultural antiquities. After multiple rounds of expert discussions and considering that the standards for various types of data were different from the relevant literature[15,17], this article adopted the method of determining the membership degree of each type of data one by one, and the membership degree of each type of data was as follows:
Value index
-
According to the statistics of the Ministry of Culture and Tourism, there were about 5,800 museums in China, with a total collection of 46.65 million pieces. Therefore, for the evaluation of the number of cultural relics, the average value is taken as the standard, which is 8043 pieces. If it exceeds three times this standard, the quantity index is considered 0.8, and if it is less than 1/8 of this value, the quantity index is considered 0.2.
The value of cultural antiquities: if the Chinese National second-level cultural antiquity value is generally above CNY¥ 10,000 Yuan, the second-level cultural antiquity value is taken as the average. If it is above CNY¥ 50,000, it is recorded as 0.8, and if it is below CNY¥ 20,0000, it is recorded as 0.2.
Possibility of fire occurrence
-
Building materials: include wood, steel, marble, etc. Record wood as 0.8, steel and marble as 0.2, and if there is no input, record the mean as 0.5.
Fire resistance rating: the higher the fire resistance rating, the lower the possibility of fire occurrence. If the fire resistance rating is 5, it is recorded as 0.2, if the fire resistance rating is 4, it is recorded as 0.3, and if the fire resistance rating is 3, it is recorded as 0.5. If the fire resistance rating is 2, it is recorded as 0.7, and if the fire resistance rating is 1, it is recorded as 0.8.
Building age: the older the building, the greater the likelihood of a fire occurring. Taking general buildings as an example, according to China National Standards, the service life is estimated to be between 50 to 100 years. If the age is less than 20, it is recorded as 0.2. If it is greater than 20 and less than 80, it is recorded as the corresponding age value divided by 100. If it is greater than 80, it is recorded as 0.8.
Wire distribution: the denser the distribution of electric wires, the greater the likelihood of a fire occurring. A wire density, 4 or less per cubic meter is considered low density; 4−8 pieces (inclusive) are of medium density, and more than 8 are considered high density. The medium density is denoted as 0.5, sparsity is denoted as 0.2, and high density is denoted as 0.8.
Natural gas and coal gas are flammable materials, and the more frequently they are used, the greater the likelihood of fire occurrence. They can be scored based on the number of uses, with y = 5x/100 and a maximum of 1.
Temperature: the higher the temperature, the greater the possibility of a fire. To quantify this risk, temperatures are recorded on a scale where 40 °C and above are assigned a value of 0.8, indicating the highest risk. As the temperature decreases, the risk is reduced, with 30 °C and above recorded as 0.5, 20 °C and above as 0.3, and temperatures below 20 °C as 0.2, representing the lowest risk on this scale.
Fire spread speed
-
Building materials: include wood, steel, and marble, with a ratio of 0.8 for wood and 0.2 for steel and marble.
Building layers: the higher the number of layers in a building (e.g., towers), the higher the fire spread index. It is recorded as 0.2 for layers 1−3, 0.4 for layers 4−6, 0.6 for layers 7−9, and 0.8 for layers greater than 9.
Flame retardant level of a building: The higher the flame retardant level, the slower the fire spread. According to the flame retardant level 1−5, it is recorded as 0.8, 0.6, 0.4, 0.2, 0 in order.
Degree of building openness: the higher the degree of building openness, the greater the spread index, which is recorded as 0.8, 0.5, and 0.2 in descending order of openness.
Quantity of cotton and linen yarn products: the more cotton and linen yarn products there are, the greater the spread index. The initial value is 50 pieces, and the impact on the possibility of fire is 0.2. For every ten more pieces, the degree of impact increases by 0.1, with a maximum of 1.
Plant density: the plant density is high, with a shading ratio of over 95%−100% for plants (over 1 m high) under sunlight, the medium density ranging from 50% to 95%, low density below 20%. The higher the plant density, the slower the fire spread. The high plant surface density is recorded as 0.2, the medium plant density is recorded as 0.5, and the low density is recorded as 0.8.
Wind speed: The wind speed increases the air in the combustion zone, it brings a large amount of oxygen, which is the main driving force for combustion, that the flame changes after being blown by the wind, not only increases the flame length but also intensifies radiation and convective heat transfer, which makes the fire burn more vigorously. At a wind speed of 35 m/s, the percentage of fire spread in each part of the perimeter of the fire scene to the total perimeter is 50% for the downwind fire head, 40% for the side, and 10% for the upwind fire head. When there is no wind, the percentage is: 25% for the downwind fire, 50% for the side, and 25% for the upwind fire. If the wind speed level is x, then y = 0.2x (take 100 when y > 1).
Rescue speed index
-
Number of firefighters: the more firefighters there are, the faster the rescue speed. During general firefighting, eight firefighters are deployed per 100 m2. It is recorded that there are eight firefighters per 100 m2, which is 0.2. For every additional person, 0.2 are added, and the maximum limit is 1.
Road traffic density: The higher the traffic density, the lower the rescue index tends to be. For the purpose of calculating the rescue index, the number of people per 10 m2 is evaluated as follows: if there is one person or fewer, it is counted as 1; if there are two people, it is counted as 0.8; and if there are three people, it is counted as 0.5.
Water system distance: the farther away the water system is, the faster the fire spreads. When the water source is within 150 m of the site, a fire truck should be used to occupy the water source and directly connect the water gun to extinguish the fire; Within 150−1,500 m from the site, fire trucks should be used to supply water through relay formation; if the distance from the site exceeds 1,500 m, a fire truck water supply formation should be used to transport water for supply. When the distance between water systems is less than 150 m, it is recorded as 0.9. When the distance between water systems is between 150−1,500 m, it is recorded as 0.5. When the distance between water systems is greater than 1,500 m, it is recorded as 0.1.
Amount of emergency equipment: according to rules of the relevant departments in China, there should be one set of emergency equipment per 50 m2. When the number of emergency equipment contained within each 50 m2 is less than 0.5 set, it is recorded as 0.2. When it is between 0.5 and 1.5 set, it is recorded as 0.5. When it is greater than 1.5 set, it is recorded as 0.8.
Fire accessibility: the higher the fire accessibility, the higher the rescue index, which can be recorded as 0.8, 0.6, and 0.3 according to the high, medium, and low levels of accessibility.
Fire perception ability index
-
Number of fire detectors: generally speaking, the sensing range of a fire detector is 80 m2. So there should be at least one fire detector per 80 m2. When there is one fire detector per 80 m2, it is set to 0.4. If there is one more detector, it increases by 0.4, and if there is one less detector, it decreases by 0.4. The ceiling is set to 1.
Number of automatic fire alarms: the sensing range of a general photoelectric fire automatic alarm is 60 m2. So there should be at least one automatic fire alarm per 60 m2. When the number of automatic fire alarms per 60 m2 is set to 1, it is 0.4. If there is one more alarm, it increases by 0.4, and if there is one less alarm, it decreases by 0.4. The maximum limit is 1.
Evacuation speed index
-
Building area: the larger the building area, the greater the fire spread index. The general scale of large-scale buildings should be between 20,000 m2 and 50,000 m2. When the building area is less than 20,000 m2, it is recorded as 0.2. When it is between 20,000 m2 and 50,000 m2, it is recorded as 0.5. When the building area is greater than 50,000 m2, it is recorded as 0.8.
Number of staff: the number of staff for each attraction should be 2−5. When the number of staff is less than 2, it is recorded as 0.2. When the number of staff is 2−5, it is recorded as 0.5. If it is greater than 5, it is recorded as 0.7.
Tourist density: according to the per capita spatial carrying capacity index of the core scenic area (for example, the Palace Museum), the tourist density is 0.8−3 m2 per person. When the tourist density is less than 0.8 m2 per person, it is recorded as 0.8. When the tourist density is 0.8−3 m2 per person, it is recorded as 0.5. When the tourist density is greater than 3 m2 per person, it is recorded as 0.2.
Number of building layers: the number of layers in a building is recorded as 0.8 for a single-story building, 0.6 for multiple layers, 0.4 for a high-rise building, and 0.3 for a basement.
Degree of road accessibility: it is recorded as 1.0 when there are four directions, 0.9 when there are three directions, 0.7 when there are two directions, and 0.4 when there is one direction.
Number of road exits: the number of road exits for each attraction should be 2−4. On average, when the number of exits for each attraction is less than 2, it is recorded as 0.2; when the number is 2−4, it is recorded as 0.5; and when the number of exits are greater than 4, it is recorded as 0.8.
Final risk model
-
Fuzzy evaluation requires first-level fuzzy evaluation and second level fuzzy evaluation on the indicator layer and criterion layer, respectively.
The first level fuzzy evaluation adopts Eqn (6):
$ \begin{split} B_i=\; & W_{\epsilon i}\ \times R_i=(w_{\epsilon i1},\ w_{\epsilon i2},\ \cdots,\ w_{\epsilon i6})\times \left[\begin{array}{cccc}r_{i1} & & & \\ &r_{i2} & & \\ & & \ddots & \\ & & & r_{i6}\end{array}\right] \\ =\; & (B_{i1},\ B_{i2},\ \cdots,\ B_{i6}) \end{split} $ (6) In the formula: Bi is the fuzzy evaluation of the i-th criterion layer;
$W_{\epsilon i} $ $W_{\epsilon im} $ The second level fuzzy evaluation adopts Eqn (7):
$ S=W_B\ \times B=(w_{B1},\ w_{B2},\ \cdots,\ w_{B6})\times\left[\begin{array}{*{20}{c}}W_{C1}\times R_1 \\ W_{C2}\times R_2 \\ \vdots \\ W_{C6}\times R_6\end{array}\right]=(S_1,\ S_2,\ \cdots,\ S_6) $ (7) In the formula: S is the overall fuzzy evaluation of the ancient building in that area; Wb is the weight set of the criterion layer for the target layer; B is a first-level fuzzy evaluation; wBi is the weight of the i-th criterion layer; Wci is the set of corresponding indicator weights in the i-layer criterion layer; Ri is the fuzzy data corresponding to the region of the i-th criterion layer; Si is the fuzzy calculation result of the i-th criterion layer.
After calculating the weights of the above indicators and conducting fuzzy comprehensive evaluation, the final risk model can be determined by Eqn (8):
$ {S_{risk}} = \sum\limits_{i = 1}^6 {{S_i}} $ (8) Among them, Srisk represents the final risk factor; Si is the fuzzy calculation result of the i-th criterion layer in the second level fuzzy evaluation.
-
MHMapGIS is a universal geographic information system software suitable for spatial information analysis and processing, similar to MapGIS software[18]. Its main functions are to collect, store, and analyze various geographic spatial information data, it can maintain high accuracy in editing and processing complex terrain, and also provide a comprehensive geographic spatial information platform for managing and querying spatial data.
In fire risk analysis, the development tool VS2022, C# language and MHMapGIS module are closely combined for secondary development[19]. At the same time, the software integration technology is used to integrate the .DLL interface into the software, integrating various functions such as data collection, positioning, management, and analysis. It is a software platform suitable for multiple working conditions. In addition, MHMapGIS has a powerful GDB database system and multifunctional structural modules, including a layer management module that adds spatial features and graphic attributes such as drawing points, lines, and areas; the data management module for selecting, locating, and modifying graphic data; the fuzzy query, precise query of spatial object height, and other attributes, spatial analysis module for analyzing the range and intensity of disaster impact, and so on.
Grid and visual validation
-
Taking the Palace Museum (large Ming and Qing ancient architectural buildings) as an example, plan and organize the required tourist flow, palace data, fire accessibility, and other related characteristic information of the large palace buildings. Using the fuzzy results obtained from the Analytic Hierarchy Process and Fuzzy Comprehensive Evaluation Method, the written C# language code is integrated into the MHMapGIS software platform using extensions such as GDAL library, GEOS library, PROJ library, etc.
Based on the study by Li[19], a grid-based algorithm was independently developed for this palace buildings, which mainly includes three parts: boundary generation, grid partitioning, and risk factor calculation. The main functions are implemented with .DLL dynamic libraries and software. The main purpose of generating boundary function is to generate the geographical boundary of the architectural complex based on the given building;
The grid division part divides The Palace Museum area into seven major areas with the data such as building density, number of streets, and historical disasters, and further subdivides the detailed grid. The risk factor calculation section includes the fuzzy comprehensive evaluation method in the fire risk indicator system. The fuzzy comprehensive evaluation is applied to each detailed grid to obtain fuzzy results. The software's built-in rendering function is used to render the overall area into a fire risk level distribution map. According to the classification criteria, a fire risk classification chart is obtained, as shown in Table 4:
Table 4. Risk interval table.
Hazard levels Low Medium Higher High Distribution (0, 40%] (40%, 60%] (60%, 80%] (80%, 100%] Colour Green Blue Pink Red Figures 1 to 4 show the results obtained using the software. The hazard levels (0, 40%] represent low, (40%, 60%] medium, (60%, 80%] higher, and (80%, 100%] high using the different colors of green, blue, pink, and red. The areas with higher fire risks are mostly distributed in Area 3: on the one hand, the building density in this area is high, the streets are narrow, and the pedestrian flow is relatively concentrated; on the other hand, there are a large number of cultural antiques stored in this area, which are of great value. It is recommended to increase the number of fire detectors and layout, arrange the staff or take diversion measures, and also focus on rescue and evacuation. In the open areas of Zone 0 and Zone 1, the fire risk is relatively low. Area 2 is located in the main gate fortress, the personnel are more dense and the stampede risk is high in the actual situation. However, there are still shortcomings such as the coarse indicator data and sparse grids, resulting in a less detailed risk distribution. In the future, the number of grids can be increased and the indicators can be refined to display the fire risk distribution more clearly in detail. Considering the real-time nature of software and risk factors, the fire warning measures should focus more on areas with obvious and regular red characteristics. In terms of comprehensive evaluation, the fire risk distribution of the building is more intuitive and reasonable by analyzing the historical disaster data of the contracted type of building.
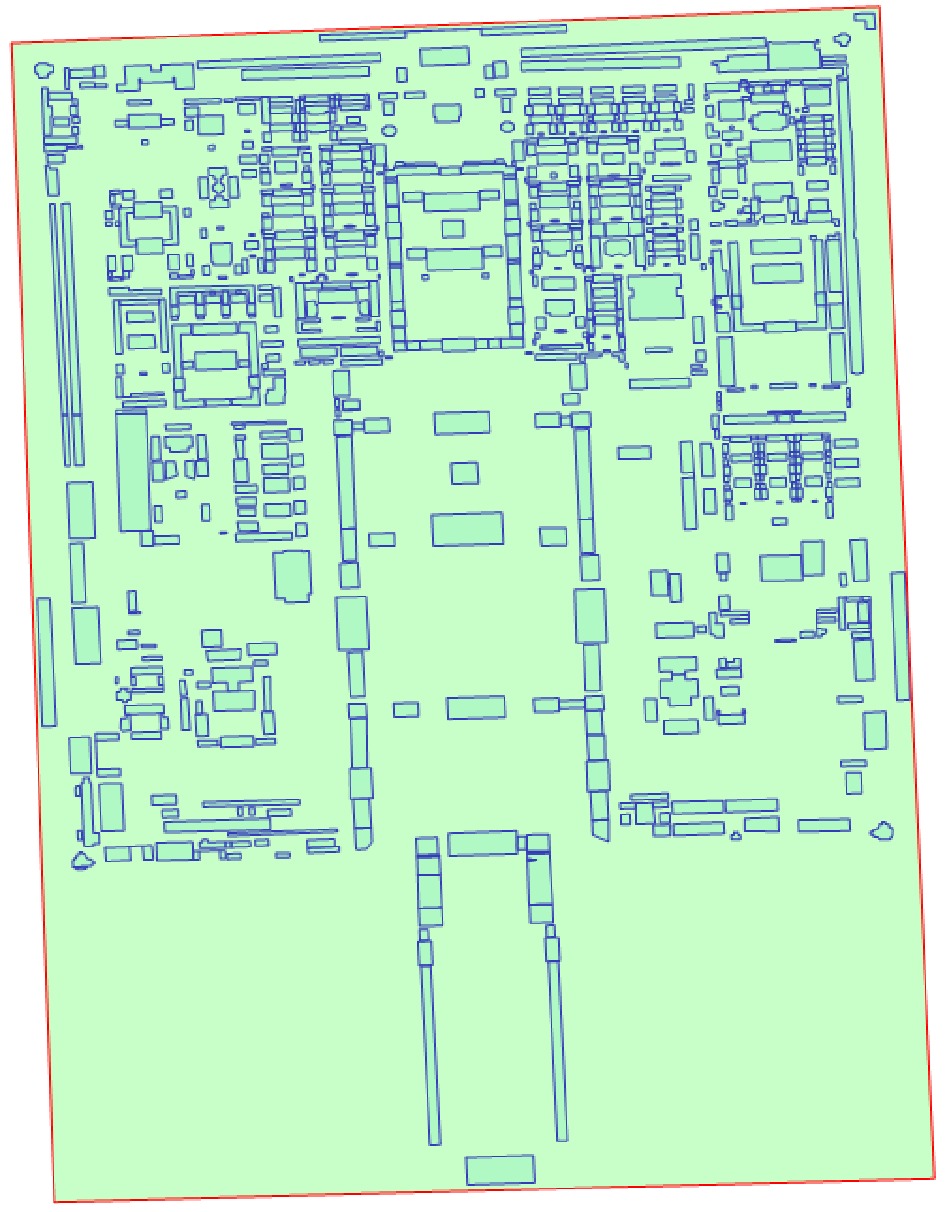
Figure 1.
Generate boundary map.
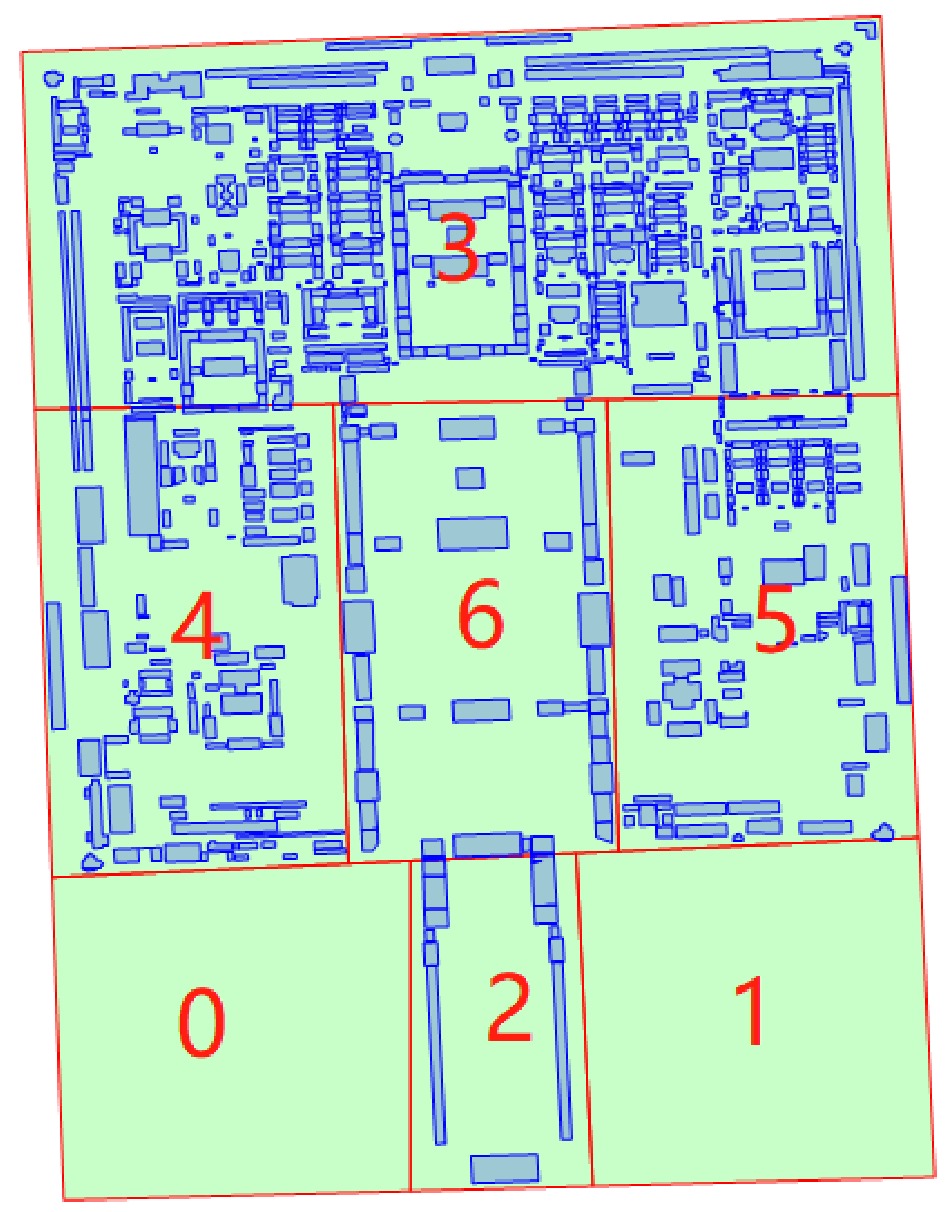
Figure 2.
Grid area diagram.
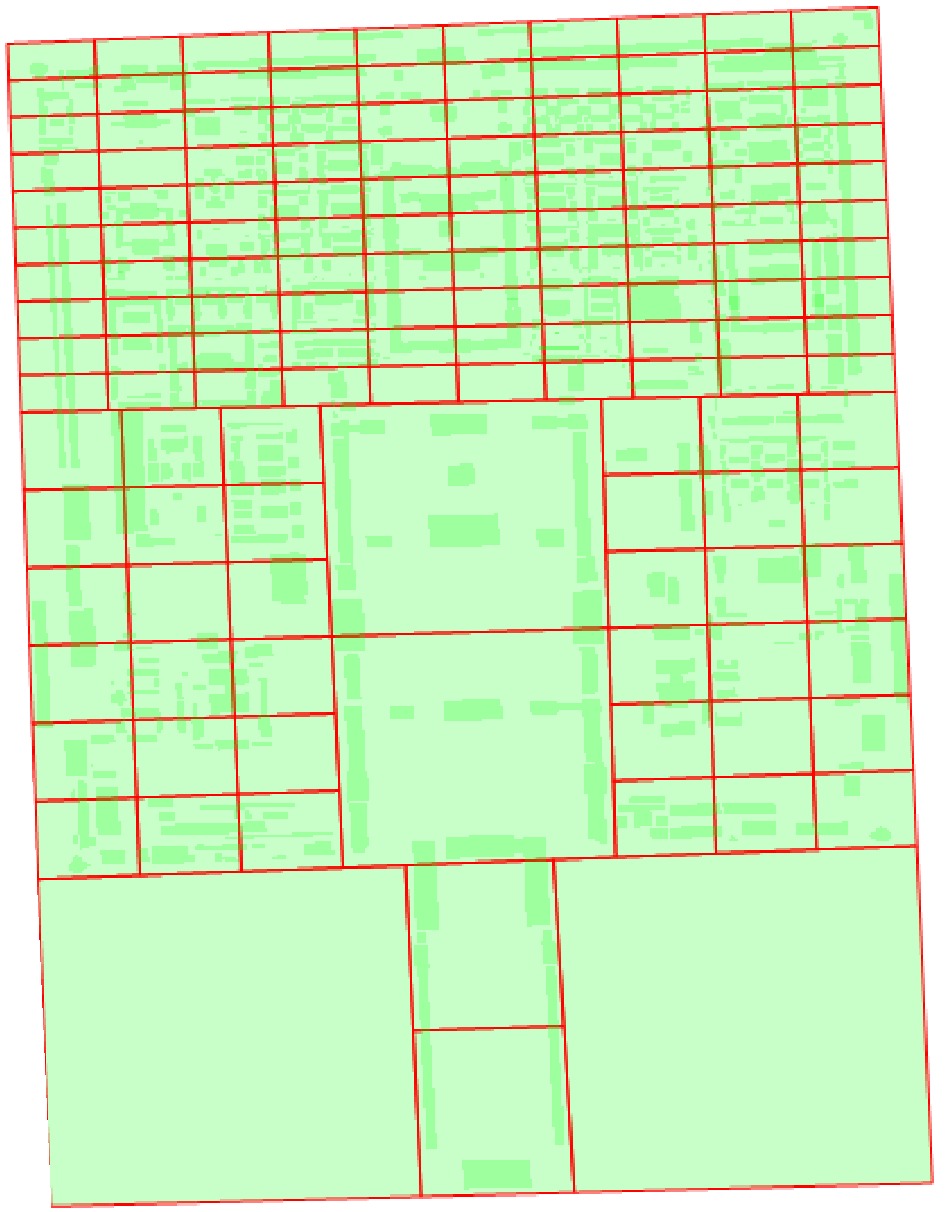
Figure 3.
Grid plot diagram.
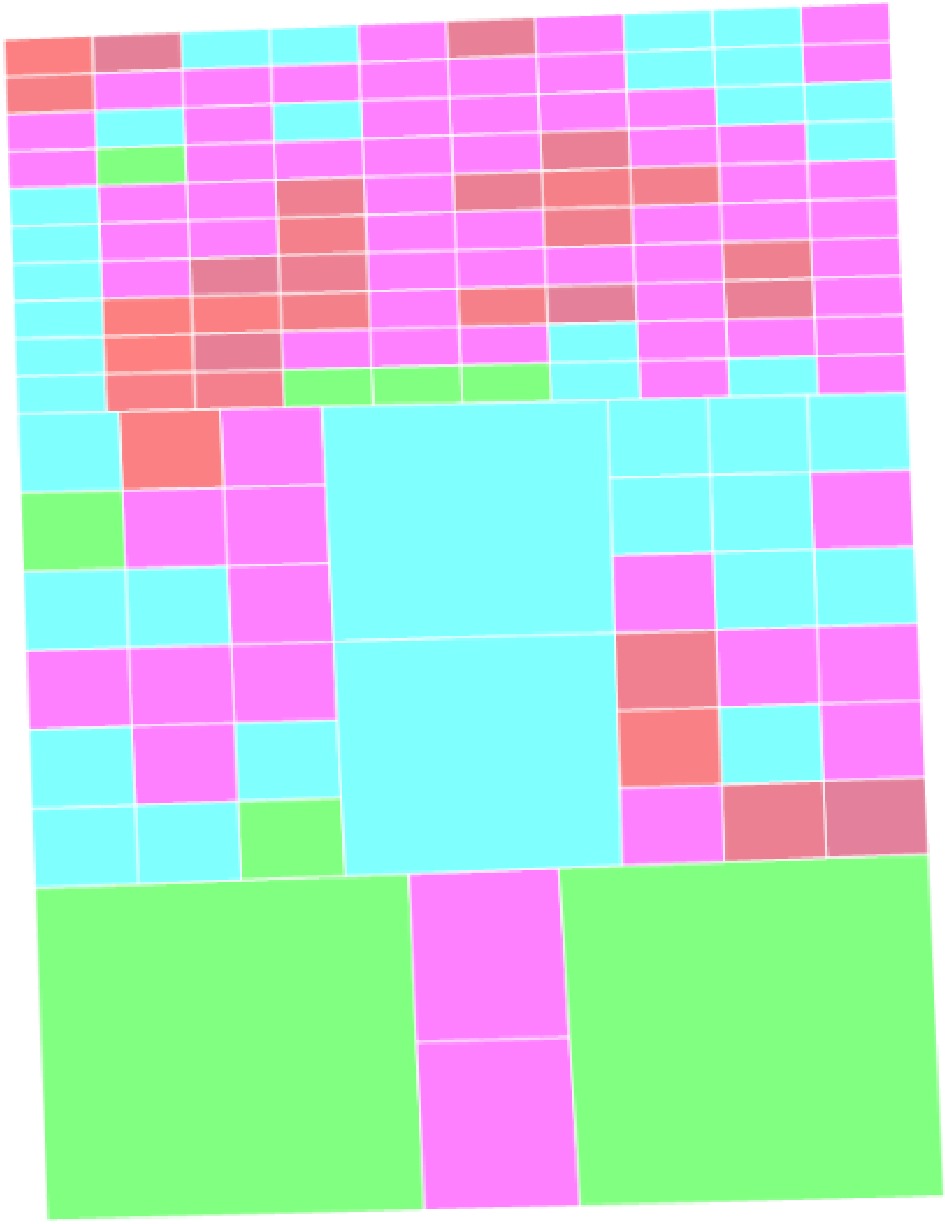
Figure 4.
Fire risk diagram.
-
This article uses a fuzzy comprehensive evaluation method that combines fuzzy mathematics and an analytic hierarchy process to study the fire risk of large Ming and Qing ancient architectural buildings. Firstly, the analytic hierarchy process is used to calculate the weights of each indicator. Then, the data of each indicator is blurred to obtain the final risk factors of the model. Finally, the MHMapGIS software is used for secondary development to apply this method to a certain instance, i.e. the Palace Museum. After gridding and vectorizing the relevant data, it is visualized. From the results, the overall distribution of fire risks in the region is intuitive and reasonable, and relevant prevention suggestions are proposed for the areas with higher risks. On the grid deployment, the function had been addressed through code implementation and algorithm optimization. Overall, this study provides feasible ideas and references for the prevention and emergency measures from the large-scale palace fire risk assessment.
-
The authors confirm contribution to the paper as follows: study conception and design: Wang Z, Di C (small portion); draft manuscript preparation: Wang Z; analysis and interpretation of results: Wang Z, Peng J, Liu X; data supplying: Zhang Z, Wang Y. All authors reviewed the results and approved the final version of the manuscript.
-
All data generated or analyzed during this study are included in this published article.
The research is funded by the National Key Research and Development Program of China (No. 2021YFC1523500).
-
The authors declare that they have no conflict of interest.
- Copyright: © 2024 by the author(s). Published by Maximum Academic Press on behalf of Nanjing Tech University. This article is an open access article distributed under Creative Commons Attribution License (CC BY 4.0), visit https://creativecommons.org/licenses/by/4.0/.
-
About this article
Cite this article
Wang Z, Peng J, Liu X, Di C, Zhang Z, et al. 2024. Research on fuzzy comprehensive evaluation of fire risk in ancient buildings. Emergency Management Science and Technology 4: e018 doi: 10.48130/emst-0024-0018 

Research on fuzzy comprehensive evaluation of fire risk in ancient buildings
- Received: 04 May 2024
- Revised: 23 July 2024
- Accepted: 03 August 2024
- Published online: 03 September 2024
Abstract: The study of the distribution pattern of fire risk in ancient buildings can provide a starting point for emergency measures to be taken in case of possible fires. Based on the fire characteristics, system complexity, and geographic information attributes of large palace ancient building complexes, this paper adopts a fuzzy comprehensive evaluation method combining fuzzy mathematics and analytic hierarchy process to construct a fire risk evaluation system for ancient buildings, which includes six criteria and 28 indicators such as the value index, and the fire likelihood. For the evaluation method of this system, the expert scoring and Analytic Hierarchy Process are used to determine the weights of various indicators. Then, the multiple rounds of expert analysis with a review of relative literature, the membership degree of each indicator is analyzed one-by-one, and the final risk model, and risk factor are determined. By combining MHMapGIS technology, this comprehensive evaluation method was applied as an example to the Imperial Palace (large Ming and Qing ancient architectural buildings) in Beijing (China) for grid and visual analysis, and the rationality of the results were verified. The evaluation results can intuitively and reasonably show the distribution of fire risk, indicating that the constructed evaluation system and its model method display a certain of feasibility.