ARTICLE   Open Access    

Gibberellin delays kiwifruit postharvest ripening via the AcDELLA gene family

More Information
  • Received: 02 December 2024
    Revised: 23 January 2025
    Accepted: 11 February 2025
    Published online: 04 March 2025
    Plant Hormones  1 Article number: e005 (2025)  |  Cite this article
  • Gibberellin (GA) has a significant regulatory role in the growth and development of higher plants. DELLA proteins are the key negative regulators of the gibberellin signalling pathway. However, the genomic overview of the kiwifruit DELLA gene family and their function on kiwifruit ripening has not yet been studied. Exogenous GA3 can effectively maintain postharvest kiwifruit firmness and delay the ripening process. Eight AcDELLAs genes were identified from the kiwifruit genome and named as AcDELLA1 to AcDELLA8 by the order of chromosomal localization. Sequence analysis confirmed that the N terminus of all eight AcDELLA proteins contained high-conservation DELLA and TVHYNP motifs. Phylogenetic analysis showed that AcDELLA1, and AcDELLA3 were highly homologous with AcDELLA5 and AcDELLA6. The gene expression of AcDELLA3/4/5/6 were significantly induced by GA3 treatment, while, GA3 delayed the expression of AcDELLA7, and AcDELLA8 maintained higher level in GA3 group than in control. Correlation analysis between physiological parameters and AcDELLAs gene expression demonstrated that AcDELLA3/4/5/7/8 had a marked correlation with firmness, TSS, and ethylene production. All these results showed that GA3 treatment could inhibit kiwifruit postharvest ripening and prolong storage time, and these GA-responsive DELLAs may play important roles in this process.
  • Passion fruit (Passiflora edulis), belonging to the Passifloraceae family and the Passiflora genus, is widely cultivated in tropical and subtropical regions[1,2]. It is renowned for its aromatic fruits, which exhibit fragrances reminiscent of various fruits, including bananas and pineapples. The fruit is not only nutritionally rich but can also be harvested year-round, contributing significantly to its economic value[36]. Moreover, passion fruit displays vibrant and large flowers with a distinctive secondary corona structure – a white or colorful fringe-like structure formed between the petals and pistils[2]. It also holds great significance as a horticultural plant, finding widespread use in applications like fence landscaping and small potted plants[7,8]. Furthermore, the special floral structure (sepal-petal-corona-stamen-carpel) in passion fruit also makes it an excellent and unique plant model for investigating floral organ morphology.

    MADS-box gene family members are ubiquitously distributed among plants, animals, and fungi, playing crucial roles throughout plant growth and development[911]. MADS-box genes are instrumental in governing a spectrum of biological processes[1214], encompassing floral transition, control of flowering time, endosperm and embryo development, seed germination, fruit development, abiotic stress responses, and notably, they assume central roles in the morphogenesis of plant floral organs[15,16]. Based on protein domain characteristics and phylogenetic tree relationships, the MADS-box gene family can be classified into two primary types: Type I and Type II[17]. Type I genes can be further divided into three subclasses: Mα, Mβ, and [18], while Type II genes, also known as MIKC-type genes in plants, consist of the MIKCC and MIKC* groups. Moreover, the MIKCc group can be further classified into 12 major subclades[19]. Notably, Type I genes have undergone more rapid evolutionary changes from birth to death compared to Type II genes[20]. Both Type I and Type II protein sequences share a conserved domain named as MADS-domain, comprising 58-60 amino acids located in the N-terminal region, which serves as an identifying feature of MADS-box proteins. Whereas, Type II MADS-box proteins in plants possess three additional domains in addition to the MADS-box domain: an intervening region with relatively low conservation, a moderately conserved Keratin-like domain, and a variable C-terminal region[21].

    Among the MIKCC-type genes, specific members are known to form the well-established ABC(D)E model, providing a genetic basis for floral organ specification and development[22,23]. According to this model, the identification of floral organs in each whorl is governed by unique combinations of genes from classes A, B, C, D, and E. Sepal identification is jointly determined by A- and E-class genes, whereas petals are controlled by A-, B-, and E-class genes. The formation of stamens relies on B-, C- and E-class genes, while carpels are regulated by C- and E-class genes. Ovule specification is particularly controlled by C-, D-, and E-class genes[2325]. In MADS-box gene family of Arabidopsis thaliana, numerous functional genes have been confirmed to be associated with the ABC(D)E model. For instance, A-class genes include APETALA1(AP1)[26]; APETALA3(AP3) and PISTILLATA(PI) belongs to class B[27,28]; AGAMOUS (AG) is a C-class gene and also involved in floral meristem development[29]; class D gene AGL11 is expressed in ovules[30]; the E class comprises SEPALLATA (SEP1, SEP2, SEP3, and SEP4), which exhibit functional redundancy and are required for specifying the identity of all floral organs[31,32]. Proteins encoded by ABC(D)E model genes form quaternary complexes that bind to CArG-box (CC[A/T]6GG) of DNA sequences, and this complex subsequently acts on downstream target genes to regulate flower development[33]. Additionally, MADS-box genes in A. thaliana perform various functions in other development processes, AGAMOUS-LIKE 20 (AGL20) serves as a key activator in integrating floral inductive pathways[34] , while FLC and SVP are involved in regulating flowering time[35]. AGL21 and AGL12 are associated with root development[36,37], and the AGL6 is involved in floral meristem and seed development[38]. FRUITFULL (FUL), SHATTERPROOF 1 and 2 (SHP1 and SHP2), collectively function in the complex regulation of fruit ripening and development[39].

    The distinctive floral morphology of passion fruit makes it an excellent candidate for the study of floral organogenesis and enhances our understanding of the ABC(D)E model. While extensive research has explored MADS-box gene family members in various plants[4043], a comprehensive investigation of these members in passion fruit has not yet been carried out. Here, we identified a total of 52 MADS-box genes in passion fruit and conducted a systematic analysis, including analysis of gene structure, motif composition, phylogenetic relationships, chromosomal localization, collinearity, and expression patterns. Notably, we also proposed an ABC(D)E model to elucidate the regulation of the unique floral structure (sepal-petal-corona-stamen-carpel) in passion fruit. Our findings could provide valuable insights for further functional investigations of passion fruit MADS-box genes and their potential applications in floral modification breeding.

    Passion fruit genome and protein sequences were obtained from the National Genomics Data Center (NGDC) database (https://ngdc.cncb.ac.cn/) under the accession number GWHAZTM00000000. We employed two distinct strategies, namely the Hidden Markov Model (HMM) search and BLAST search, to identify MADS-box genes in passion fruit. Regarding the HMM method, the MADS-box SFR family domain (PF00319) was sourced from the Pfam database (www.pfam.org) and subsequently applied for a comprehensive search against the passion fruit protein sequences using HMMER3 (v3.3.2) software (http://hmmer.janelia.org/)[44]. Simultaneously, plant MADS-box protein sequences were obtained from the NCBI database (www.ncbi.nlm.nih.gov) and used as initial queries for BLASTP searches. Only homologous sequences with an E-value of less than 1e-5 were retained for subsequent analyses. The sequences identified from both the HMM search and BLAST search were consolidated and the redundant members were removed to produce a set of preliminary MADS-box candidates. These candidates then underwent rigorous verification of the MADS-box domain through the SMART (http://smart.embl-heidelberg.de)[45] and CDD (Conserved Domain Database) search (www.ncbi.nlm.nih.gov/cdd)[46] . The confirmed MADS-box genes were renamed according to their positions on the passion fruit chromosomes. Subcellular localization analysis was conducted using the WoLF PSORT tool (https://wolfpsort.hgc.jp), while the ExPASy website tool (www.expasy.org)[47] was harnessed to predict molecular weight (MW), isoelectric point (pI), and the grand average of hydropathicity (GRAVY).

    Multiple sequence alignment of all 52 putative MADS-box protein sequences was performed by MUSCLE[48], and the alignment was visualized and edited by software Jalview v 2.11.2.0[49]. For phylogenetic analysis, the 105 MADS-box protein sequences of Arabidopsis were downloaded from the TAIR database (www.arabidopsis.org)[18], those sequences were combined with putative members from passion fruit to construct the phylogenetic tree. The multiple protein sequence alignment of all 157 protein sequences was produced using software MAFFT v7.407[50]. The resulting alignments were used for exploring the phylogenetic relationship of MADS-box protein in Arabidopsis and passion fruit. Phylogenetic analysis was performed by software IQ-TREE v1.6.12[51] with maximum likelihood estimation based on the most suitable model and 1000 bootstraps. The phylogenetic tree was visualized using Evolview (https://evolgenius.info/evolview-v2/)[52].

    To identify the conservative motifs among the putative MADS-box members of passion fruit, the full-length protein sequences were analyzed website tool MEME (https://meme-suite.org/meme/tools/meme)[53] with parameters that the maximum number of finding motifs is 10. Exon-intron structure of MADS-box genes were distinguished using GFF files, which was acquired from the annotation information of the passion fruit genome. The exact region of conservative MADS-box domain was identified from the CDD (Conserved Domain Database) database (www.ncbi.nlm.nih.gov/cdd)[46].

    To explore the possible-regulator-factors of MADS-box genes from passion fruit, TBtools v1.1047 software[54] was used to extract the 2000-bp upstream region as putative promoter regions, which end with the translation initiation codon of each MADS-box genes. The cis-acting elements contained in promoter regions were marked using the PlantCARE database (http://bioinformatics.psb.ugent.be/webtools/plantcare/html)[55], and the statistics analysis and plotting were finished using R package pheatmap (https://CRAN.R-project.org/package=pheatmap).

    The exact location of MADS-box genes was extracted from the annotation file of the passion fruit genome, and anchored to corresponding chromosomes. Duplication events of genes occurring in the evolution of the passion fruit genome were analyzed by Multicollinearity Scanning Toolkit (MCScanX)[56] with default parameters. The genomic data of Oryza sativa (v7.0), Solanum lycopersicum (ITAG3.2), A. thaliana (TAIR10), Vitis vinifera (Genoscope.12X), Zea mays (RefGen_V4) were retrieved from the JGI Phytozome database (https://phytozome-next.jgi.doe.gov). A similar procedure was also applied to demonstrate the collinearity relationships and gene duplications of orthologous MADS-box genes obtained from passion fruit and these five species. The result was visualized by functions of TBtools[54]. Based on the above results of duplicated events within passion fruit, the ratios Ka/Ks of tandem duplicated and segmental duplicated gene pairs were also calculated using TBtools[54].

    All MADS-box protein sequences were submitted to SWISS-MODEL (https://swissmodel.expasy.org)[57] for predicting tertiary structure with homology modeling method, and secondary structures could be marked by the corresponding original model from PDB databases (www.rcsb.org). The predicted models were visualized using Pymol[58].

    The fresh samples of passion fruit (P. edulis) were collected from the orchard located in the Institute of Horticulture, Guangxi Academy of Agricultural Sciences (China). The whole floral tissue was divided into bract, sepal, corona filament or corona, stamen, stigma, ovule (dividing under dissecting microscope). The identification of development stages of floral tissues was based on the horizontal width of buds with bracts (more details about distinguishing different development stages are listed in Supplemental Table S1). Samples of leaves, stems and tendril tissues were collected at 110 d after anthesis. The fruit were collected at 53 d post anthesis (DPA), DPA60, DPA100 and DPA128, respectively. The tissues samples were immediately frozen in liquid nitrogen after picking and stored at −70 °C.

    The grown and healthy plants of passion fruit were subjected to abiotic stress treatments (cold and heat) with three biological replicates. The whole plants were transferred into a growth chamber with temperature of 20 °C as the cold-stress condition while the heat-stress condition had a temperature of 30 °C. Samples of floral buds were collected under different treatment times (1, 4, 12, 24 h for heat stress; 4, 24 h for cold stress). Plants cultivated under 25 °C were used as control. All samples were collected for RNA extraction.

    Reference to previous common methods of RNA extraction[59], total RNA from different tissues was extracted by RNA extraction Kit (Omega Bio-Tek, Shanghai, China) with manufacturer's protocol. Following a standardized process, RNA samples were quantified and PCR library construction was performed. The analysis result was sequenced using NEB next Ultra RNA Library Prep Kit (NEB, Beverly City, MA, USA) for Illumina Biolabs. Each biological replicate used 1 µg RNA as an experiment sample. After the related processing flow of initial RNA-seq data file, TPM value of RNA-seq for each PeMADS gene were calculated, and the heatmap of the TPM value was constructed using R package (pheatmap) and chiplot (www.chiplot.online) with log2 (TPM + 0.0001) as the unit of measure.

    Based on the above standards of identifying different development stages for flowers, the tissues used for qRT-PCR analysis was br1 (bract at stage1), se1, pe1, ca1, st8, sg1 and ov5. Two-month-old healthy passion fruit plants were also subjected to ABA (100 μM) and GA (100 μM) treatments, while untreated plants served as controls. Leaf samples from phytohormone-treated plants were collected at 0, 12, 24, and 48 h post-treatment from three independent seedlings. All collected samples were immediately stored in liquid nitrogen before total RNA extraction. The Trizol reagent (Invitrogen, Carlsbad, CA, USA) was used to extract total RNA. ThermoScript RT-PCR kit (Thermo Fisher Scientific, Carlsbad, CA, USA) was used for reverse transcription. The quantitative real-time PCR (qRT-PCR) was performed by the following procedures: 95 °C for 30 s, followed by 40 cycles of 95 °C for 10 s and 60 °C for 30 s. The reaction volume was 20 µl, including 1 µl cDNA per sample, 10 µl 2× Taq Pro Universal SYBR qPCR Master Mix (Vazyme, Nanjing, China) and 0.4 µl per primer, the whole system was complemented by ddH2O to 20 µl. The reaction was carried out in a Bio-Rad Real-time PCR system (Foster City, CA, USA) with three biological replicates per sample. EF1α was used as a reference gene[60]. The relative expression levels were calculated using the 2−ΔΔCᴛ method. Primers were designed using the IDT website (https://sg.idtdna.com/pages). Primer sequences are listed in Supplemental Table S2.

    To ensure a comprehensive screening of gene family members, the putative PeMADS genes were identified by combining the results from hidden Markov model (HMM) and the blast search. Ultimately, a total of 52 MADS-box gene family members were successfully identified from the whole genome of passion fruit (Table 1). The members were designated as PeMADS1-PeMADS51 based on their sequential positions on the chromosomes, while a single member (P_eduliaContig70023089.g) mapped to a contig was named PeMADS52. Predicted physicochemical properties of PeMADS genes coding proteins are list in Table 1. These proteins exhibit variable lengths, with the longest one being 650 aa (PeMADS7) while the shortest one is 66 aa (PeMADS29). Correspondingly, PeMADS7 possesses the heaviest molecular weight (MW) of 71,572.97 Da, while PeMADS29 has the lightest protein, only 7,697.02 Da. The protein isoelectric points (PI) range from 4.89 (PeMADS41) to 10.69 (PeMADS29). According to the Instability Index[61], only PeMADS4, PeMADS13, and PeMADS23 are considered stable proteins (value is smaller than 40). The aliphatic amino acid index (A.I.) varies from 66.05 (PeMADS4) to 100.41 (PeMADS27), indicating a significant difference in thermal stability among the PeMADS proteins. With the exception of PeMADS22, the grand average of hydropathicity score (GRAVY) of other proteins are negative, which means only PeMADS22 is a hydrophobic protein, and most proteins are hydropathicity. The prediction of subcellular localization reveals that the major action site of proteins is the nucleus, followed by chloroplasts and mitochondria. Two members, PeMADS23 and PeMADS28, are located in the cytoplasm. For detailed sequence information of all members, refer to Supplemental Table S3.

    Table 1.  Characteristics about 52 PeMADS proteins of passion fruit
    Gene nameGene IDChromosomeSize (aa)MW (Da)PIInstability
    Index
    A.I.GRAVYPredicted Location
    PeMADS1P_edulia010000232.gLG0135540,132.206.3642.6675.27−0.63Nucleus
    PeMADS2P_edulia010000334.gLG0119021,875.009.7648.9376.47−0.826Nucleus
    PeMADS3P_edulia010000557.gLG0119422,380.579.7348.1376.91−0.818Nucleus
    PeMADS4P_edulia010000858.gLG0138742,577.71935.1666.05−0.687Nucleus
    PeMADS5P_edulia010002143.gLG0122525,469.3210.3148.6472.8−0.629Nucleus
    PeMADS6P_edulia010002220.gLG0125129,014.905.8463.8980−0.551Nucleus
    PeMADS7P_edulia010002256.gLG0165071,572.978.8842.5789.43−0.259Nucleus
    PeMADS8P_edulia010002353.gLG0122325,645.299.5153.2283.54−0.658Nucleus
    PeMADS9P_edulia010002348.gLG0122325,567.898.1157.0892.29−0.209Mitochondria
    PeMADS10P_edulia010002733.gLG0122325,520.758.1258.3390.54−0.242Mitochondria
    PeMADS11P_edulia010002726.gLG0122325,663.329.5150.7482.24−0.671Nucleus
    PeMADS12P_edulia010003864.gLG0122725,943.719.085382.91−0.609Nucleus
    PeMADS13P_edulia010004192.gLG0112814,242.5410.3337.3691.33−0.087Nucleus
    PeMADS14P_edulia010004199.gLG0116619,203.349.345.2793.31−0.031Nucleus
    PeMADS15P_edulia010004299.gLG0134238,721.376.0855.6974.18−0.57Nucleus
    PeMADS16P_edulia010004354.gLG0128332,306.418.2256.2575.51−0.63Nucleus
    PeMADS17P_edulia010004671.gLG0127431,672.199.2843.2380.47−0.444Nucleus
    PeMADS18P_edulia010004713.gLG0121224,765.599.7444.184.2−0.322Nucleus
    PeMADS19P_edulia010005413.gLG0115417,785.609.6143.3287.34−0.638Nucleus
    PeMADS20P_edulia020006530.gLG02789,025.349.6944.2483.72−0.615Nucleus
    PeMADS21P_edulia020007073.gLG0224428,034.946.4856.5785.53−0.696Nucleus
    PeMADS22P_edulia030008390.gLG0314115,691.086.840.5989.360.119Nucleus
    PeMADS23P_edulia030008412.gLG0323327,189.878.3937.5386.57−0.842Cytoplasm
    PeMADS24P_edulia030008784.gLG0325529,597.757.6962.0485.25−0.698Nucleus
    PeMADS25P_edulia030008868.gLG0323327,283.188.3264.5785.75−0.738Mitochondria
    PeMADS26P_edulia030009361.gLG0322925,959.029.244.399.21−0.374Nucleus
    PeMADS27P_edulia040010097.gLG0429634,731.288.3674.87100.41−0.349Nucleus
    PeMADS28P_edulia040010305.gLG0422626,236.009.1845.2975.49−0.773Cytoplasm
    PeMADS29P_edulia040010846.gLG04667,697.0210.6939.1779.7−0.239Nucleus
    PeMADS30P_edulia050011612.gLG05677,764.039.8343.493.13−0.452Nucleus
    PeMADS31P_edulia050012002.gLG0511712,998.9710.2146.3866.67−0.506Nucleus
    PeMADS32P_edulia060013073.gLG0624227,917.838.7244.4482.64−0.695Nucleus
    PeMADS33P_edulia060013103.gLG0616819,304.068.4350.7891.19−0.642Nucleus
    PeMADS34P_edulia060013465.gLG068810,152.749.5976.0982.95−0.448Nucleus
    PeMADS35P_edulia060013580.gLG0624027,317.309.1749.1284.17−0.561Nucleus
    PeMADS36P_edulia060013765.gLG0629131,621.315.3352.1372.51−0.417Chloroplast
    PeMADS37P_edulia060015308.gLG0633137,420.775.2862.0671−0.684Nucleus
    PeMADS38P_edulia060015605.gLG0622125,409.119.1740.883.8−0.576Nucleus
    PeMADS39P_edulia060015604.gLG0618821,618.598.8143.1884.04−0.624Nucleus
    PeMADS40P_edulia060016494.gLG0624328,153.007.1357.7991.11−0.658Nucleus
    PeMADS41P_edulia060016711.gLG0617520,210.434.8954.1869.66−1.058Chloroplast
    PeMADS42P_edulia060016709.gLG0617920,635.045.0558.7273.02−1.001Chloroplast
    PeMADS43P_edulia060016710.gLG0619822,057.865.6958.4181.82−0.657Chloroplast
    PeMADS44P_edulia070017407.gLG0718120,894.808.8571.8170.61−0.809Nucleus
    PeMADS45P_edulia070017456.gLG0724828,225.449.5847.590.48−0.497Nucleus
    PeMADS46P_edulia070017776.gLG0717219,278.411050.288.37−0.621Nucleus
    PeMADS47P_edulia080019101.gLG0821424,404.509.6653.6570.23−0.866Nucleus
    PeMADS48P_edulia080020106.gLG0813014,779.159.3842.3584.69−0.338Nucleus
    PeMADS49P_edulia090020757.gLG0920623,473.426.9844.3267.57−0.681Nucleus
    PeMADS50P_edulia090021063.gLG0920423,738.659.2344.2686.96−0.739Nucleus
    PeMADS51P_edulia090021542.gLG0921424,401.799.0659.6967.48−0.697Nucleus
    PeMADS52P_eduliaContig70023089.gContig725328,637.179.4649.6494.47−0.316Nucleus
     | Show Table
    DownLoad: CSV

    The protein sequences of 52 candidate PeMADS were subjected to alignment analysis to further elucidate the constitution and structure of MADS-domain (Supplemental Table S4). As is shown in Fig. 1a, there is a highly conserved domain in all 52 PeMADS proteins. The sequence logo was utilized to accurately depict the composition of the MADS-box region. By employing the SWISS-MODEL web server and utilizing protein homology modeling, a three-dimensional (3-D) model of MADS-box domain was constructed. This model could be divided approximately into three regions, comprising one α-helix and two β-sheets (Fig. 2b). Through analysis of amino acid distribution at each residue position within the MADS domain, 24 sites out of the 57 residues were identified as highly conserved if the percentage of a specific amino acid exceeded 80% at that particular site (Fig. 2c). Integrating the aforementioned information with the proteins' tertiary structure, the first helix contained 14 conserved residues (Arg-17, Gln-18, Val-19, Thr-20, Lys-23, Arg-24, Arg-25, Gln-27, Leu-28, Lys-30, Lys-31, Glu-34, Leu-35 and Cys-39), while the first sheet region contained one conserved residue (Phe-48), and the second region lacked any conserved residues. Among 57 residues, Arg-3, Arg-17, Arg-24, Lys-31, Glu-34 exist in all protein sequences.

    Figure 1.  Characterization of MADS-box domain. (a) Multiple sequence alignment of MADS-domain region from 52 PeMADS proteins. (b) Predicted three-dimensional structure of MADS-domain. (c) Distribution of amino acids in conserved residues of MADS-domain: number represents the positions of residues; bottom label represents species of amino acids.
    Figure 2.  Phylogenetic tree of PeMADS proteins from Passiflora edulis (Pe) and Arabidopsis thaliana (At). Red starts and green triangles indicate passion fruit and Arabidopsis, respectively. The circle placed on the tree indicated the bootstrap value (≥ 90, red circle; 60~90, yellow circle; < 60, not shown).

    To examine the phylogenetic relationships among MADS-box proteins from different species and ascertain the subfamily to which each PeMADS belong, a phylogenetic tree was constructed. The tree was based on the alignment result of MADS protein which is 105 sequences from Arabidopsis and 52 sequences from passion fruit (Fig. 2, Supplemental Table S5). According to previous studies and topology of the phylogenetic tree[18,6264], the PeMADS members were classified into two groups: type I, consisting of nine members (four as Mα, three as Mβ, and two as Mγ) while 43 members were classified as type II. Within the type II group, only six PeMADS proteins belonged to MIKC* category, while the remaining members were classified as MIKCC. The MIKCC proteins were further divided into 12 clades. Sequences of both passion fruit and Arabidopsis could be identified in all clades. Most PeMADS were determined in AG-like clade (six members), while the PI-like, FLC-like and AP1-like clades each had only one member. Inside the PI-like clade, the Arabidopsis MADS-box proteins showed homology with only one other member (PISTILATA and PeMADS28).

    The phylogenetic relationship of PeMADS proteins was depicted using a phylogenetic tree with bootstrap values. The classification obtained from the phylogenetic tree analysis aligned with the aforementioned analysis (Fig. 3a). To identify and compare the common motifs of proteins within different groups, the MEME search tool was employed to 52 PeMADS proteins, and the first ten motifs with the highest conservation were detected (motif 1−10; Fig. 3b). As illustrated in the figure, members within the same group typically exhibited similar construction of motifs, particularly noticeable in B sister, AP3-like group and AGL6-like group. PeMADS proteins displayed varying numbers and distribution of conserved motifs, with a maximum of seven motifs and a minimum of one. Except for Mβ members, motif 1 could be observed in all proteins, which could be an obvious character of MADS-box proteins. Generally, the construction of Type I members was simpler than Type II members, especially Mγ group which contained only one motif. The location of MADS-box domain sequences was mapped to the full-length proteins (Fig. 3c). All members could detect MADS domain, whereas the length of the MADS domain is relatively short in the Mβ group. Except for MIKC* group, most Type II members contained K-box domain. Type II protein lacking the K-box domain were shorter than same group members, possibly due to the loss of terminal protein sequences.

    Figure 3.  The phylogenetic relationship, conserved motifs and gene structures of PeMADSs. (a) The phylogenetic tree of 52 PeMADS proteins. (b) Distribution of conserved motifs in PeMADS proteins. (c) Distribution of MADS-domain and K-domain of PeMADS proteins.(d) The gene structures of the PeMADSs, include coding sequences (CDS) and untranslated regions (UTR).

    To investigate the structural diversity of PeMADS gene, the intron-exon organization of coding sequences was visualized reference to the GFF annotation file of passion fruit genome (Fig. 3c). The structure of type II group (MIKCC and MIKC*) was more complex. Nearly 33 (76.74%) type II members contained at least five CDS regions, among which the CDS regions of PeMADS7 was up to 15. Otherwise, type I groups (Mα, Mβ and Mγ) possessed less CDS regions, most members only had zero or single CDS regions, only PeMADS36 had two introns. The above discovery suggests that the transcription and splicing process of type II genes might be more complex than type I.

    Cis-element species and distribution could partly imply the transcription regulation and the expression pattern of associate genes. The putative promoters of PeMADS genes,spanning 2000 base pairs, were predicted using the PlantCARE server (Supplemental Table S6). A total of 39 types of cis-elements were identified and categorized into five groups: light response (16), phytohormone response (10), stress response (7) and plant growth regulation (6). Figure 4b illustrates that the majority of genes exhibited a higher proportion of light-responsive elements, followed by phytohormone-responsive elements, whereas elements associated with plant growth regulation were the least abundant. The proportions indicate that the expression of the PeMADS gene was substantially affected by light. G-box element (127), Box 4 (117), GT1-motif (70) were the most common light-responsive elements. Phytohormone-responsive elements accounted for a considerable portion of the cis-elements, with ABRE (134; abscisic acid response), AAGAA motif (106; abscisic acid response), CGTCA motif (79; MeJA response) and ERE (53; ethylene response) being the most frequently identified elements. Some types of elements centralized exist on one gene, for instance, the number of ABRE element was obviously higher in PeMADS2 and PeMADS50, implying those genes might be more possible to play a vital role in corresponding phytohormone regulation. ARE elements (135; anaerobic induction), 58 drought stress response elements (MBS and DRE core), 25 WUN-motif (mechanical injury response) and 38 LTR (low temperature response) indicated that PeMADSs could respond to abiotic stresses. ARE elements could be detected in promoter sequences of all genes, speculating anaerobic conditions was one of critical factors which induce the transcription of PeMADS gene. However, cis-elements related to plant growth such as CAT-box, CCGTCC-box, and RY-element were comparatively limited. Within the promoter region of each gene, the count of such elements did not exceed four.

    Figure 4.  (a) Analysis of cis-elements in the promoter region of PeMADS genes. (b) Heatmap of the number of cis-elements, the different color represents the number of cis-elements. (c) The sum of cis-elements in categories shown as a histogram.

    Based on the passion fruit genome's annotation files, 51 out of 52 PeMADS genes were assigned to nine linkage groups (LG01-LG09), and only one member (PeMADS52) was found on unassembled contig 7. The majority of MADS genes were concentrated on LG01 (19, 36.54%), particularly on the terminal region of LG01, encompassing approximately 33 Mb and containing 15 PeMADS genes. LG06 had the second highest number of MADS genes (12, 23.07%), followed by LG03 (5, 9.61%). The remaining linkage groups (LG02, LG04, LG05, LG07, LG08, LG09) contained only 1−3 PeMADS genes each. Numerous MADS genes were located near the proximate or the distal ends of the linkage groups. There was no apparent evidence suggesting a direct connection between the number of MADS genes and the length of linkage groups.

    Based on the collinearity analysis conducted using MCScanX, only one tandem duplication gene pair, PeMADS42 and PeMADS43, was identified from LG06. Additionally, a total of 20 segmental duplication gene pairs were discovered, comprising 28 PeMADS genes located on duplicated segments across nine linkage groups (Fig. 5). Most duplicated gene pairs belong to the MIKCc group (24 pairs, accounting for 85.71% of the total). The MIKC* group and Mα have two gene pairs respectively, and those genes could be produced by whole genome duplication or the segmental genome duplication events.

    Figure 5.  Distribution and collinearity of PeMADS genes in the passion fruit genome. PeMADSs marked by red has synteny with other genes. Gray lines indicate synteny blocks in passion fruit genome, brown lines indicate segmental duplicated MADS gene pairs of passion fruit.

    To further investigate the evolutionary process of the passion fruit MADS-box gene family, a comparative systemic analysis was conducted between passion fruit and six representative species (Fig. 6), which cover three dicots (A. thaliana, S. lycopersicum and V. vinifera) and two monocots (O. sativa and Z. mays). The number of synteny blocks observed in A. thaliana, S. lycopersicum, V. vinifera, O. sativa and Z. mays were 996, 982, 922, 399 and 328 respectively. Among the 52 PeMADS genes, different numbers of genes exhibited syntenic relationships with the six species. A total of 33 members show colinearity with grape (33), followed by tomato (26), Arabidopsis (19) and rice (5), maize contains the least number (2). These findings suggest that the collinearity relationship between passion fruit and dicotyledons was closer than that between monocotyledons. Notably, most identified PeMADS exhibited synteny relationships with more than one species. PeMADS15 showed collinear counterparts in passion fruit and five other species, indicating its potential existence prior to ancestral divergence and its association with vital characteristics. Whereas some of the PeMADS syntenic gene pairs were exclusively found in dicotyledons or monocotyledons, suggesting their emergence after the divergence between these two groups. Syntenic PeMADS genes in five species are highlighted in Supplemental Table S7.

    Figure 6.  Synteny analysis of PeMADS genes and five representative plants species. Gray lines in the background indicate the collinear blocks between passion fruit and other plant genomes, while red lines highlight the systemic gene pairs of PeMADSs between passion fruit and other plant genomes.

    To gain insights into the evolutionary constraints affecting the passion fruit MADS-box gene family, we calculated the Ka/Ks (non-synonymous substitution/synonymous substitution) ratios for both segmental duplicated gene pairs and tandem duplicated gene pairs using the NG method. As shown in Table 2, it can be observed that all segmental duplicated gene pairs have Ka/Ks values below 1, indicating a strong purifying selective pressure acting on these duplicated gene pairs throughout evolution. In contrast, the only tandem duplicated gene pairs (PeMADS42 and PeMADS43) exhibited Ka/Ks > 1, suggesting that positive selection has influenced these gene pairs[65].

    Table 2.  The Ka/Ks ratios of the duplicated PeMADS gene pairs.
    Duplicated gene pairsKaKsKa/KsGroupDuplicated type
    PeMADS2 & PeMADS300.010MIKCC/MIKCCSegmental
    PeMADS3 & PeMADS70.130.570.24MIKCC/MIKCCSegmental
    PeMADS3 & PeMADS190.261.380.19MIKCC/MIKCCSegmental
    PeMADS8 & PeMADS110.010.020.28MIKCC/MIKCCSegmental
    PeMADS8 & PeMADS450.040.540.08MIKCC/MIKCCSegmental
    PeMADS9 & PeMADS100.010.010.43MIKCC/MIKCCSegmental
    PeMADS15 & PeMADS1600.020.29MIKC*/MIKC*Segmental
    PeMADS17 & PeMADS180.010.010.42MIKCC/MIKCCSegmental
    PeMADS17 & PeMADS280.291.290.22MIKCC/MIKCCSegmental
    PeMADS17 & PeMADS380.050.670.08MIKCC/MIKCCSegmental
    PeMADS18 & PeMADS280.221.150.19MIKCC/MIKCCSegmental
    PeMADS18 & PeMADS380.070.550.12MIKCC/MIKCCSegmental
    PeMADS20 & PeMADS470.030.510.07MIKCC/MIKCCSegmental
    PeMADS24 & PeMADS2500.010.3MIKCC/MIKCCSegmental
    PeMADS26 & PeMADS350.220.710.31MIKCC/MIKCCSegmental
    PeMADS28 & PeMADS380.321.520.21MIKCC/MIKCCSegmental
    PeMADS29 & PeMADS310.010.290.05MIKCC/MIKCCSegmental
    PeMADS32 & PeMADS330.010.020.28MIKCC/MIKCCSegmental
    PeMADS46 & PeMADS510.553.980.14Mα/MαSegmental
    PeMADS52 & PeMADS450.160.220.71MIKCC/MIKCCSegmental
    PeMADS42 & PeMADS430.140.062.42Mβ/Mβtandem
     | Show Table
    DownLoad: CSV

    The protein structure homology modeling was performed using the SWISS-MODEL database, utilizing homologous templates retrieved from the PDB database. The three-dimensional models for all PeMADS protein sequences were generated and are presented in Supplemental Table S8. The predicted structures with highest GMQE and QMEAN scores for each subfamily were visualized using PyMOL and displayed in Fig. 7. Based on previous research on MADS transcription factors, the highly conserved MADS domain structure could be broadly categorized into one α-helix and two β-sheets. The flexible intervening domain was predominantly α-helical, while the K domain consisted of three α-helices. C-terminal domain generally exhibits variable structures[66,67]. Analogously, except for PeMADS7, which has the longest protein chain and a more complex structure, the remaining members displayed comparable structures, consisting of one to three α-helices, two β-sheets. Notably, nearly all members exhibited αββ structures in the N-terminal region, resembling the MDAS domain structure identified in human and yeast. However, the structure of other regions did not correspond to the expected characteristics of the I-domain and K-domain. This discrepancy may be attributed to the availability of suitable homologous models for the majority of PeMADS protein sequences. The coverage of homology modeling was approximately 50%, primarily focused on the N-terminal region, suggesting that successful modeling of certain structures towards the C-terminal region may have been limited.

    Figure 7.  Predicted three-dimensional structures of the passion fruit MADS-box protein sequences.

    Based on the conclusions drawn from previous studies, the 'ABC(D)E model' which proposes a hypothesis for the formation and identity of floral organs, was closely relevant to the MADS-box gene family[68]. In order to gain insights into the expression pattern of MADS-box genes, the flower (dividing into six species of floral structures) and the fruit were selected as sampling parts. The expression levels of 52 PeMADS genes were detected from these tissues during different development stages (Supplemental Table S9). Only the genes with the highest TPM value exceeding 6 are shown in Fig. 8.

    Figure 8.  The expression profile of MADS-box genes in floral tissues. (a) The ABC(D)E model in Eudicots, the bottom illustration indicates the gene expression values (bar heights) of ABC(D)E members in passion fruit. (b) Gene expression patterns of MADS-box gene family from floral tissues of passion fruit.

    As shown in Fig. 8b, the expression level of Type I genes (PeMADS36/46/43) were generally lower compared to most Type II genes. As to Type II genes, PeMADS27 and PeMADS37 (MIKC* group) were detected in the early development stage and mid-and-late stage of stigmas, respectively, which might indicate genes from the MIKC* group influence stigmas development. Moreover, the expression profile within MIKCc group exhibited greater variability, with many genes showing high expression in multiple tissues. For example, PeMADS8/PeMADS11 were highly expressed in the last stage of stigmas and the last three stage of ovules. PeMADS32/33 were primarily expressed in any sampled tissues except sepals and the early stage of stamens. PeMADS17/18 were abundant in the early stages of petals, coronas, stamens, stigma and nearly all stages of ovules. Similarly, PeMADS28, also from the same subfamily, exhibited preferential expression in stamens, with slightly higher expression levels in petals and stigmas compared to other tissues. PeMADS40 was highly expressed in sepals and petals. PeMADS20 was mainly expressed in the late stage of coronas and stamens, nearly all stage of stigmas and ovules, and it was similar to the expression profile of PeMADS47, which exhibited relatively low expression in the corona, part stages of stamens and stigmas. PeMADS2/3/7 were abundant in sepals, petals and coronas. On the contrary, the expression patterns of many PeMADS genes were highly tissue-specific. For instance, PeMADS6/24/25/45/52 were abundant in all stages of ovules. PeMADS38/39 were only highly expressed in the first stage of stamen. Additionally, the expression levels of certain genes changed during the development process of specific tissue. For example, during the development of sepals and stigmas, the expression level of PeMADS35 gradually increased, and PeMADS28 displayed a similar ascending trend in stamens.

    Based on the expression profiles described above, PeMADS genes that match the expression patterns of homologues genes within the same subfamily were identified as potential members of the ABC(D)E model of passion fruit. Ultimately, PeMADS40 was categorized as an A group member, while PeMADS17, PeMADS18 and PeMADS28 belong to the B group, PeMADS20 was identified as a member of the C group, PeMADS32/PeMADS33 were classified as members of the E group. Additionally, three genes, namely PeMADS6, PeMADS24, and PeMADS25, belong to the B sister group, while PeMADS2, PeMADS3, and PeMADS7 belong to the AGL6-like group. The details of the expression trends are shown in Fig. 8a.

    To validate the reliability of predicted ABC(D)E model for passion fruit. Six PeMADS genes from different groups were selected as representatives for qRT-PCR analysis (Fig. 9b). PeMADS40, as an A group member, exhibited high expression levels in sepals, petals, and corona. B group member, PeMADS28 highly expressed in petals, stamens and sigmas. PeMADS20 (C/D group member) mainly expressed in the inner four whorls (ovule, stigma stamen and corona). PeMADS33 (E group gene) expressed in nearly all tissues excepting sepal. PeMADS6 (B sister) specifically expressed in ovules. PeMADS2 from AGL6-like group presented preferential expression in the first three whorls (sepal, petal and corona). Overall, the qRT-PCR analysis results were consistent with the RNA-seq data.

    Figure 9.  qRT-PCR analysis of part members from the ABC(D)E model. (a) Illustration of passion fruit floral structure and summarization of the ABC(D)E model in passion fruit. (b) qRT-PCR results of six representative members from the ABC(D)E model, all experiments were performed independently at least three times. Error bars represent the standard deviation. Asterisks indicate significant differences in transcript levels compared with the early development stage of bract (br1). (* p < 0.05).

    Except for the core functions in floral meristem, MADS-box genes have been reported to be involved in various growth regulatory processes, like the maturation of fruit[39]. To further investigate the tissue-specific expression of PeMADS genes, the RNA-seq data of vegetative organs (tendril, stem, leaf) and fruits with different stages of maturation were extracted for analysis. Excluding the MADS-box members with rather lower expression level (highest TPM value is less than 5), 31 PeMADSs were retained (Fig. 10a). The expression levels of partial genes were higher in fruit tissue, like PeMADS2/11/32/33/34/47/45. Notably, PeMADS34 showed significant induction during the early development stage of fruits, with its expression decreasing as the fruit matured. Most genes expressed during the fruit maturation belong to the AG-like and SEP-like subfamilies. Conversely, certain PeMADS genes were primarily detected in vegetative organs. PeMADS9/12/40 highly expressed in tendril and stem. PeMADS22/35 mainly expressed in tendril, stem and leaf. The expression level of PeMADS1/29/31 were higher in stem and leaf. It should be noticed that the members from ABCD(E) model were also associated with the development of these non-floral organs, which might indicate the diversified functions of MADS-box members.

    Figure 10.  Expression profiles of PeMADS genes in (a) non-floral organs and (b) under temperature stresses, DPA indicates days post anthesis; '1, 4, 12, 24 h' represents the time of stress treatment. Temperature of 20 °C (T20) is regarded as cold stress, while a temperature of 30 °C is regarded as heat stress (T30). The pink stars highlight the members with specific expression characteristics during fruit development or under temperature treatment.

    The differentiation of flower buds and the development of floral organs in passion fruit are highly temperature-sensitive. As observed by Chang & Cheng, high temperatures (30/25 °C) could make flower buds more susceptible to abortion, while low temperatures (20/15 °C) result in the inhibition of flower bud formation[69,70]. To explore the response of PeMADS genes under low-temperature (20 °C) and high-temperature stress (30 °C), the RNA-seq data was acquired from examined buds with a series of processing-time gradient. After excluding members with low expression levels, significant differences in expression profiles were observed among the remaining PeMADS genes under temperature stresses (Fig. 10b). Some members were induced under cold conditions, including PeMADS2/3/30/32/33/34/40. Among them, the expression of PeMADS30/32/33/40 were significantly increased with longer processing time. The change in expression were more complex under heat conditions, the expression level of most genes increased in different degrees. PeMADS38/39, were up-regulated at 1 and 4 h of processing time, while down-regulated at 12 and 24 h. As for PeMADS7/35/20/28/29/30/43, their expression levels noticeably increased at specific processing times, while the expression of PeMADS17/18/47 were repressed under heat stress. Presumably, the E-class genes (PeMADS32/33) and the A-class genes (PeMADS40) might respond to cold stress, while the C/D-class gene (PeMADS20) and the B-class gene (PeMADS28) were mainly induced under heat stress. The expression levels of the aforementioned genes are listed in Supplemental Table S10.

    To elucidate the response patterns of PeMADS genes to phytohormone treatments, qRT-PCR was employed to analyze the relative expression profiles of six selected PeMADS genes in plant leaves subjected to different phytohormones (ABA and GA) at various time points (0, 12, 24, and 48 h) (Fig. 11, Supplemental Table S11). Under ABA treatment, the expression of PeMADS2, PeMADS28, and PeMADS38 was significantly downregulated at different time points. The expression of PeMADS17 and PeMADS34 were initially induced and gradually upregulated at 12 and 24 h post treatment, followed by downregulation at 48 h. PeMADS19 exhibited a significant induction of high expression within a short period (12 h), but as the treatment time extended, the expression gradually decreased, with notable suppression observed at 48 h. In the case of GA treatment, PeMADS2 showed a gradual downregulation with the prolongation of treatment time, while the relative expression of PeMADS17 was initially suppressed at 12 h post-treatment, followed by induced upregulation, reaching its highest expression level at 24 h post-treatment. The relative expression of PeMADS19 was induced and upregulated after GA treatment, with the highest expression level observed at 48 h. Additionally, the expression of PeMADS28, PeMADS34, and PeMADS38 was all inhibited, with significant differences observed at 12 h. These findings suggested that PeMADS genes generally play roles in responding to phytohormones (Supplemental Table S11).

    Figure 11.  Expression patterns of PeMADS genes in response to phytohormones. Leaf samples were collected at 0, 12, 24 and 48 h after GA and ABA treatments. Significant differences were analyzed by the Student's t-test (* p-value < 0.05, ** p-value < 0.01, *** p-value < 0.001, and **** p-value < 0.0001).

    The MADS-box gene family plays crucial roles in the morphology development of diverse plant organs, particularly in the floral development of angiosperms[71]. Since the completion of the genome sequences of numerous significant plant species, MADS-box genes have been systematically identified and examined at the genome level in various plants. In the present work, we have successfully identified 52 MADS-box genes in the genome of the passion fruit, and conducted analyses on their phylogenic relationships, gene structure, gene synteny and prediction of cis-elements in all members. However, it should be noted that the gene number is relatively low compared to other flowering plants (angiosperms). Several common crops, such as Arabidopsis, wheat, and tomato, possess over 100 members in the MADS-box gene family. It is well-known that whole genome duplication events play a significant role in the expansion of gene numbers and species diversification. Whole-genome duplication events exert a significant influence on gene proliferation and species diversification, prominently shaping the evolutionary trajectory of flowering plants through subsequent gene losses[72]. In the case of passion fruit, the reduction of type I genes resulted in a reduction in the size of the MADS-box gene family. Moreover, on a genome scale we reveal that specific subfamilies of PeMADS primarily evolved via segmental duplication rather than tandem amplification. Furthermore, the higher number of exons in type II (MIKC) genes (ranging from 5 to 15) compared to type I (1−2) is consistent with observations in other species, including sesame, rice, and soybeans. This findings align with the more intricate and versatile functions attributed to type II (MIKC) genes in contrast to type I (M-type) genes[73,74].

    In this study, we provide a summary of the ABC(D)E model in passion fruit based on tissue-specific expression profiles. The six parts of floral organs in passion fruit were regulated by different combinations of ABC(D)E-class genes. Specifically, the carpel (including ovules and stigmas), stamens and coronas were controlled by the same pattern, B-, C(D)- and E-class genes. Petals are regulated by A-, B- and E-class genes. A-class genes is the only type functions in sepals (Fig. 9a).

    Referring to the well-studied A. thaliana MADS gene family, the classic ABC(D)E model of floral organ identities can be described as follows: AP1 belongs to A group (performing functions for sepals and petals), AP3 and PI are classified as B group (performing functions for petals and stamens), AG is identified as C group (performing functions for stamen and carpel), while SEP genes belongs to E group (performing functions in all floral whorls)[75,76]. In our study, the expression profiles of passion fruit ABC(D)E homologues partly agree with the putative model derived from A. thaliana. The regulation of petals and stamens in passion fruit is similar to that of A. thaliana, but differs in terms of carpels and sepals. With the exception of previous detected C- and E-genes, we found that B-class genes are found expressed in carpels and corona, indicating an expanded regulatory role of B-class in passion fruit. Conversely, the types of genes that regulate sepals are reduced, with only A-class genes associated with sepal development. Notably, the mutation of the B-class gene DoLL1, in Physalis floridana leads to abnormal development of ovules and stigmas, suggesting the regulatory functions of B-class genes in carpels[77]. Previous studies have speculated that the wider expression patterns could be associated with subfunctionalization and neofunctionalization of ABC(D)E genes[78]. Hence, we suggest that the increased number of whorls regulated by B-class gene in passion fruit might be a result of adaption to its floral development.

    In addition to the classic ABC(D)E model, two other types of homologues, B sister and AGL6-like genes, also exhibit tissue-specific characteristics in passion fruit flowers. The phylogenetic relationship indicates that AGL6-like genes are sister to SEP-like gene(E-class)[79,80]. Correlational research suggests that AGL6-like in rice could regulate the development of four whorls of floral organs, which is similar to the function of E-class genes[81]. The expression of AGL6 homologous gene has been detected in the first and second whorl of flowers in Hyacinthus orientalis[82]and Petunia hybrida[83]. AGL-6 like genes may be associated with inner perianth formation in angiosperms[84]. In passion fruit, E-class gene are detected in all flower whorls except for sepals. While the expression level of AGL6-like genes is extremely high in sepal. We propose that AGL6 homologues partly assume the function of E-class genes in the evolution of passion fruit and assist A-class genes in sepal identification. Similarly, B sister genes are primarily transcribed in the female reproductive organs of plants[85], and their aberrant expression leads to ovule development failure in wheat[86]. The same expression pattern is observed in passion fruit, where B sister genes are specifically expressed in ovule tissues, suggesting their role in ovule development. In addition to the above results, three members of MIKC* gene family exhibit prominent expression in stamens, aligning with previous speculations regarding the conserved function of MIKC* gene in male gametophytes of angiosperms[87]. Therefore, we propose the MIKC* genes may serve a similar function in male gametophytes of passion fruit.

    Corona filaments are a distinctive structure in passion fruit and a significant attraction of its floral organs. However, the exact regulatory pathway underlying corona filament formation remains unknown. In this study, we found that corona filaments are mainly controlled by B-, C/D- and E- class genes, with C/D-class exhibiting the highest expression levels among all genes. Previous researches has also detected the expression of B- and C/D-class genes in coronas and the speculated that the tissue's origin is from stamens based on the species of regulated genes and its developmental characteristics[88]. Nevertheless, stronger evidence is still needed to elucidate the origin of the corona tissue.

    Arabidopsis has reported a total of 108 MADS-box genes[18], whereas passion fruit has only identified 52 MADS-box members. However, there is no significant difference in the number of Type II genes between two species (46 in Arabidopsis, 43 in passion fruit). Thus, the disparity mainly lies in the number of Type I genes (59 in Arabidopsis, nine in passion fruit), and duplication events of Type I genes are frequent in Arabidopsis[20]. These duplication events of Type I genes may explain the imbalanced distribution of MADS-box gene members between Arabidopsis and passion fruit.

    Based on the phylogenetic relationship, the 37 MIKCc genes were unevenly classified into 12 gene clades (Fig. 2). Interestingly, compared to their homologous members in Arabidopsis within the same clade, there is an expansion of corresponding members in passion fruit, particularly in the AG-like, AGL6-like, AP3/PI-like and SVP-like clades. This expansion is especially prominent in the AG-like (C-class homologous of ABCE model) and AP3/PI-like (B-class homologous of ABCE model homologous) clades. In our study, most genes in the AP3/PI-like clade and all genes in the AG-like clade were generated through segmental duplications, and nearly all members showed high expression levels in various tissues. This broader regulation scope of the B- and C-class genes, compared to the classic ABC(D)E model, may explain the increase in these two clades. Moreover, there is a decrease in the number of gene members in certain clades, including SOC1-like, AP1-like and FLC-like. SOC1-like genes mediate the control of flowering through vernalization, photoperiod and gibberellin-dependent pathways[89]. The FLC gene serves as a central factor in Arabidopsis vernalization[64,90]. The loss of genes from these two clades in passion fruit could potentially affect the flowering machinery of the plant.

    Beside the function in flower development, MADS-box genes also play a crucial role in multiple physiological processes of plants, including abiotic stress response and development of non-floral organs[91]. AGL4 encodes a MADS and are involved in weakening cell walls during dehiscence, abscission, and cellular expansion[92]. In passion fruit, its homologue (PeMADS32/33) exhibits expression in various tissues, with a significant up-regulation observed under cold stress conditions. Based on these findings, we propose that these two genes could play a role in cell wall remodeling during cold stress. Besides, hormone-responsive elements were detected in the putative promoter regions of many PeMADSs including PeMADS2/19/34, and expression analysis using qRT-PCR also revealed that these genes were widely involved in phytohormone responses. The diverse cis-regulatory elements in the promoter regions may contribute to the functioning of PeMADS genes in different processes. Our results shown that the expression profile of AP1 homologue (PeMADS40) exhibits exceptionally high expression in tendrils, which is consistent with previous studies[93]. It provides some evidence supporting the origin of tendrils. In banana and tomato, members of the AG-like and SEP-like subfamily are considered key regulators of fruit development and ripening processes[40,94,95]. Similarly, among the PeMADS genes that highly expressed in fruit of passion fruit, a significant portion belong to the AG-like and SEP-like subfamilies.

    Passion fruit is an economic valuable tropical fruit crop characterized with nutritious juice, aromatic smell and bright flowers with distinct coronal filaments. Here, we present a comprehensive analysis of MADS-box genes in passion fruit, covering gene identification, phylogenetic relationships, gene structure, motif composition, chromosomal mapping, gene duplication and synteny, cis-element predictions, and tissue-specific expression profiles. A total of 52 PeMADS genes were identified and classified into two types with five subgroups (type I: Mα, Mβ, Mγ; type II: MIKCC, MIKC*) based on phylogenetic analysis. The relatively limited abundance of this gene family in passion fruit can be attributed to the reduction in type I genes, while certain subfamilies undergo amplification of PeMADSs predominantly through segmental duplications. Structural analysis including exon-intron organization, motif composition and homologous protein modeling reveals the relatively conserved features of PeMADSs within the same subfamily. Furthermore, we systematically discussed MADS-box genes involved in the ABC(D)E model of flower organ identity. Our findings indicate that the regulation of petals and stamens in passion fruit is similar to that of Arabidopsis but diverges concerning carpels and sepals. Notably, the distinctive floral organ in passion fruit, the corona, is primarily controlled by B-, C(D)-, and E-class genes, supporting the speculation of its stamen origin. In addition to the classic ABC(D)E model, B sister and AGL6-like genes exhibit tissue-specific characteristics in passion fruit flowers. AGL6 homologues might be involved in sepal identification, while B sister genes are specifically expressed in ovule tissues, suggesting their role in ovule development. Besides, many of PeMADSs tend to express in both reproductive and vegetative organs, and some members are also induced under temperature stresses. These results give an insight into the relationship between the structure and function of MADS-box genes in passion fruit. Ultimately, this study lays a foundation for further investigations into the functions of MADS-box genes in passion fruit tissue development, particularly in flower organ identity.

    The authors confirm contribution to the paper as follows: study conception and design: Qin Y, Zheng P; data collection: Lu L, Chen S, Shen M; analysis and interpretation of results: Cai X, Liu R, Wang X; draft manuscript preparation: An C, Liao J. All authors reviewed the results and approved the final version of the manuscript.

    The data presented in this study are available in the article, Supplementary materials and online repositories. The passion fruit genome data and transcriptome data used in this work were deposited in the National Genome Data Center (NGDC) (https://ngdc.cncb.ac.cn) database under accession number GWHAZTM00000000 and CNP0002747, respectively.

    This work was supported by Science and Technology Innovation Project of Pingtan Science and Technology Research Institute (PT2021007, PT2021003), General Project of Guangxi Natural Science Foundation (2022GXNSFAA035535), Guangxi Academy of Agricultural Sciences basic Research Project (Gui Nong Ke 2021YT046). We thank Zhenjiang Zheng from Fujian Lianmi Ecological Agriculture Development Co., LTD for his assistance during sample collection.

  • The authors declare that they have no conflict of interest.

  • Supplementary Table S1 DELLA proteins from different plant species.
    Supplementary Table S2 Primers for real-time PCR.
    Supplementary Table S3 Basic information of the kiwifruit DELLA gene family.
  • [1]

    Lin M, Gao Z, Wang X, Huo H, Mao J, et al. 2024. Eco-friendly managements and molecular mechanisms for improving postharvest quality and extending shelf life of kiwifruit: A review. International Journal of Biological Macromolecules 257:128450

    doi: 10.1016/j.ijbiomac.2023.128450

    CrossRef   Google Scholar

    [2]

    Atkinson RG, Gunaseelan K, Wang MY, Luo L, Wang T, et al. 2011. Dissecting the role of climacteric ethylene in kiwifruit (Actinidia chinensis) ripening using a 1-aminocyclopropane-1-carboxylic acid oxidase knockdown line. Journal of Experimental Botany 62(11):3821−35

    doi: 10.1093/jxb/err063

    CrossRef   Google Scholar

    [3]

    Wang H, Wang J, Mujumdar AS, Jin X, Liu Z, et al. 2021. Effects of postharvest ripening on physicochemical properties, microstructure, cell wall polysaccharides contents (pectin, hemicellulose, cellulose) and nanostructure of kiwifruit (Actinidia deliciosa). Food Hydrocolloids 118:106808

    doi: 10.1016/j.foodhyd.2021.106808

    CrossRef   Google Scholar

    [4]

    Depuydt S, Hardtke CS. 2011. Hormone signalling crosstalk in plant growth regulation. Current Biology 21(9):R365−R373

    doi: 10.1016/j.cub.2011.03.013

    CrossRef   Google Scholar

    [5]

    Chai Z, Fang J, Yao W, Zhao Y, Cheng G, et al. 2022. ScGAIL, a sugarcane N-terminal truncated DELLA-like protein, participates in gibberellin signaling in Arabidopsis. Journal of Experimental Botany 73(11):3462−76

    doi: 10.1093/jxb/erac056

    CrossRef   Google Scholar

    [6]

    Zhou M, Li Y, Cheng Z, Zheng X, Cai C, et al. 2023. Important factors controlling gibberellin homeostasis in plant height regulation. Journal of Agricultural and Food Chemistry 71:15895−907

    doi: 10.1021/acs.jafc.3c03560

    CrossRef   Google Scholar

    [7]

    Xie Y, Chen L. 2020. Epigenetic regulation of gibberellin metabolism and signaling. Plant & Cell Physiology 61(11):1912−18

    doi: 10.1093/pcp/pcaa101

    CrossRef   Google Scholar

    [8]

    Liu CS, Xiao PS, Jiang F, Wang SY, Liu Z, et al. 2022. Exogenous gibberellin treatment improves fruit quality in self-pollinated apple. Plant Physiology and Biochemistry 174:11−21

    doi: 10.1016/j.plaphy.2022.01.029

    CrossRef   Google Scholar

    [9]

    Li S, Qiu C, Yang M, Shi L, Cao S, et al. 2023. Effect of gibberellic acid on cell wall degradation and softening in postharvest okras. LWT 186:115223

    doi: 10.1016/j.lwt.2023.115223

    CrossRef   Google Scholar

    [10]

    Maurer D, Feygenberg O, Tzoor A, Atzmon G, Glidai S, et al. 2019. Postharvest dips of persimmon fruit in gibberellic acid: an efficient treatment to improve storability and reduce alternaria black spot. Horticulturae 5:23

    doi: 10.3390/horticulturae5010023

    CrossRef   Google Scholar

    [11]

    Valero D, Martínez-romero D, Serrano M, Riquelme F. 1998. Postharvest gibberellin and heat treatment effects on polyamines, abscisic acid and firmness in lemons. Journal of Food Science 63(4):611−15

    doi: 10.1111/j.1365-2621.1998.tb15796.x

    CrossRef   Google Scholar

    [12]

    Porat R, Feng X, Huberman M, Galili D, Goren R, et al. 2001. Gibberellic acid slows postharvest degreening of 'Oroblanco' Citrus fruits. HortScience 36(5):937−40

    doi: 10.21273/HORTSCI.36.5.937

    CrossRef   Google Scholar

    [13]

    Li J, Cui M, Li M, Wang X, Liang D, et al. 2015. Expression pattern and promoter analysis of the gene encoding GDP-D-mannose 3′,5′-epimerase under abiotic stresses and applications of hormones by kiwifruit. Scientia Horticulturae 150:187−94

    doi: 10.1016/j.scienta.2012.11.008

    CrossRef   Google Scholar

    [14]

    Yang H, Li J, Li X, Wu R, Zhang X, et al. 2023. The mechanism of gibberellins treatment suppressing kiwifruit postharvest ripening processes by transcriptome analysis. Postharvest Biology and Technology 198:112223

    doi: 10.1016/j.postharvbio.2022.112223

    CrossRef   Google Scholar

    [15]

    Zhang C, Jian M, Li W, Yao X, Tan C, et al. 2023. Gibberellin signaling modulates flowering via the DELLA-BRAHMA-NF-YC module in Arabidopsis. The Plant Cell 35(9):3470−84

    doi: 10.1093/plcell/koad166

    CrossRef   Google Scholar

    [16]

    Silverstone AL, Ciampaglio CN, Sun T. 1998. The Arabidopsis RGA gene encodes a transcriptional regulator repressing the gibberellin signal transduction pathway. The Plant Cell 10:155−69

    doi: 10.1105/tpc.10.2.155

    CrossRef   Google Scholar

    [17]

    Blanco-Touriñán N, Serrano-Mislata A, Alabadí D. 2020. Regulation of DELLA proteins by post-translational modifications. Plant & Cell Physiology 61(11):1891−01

    doi: 10.1093/pcp/pcaa113

    CrossRef   Google Scholar

    [18]

    Wild M, Davière JM, Cheminant S, Regnault T, Baumberger N, et al. 2012. The Arabidopsis DELLA RGA-LIKE3 is a direct target of MYC2 and modulates jasmonate signaling responses. The Plant Cell 24:3307−19

    doi: 10.1105/tpc.112.101428

    CrossRef   Google Scholar

    [19]

    Wang P, Zhang Q, Chen Y, Zhao Y, Ren F, et al. 2020. Comprehensive identification and analysis of DELLA genes throughout the plant kingdom. BMC Plant Biology 20:372

    doi: 10.1186/s12870-020-02574-2

    CrossRef   Google Scholar

    [20]

    Fu X, Harberd NP. 2003. Auxin promotes Arabidopsis root growth by modulating gibberellin response. Nature 421:740−43

    doi: 10.1038/nature01387

    CrossRef   Google Scholar

    [21]

    Chen J, Zhang M, Tan B, Jiang Y, Zheng X, et al. 2019. A single nucleotide mutation in GID1c disrupts its interaction with DELLA1 and causes a GA-insensitive dwarf phenotype in peach. Plant Biotechnology Journal 17:1723−35

    doi: 10.1111/pbi.13094

    CrossRef   Google Scholar

    [22]

    Feng S, Martinez C, Gusmaroli G, Wang Y, Zhou J, et al. 2008. Coordinated regulation of Arabidopsis thaliana development by light and gibberellins. Nature 51:475−79

    doi: 10.1038/nature06448

    CrossRef   Google Scholar

    [23]

    Xue H, Gao X, He P, Xiao G. 2022. Origin, evolution, and molecular function of DELLA proteins in plants. The Crop Journal 10:287−99

    doi: 10.1016/j.cj.2021.06.005

    CrossRef   Google Scholar

    [24]

    Davière JM, Achard P. 2016. A pivotal role of DELLAs in regulating multiple hormone signals. Molecular plant 9(1):10−20

    doi: 10.1016/j.molp.2015.09.011

    CrossRef   Google Scholar

    [25]

    Xie Y, Tan H, Ma Z, Huang J. 2016. DELLA Proteins Promote Anthocyanin Biosynthesis via Sequestering MYBL2 and JAZ Suppressors of the MYB/bHLH/WD40 Complex in Arabidopsis thaliana. Molecular Plant 9:711−21

    doi: 10.1016/j.molp.2016.01.014

    CrossRef   Google Scholar

    [26]

    Wang S, Luo C, Sun L, Ning K, Chen Z, et al. 2022. LsRGL1 controls the bolting and flowering times of lettuce by modulating the gibberellin pathway. Plant Science 316:111175

    doi: 10.1016/j.plantsci.2021.111175

    CrossRef   Google Scholar

    [27]

    Hu J, Israeli A, Ori N, Sun T. 2018. The interaction between DELLA and ARF/IAA mediates crosstalk between gibberellin and auxin signaling to control fruit initiation in tomato. The Plant Cell 30:1710−28

    doi: 10.1105/tpc.18.00363

    CrossRef   Google Scholar

    [28]

    Martí C, Orzáez D, Ellul P, Moreno V, Carbonell J, et al. 2007. Silencing of DELLA induces facultative parthenocarpy in tomato fruits. The Plant Journal 52:865−76

    doi: 10.1111/j.1365-313X.2007.03282.x

    CrossRef   Google Scholar

    [29]

    Achard P, Vriezen WH, Van Der Straeten D, Harberd NP. 2003. Ethylene regulates arabidopsis development via the modulation of DELLA protein growth repressor function. The Plant Cell 15(12):2816−25

    doi: 10.1105/tpc.015685

    CrossRef   Google Scholar

    [30]

    An F, Zhang X, Zhu Z, Ji Y, He W, et al. 2012. Coordinated regulation of apical hook development by gibberellins and ethylene in etiolated Arabidopsis seedlings. Cell Research 22(5):915−27

    doi: 10.1038/cr.2012.29

    CrossRef   Google Scholar

    [31]

    Zhang AD, Wang WQ, Tong Y, Li MJ, Grierson D, et al. 2018. Transcriptome analysis identifies a zinc finger protein regulating starch degradation in kiwifruit. Plant Physiology 178:850−63

    doi: 10.1104/pp.18.00427

    CrossRef   Google Scholar

    [32]

    Xiong S, Sun X, Tian M, Xu D, Jiang A. 2023. 1-Methylcyclopropene treatment delays the softening of Actinidia arguta fruit by reducing cell wall degradation and modulating carbohydrate metabolism. Food Chemistry 411:135485

    doi: 10.1016/j.foodchem.2023.135485

    CrossRef   Google Scholar

    [33]

    Chen S, Wang X, Zhang L, Lin S, Liu D, et al. 2016. Identification and characterization of tomato gibberellin 2-oxidases (GA2oxs) and effects of fruit specific SlGA2ox1 overexpression on fruit and seed growth and development. Horticulture Research 3:16059

    doi: 10.1038/hortres.2016.59

    CrossRef   Google Scholar

    [34]

    Fukazawa J, Ohashi Y, Takahashi R, Nakai K, Takahashi Y. 2021. DELLA degradation by gibberellin promotes flowering via GAF1-TPR-dependent repression of floral repressors in Arabidopsis. The Plant Cell 33(7):2258−72

    doi: 10.1093/plcell/koab102

    CrossRef   Google Scholar

    [35]

    Kuhn N, Maldonado J, Ponce C, Arellano M, Time A, et al. 2021. RNAseq reveals different transcriptomic responses to GA3 in early and midseason varieties before ripening initiation in sweet cherry fruits. Scientific Reports 11:13075

    doi: 10.1038/s41598-021-92080-8

    CrossRef   Google Scholar

    [36]

    Erogul D, Sen F. 2016. The effect of preharvest gibberellic acid applications on fruit quality of ' Angelino' plums during storage. Scientia Horticulturae 202:111−16

    doi: 10.1016/j.scienta.2016.02.027

    CrossRef   Google Scholar

    [37]

    Dagar A, Weksler A, Friedman H, Lurie S. 2012. Gibberellic acid (GA3) application at the end of pit ripening: Effect on ripening and storage of two harvests of 'September Snow' peach. Scientia Horticulturae 140:125−30

    doi: 10.1016/j.scienta.2012.03.013

    CrossRef   Google Scholar

    [38]

    García-Rojas M, Meneses M, Oviedo K, Carrasco C, Defilippi B, et al. 2018. Exogenous gibberellic acid application induces the overexpression of key genes for pedicel lignification and an increase in berry drop in table grape. Plant Physiology and Biochemistry 26:32−38

    doi: 10.1016/j.plaphy.2018.02.009

    CrossRef   Google Scholar

    [39]

    Al-Qurashi AD, Awad MA. 2019. Postharvest gibberellic acid, 6-benzylaminopurine and calcium chloride dipping affect quality, antioxidant compounds, radical scavenging capacity and enzymes activities of ' Grand Nain' bananas during shelf life. Scientia Horticulturae 253:187−94

    doi: 10.1016/j.scienta.2019.04.044

    CrossRef   Google Scholar

    [40]

    Wu M, Liu K, Li H, Li Y, Zhu Y, et al. 2024. Gibberellins involved in fruit ripening and softening by mediating multiple hormonal signals in tomato. Horticulture Research 11:uhad27

    doi: 10.1093/hr/uhad275

    CrossRef   Google Scholar

    [41]

    Li XJ, Cai ZH, Liu XL, Wu YS, Han Z, et al. 2024. Effects of gibberellic acid on soluble sugar content, organic acid composition, endogenous hormone levels, and carbon sink strength in Shine Muscat grapes during berry development stage. Horticulturae 10(4):346

    doi: 10.3390/horticulturae10040346

    CrossRef   Google Scholar

    [42]

    Ariizumi T, Lawrence PK, Steber CM. 2011. The role of two F-box proteins, SLEEPY1 and SNEEZY, in Arabidopsis gibberellin signaling. Plant physiology 155(2):765−75

    doi: 10.1104/pp.110.166272

    CrossRef   Google Scholar

    [43]

    Li S, Zhao Y, Zhao Z, Wu X, Sun L, et al. 2016. Crystal structure of the GRAS domain of SCARECROW-LIKE7 in Oryza sativa. The Plant Cell 28(5):1025−34

    doi: 10.1105/tpc.16.00018

    CrossRef   Google Scholar

    [44]

    Cenci A, Rouard M. 2017. Evolutionary analyses of GRAS transcription factors in angiosperms. Frontiers in Plant Science 8:273

    doi: 10.3389/fpls.2017.00273

    CrossRef   Google Scholar

    [45]

    Jin Y, Liu H, Luo D, Yu N, Dong W, et al. 2016. DELLA proteins are common components of symbiotic rhizobial and mycorrhizal signalling pathways. Nature communications 7:12433

    doi: 10.1038/ncomms12433

    CrossRef   Google Scholar

    [46]

    Serrano-Mislata A, Bencivenga S, Bush M, Schiessl K, Boden S, et al. 2017. DELLA genes restrict inflorescence meristem function independently of plant height. Nature plants 3(9):749−54

    doi: 10.1038/s41477-017-0003-y

    CrossRef   Google Scholar

    [47]

    Harberd NP, Belfield E, Yasumura Y. 2009. The angiosperm gibberellin-GID1-DELLA growth regulatory mechanism: how an "inhibitor of an inhibitor" enables flexible response to fluctuating environments. The Plant Cell 21:1328−39

    doi: 10.1105/tpc.109.066969

    CrossRef   Google Scholar

    [48]

    Shohat H, Illouz-Eliaz N, Kanno Y, Seo M, Weiss D. 2020. The tomato DELLA protein PROCERA promotes abscisic acid responses in guard cells by upregulating an abscisic acid transporter. Plant Physiology 184:518−28

    doi: 10.1101/2020.04.22.056010

    CrossRef   Google Scholar

    [49]

    Dolgikh AV, Kirienko AN, Tikhonovich IA, Foo E, Dolgikh EA. 2019. The DELLA proteins influence the expression of cytokinin biosynthesis and response genes during nodulation. Frontiers in Plant Science 10:432

    doi: 10.3389/fpls.2019.00432

    CrossRef   Google Scholar

  • Cite this article

    Zhang X, Zhao K, Wang W, Alabd A, Li J, et al. 2025. Gibberellin delays kiwifruit postharvest ripening via the AcDELLA gene family. Plant Hormones 1: e005 doi: 10.48130/ph-0025-0005
    Zhang X, Zhao K, Wang W, Alabd A, Li J, et al. 2025. Gibberellin delays kiwifruit postharvest ripening via the AcDELLA gene family. Plant Hormones 1: e005 doi: 10.48130/ph-0025-0005

Figures(7)

Article Metrics

Article views(549) PDF downloads(132)

ARTICLE   Open Access    

Gibberellin delays kiwifruit postharvest ripening via the AcDELLA gene family

Plant Hormones  1 Article number: e005  (2025)  |  Cite this article

Abstract: Gibberellin (GA) has a significant regulatory role in the growth and development of higher plants. DELLA proteins are the key negative regulators of the gibberellin signalling pathway. However, the genomic overview of the kiwifruit DELLA gene family and their function on kiwifruit ripening has not yet been studied. Exogenous GA3 can effectively maintain postharvest kiwifruit firmness and delay the ripening process. Eight AcDELLAs genes were identified from the kiwifruit genome and named as AcDELLA1 to AcDELLA8 by the order of chromosomal localization. Sequence analysis confirmed that the N terminus of all eight AcDELLA proteins contained high-conservation DELLA and TVHYNP motifs. Phylogenetic analysis showed that AcDELLA1, and AcDELLA3 were highly homologous with AcDELLA5 and AcDELLA6. The gene expression of AcDELLA3/4/5/6 were significantly induced by GA3 treatment, while, GA3 delayed the expression of AcDELLA7, and AcDELLA8 maintained higher level in GA3 group than in control. Correlation analysis between physiological parameters and AcDELLAs gene expression demonstrated that AcDELLA3/4/5/7/8 had a marked correlation with firmness, TSS, and ethylene production. All these results showed that GA3 treatment could inhibit kiwifruit postharvest ripening and prolong storage time, and these GA-responsive DELLAs may play important roles in this process.

    • Kiwifruit is an economically valuable crop with global significance due to its exceptionally high and balanced nutritional composition, including vitamins, chlorophyll, polyphenols, amino acids, carotenoids, anthocyanins, flavonoids, dietary fibre, calcium, iron, potassium, and other beneficial metabolites[1]. However, kiwifruit is a representative climacteric fruit. During the initial storage period, the main life characteristics are the consumption of dry matter and the hydrolysis of starch, but the appearance and quality of fruit, especially the firmness change a little. In the late stage, the peak of respiration and ethylene production appear almost simultaneously, cell walls expand and dissolve, and the fruit firmness decreases rapidly, losing storability[2,3]. The maturity rate largely depends on storage conditions and post-harvest processing. So improving the quality of post-harvest fruits is considered one of the most indispensable links in the kiwifruit production procedures.

      Phytohormones play fundamental roles in plant growth and development, which coordinates these processes with internal and external stimuli[4,5]. The gibberellin (GA) is essential for a number of important developmental processes ranging from seed sprouting to the inducement of flowering[6,7]. Exogenous GA has been studied in plants since the 1970s. Preharvest application of exogenous GA increased the thickness of the wax layer and reduced the rate of fruit water loss, leading to a significant increase in fruit storage capacity[8]. Post-harvest GA treatment effectively retained the firmness of okra fruits and delayed fruit hardening during storage of okra[9]. Post-harvest storage of persimmon fruit impregnated with GA3 induces physiological changes that delay persimmon fruit softening and reduce ABS development thereby enhancing storability[10]. Vacuum-impregnating post-harvest lemon fruit with GA delays senescence and colour change[11]. The application of GA, either as a pre-harvest spray or as a post-harvest dipping treatment, effectively preserved the colour of the 'Oroblanco' green fruit[12]. GA reduced ascorbic acid content in kiwifruit leaves, and delayed post-harvest ripening of kiwifruit[13,14]. DELLA proteins act as an extremely important negative regulatory role in GA signalling transduction[15,16]. It is classified as the plant-specific GRAS family and is named after its N-terminal DELLA structural domain[17]. The DELLA family has been discovered in many plants, such as Arabidopsis, maize, rice, wheat, corn, and tomato[1820]. DELLA proteins are located in the nucleus and function as transcriptional repressors[21]. It is universally recognized that GA signalling occurs when the GA receptor GID1 first senses and binds GA, and then binds to DELLA proteins to form GA-GID1-DELLA polymers[22]. However, the DELLA protein lacks a DNA-binding domain and is unable to bind directly to DNA. Therefore, DELLA often interacts with regulatory proteins in different signalling pathways to regulate plant growth and development[23].

      DELLA proteins serve as a vital function in various aspects of plant growth and development, they play a key integrative role in the phytohormone signal response network[24]. In Arabidopsis, DELLA proteins chelated MYBL2 and JAZ inhibitors to promote anthocyanin biosynthesis[25]. In lettuce, knockdown of LsRGL1 promoted tillering, while tillering was inhibited as well as GA and growth hormone biosynthesis in the overexpression lines[26]. In tomato, the DELLA protein SlDELLA interacted with the growth hormone signalling component SlARF7/SlIAA9 to induce fruit germination[27], and silencing of DELLA resulted in solitary fruits which produced a smaller and distinctive elongated shape[28]. As for ethylene, it can regulate Arabidopsis development in part through alteration of the properties of DELLA protein[29]. DELLA protein can recognise and bind to the ethylene signaling transduction component EIN3/EIL1, affecting the formation of apical curved hooks in Arabidopsis[30]. However, few researchers have focused on the function of DELLA on ripening regulation, and the potential interaction between DELLA and ethylene deserves more attention.

      In this study, eight DELLAs were classified from kiwifruit, and the relationship between DELLAs expression and kiwifruit postharvest ripening was investigated. The DELLA domain was used to identify members of the DELLA gene family in the Actinidia chinensis cultivar Red5 genome. The physicochemical properties, chromosomal localization, gene structure, protein structural domains, distribution of conserved motifs, and phylogenetic tree were carried out to explore the characteristics of AcDELLA proteins. Real-time PCR presented that five of eight AcDELLA expression were induced by GA3 treatment, and four of them showed significantly high negative correlations with ethylene production. The above study enriches our understanding of DELLAs function in kiwifruit postharvest ripening and lays the foundation for subsequent functional study of AcDELLA genes.

    • In September 2022, 'Cuixiang' (Actinidia chinensis) mature kiwifruit was harvested from a commercial orchard in Yantai, Shandong province, China. The initial total soluble solid (TSS) of its fruit was 5.5%. Four hundred evenly sized healthy fruits without apparent imperfections were randomly distributed into two groups. One group was the control group (evenly sprayed with distilled water three times every 8 h at 24 °C) and another one was gibberellin-treated group (evenly sprayed with 0.3 g/L GA3 solution three times every 8 h at 24 °C). After the treatment, the fruits were kept at room temperature (24 °C). Each sampling point had nine fruits, one replicate for every three fruits. The pulp of kiwifruit samples were collected excluding the skin, seeded portion, and centre column. They were chopped into tiny pieces, which were snap-frozen in liquid nitrogen, and then preserved at −80 °C for further experiments. Leaf, stem, and flower tissue parts of 'Cuixiang' (Actinidia chinensis) kiwifruit were collected separately from the same commercial orchard, in May 2022.

    • Firmness was assessed with an AMETEK Brookfield CT3 10K texture analyzer (Middleboro, USA) equipped with a 6.0 mm diameter probe suppression distance and speed of 4.0 and 2.0 mm/s, respectively. The firmness of kiwifruit was measured at two opposite positions at the fruit equator and the maximum force was recorded to represent the fruit firmness, expressed as the peak force (N). Digital handheld refractometers were used to measure total suspended solids and total acids.

    • A bead mill (Qiagen TissuLyzer II) was used to grind 0.03 g of the frozen pulp sample into a fine powder, and starch was determined using the Solarbio Starch Content Assay Kit instructions with three biological replicates.

    • The amount of ethylene released from kiwifruit was measured according to previous studies[14]. In brief, nine fruits were classified into three replicates, and the fruits were placed in a 1 L sealed container for 1 h before a basin of water and a 5 mL syringe were prepared for ethylene collection. The Shimadzu GC-2014 gas chromatography (GC) system was used to inject 1,000 microliters of gas into the gas chromatograph. Ethylene yield was normalized by fruit weight, with ethylene standard gas used as a control. Three individual biological replicates were performed at each sampling point.

    • Cell wall components were derived and segregated as discussed in a previous method[31]. Three g kiwifruit flesh was frozen in 20 mL 80% ethanol solution (v/v), vortexed well, heated in a boiling water bath for 20 min, cooled, centrifuged at 3,900 rpm for 10 min at room temperature, and the supernatant was discarded. The precipitates were successively rinsed with 6 mL of 80% ethanol (v/v), trichloromethane/methanol (1:1, v/v), and acetone, then centrifuged to place the white precipitate in a 40 °C oven for 24 h, and cell wall material (CWM) was collected and weighed. Water soluble pectin (WSP), ionic soluble pectin (ISP), and covalently bound pectin (CBP) were obtained respectively.

    • Extraction process: by grinding the kiwifruit flesh and adding a specific extraction reagent (70% ethanol containing 0.1% formic acid), combined with ultrasonic and vortex extraction techniques to achieve effective extraction of gibberellins. Purification process: MAX and C18 (CNWLC-C18200mg) were used as purification materials according to the mass ratio of 1:2 to 1:4 to ensure the purity of the samples. Detection and analysis: ultra performance liquid chromatography-tandem mass spectrometry (UPLC-MS/MS) was used to determine the stability of the gibberellins by calculating the content of the gibberellins to be measured. Gibberellins contents were determined by MetWare (www.metware.cn) based on the AB Sciex QTRAP 6500 LC-MS/MS platform.

    • DELLA genes were identified from Actinidia chinensis Red5 kiwifruit genome database (http://kiwifruitgenome.org/), and the genome sequence (DNA FASTA), protein sequence file (Protein sequence FASTA) and gene structure annotation file (GTF) were downloaded. The putative DELLA-related gene domain was checked, and the candidate genes were further confirmed. All the identified protein sequences of the DELLA family contained GRAS and DELLA domains.

    • The intron, exon, and genomic localization information of the DELLA family genes in kiwifruit were all sourced from the Actinidia chinensis Red5 kiwifruit genome database (https://kiwifruitgenome.org/organism/3). By downloading the kiwifruit gene structure annotation file from the kiwifruit gene database, specific positional information of eight DELLA gene family members on chromosomes was obtained, and chromosome localization maps were drawn by TBtools. TBtools was also used to draw a schematic diagram of gene structure. Prot Param was used to analyze the primary structure and physicochemical properties of DELLA protein (https://web.expasy.org/protparam). PRABI (www.prabi.fr) was carried out to predict the secondary structure of proteins. According to the online software SWISS-MODEL (https://swissmodel.expasy.org/interactive), protein tertiary structure analysis was performed. MEGA-X and GENEDOC were used for protein comparison analysis.

    • DELLA protein sequences were downloaded from some species genomes through keyword search functions on NCBI, and then the protein sequence data was imported into TBtools software to construct a phylogenetic tree and conserved domain analysis was performed on DELLA proteins in species, including Arabidopsis thaliana (AtGAI, AtRGA, AtRGL1, AtRGL2, AtRGL3), Brassica napus (BnRGA1, BnRGA2), Malus domestica (MdRGL1a, MdRGL1b), Triticum aestivum (Rht-D1), Hordeum vulgare (SLN1), Cucumis sativus (CsGAIP-B), Lactuca sativa Linn (LsDELLA1), Triticum aestivum (Rht-D1), Solanum lycopersicum (PROCERA), Gossypium hirsutum (GhGAI), Solanum tuberosum (StGAI), Pyrus × bretschneideri (PbGAI-like), Glycine max (GmGAI), Juglans regia (JrGAI), Vitis vinifera (VvGAI), Prunus avium (PaGAI), Cucumis melo (CmGAI-P), Fragaria vesca (FveRGA1), Sugarcane (ScGAI), Oryza sativa (OsSLR1), Zea mays (Zm-D8), Prunus mume (PmGAIP-B), and Prunus persica (PpGAIP-B) (Supplementary Table S1).

    • The RNA was extracted using an RNA extraction kit (TIANGEN), following the instructions. The extracted RNA was subjected to 1% agarose gel electrophoresis, and the RNA concentration was detected with a micro spectrophotometer. Then, using the RNA as a template, the RNA was reverse transcribed into cDNA using a reverse transcription kit (Vazyme), and the cDNA was stored in a −20 °C freezer for later use.

    • Real-time PCR was conducted using reversed cDNA at fruit different sampling periods and stems, leaves, and flowers as templates, with AcActin (Genbank No. EF063572) as the internal reference gene. The amplification system and program were developed according to Vazyme SYBR following the instructions. Three biological replicates were performed. The primers are shown in Supplementary Table S2, using 2−ΔCᴛ to calculate the relative expression levels of each gene. The results were statistically analyzed by using DPS 7.05 software.

    • One-way ANOVA followed by Student's t-test (** p < 0.05, ** p < 0.01, *** p < 0.001) or LSD (least significant difference) analyses were used. Heatmaps were drawn using TBtools software. Figures for Pearson's correlation tests and correlation analyses were generated using Origin 2022 (Microcal Software Inc., Northampton, MA, USA).

    • In this study, 300 mg/L GA3 was used to treat 'Cuixiang' kiwifruit. All samples were stored at room temperature (24 °C). During storage, the fruit status of the 'Cuixiang' kiwifruit in the gibberellin treated group and the control group are shown in Fig. 1a. Throughout the storage process, the firmness of both GA-treated and control group fruits showed a continuous decreasing trend (Fig. 1b). The firmness of control fruits decreased rapidly during post-harvest storage, while the firmness of GA treated fruits decreased relatively slowly. The initial firmness of kiwifruit is 67.01%. After 7 d, the firmness of the control group decreased to 42.86 N, while the GA treated group kept on 64.05 N. Even after 15 d of treatment with GA, it still maintained firmness with 49.27 N. GA treatment effectively maintained the firmness of kiwifruit in the later storage period. The TSS content of kiwifruit during post-harvest storage showed an increasing trend. In the control group, it increased rapidly during the 7−10 d period and reached a peak on the 15th day. However, in gibberellin treated kiwifruit, TSS increased relatively slowly and reached its peak on the 25th day (Fig. 1c). Throughout the storage process, the titratable acid content of both the control and the gibberellin-treated fruits showed a continuous decreasing trend. The decrease rate in kiwifruit treated with gibberellin is relative slow (Fig. 1d). The ethylene production of the fruit at day 0 is 0.38 μL/g/h. The control group fruits reached a respiratory peak at day 15, with the maximum at 48.44 μL/g/h. While, the GA-treated group reached its peak until day 25, with a lower ethylene production of 36.45 μL/g/h (Fig. 1e). In terms of starch and cell wall material (CWM) content, they both exhibited a similar trend with firmness (Fig. 1f & g). Among cell wall components, the CBP content changes were consistent with the CWM trend, after 15 d of storage, the CBP content decreased to 37% and 54% of the level measured at day 0, respectively (Fig. 1i). In contrast, ISP and WSP contents increased during storage and were lower in GA3-treated fruit than in control fruit (Fig. 1h & j). Moreover, the variation tendency of ISP and WSP contents were also similar.
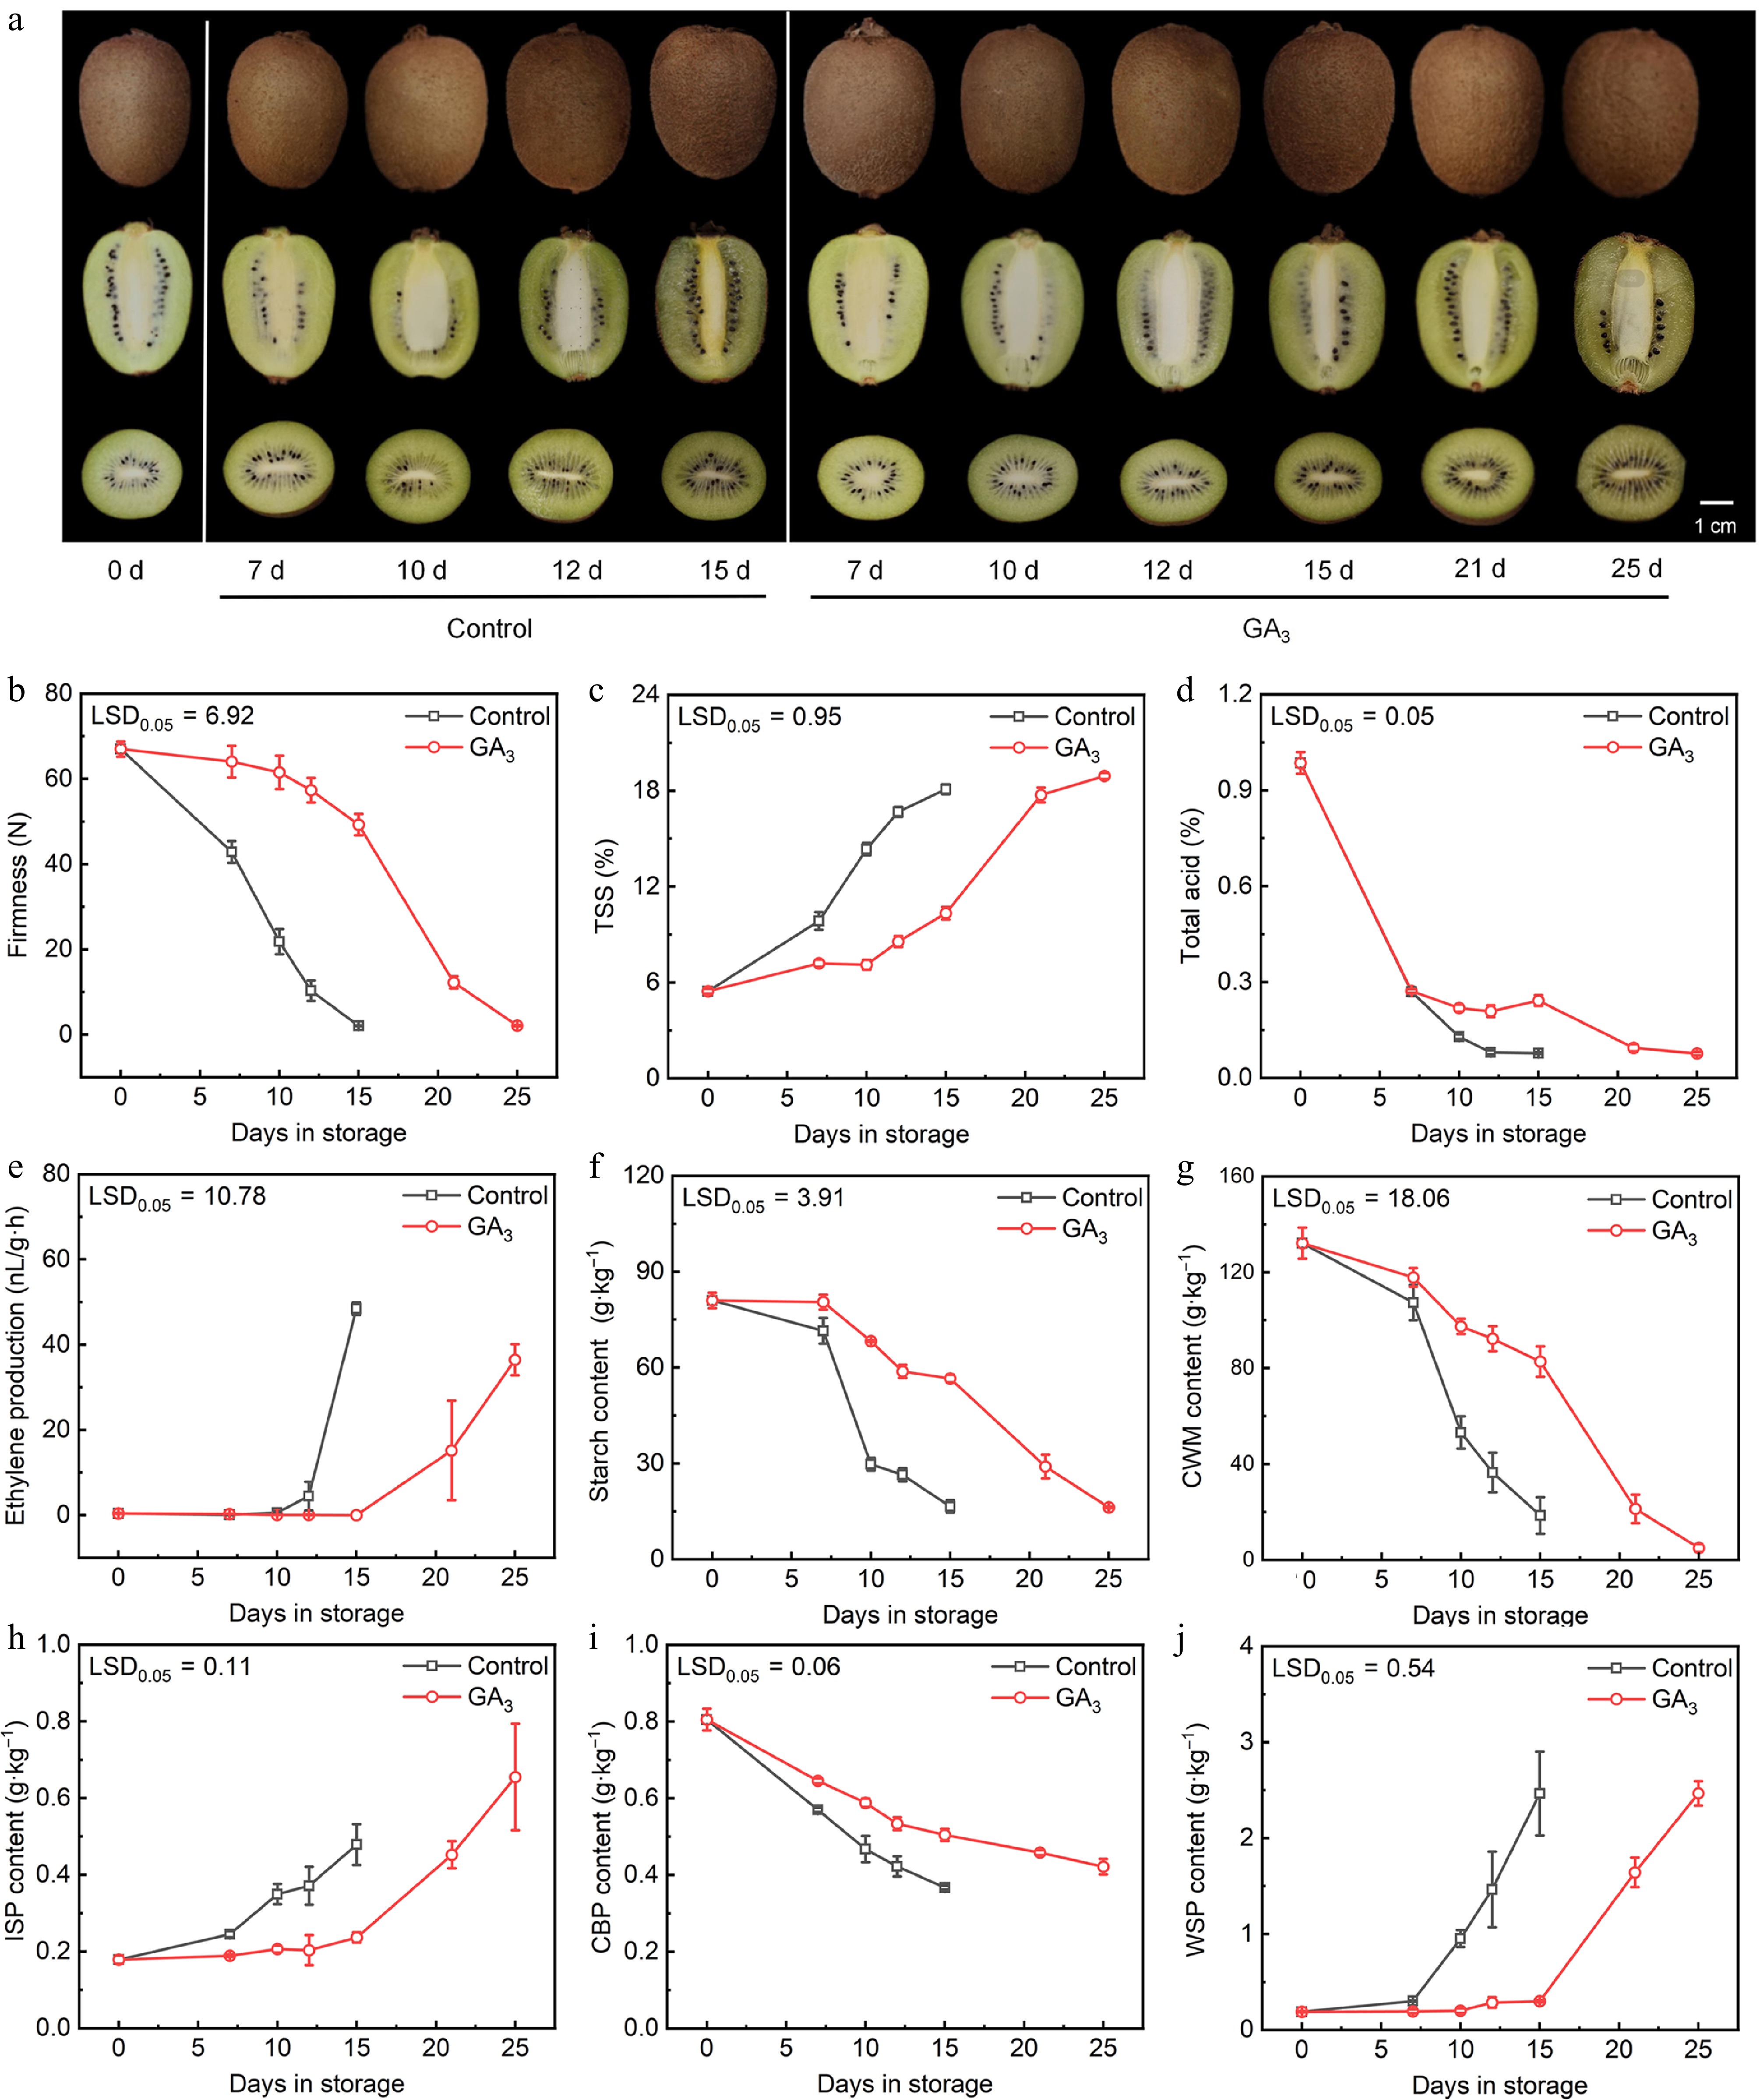
      Figure 1. 

      The alterations in performance and physiological attributes of kiwifruit following treatment with gibberellin has been conducted. (a) Photographs of kiwifruit in different groups. (b) Firmness of kiwifruit in different groups. (c) Total soluble solids (TSS) of kiwifruit in different groups. (d) Total acid of kiwifruit in different groups. (e) Ethylene production of kiwifruit in different groups. (f) Starch content of kiwifruit in different groups. (g) Cell-wall material (CWM) content of kiwifruit in different groups. (h) Ionic soluble pectin (ISP) content of kiwifruit in different groups. (i) Covalent binding pectin (CBP) content of kiwifruit in different groups. (j) Water soluble pectin (WSP) content of kiwifruit in different groups. Error bars: ± SE from nine replicates (for firmness, TSS, and total acid) or three replicates (for ethylene production, starch content, CWM, ISP, CBP, and WSP). LSD: least significant difference at p = 0.05.

    • The endogenesis gibberellin content in kiwifruit at 0, 7, and 12 d after harvest was measured by UPLC-MS/MS. The results suggested that GA1, GA3, GA4, GA5, GA6, GA7, GA8, GA9, GA12, GA15, GA19, GA20, GA24, GA29, GA34, GA44, and GA53 could be detected in kiwifruit samples, and among them, the content of GA3 was the highest (Fig. 2). GA3 content was 178.7 ng/g at day 0, and reduced to 45.3 and 28.9 ng/g in the control group on the 7th day and the 12th day, respectively. By contrast, GA3 content increased to 258.7 and 217.9 ng/g in the GA3 treated group at day 7 and day 12, respectively. In other words, the endogenesis GA3 content in the GA3-treated group was five times more than in the control group on the 7th day and seven times on the 12th day. The content of GA1 showed a similar tendency as GA3. Overall, the results showed that the gibberellins content in the GA3-treated group was significantly higher than that in the control group (Fig. 2).
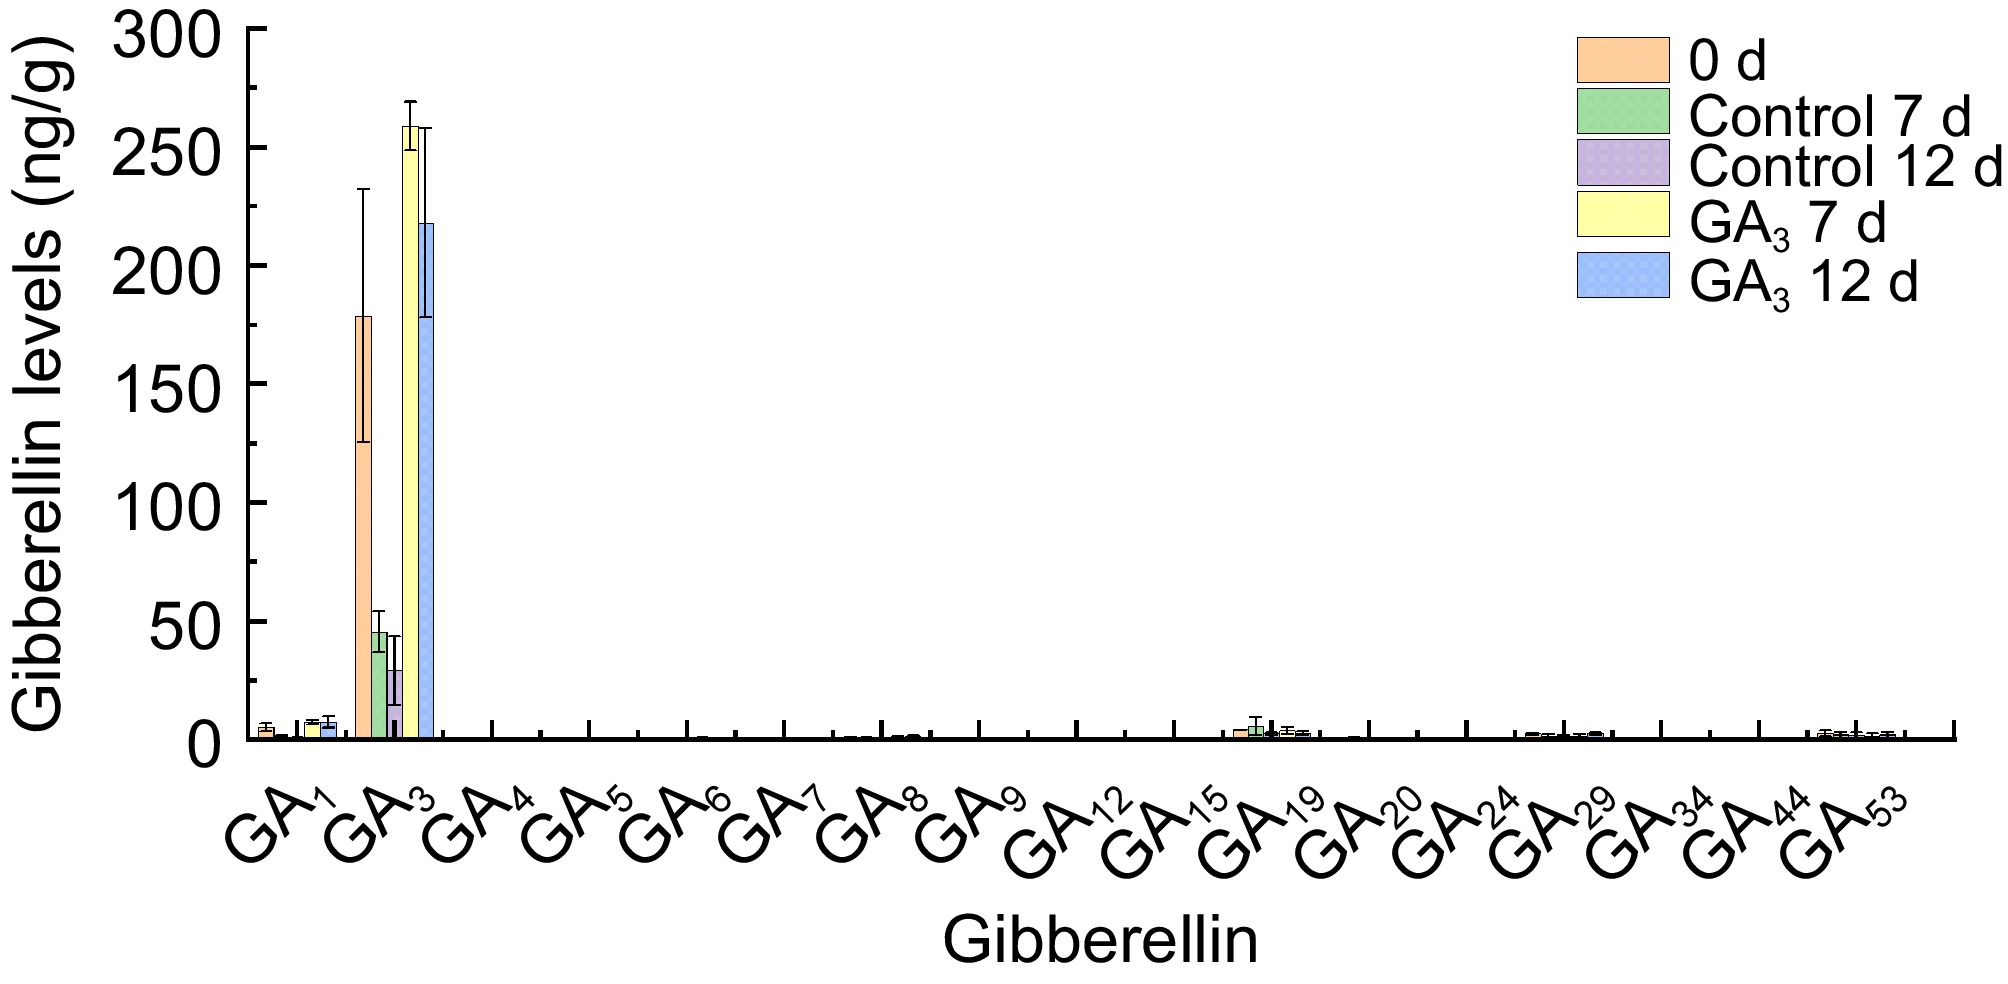
      Figure 2. 

      Determination of endogenous gibberellin contents in different group kiwifruit at 0, 7, and 12 d of post-harvest storage. Error bars: ± SE from three replicates.

    • Eight AcDELLA gene family members were identified from the kiwifruit genome database, which were named AcDELLA1 to AcDELLA8 by the order of chromosome localization (Fig. 3a). The AcDELLA genes were located on six chromosomes, with AcDELLA1 and AcDELLA2 on LG1, AcDELLA3 and AcDELLA4 on LG9, AcDELLA5 on LG12, AcDELLA6 on LG20, AcDELLA7 on LG25, and AcDELLA8 on LG27 (Fig. 3a). The gene structure map of the DELLA gene family in kiwifruit showed that all the eight AcDELLA genes contained only one exon, no intron, and no significant difference in CDS sequence location (Fig. 3b). The analyses of amino acid length, molecular weight, and isoelectric point of eight AcDELLA proteins were exhibited in Supplementary Table S3. The longest sequence in the coding region was AcDELLA2 (1,746 bp) and the shortest was AcDELLA6 (1,560 bp). The amino acid number of AcDELLA proteins ranged from 519 to 581 aa. Besides, the molecular weights ranged from 57,203.13 to 62,891.92 Da, and the theoretical isoelectric points ranged from 4.95 to 5.40.
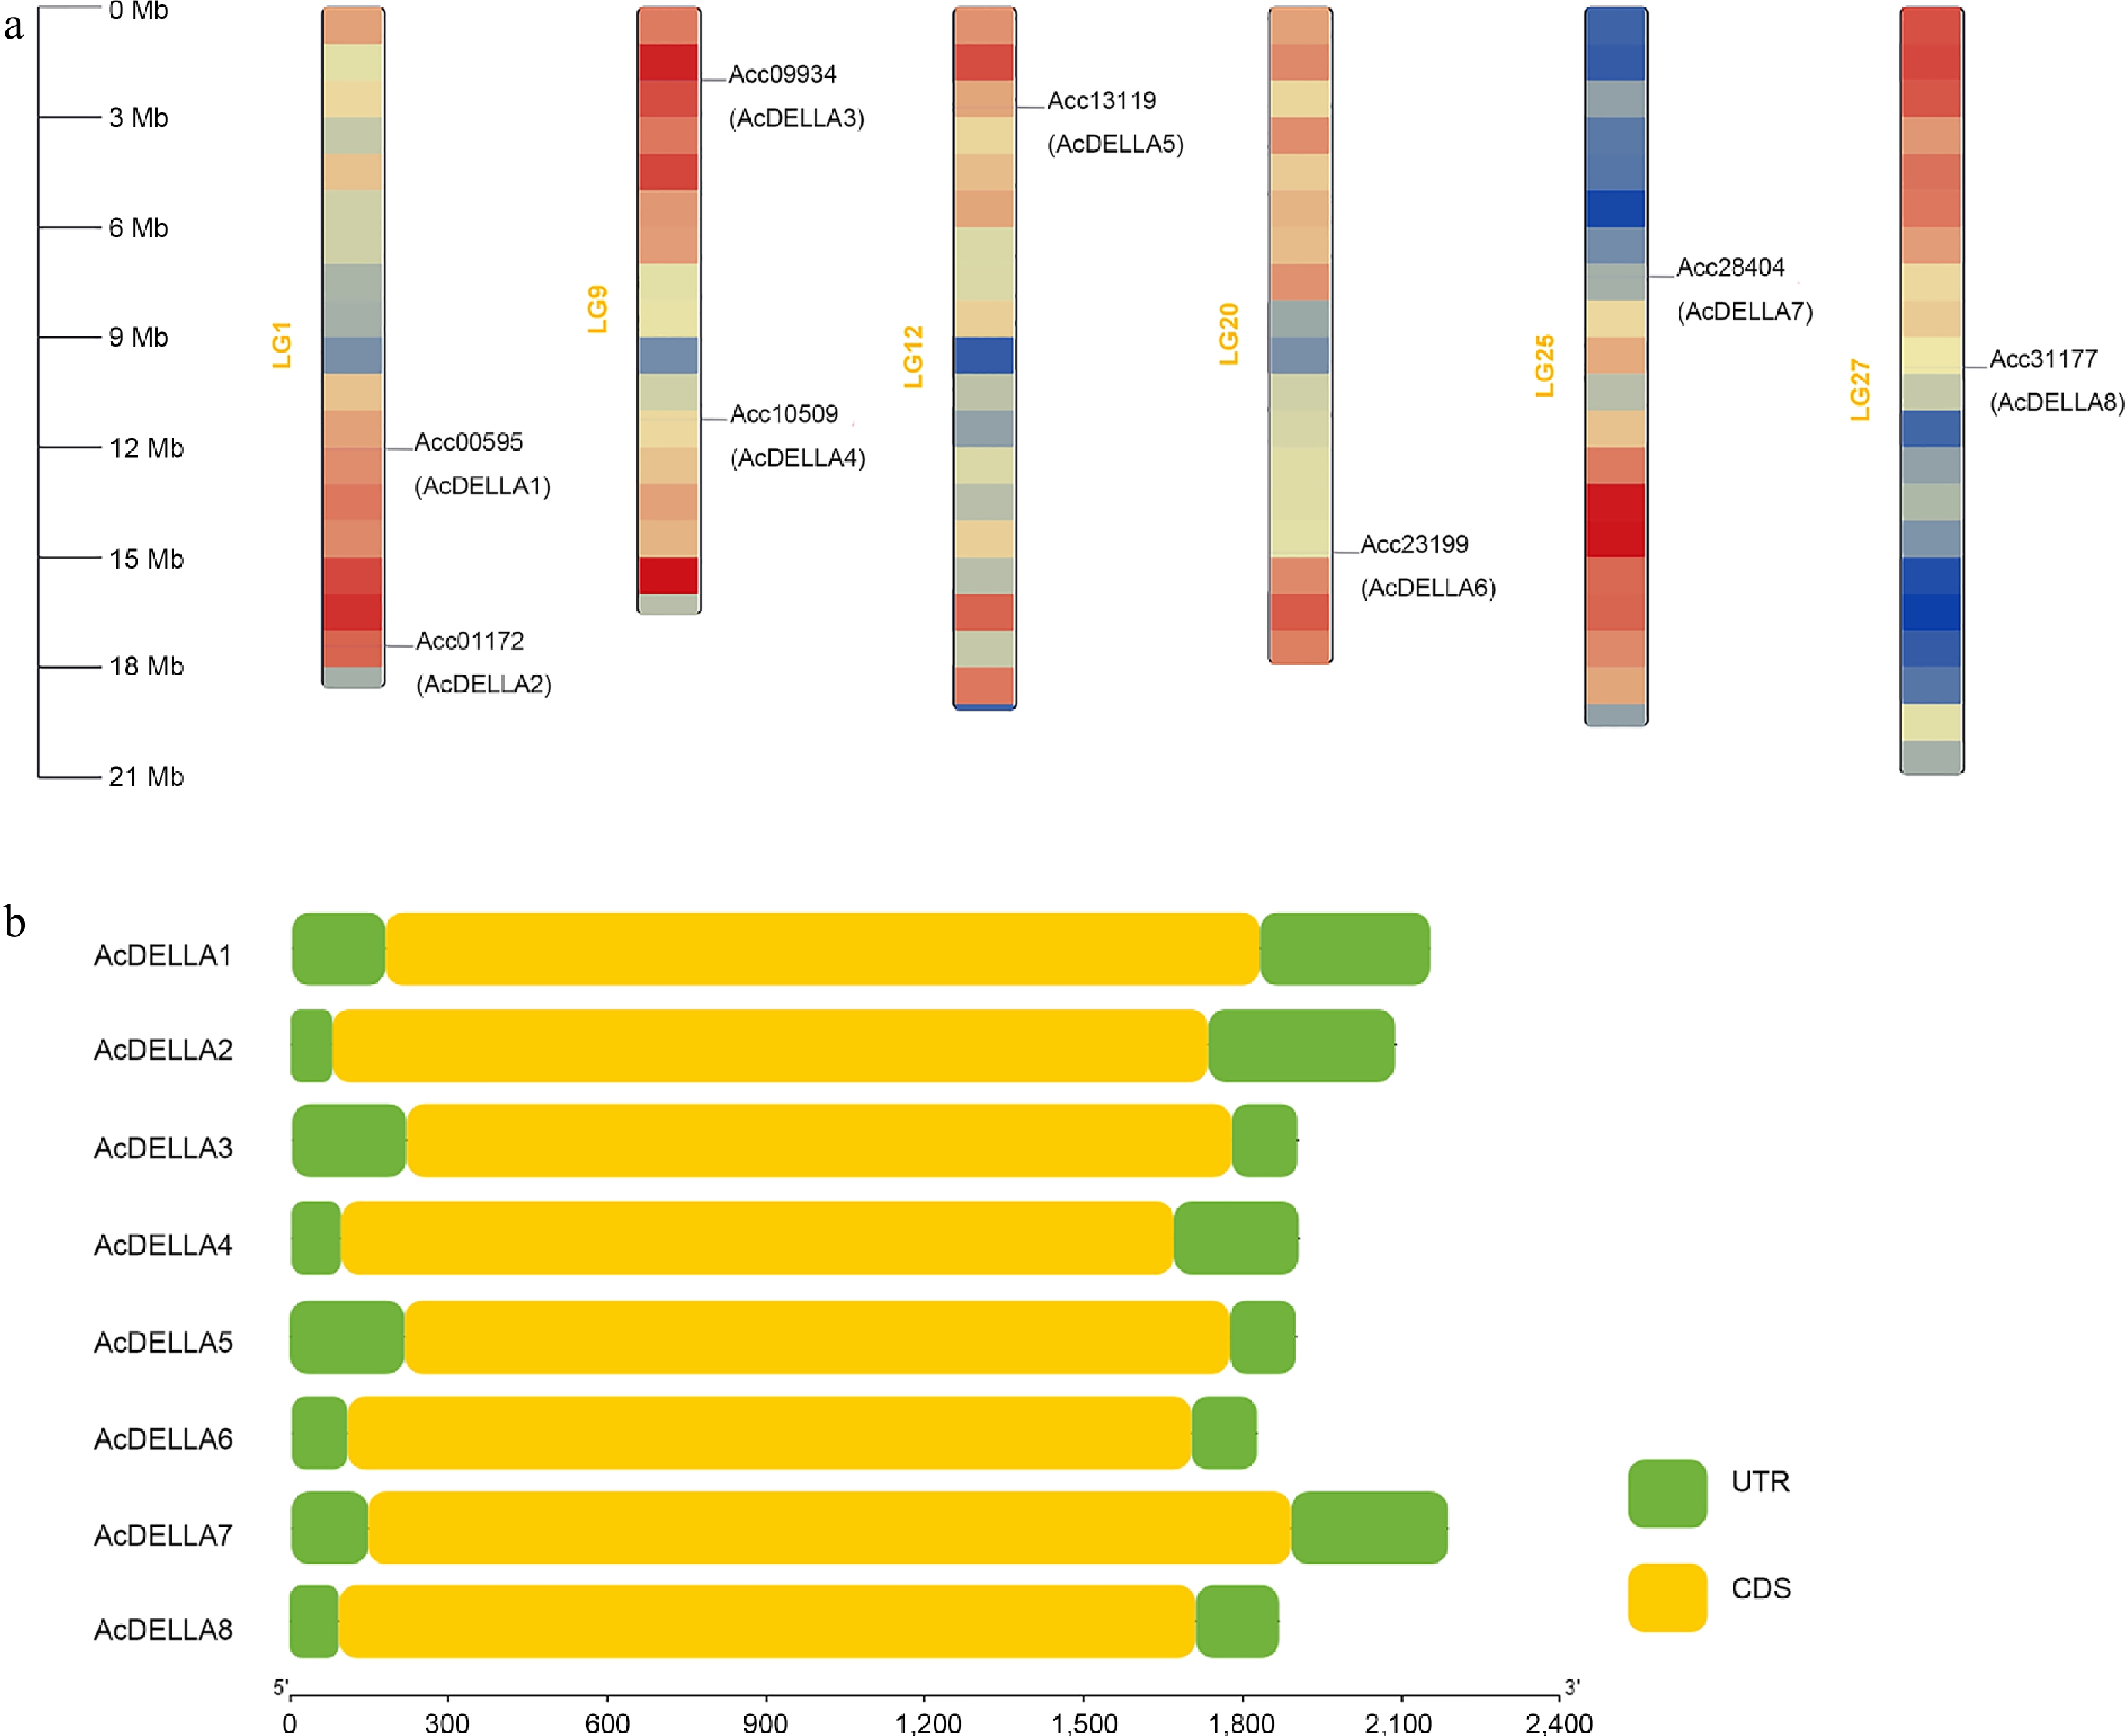
      Figure 3. 

      (a) Chromosome localization of kiwifruit AcDELLA gene family, and (b) schematic diagram of gene structure of kiwifruit AcDELLA gene family.

    • To further understand the evolutionary relationship between kiwifruit AcDELLA and DELLA proteins from other species, DELLA proteins of kiwifruit, Arabidopsis thaliana, wheat, rice, tomato, grape, and potato were subjected to phylogenetic tree construction (Fig. 4a). The results showed that AcDELLA2 and AcDELLA4 were the closest to Solanum tuberosum (StGAI) and Solanum lycopersicum (PROCERA), and AcDELLA7 and AcDELLA8 were the closest relatives to Vitis vinifera (VvGAI) (Fig. 4a). It was found that these eight DELLA genes all contained the typical characteristic structural domains of DELLA, with only slight differences in their positions (Fig. 4b). Eight AcDELLA proteins were found to contain the same conserved motifs: DELLA and VHYNP at N-terminal, LHRI (leucine enriched region I), VHIID, LHRII (leucine enriched region II), PFYRE, and SAW by amino acid sequence analysis (Fig. 4c).
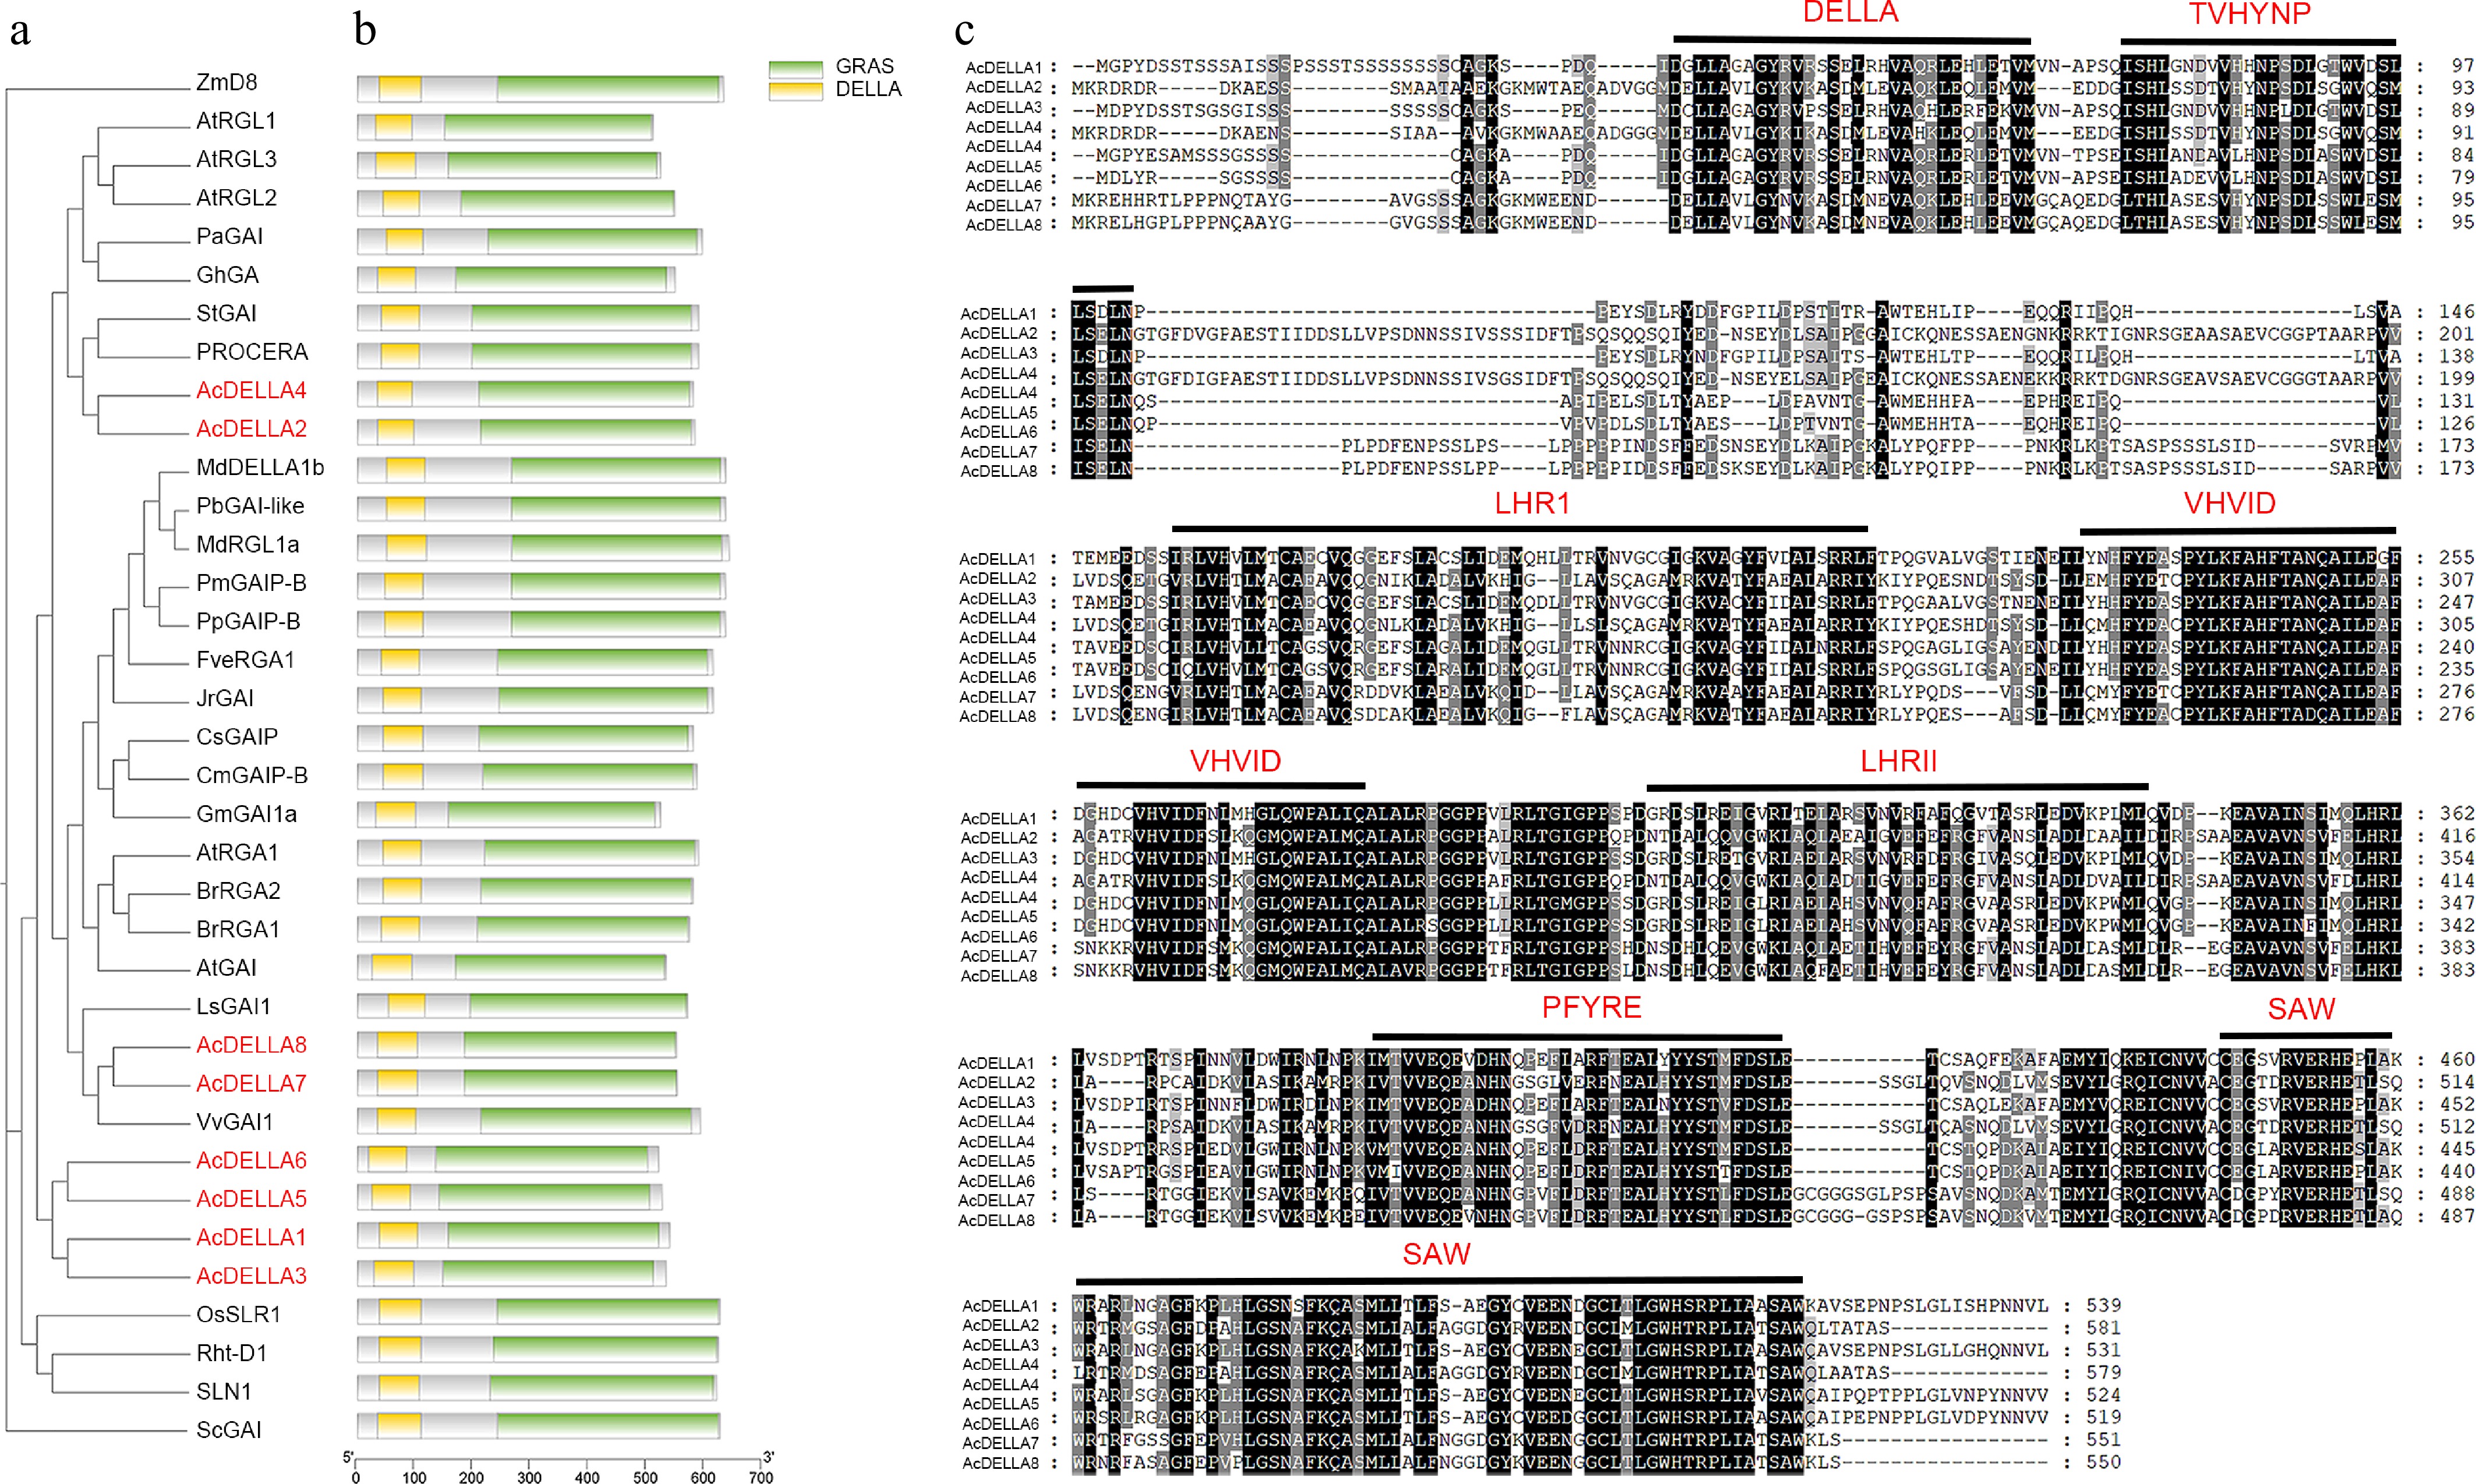
      Figure 4. 

      Phylogenetic analysis, protein domain, conserved motif analysis of AcDELLA proteins. (a) Phylogenetic analysis of kiwifruit DELLA proteins with other species DELLA proteins. (b) Multiple comparison of amino acid sequences of kiwifruit and other species DELLA proteins. (c) Conserved motif analysis of AcDELLA proteins. Conserved residues are indicated by dark and gray boxes and variant residues are shown by light gray boxes. Black lines represent conserved motifs.

    • Analysis of the secondary structure of kiwifruit DELLA proteins revealed that the secondary structures of all eight kiwifruit DELLA proteins were dominated by α-helixes, with a proportion of 47.32% to 49.82%, and β-turns were fewer, with a proportion of 4.15% to 6.11% (Fig. 5a). Three-dimensional structure modelling showed that the protein molecular conformations formed by the three-dimensional spatial arrangement of its proteins were diverse, and the protein conformations of AcDELLA5 and AcDELLA6, AcDELLA7 and AcDELLA8 were more similar (Fig. 5b).
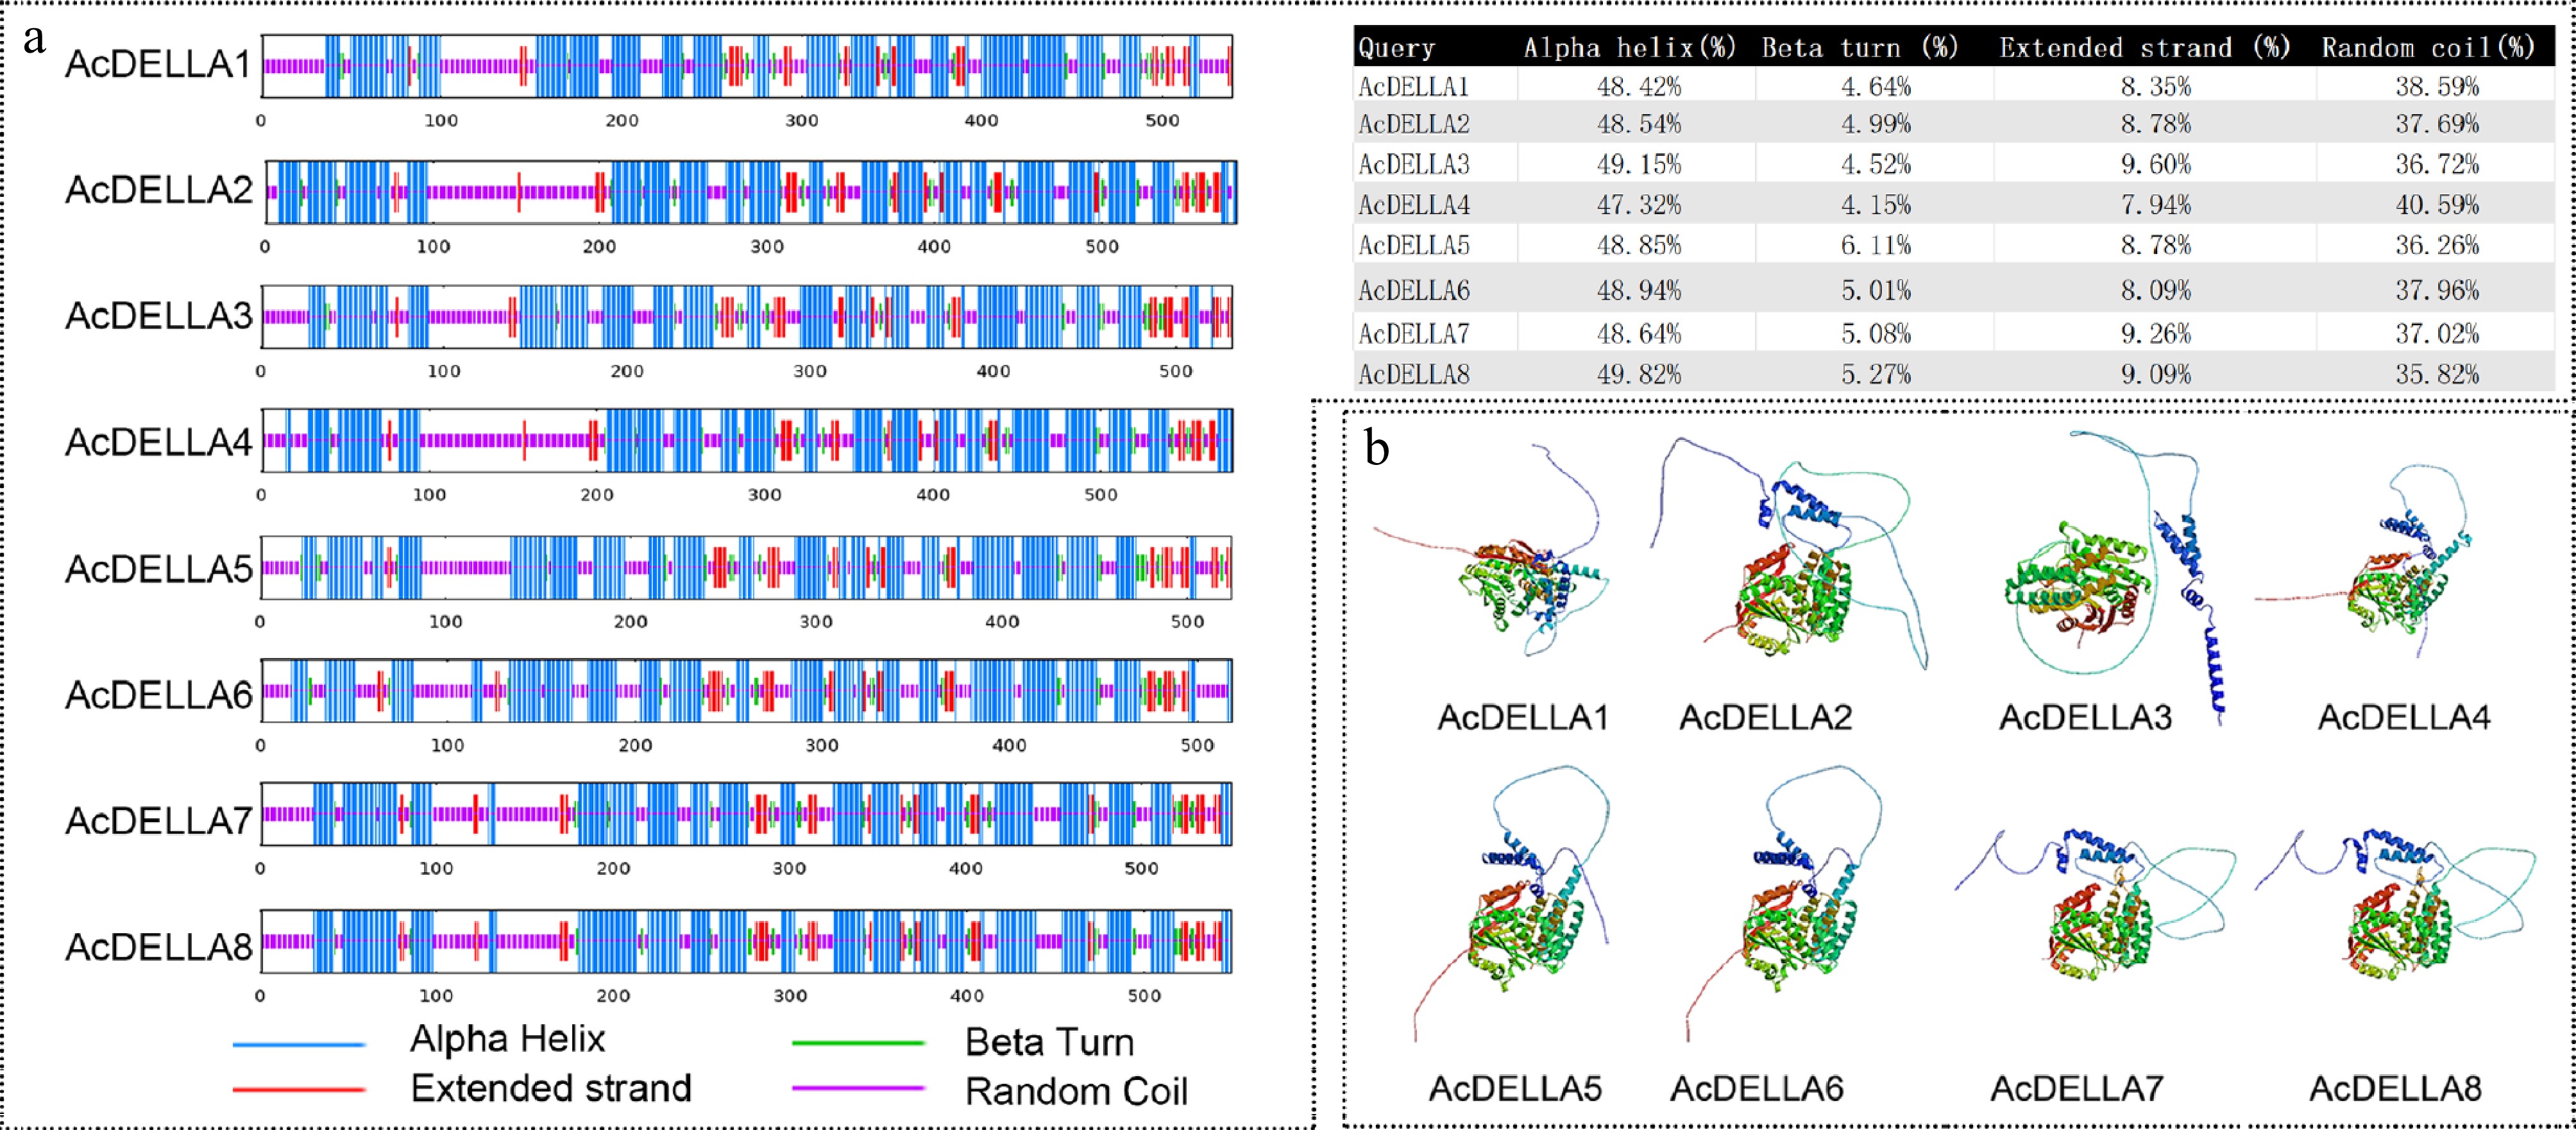
      Figure 5. 

      Structure prediction of eight AcDELLA proteins in kiwifruit. (a) Secondary structure of AcDELLA proteins. (b) Tertiary structure of AcDELLA proteins.

    • To understand the regulation role of AcDELLA genes in different treatments and ripening stages of kiwifruit and various tissues, the expression of eight AcDELLA genes was analysed by qRT-PCR (Fig. 6). Except for AcDELLA1 and AcDELLA2, a total of six AcDELLA genes showed significant difference and different expression patterns between the GA3 treatment group and the control group. The expression levels of AcDELLA1 and AcDELLA2 were very low, and there were no significant differences between the two groups (Fig. 6a, b). The expression of AcDELLA3, AcDELLA4, AcDELLA5, and AcDELLA6 were induced by GA3 to varying degrees (Fig. 6cf), while, GA3 delayed the expression of AcDELLA7, whose expression is closely related to kiwifruit ripening (Fig. 6g). AcDELLA8 maintained higher level in GA3 treated group than in control group during the whole storage period (Fig. 6h). Except for AcDELLA1, all of the DELLAs expressed in stem, leaf, and flower. AcDELLA2, AcDELLA4, AcDELLA7 showed high expression levels in leaves. AcDELLA7 had the highest expression level in flowers and AcDELLA8 in stems (Fig 6i).
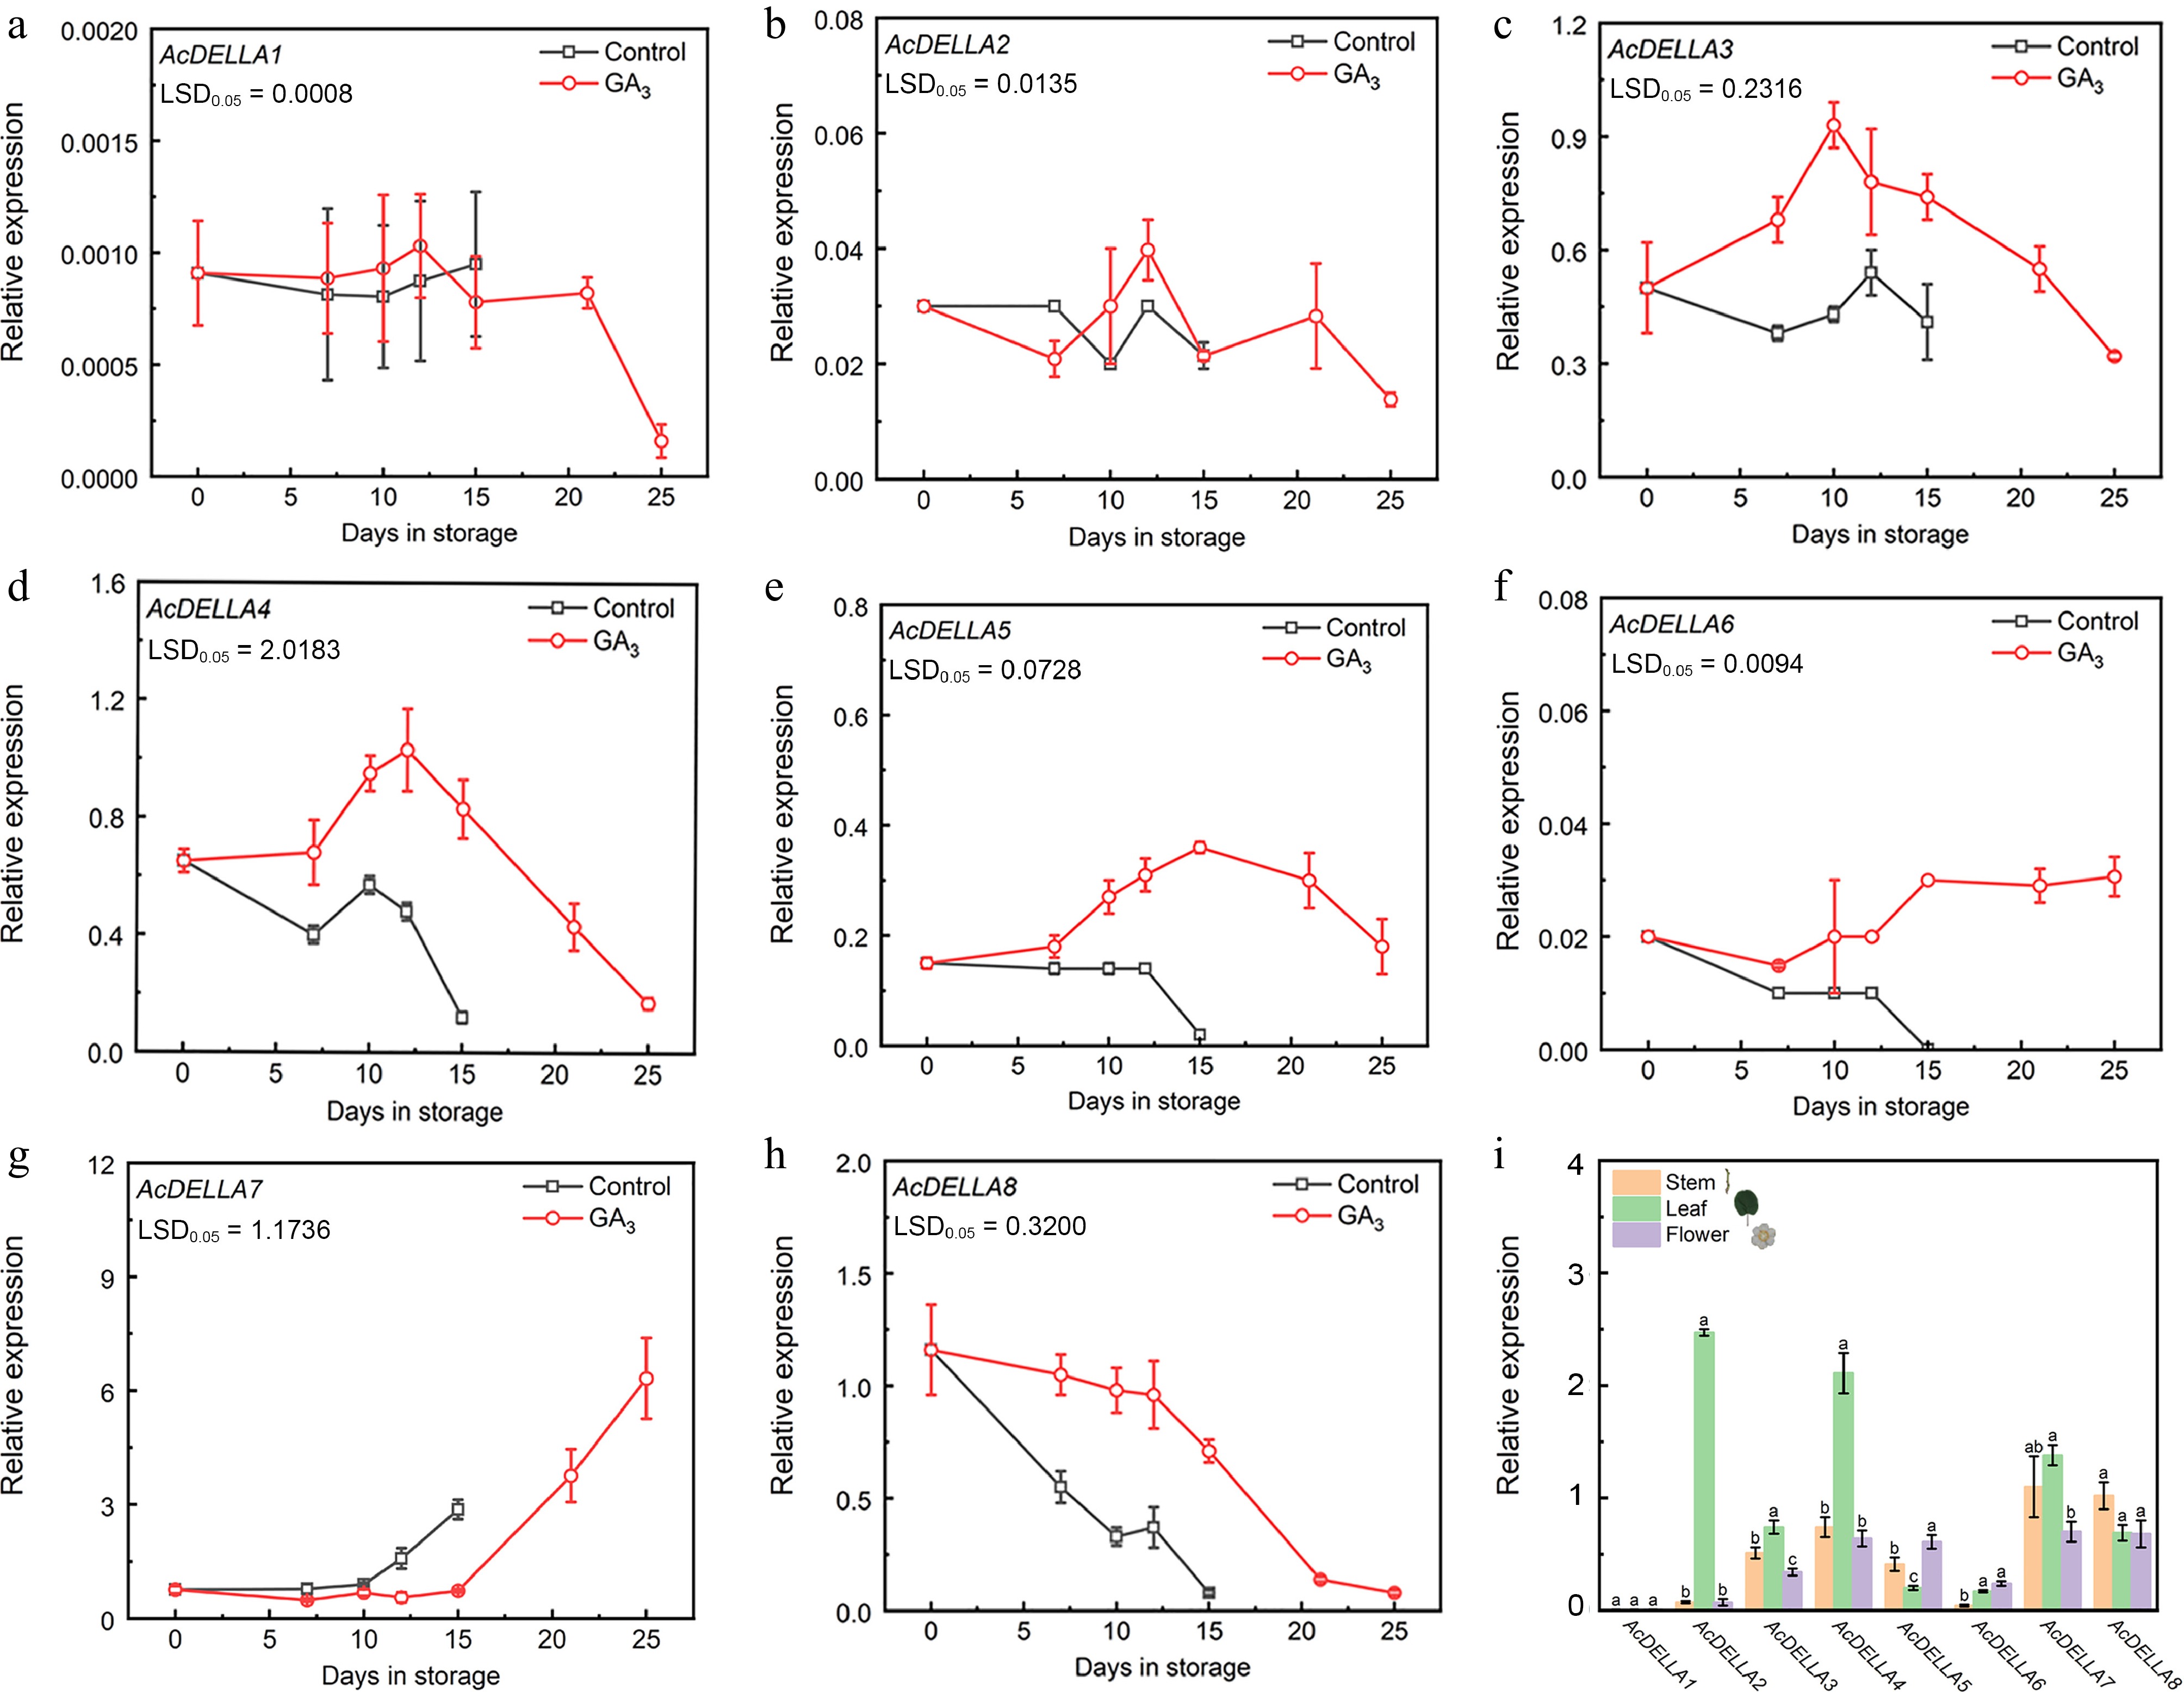
      Figure 6. 

      qRT-PCR analysis of eight DELLAs expression patterns in 'Cuixiang' kiwifruit. (a) AcDELLA1. (b) AcDELLA2. (c) AcDELLA3. (d) AcDELLA4. (e) AcDELLA5. (f) AcDELLA6. (g) AcDELLA7. (h) AcDELLA8. (i) Expression of eight DELLAs at different tissues. Error bars indicate SE from three replicates. LSD values indicate LSD at p = 0.05. Analysis of variance (ANOVA) conducted using SPSS indicated that the observed differences between letters (a−c) at p < 0.05 were statistically significant.

    • To ascertain a comprehensive comprehension of the interrelation between physiological indices (firmness, TSS, total acid, ethylene, starch, cell wall components, WSP, ISP, CBP) and eight AcDELLA genes, an in-depth correlation analysis was undertaken (Fig. 7). Consequently, the physiological attributes and genes demonstrated distinct correlation patterns, with notable high correlations observed across a multitude of physiological attributes and genes. (|r| > 0.90 and p < 0.001). There was a significant negative correlation between firmness and TSS, ethylene, ISP, and WSP. On the contrary, there was a significant positive correlation between firmness and total acid, starch, CWM, and CBP. AcDELLA3 and AcDELLA4 were positively correlated with firmness, starch, CWM, and CBP, and negatively correlated with TSS, ethylene, WSP, and ISP. At the gene level, AcDELLA3 and AcDELLA4 were positively correlated with AcDELLA5 and AcDELLA8, and negatively correlated with AcDELLA7. AcDELLA7 was negatively correlated with firmness, total acid, starch, CWM and CBP, and positively correlated with TSS, ethylene, WSP, and ISP. The correlation between AcDELLA8 and physiological traits was exactly opposite to that of AcDELLA7. AcDELLA8 was positively correlated with firmness, total acid, starch, CWM, and CBP, and negatively correlated with TSS, ethylene, WSP, and ISP (Fig. 7).
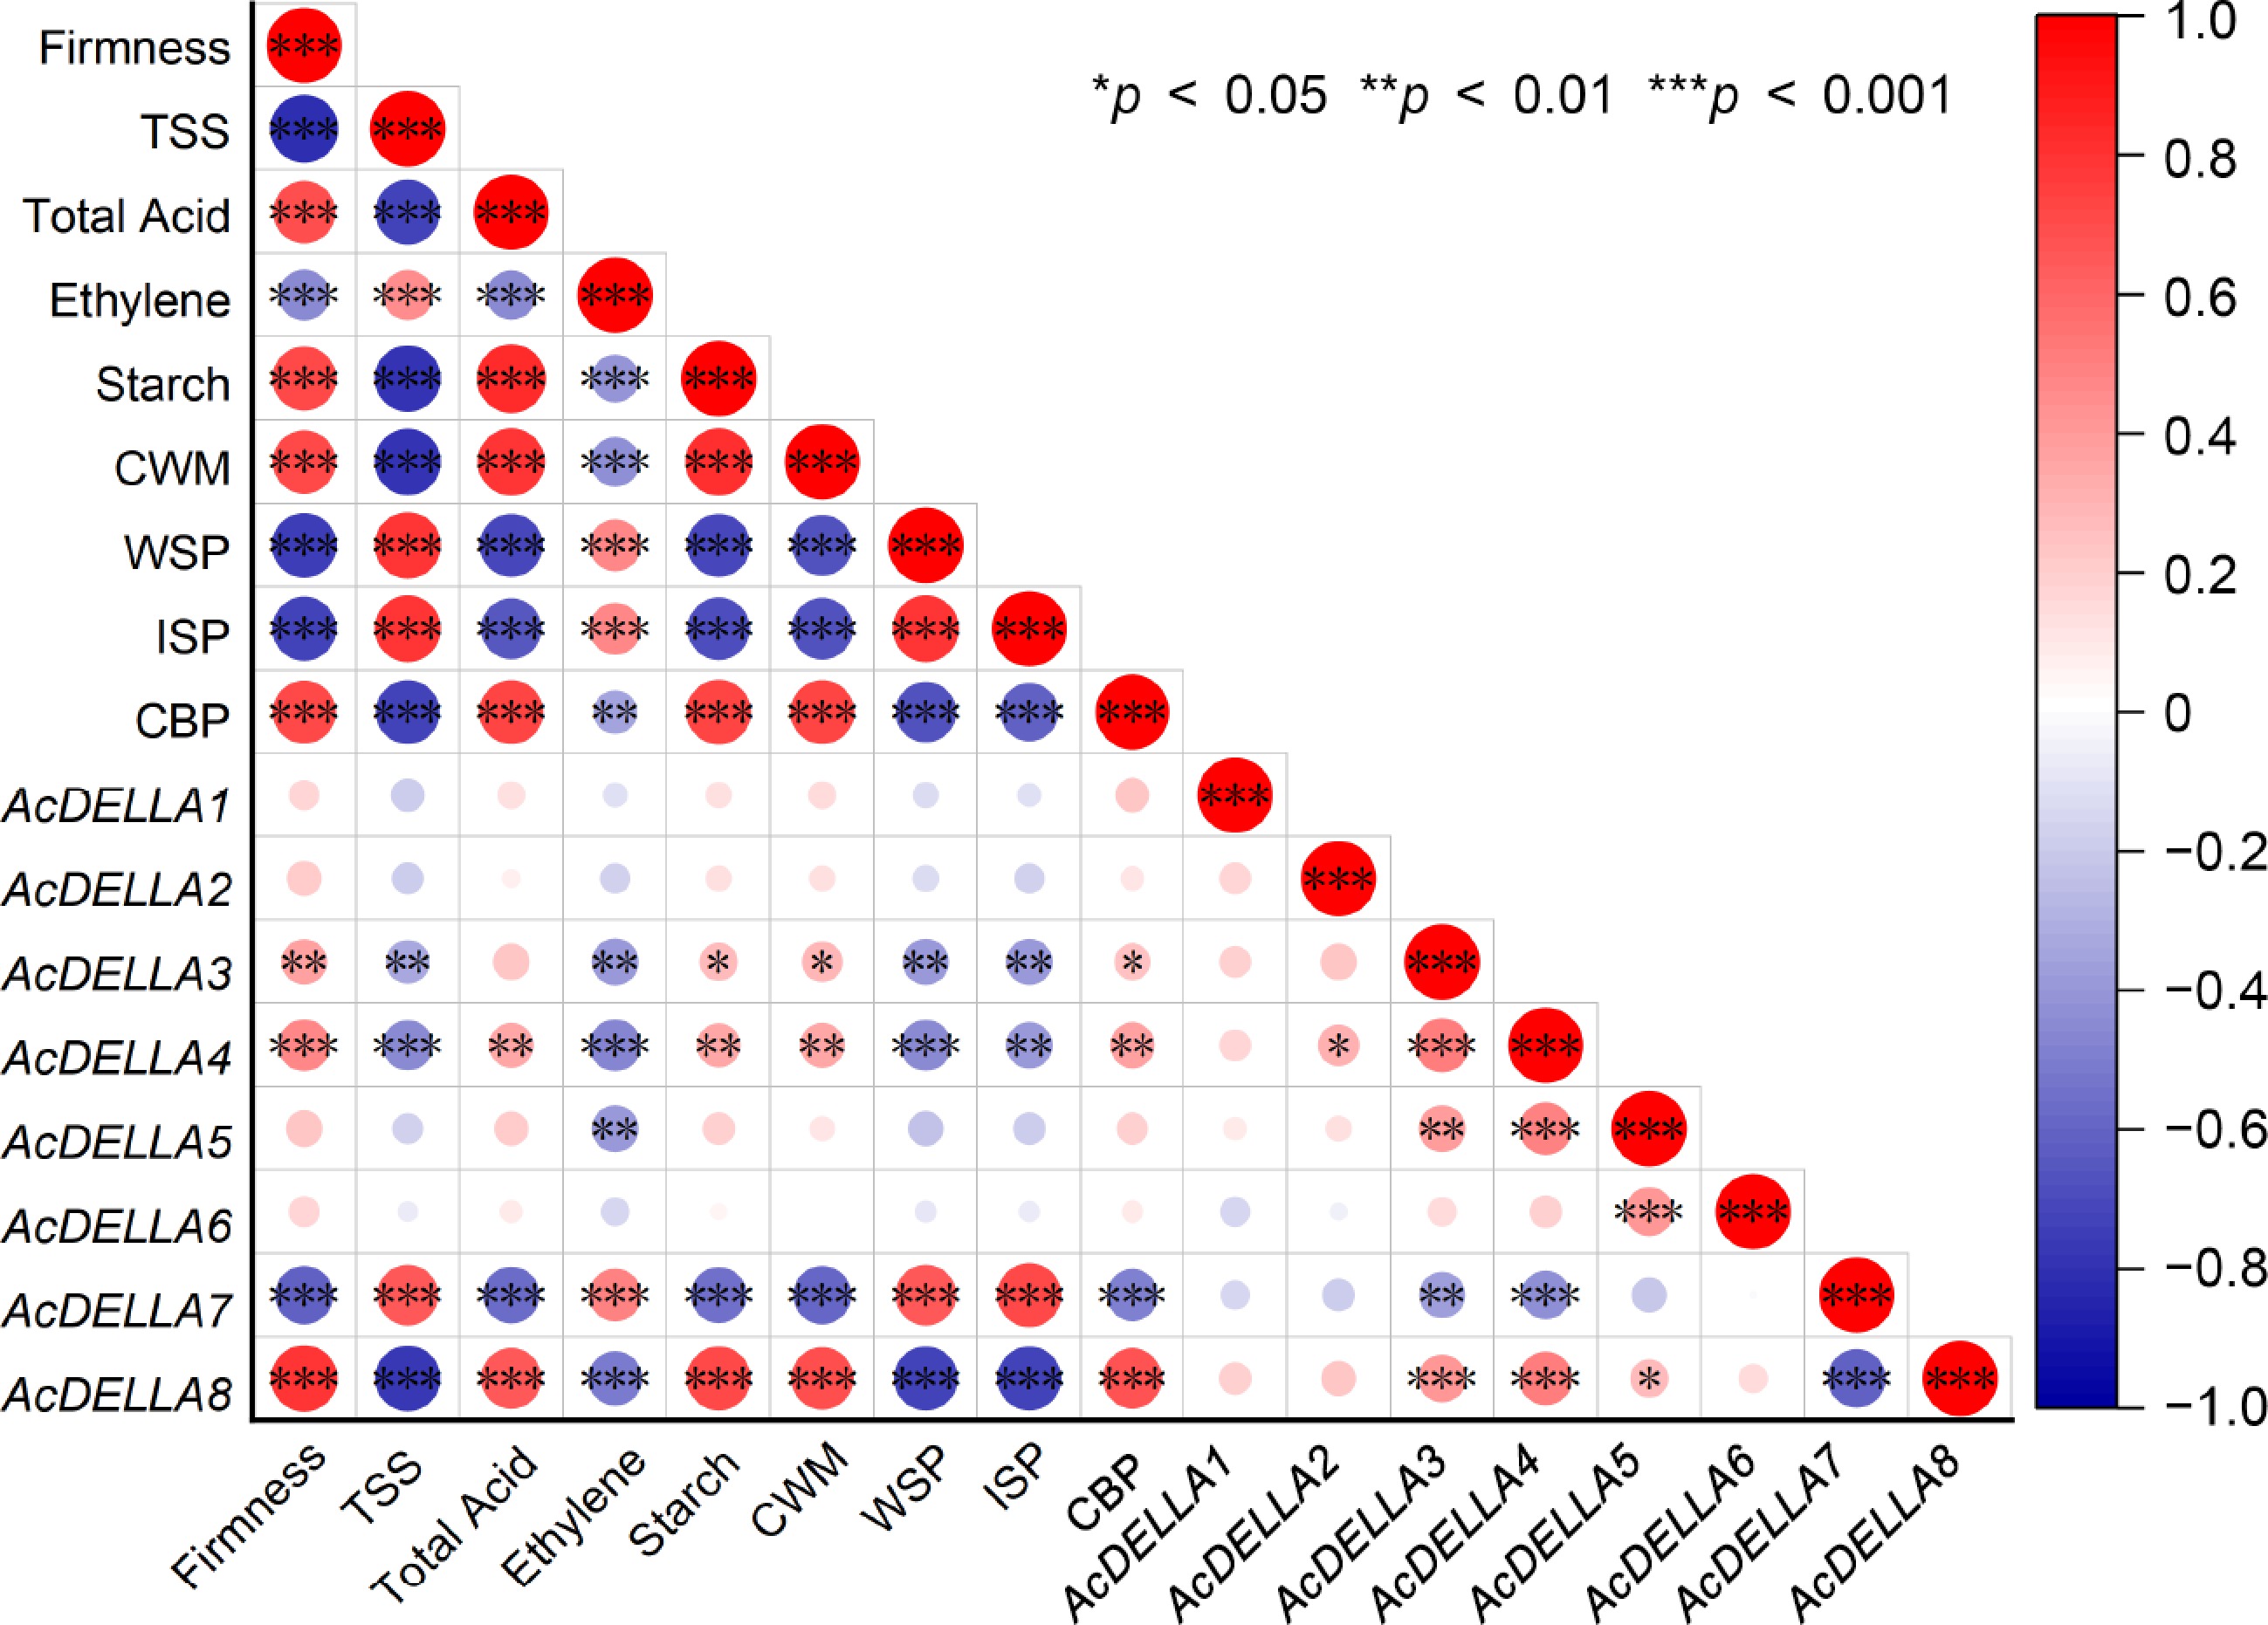
      Figure 7. 

      Correlation analysis of AcDELLA genes expression with physiological characteristics and cell wall composition during storage in kiwifruit. The presence of positive and negative correlations is denoted through the use of color coding, with red signifying a positive correlation and blue indicating a negative one (*, p < 0.05, **, p < 0.01 and ***, p < 0.001).

    • Fruit ripening is a complex procedural process. As a respiratory climate fruit, kiwifruit undergoes a rapid post-ripening and softening process[32]. Gibberellin affects various physiological processes of plant life, including the elongation and division of plant cells, the stimulation of seed germination, and fruit growth[33,34]. In recent years, Gibberellin has been known to play an important role in the fruit ripening process. GA delayed ripening and senescence in various fruits, such as cherry, plum, peach, dates, and banana[3539]. As for kiwifruit, gibberellin treatment delayed the post-ripening process of post-harvest 'Hongyang'[14]. Here, exogenous GA3 was used to treat 'Cuixiang' kiwifruit at the post-ripening stage, and it was found that GA3 treatment maintained fruit firmness, inhibited ethylene production, and delayed ripening (Fig. 1). Previous studies concluded that exogenous gibberellin treatment increased endogenous gibberellin content and delayed fruit ripening and senescence in tomato[40]. When grape berries treated with exogenous GA3, the endogenous GA3, IAA, and CTK content increased, while ABA content decreased[41]. In our study, it is interesting that exogenous GA3 treatment can induce an increase in endogenous GA1, GA3, and GA19 content, especially GA3 (Fig. 2). In summary, GA treatments were effective in delaying postharvest ripening of fruit and presented similar effects in different varieties of kiwifruit.

      DELLA proteins play a key role in the signal transduction pathway of gibberellins. DELLA is characterised by the N-terminal domain of DELLA and the C-terminal domain of GRAS[42]. The N-terminal domain includes two highly conserved acidic domains, the DELLA domain, and the TVHYNP domain, but the amino acid sequence is less similar. In the middle position, it is a nuclear localization signal (NLS), followed by a highly conserved amino acid domain VHVID, two leucine repeats of the LHR sequence, and the ploy S/T/V. In the C-terminal position, it is a highly conserved GRAS domain, which is the functional domain of DELLA[43,44]. These conserved domains not only constitute the complex three-dimensional structure of DELLA protein, but also play important roles in the regulation of plant growth and development. It was found that DELLA and TVHYNP play key roles in the perception of GA signals in plants and belong to the regulatory domains; Poly S/T/V is a modification site for phosphorylation and glycosylation of DELLA protein and is a regulatory domain for inhibitory activity; LHRs act in protein-protein interactions and belongs to the dimerization domain; VHVID, PFYRE, and SAW distributed at the C-terminus of DELLA protein belong to the deterrence domain[45,46]. However, the DELLA gene family has not been found in kiwifruit. In this study, eight AcDELLAs were identified in the kiwifruit genome, and they are distributed on six different chromosomes (Fig. 3a). Moreover, AcDELLAs have complete motifs of DELLA, TVHYNP, LHR, VHVID, PFYRE, and SAW (Fig. 4c), so they may possess powerful functions.

      In plants, DELLA proteins are not only involved in GA signalling, but also in the signalling and biosynthesis of other hormones, such as abscisic acid (ABA), ethylene, and jasmonate (JA)[47]. Besides, DELLA proteins are capable of integrating a wide range of hormonal and environmental signals to regulate plant growth and development[48]. In tomato, the DELLA protein PROCERA (PRO) not only promotes ABA-induced stomatal closure and gene transcription by up-regulating the ABA transporter protein AIT1.1[46], but also mediates crosstalk between the GA and growth hormone pathways with the SlARF7/SlIAA9 complex to regulate fruit development[27]. In pea, DELLA proteins can activate the expression of KNOX and BELL transcription factors, which are involved in cytokinin metabolism[49]. In Arabidopsis, DELLA protein can recognise and bind to the ethylene signaling component EIN3/EIL1 protein, thereby affecting the formation of apical curved hooks[29]. However, there is few reports on the association of DELLA with fruit post-ripening development.

      In this study, we found that the gene expression of AcDELLA3, AcDELLA4, AcDELLA5, AcDELLA6, and AcDELLA8 were induced by GA3 (Fig 6cf), and AcDELLA3, AcDELLA4, AcDELLA5, AcDELLA8 showed significantly high negative correlations with ethylene production (Fig. 7). Therefore, we hypothesised that DELLA might be involved in the regulation of kiwifruit ripening by interacting with ethylene phytohormones. Compared to these GA3-induced DELLAs, AcDELLA3/4/5/6/8, the expression of AcDELLA7 remained at a low level in the earlier-storage period, but increased with the prolongation of the storage time in both control and GA3 treated samples (Fig. 6f). Moreover, the expression trend of AcDELLA7 extremely significant negatively correlated with firmness, whereas showed a high positive correlation with the trend of TSS, ethylene, WSP, and ISP (Fig. 7). In other words, the expression of AcDELLA7 was positively correlated with kiwifruit softening and ripening. It seemed that AcDELLA7 did not respond to GA3 treatment, but to ripeness. The phenomenon of AcDELLA7 indicated that the expression of some DELLAs or the stability of DELLA proteins could be regulated by other factors, not only by gibberellins. Therefore, we deduced that part of AcDELLAs participate in kiwifruit postharvest ripening and prolong storage time by responding to GA signals, ethylene signals, or other ripening signals. The identification and expression of AcDELLA provided new targets and might be particularly important for kiwifruit post-ripening regulation.

    • In this study, GA3 treatment effectively preserved kiwifruit fruit firmness and delayed fruit ripening. Eight AcDELLA genes were identified from the kiwifruit genome database. Kiwifruit AcDELLA genes are distributed on six different chromosomes, and they contain only one exon. Conserved domains and secondary and tertiary structural analyses showed the similarity of DELLA on the same evolutionary meristem. Phylogenetic analyses demonstrated the homology of the kiwifruit AcDELLA proteins within and among species, to better understanding the evolutionary mechanisms. In addition, gene expression analyses revealed that several AcDELLAs may be involved in the GA signaling pathway to inhibit kiwifruit ripening and softening, especially AcDELLA3, AcDELLA4, and AcDELLA5. The present study comprehensively investigated the genetic characterization of the kiwifruit AcDELLA gene family, which lays the foundation for understanding the kiwifruit AcDELLA genes, and provided a reference for the postharvest preservation of kiwifruit.

      • This work was supported by the Natural Science Foundation of Shandong Province (ZR2023MC007), and the Key Research and Development Program of Shandong Province (2024TZXD004). The funders had no role in the material creation, designing the study, analysis data and in writing the manuscript.

      • The authors confirm contribution to the paper as follows: data curation: Zhang X, Zhao K, Wang W, Li J, Alabd A; formal analysis: Zhang X, Zhao K, Wang W, Li J, Alabd A, Zhang A; software, visualization, writing - original draft: Zhang X; methodology, writing - review & editing: Zhao K, Wang W, Li J, Alabd A, Zhang A; conceptualization, resources, funding acquisition: Zhang A. All authors reviewed the results and approved the final version of the manuscript.

      • The datasets generated during the current study are available from the corresponding author on reasonable request.

      • The authors declare that they have no conflict of interest.

      • Copyright: © 2025 by the author(s). Published by Maximum Academic Press on behalf of Chongqing University. This article is an open access article distributed under Creative Commons Attribution License (CC BY 4.0), visit https://creativecommons.org/licenses/by/4.0/.
    Figure (7)  References (49)
  • About this article
    Cite this article
    Zhang X, Zhao K, Wang W, Alabd A, Li J, et al. 2025. Gibberellin delays kiwifruit postharvest ripening via the AcDELLA gene family. Plant Hormones 1: e005 doi: 10.48130/ph-0025-0005
    Zhang X, Zhao K, Wang W, Alabd A, Li J, et al. 2025. Gibberellin delays kiwifruit postharvest ripening via the AcDELLA gene family. Plant Hormones 1: e005 doi: 10.48130/ph-0025-0005

Catalog

  • About this article

/

DownLoad:  Full-Size Img  PowerPoint
Return
Return