


-
In recent years, there has been a noticeable shift in attitudes towards food consumption, moving from simply 'eating-full' to a focus on 'eating-well', driven by the increasing awareness of the nutritional value of food. Common wheat (Triticum aestivum L.) plays a crucial role as a staple food for humans, providing essential nutrients for a significant portion of the global population. Consequently, modern wheat research is dedicated to the continual enhancement of the nutrient content of wheat grains[1].
Macronutrients present in wheat grains-such as proteins, fats, and carbohydrates—are instrumental to both the grains' nutritional profile and human wellness. When compared to conventional wheat, colored wheat varieties exemplify a higher quotient of proteins, starches, and cellulose, maintaining a similar level of fats[2,3]. On the micronutrient spectrum, which encompasses vitamins, minerals, and flavonoids, among other compounds, these minute molecular entities exhibit diverse biological functions and are critical for human health. Flavonoids, in particular, are renowned for their antioxidant, antimicrobial, and anti-inflammatory actions, contributing to a reduced likelihood of various diseases[4,5]. Within the flavonoid family, C-glycosylated variants show superior anti-diabetic and antioxidant effects as opposed to their O-glycosylated counterparts[6]. Anthocyanidins, part of the flavonoid spectrum, tend to accumulate in the outer layers of colored wheat grains, such as the pericarp and aleurone, bestowing the grains with vibrant shades like purple, blue, or black[7,8]. These colors distinguish them from the typical white wheat and confer health benefits, enhance the grains' aesthetic appeal, and contribute to the generation of natural pigments[9−11]. Rich in vitamin B and tocopherols, wheat grains offer essential nutritional benefits[12]. Vitamin B acts as a cofactor for numerous enzymes vital for the normal functioning of the nervous system[13], while tocopherols, especially the unsaturated tocotrienols, are valued for their potent antioxidant properties[14]. Minerals play a pivotal role not only in plant growth and development but also in human health. Zinc is key for comprehensive brain growth, while iron is indispensable for the synthesis of hemoglobin[15]. Deficiencies in iron and zinc can lead to what is often termed 'hidden hunger' in certain developing regions[16]. Therefore, continued research into the detailed composition of these micronutrients within wheat grains is of paramount importance. Such investigations will pave the way for creating foods rich in nutrients and will provide valuable insights into their dietary significance for future breeding programs.
Examining the dynamic accumulation of nutrients throughout the development of wheat grains could yield fascinating insights, particularly as the grain-filling phase is a crucial period wherein a multitude of nutrients are dynamically amassed[17]. This is a pivotal determinant for both crop yield and quality. Grains assimilate carbohydrates, storage proteins, and fatty acids via diverse biological pathways as they develop[18]. However, research into the accumulation of micronutrients during this process is relatively limited, and the focus tends to be on a singular nutrient class, leading to a somewhat fragmented understanding. It has been reported that antioxidants, including polyphenols, diminish progressively during grain development, reaching their lowest levels at full maturity. Consequently, products crafted from less mature wheat are often preferred by consumers for their higher antioxidant activities[19−21]. In barley, a significant accretion of flavonoid C/O-glycosides and anthocyanins is observed during grain discoloration and maturation stages[22]. For microelements such as Zn, Ca, and Mn, a decrease is noted during the development of rice grains, in contrast to Fe and Cu, which do not follow this trend[23]. Another inquiry has scrutinized the shifts in toxic elements within wheat grains, revealing a progressive elevation in As and Cd concentrations from the beginning of grain filling to the attainment of maturity[24]. Reports on the dynamic changes of beneficial mineral elements and other nutrients during the development of wheat grains are exceedingly rare. In light of this, it is of paramount importance to elucidate the complex patterns of nutrient accumulation during the formation of wheat grains. A more comprehensive understanding of these dynamics will contribute not only to the optimization of grain nutritional value but also to the enhancement of overall crop quality, with implications for both agricultural practices and food sciences.
The composition and varieties of anthocyanins are intimately linked to the expression of genes associated with the anthocyanin biosynthesis pathway[25]. This pathway's gene expression is principally governed by a ternary complex composed of three transcription factors, as identified in the research[26]. There has been a considerable body of transcriptome research concerning the anthocyanidin biosynthesis pathway in wheat, with notable studies contributing to our current understanding[8,27−30]. However, given the intricate genetic makeup inherent to the varying hues of wheat and the structural diversity of anthocyanins, further studies are essential. Comprehensive research is needed to unravel the complexities and characterize the full array of genes that orchestrate the anthocyanin synthesis pathway. By delving deeper into the genetic underpinnings, we can broaden our insights into the nuanced mechanisms that regulate anthocyanin production in wheat.
In this study, we conducted an extensive metabolomic and ionomic analysis of 16 diverse colored wheat varieties to determine the nutrient composition and value linked to different wheat pigments. We also examined the fluctuating patterns of nutrient concentration during grain maturation and explored the potential for these varieties to be developed into functional foods. Additionally, using transcriptomic data, we identified crucial genes and transcription factors involved in anthocyanin biosynthesis. This research has deepened our comprehension of nutrient biosynthesis in colored wheat grains, providing a solid foundation for guiding targeted breeding and genetic enhancement strategies.
-
The experimental wheat cultivars were sown in Wuhan, China, adhering to a completely randomized block design. Grain samples were meticulously harvested at intervals of 7, 14, 21, 28, and 35 d post-flowering, as well as at the point of maturity. These samples were swiftly submerged in liquid nitrogen for rapid freezing and subsequently preserved at −80 °C to maintain their integrity for subsequent analyses. For the metabolomic and ionomic evaluations, a set of three independent biological replicates was systematically prepared for each collection time point.
Nutrient analysis by LC-MS/MS and ICP-MS
-
Grain samples were finely pulverized into powder using a tissue grinder (55 Hz, 60 s). To each 100 mg of powdered sample, 1.0 mL of 70% methanol solution was added. The mixture was subjected to ultrasonic extraction for 30 min, followed by centrifugation. The clear supernatant was then carefully filtered through a 0.22 μm microporous membrane and transferred into a vial, ready for downstream LC-MS analysis. Metabolites were quantified using a previously established method based on multiple reaction monitoring (MRM) scheduling[31].
Post freeze-drying, grain samples were meticulously ground into fine powders using a non-metallic mortar. For each sample, 200 mg of the dried powder was digested in 8 mL of 65% nitric acid, utilizing a MARS9 microwave (CEM) with a temperature gradient program incrementing from 120 °C to 180 °C over 45 min. Upon dilution with deionized water, the concentrations of ten elements were quantitatively assessed through inductively coupled plasma mass spectrometry (ICP-MS, NexION 1000G). The standard curves generated for each element achieved a correlation coefficient (R-value) exceeding 0.999, ensuring high levels of accuracy in the measurements. T-tests were employed to identify differentially accumulated nutrients (DANs). The resulting nutrient accumulation profiles underwent hierarchical clustering analysis (HCA) utilizing R software (
www.r-project.org ).RNA extraction and RNA-seq analysis
-
RNA-seq data from six samples were aligned to the Chinese Spring RefSeqv1.1 + UTR transcriptome reference using Salmon software version 1.4.0[32]. Subsequently, we computed read counts and transcripts per million (TPM) using the tximport package version 1.20.0 in R[33]. The labels B14 and B21 corresponded to the samples collected 14 and 21 d after flowering (DAF) from the L14207 wheat line, while P14 and P21 represented the samples at the same respective stages from the LHM wheat line.
For the identification of differentially expressed genes (DEGs), we applied the DEseq2 package version 1.32.0 in R[34], which leverages a negative binomial distribution model. The selection criteria for DEGs were set at an adjusted p-value (Q value) ≤ 0.05 and an absolute log2 fold change (|log2(FC)|) greater than 1. The resulting DEGs were visualized using heatmaps constructed with the package in R. We further employed principal component analysis (PCA) to explore data structure using R software.
KEGG pathway analysis was conducted using the ClusterProfiler package[35]. For pathway enrichment analysis, DEGs were mapped to the KEGG orthology database[36], adopting p < 0.05 as the threshold for significantly enriched pathways. KEGG pathways with statistical enrichment of DEGs were detected using ClusterProfiler R package.
K-means cluster analysis
-
K-means clustering analysis was carried out on samples representing four distinct time points and varieties using the factoextra R package. Additionally, the prcomp function within R software was utilized to compute normalized expression values for both genes and metabolites.
Quantitative real-time polymerase chain reaction analysis
-
Real-time PCR analyses were conducted for 40 amplification cycles under standardized conditions using the Bio-Rad CFX96 Real-Time PCR Detection System. Each sample underwent triplicate assays to ensure reproducibility. The expression levels of mRNA were normalized against actin and quantified employing the 2−ΔΔCᴛ comparative threshold cycle method. Primers for the PCR reactions were meticulously designed based on mRNA sequences sourced from the National Center for Biotechnology Information (NCBI) database.
-
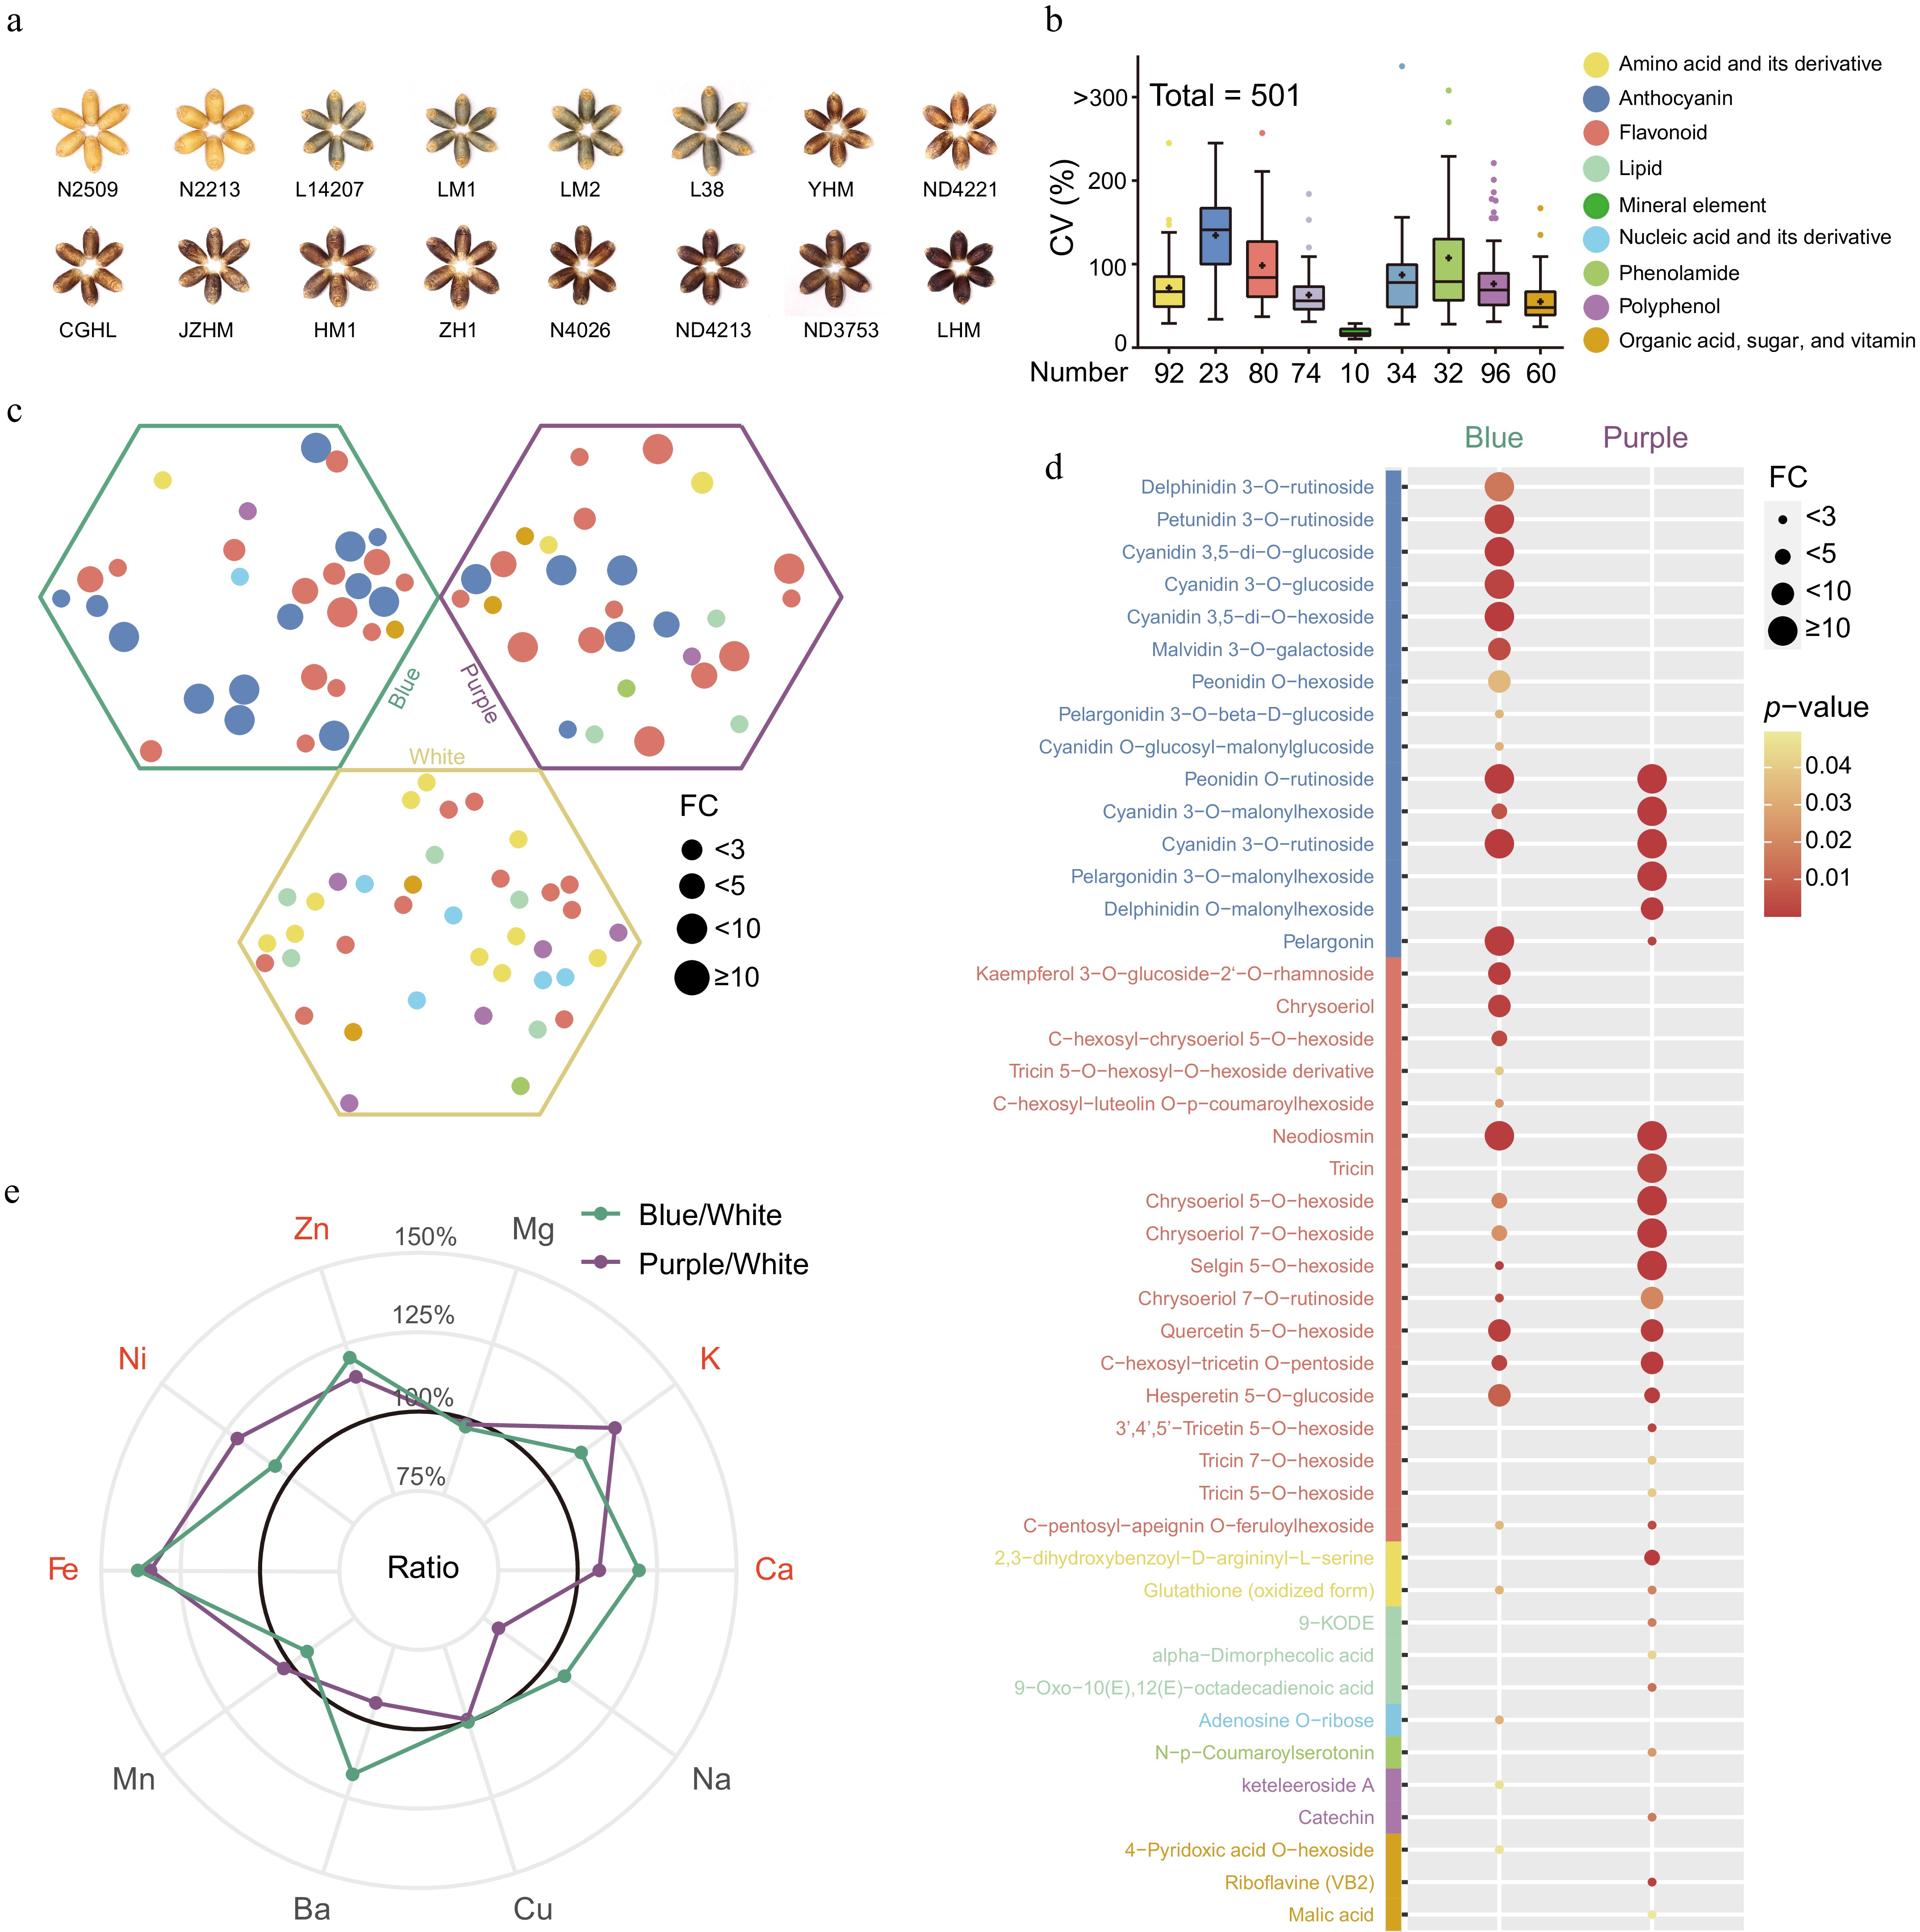
A comprehensive ionomic and metabolomic assessment was performed on mature wheat grains of three distinct hues-blue, purple, and white-resulting in the detection and quantification of 501 nutrients, which included ten essential mineral elements (Fig. 1a & b; Supplementary Table S1). There was a pronounced variability in nutrient accumulation across the different varieties, with the average coefficient of variation (CV) reaching 79.7% (Fig. 1b; Supplementary Table S2). Among these, anthocyanins exhibited the most significant variation, with a CV of 140.1%, followed by phenolamides and flavonoids at 108.2% and 98.5%, respectively (Fig. 1b). In contrast, mineral elements demonstrated a relatively modest average CV of 17.2%, likely linked to effects of ion homeostasis (Fig. 1b). Both excessive and deficient nutrient concentrations have the potential to disrupt typical growth and developmental processes[37].
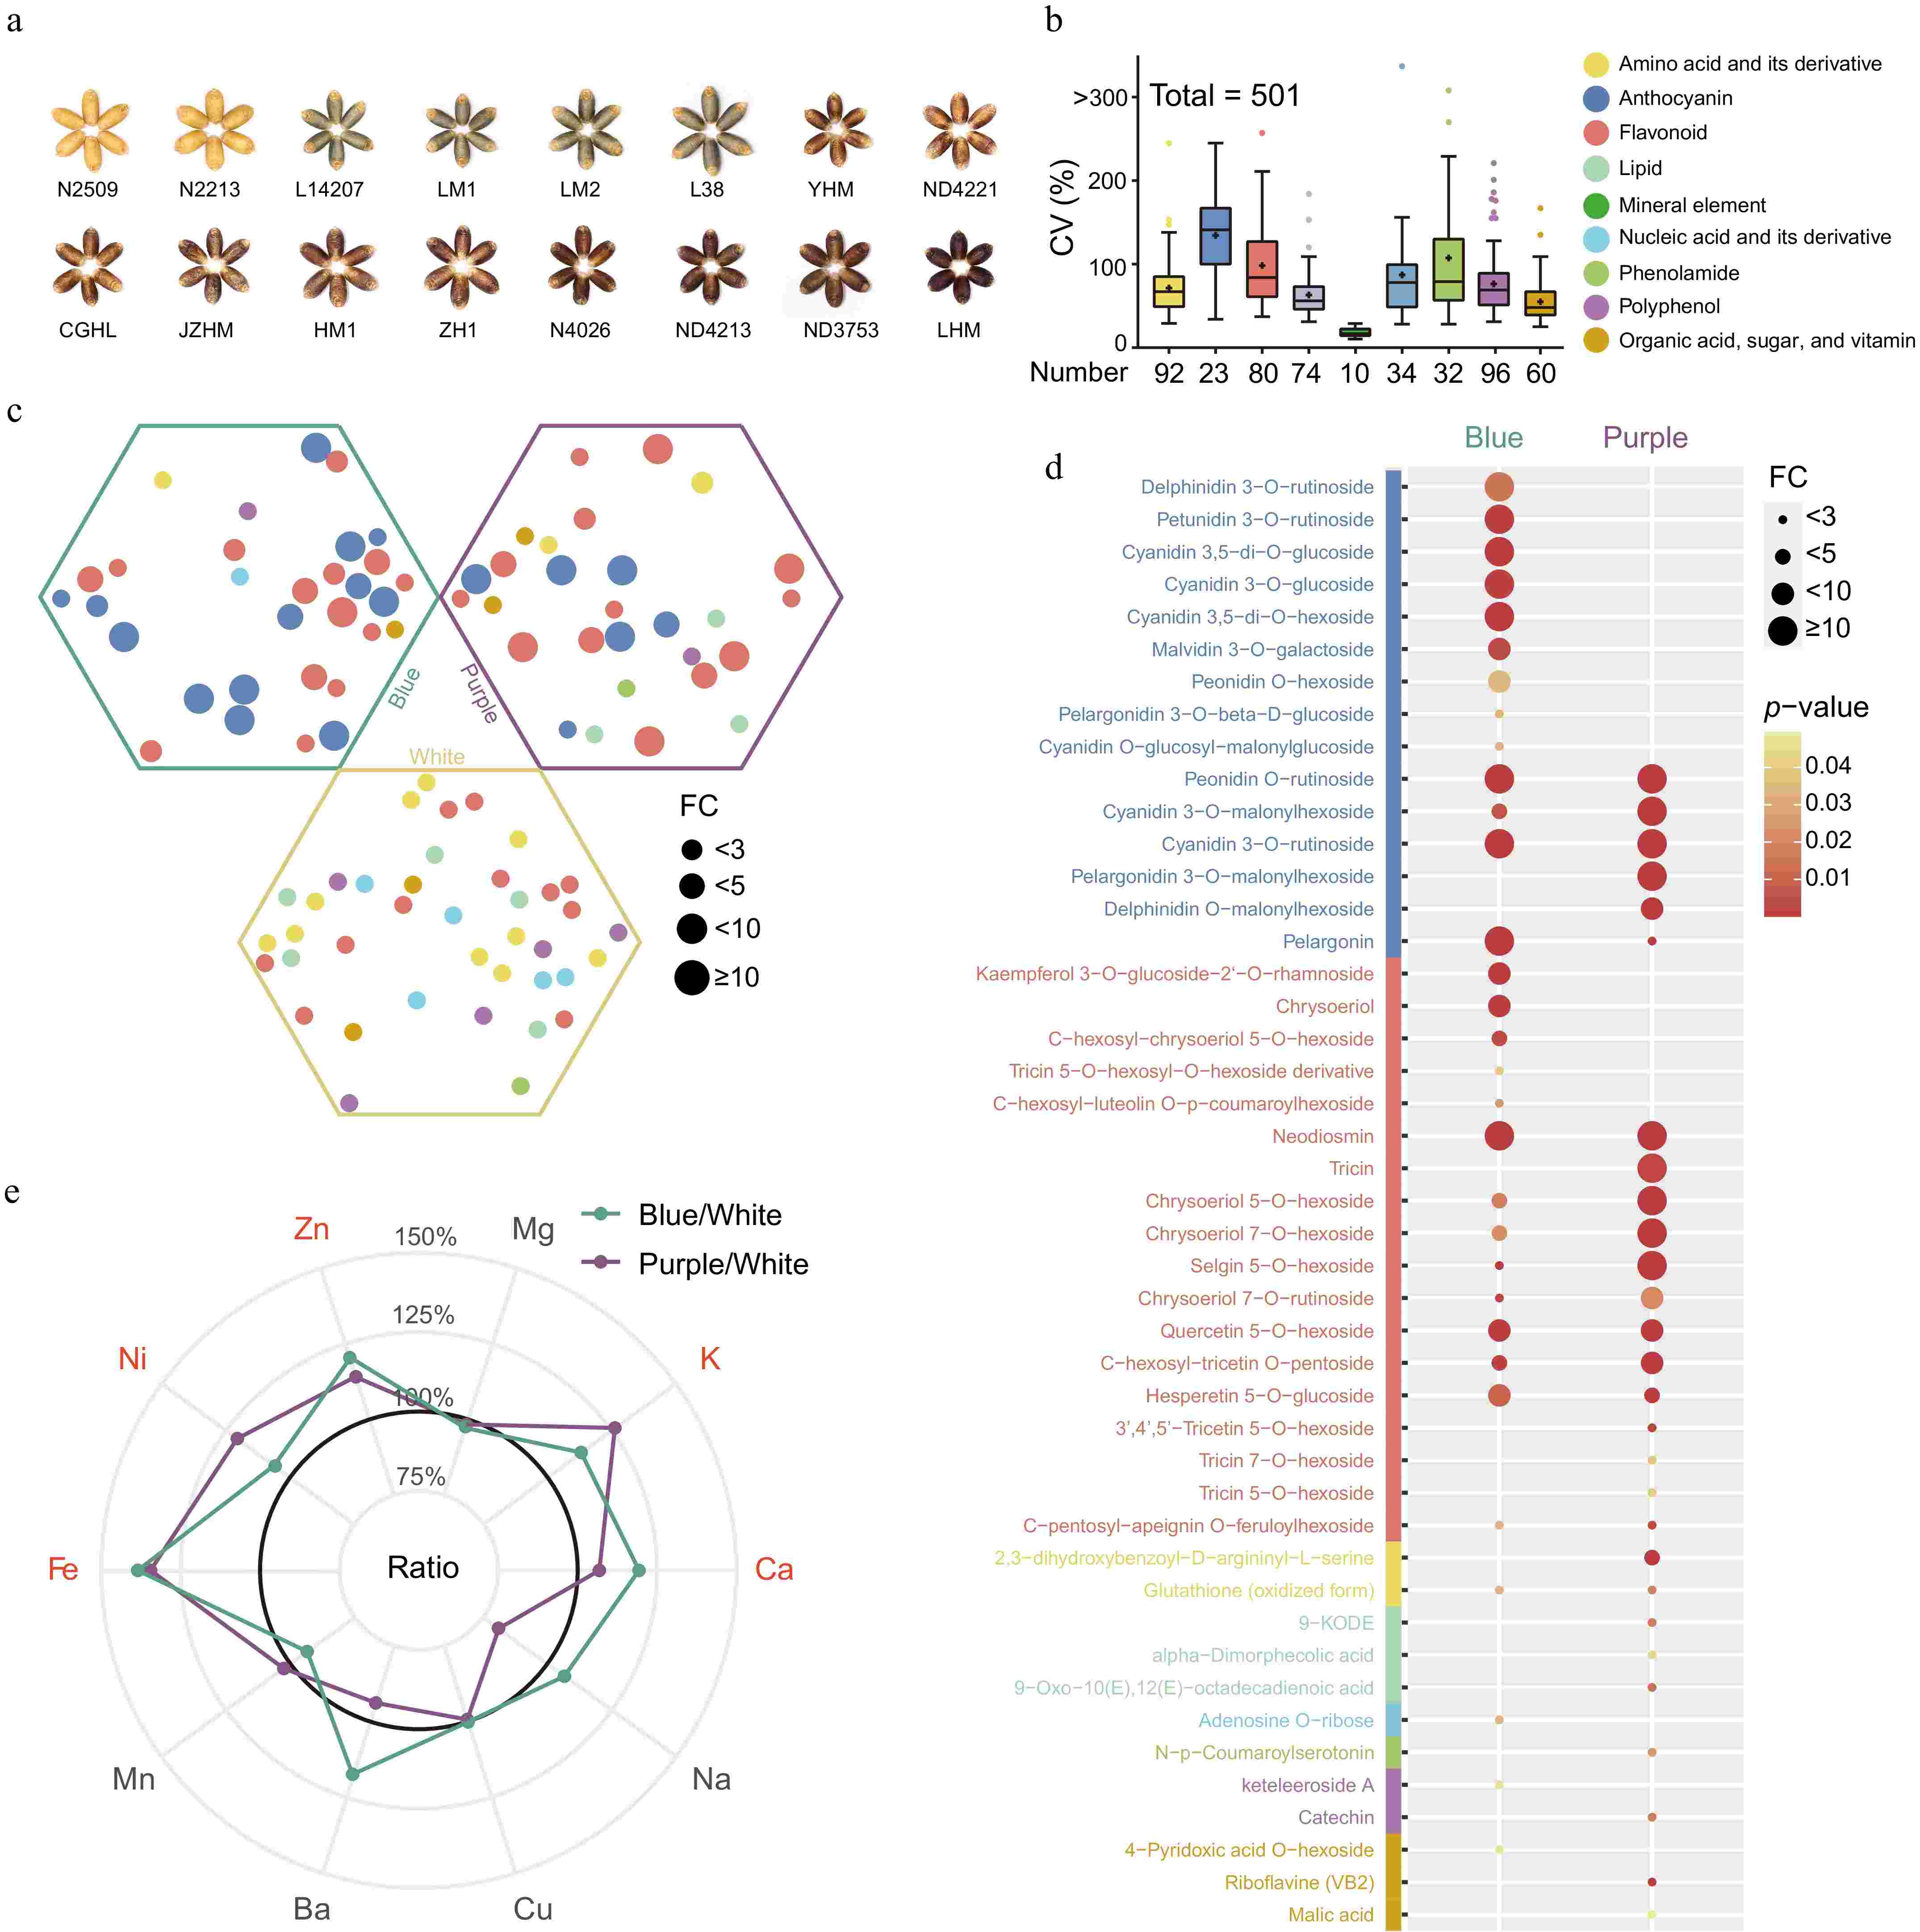
Figure 1.
(a) The mature grains of 16 different color wheat varieties were used in this study. (b) Representation of nutrient class, quantity of each class, and the associated coefficient of variation (CV) distribution. + represents the average CV of these nutrients. Colors represent the classification of the corresponding nutrient. (c) Differential nutrients rich in mature wheat grains of three colors. Statistical significance determined by Student's t-test (p-value < 0.05). The hexagons represent the nutrients rich in the corresponding wheat varieties. Different colors labelled as in Fig. 1b. (d) Detailed information on nutrients rich in colored wheat. (e) Comparison of ten mineral elements in mature colored wheat grains with white wheat. The mineral elements marked in red represent that colored wheat concentration were higher than white wheat.
To underscore the nutritional value of wheat varieties with different colors, we computed the fold change in nutrient content relative to white wheat (Fig. 1c; Supplementary Table S3). Our findings revealed that colored wheat varieties were notably enriched with two categories of health-promoting nutrients: anthocyanins and flavonoids, predominantly in the O-glycosylated form. However, the specific types and concentrations of these compounds varied between the blue and purple wheat (Supplementary Table S3). Blue wheat predominantly contained glycosylated anthocyanins such as delphinidin, petunidin, malvidin, and cyanidin glycosides, while purple wheat had a higher content of acylated anthocyanins (Fig. 1d). Given that compounds like delphinidin, petunidin, and malvidin have been associated with the blue hue in grains according to prior studies[25], it was determined that the distinctive blue and purple colors of wheat grains are due to the differential accumulation of anthocyanins. Future grain color enhancement could be achieved by manipulating anthocyanin composition. The diversity in anthocyanin composition and levels observed in differently colored wheat can be attributed to factors such as genetic variance, growing conditions, and extraction methodologies. Consequently, our results both align with and diverge from previous research on anthocyanins in colored wheat[28−30]. Regarding flavonoids, purple wheat was particularly enriched in glycosylated chrysoeriol, tricetin, and tricin, while blue wheat had a higher abundance of flavanone (hesperetin 5-O-glucoside) and flavonol (kaempferol 3-O-glucoside-2'-O-rhamnoside) (Fig. 1d). Additionally, colored wheat demonstrated elevated levels of B vitamins (riboflavin and 4-pyridoxic acid O-hexoside) and glutathione (Fig. 1d), which are recognized for their roles in reducing the risk of neurological disorders and cancer[13,38] and acting as potent scavengers of free radicals and reactive oxygen species[39], respectively.
In the white wheat variant selected for our study, we observed an abundance of several amino acids, notably lysine, which is indicated in Supplementary Table S3. The enhancement of lysine content is a key objective in wheat breeding, given its status as the primary limiting essential amino acid in cereal nutritional quality and balance[40]. In addition, a significant accumulation of acylated flavonoids was detected in the white wheat (Fig. 1c; Supplementary Table S3). Diets low in total purines, particularly those comprising primarily adenine and guanine, are deemed advantageous for patients with hyperuricemia or gout[41]. Our findings revealed a notable concentration of these two purines in white wheat, which could prove beneficial for specialized wheat breeding programs (Fig. 1c; Supplementary Table S3).
Mineral elements are pivotal in orchestrating metabolic and physiological functions[15]. Our analysis showed that most colored wheat varieties possessed higher levels of essential minerals, including K, Ca, Fe, Ni, and Zn, compared to white wheat (Fig. 1e). Specifically, quantities of Fe and Zn in colored wheat measured at 40.1 mg/kg and 38.9 mg/kg, respectively, reflecting increases of 36% and 16% over those found in white wheat (Supplementary Table S2). The elevated nutritional merits of colored wheat may be attributed to its substantial nutrient content, reinforcing its potential as a valuable food source to enhance human health.
Dynamics of nutrient accumulation across developmental stages in colored wheat
-
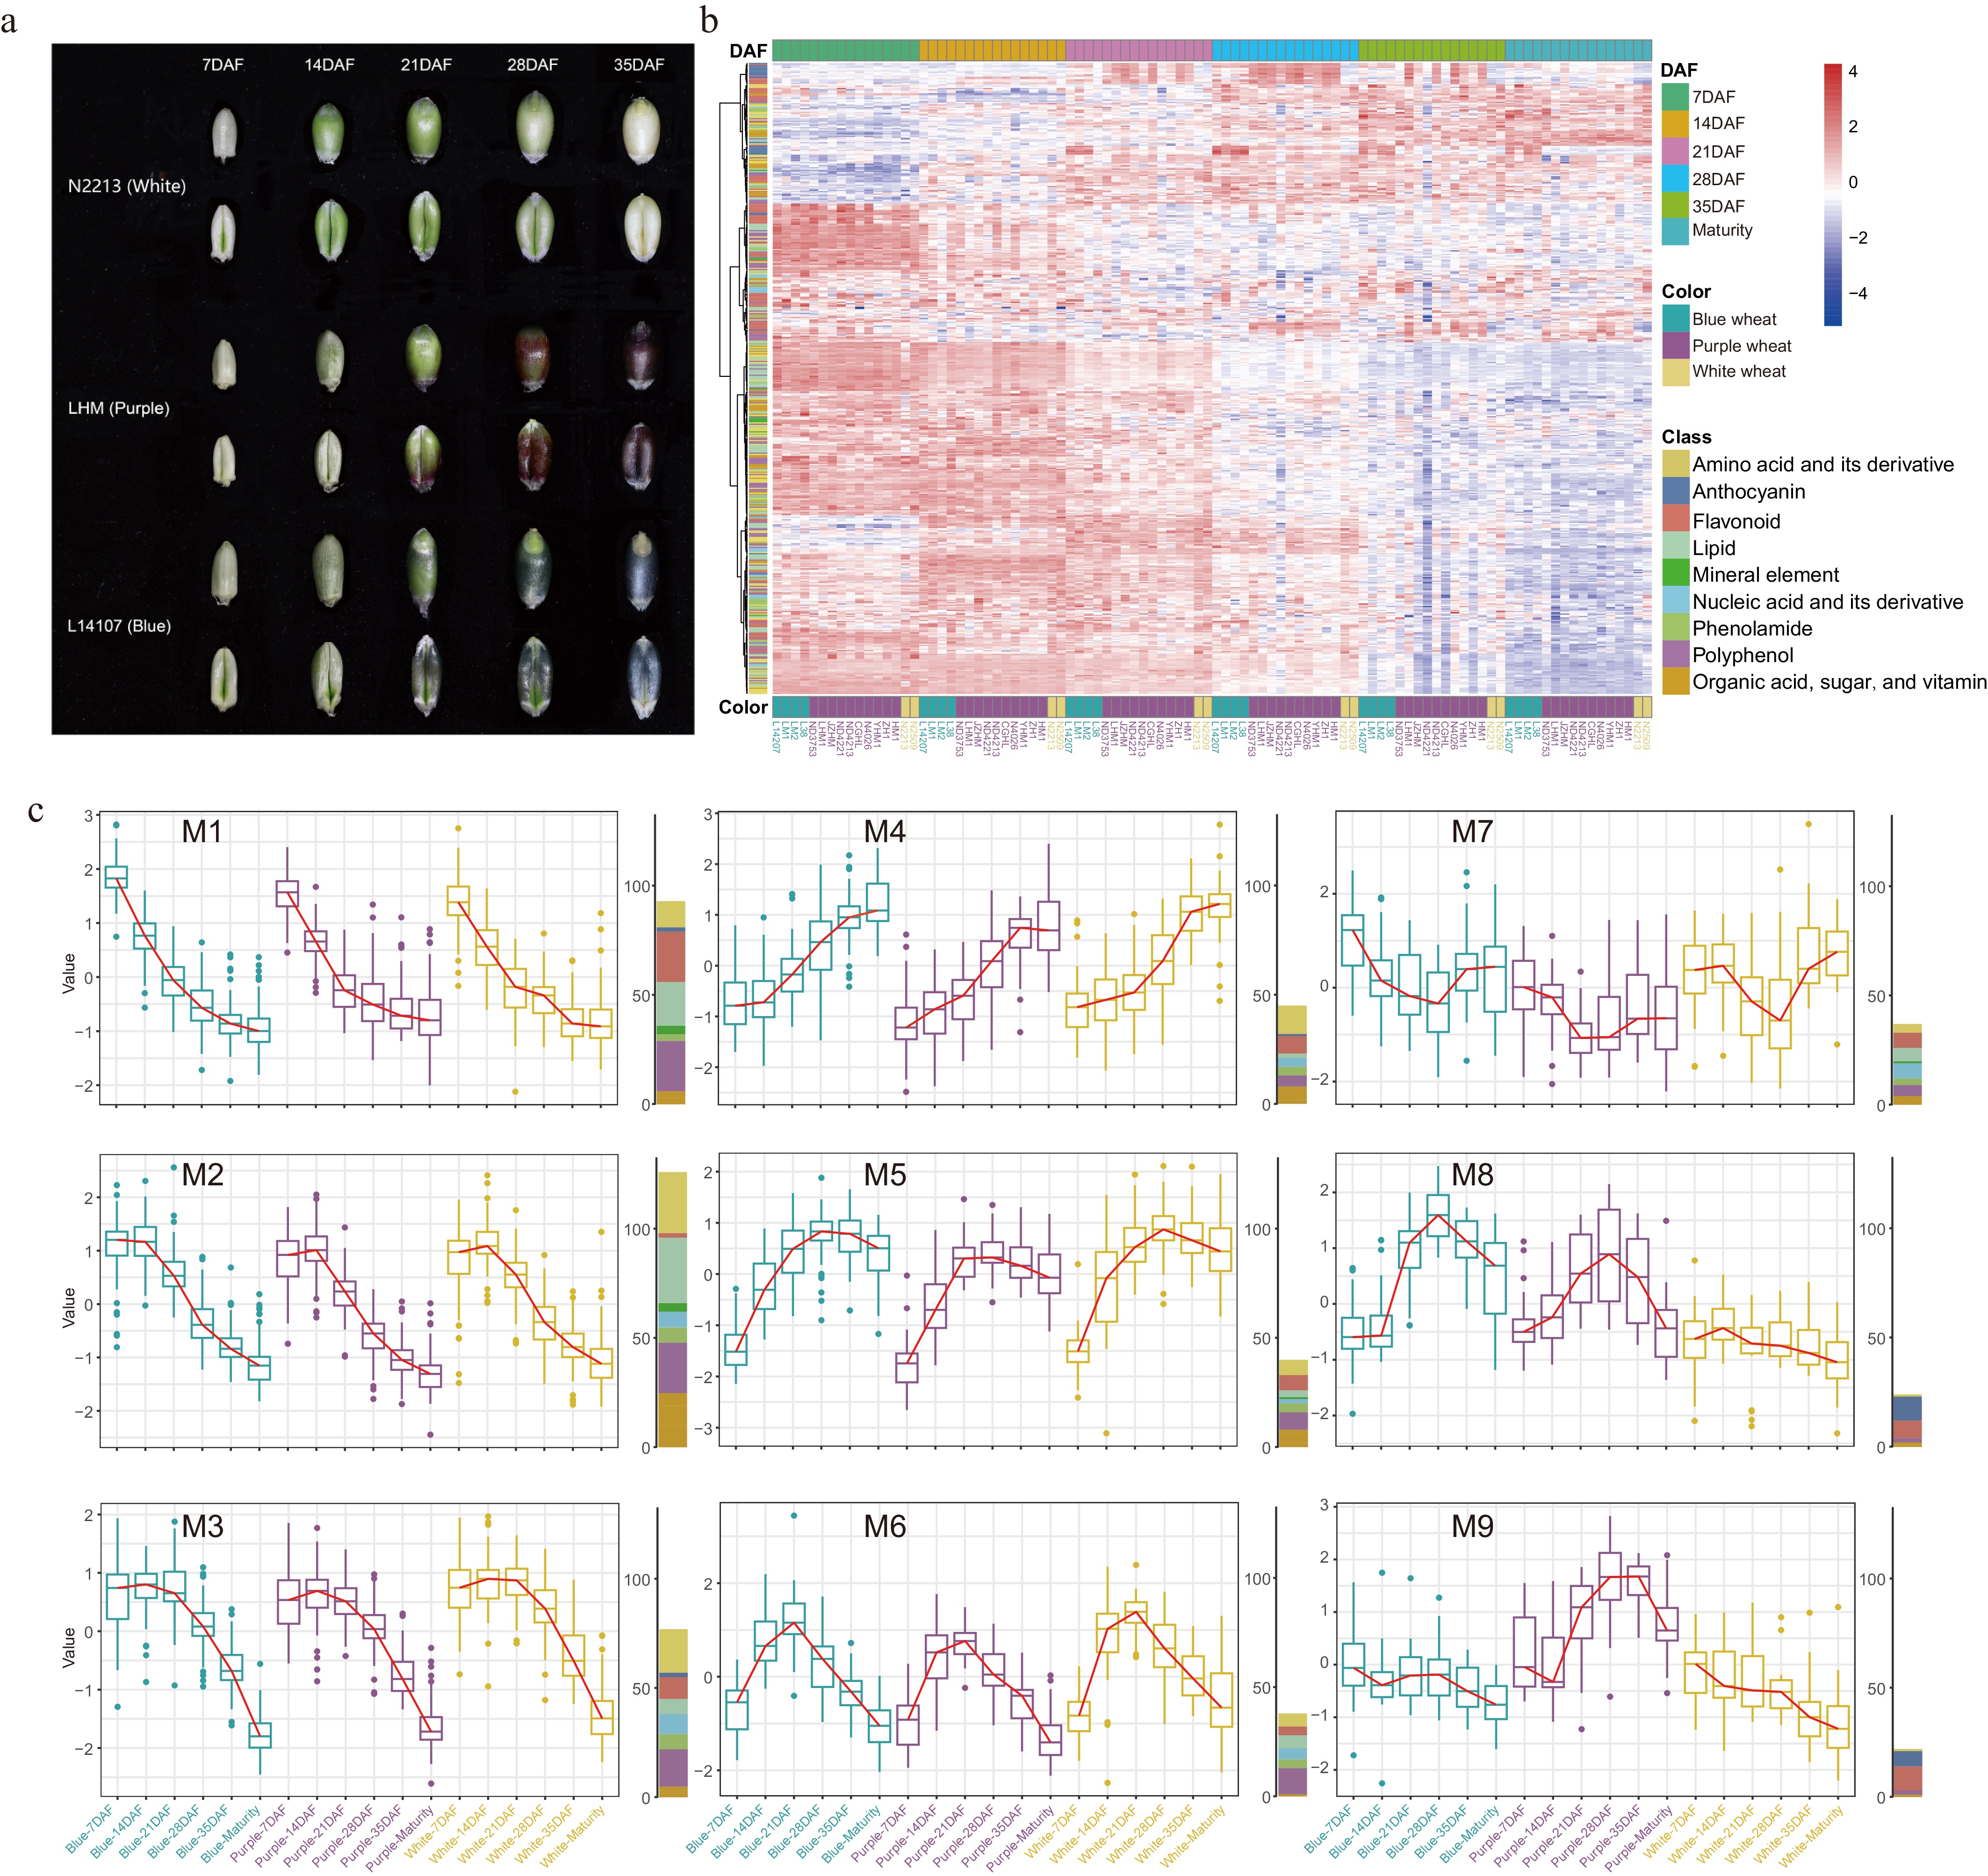
This investigation focused on six key developmental stages - 7, 14, 21, 28, and 35 d after flowering (DAF), and maturity to systematically chart the nutrient accumulation trajectory during wheat grain maturation and to elucidate the underlying mechanisms governing grain coloration and nutritional quality. As illustrated in Figs 1a & 2a, the pigmentation of colored wheat grains became noticeable at 21DAF, with the intensity of color deepening progressively, though it faded slightly during the later filling phase and at maturity. Hierarchical clustering of nutrient content across different grain-filling stages showed that in both colored and white wheat, nutrient levels were elevated at early grain filling (7 and 14DAF), except for anthocyanins (Fig. 2b). From 21DAF onward, while the levels of most nutrients started to wane, anthocyanin accumulation surged. On 28DAF, nutrient contents continued their downtrend yet stayed comparatively high, juxtaposed with a climbing anthocyanin level (Fig. 2b). At 35DAF and maturity, most nutrient concentrations reached their nadir, particularly in mature grains, with anthocyanins also less prevalent than in the two preceding periods (Fig. 2b).

Figure 2.
(a) Changes in grain phenotypes in grain filling stage of wheat with different colors. (b) Hierarchical clustering heatmap of all nutrients among the three wheat varieties during the grain filling and maturity. (c) The nine changing trends in nutrient content in the three colors of wheat during the grain filling and maturity.
On the whole, changes in anthocyanin levels paralleled visual grain color transitions (Fig. 2a, b). Grains in the early stage of filling harbored the highest nutrient density, whereas concentrations were markedly lower in later stages and at full maturity, hinting at the grain filling phase being crucial for the nutritional caliber of the grains, and suggesting that strategic timing of harvest may optimize the nutrient yield. The decline of most nutrients could be attributed to an increase in starch content, which demands more metabolic energy and cellular space[18,42]. Concurrently, some bioactive nutrients might undergo conversion to more inactive storage states or be degraded. Regarding anthocyanins, their relevance to plants often ties to coping with environmental stress[4,43]. In the primary stages of seed expansion, crops prioritize swift growth; anthocyanins are synthesized both as a response to complex environmental settings and to support continued growth in the intermediate stage. Following maturation, as grains desiccate and harden, their environmental resilience increases, reflected by a diminution in anthocyanin concentration.
K-means clustering analysis was employed to elucidate the intricacies of nutrient accumulation throughout the grain-filling process. The trends observed in wheat grain nutrient dynamics up to maturity were categorized into nine distinct patterns (Fig. 2c; Supplementary Fig. S1). Although most nutrients demonstrated akin trajectories across wheat varieties of different colors, unique patterns were also noted (Fig. 2c). Roughly two-thirds of all assessed nutrients, primarily clustered in modalities M1, M2, and M3, revealed a tendency to decrease progressively during grain development, reaching their lowest concentrations at maturity (Fig. 2c; Supplementary Table S4). The demarcation among these three groups lay in the timing of decline: M1 nutrients diminished swiftly with the onset of grain filling, whereas the decrease in M2 and M3 nutrients began at 14DAF and 21DAF, respectively (Fig. 2c). This distribution encompassed more than 60% of the mineral elements and diversified classes like amino acids and derivatives (encompassing sundry free amino acids), lipids, organic acids, polyphenols (inclusive of numerous hydroxycinnamic acid derivatives), and vitamins (particularly those in the B and E groups). Furthermore, nearly half of the flavonoids (mainly tricin and apigenin derivatives), phenolamides, nucleobases and derivatives, and carbohydrates (such as various monosaccharides) were represented in these patterns (Fig. 2c; Supplementary Table S4).
Conversely, nutrient types in patterns M4 and M5 behaved differently: M4 nutrients gradually amassed as grains matured, while M5 nutrients surged between 7DAF and 28DAF before slightly declining; however, nutrients at maturity still surpassed those in the early stages. Among these were 20 amino acids and their derivatives (including six tryptophan derivatives), 15 flavonoids (principally C-flavonoids), 13 polyphenols, and ten carbohydrates (mostly disaccharides and trisaccharides) (Fig. 2c and Supplementary Table S4). Iron's inclusion in M5 is particularly notable as early grain filling involves extensive cell division, and iron's contribution to DNA synthesis, transcription, and energy production remains crucial[44]. The augmentation of disaccharides and trisaccharides concomitantly explains the reduction in monosaccharides. M6 and M7 presented reciprocal nutrient trends, with a preliminary decline followed by a rise in M6 and an initial ascent then a descent in M7 (Fig. 2c). Although divergent, both patterns concluded with mature colored grain nutrients lower than those in their early stages, while levels in white wheat approximately held constant.
Predominantly anthocyanins populated M8 and M9. M8 comprised 11 anthocyanins (48% of the total, predominantly glycosylated forms) and eight flavonoids (Fig. 2c; Supplementary Table S4). Both blue and purple wheat shared a trend of rapid increase from 14DAF to 28DAF, followed by a continuous decline approaching maturity (Fig. 2c). Due to its negligible anthocyanin content, white wheat showed little variation. Blue wheat retained a greater abundance of these anthocyanins throughout grain filling compared to purple wheat, which may also elucidate the glycosylated anthocyanin wealth in mature blue wheat grains (Supplementary Table S4). M9 mainly consisted of acylated anthocyanins, less prevalent in blue and white wheat but marked by a trend similar to M8 in purple wheat (Fig. 2c), enriching mature purple wheat grains. Despite the general trend of nutrient diminution during grain development, several exhibited discordant accumulation behaviors, highlighting a multifaceted web of regulatory mechanisms governing nutrient dynamics in wheat grains.
Accumulation patterns of nutrients at different stages determine the nutritional characteristics of colored wheat
-
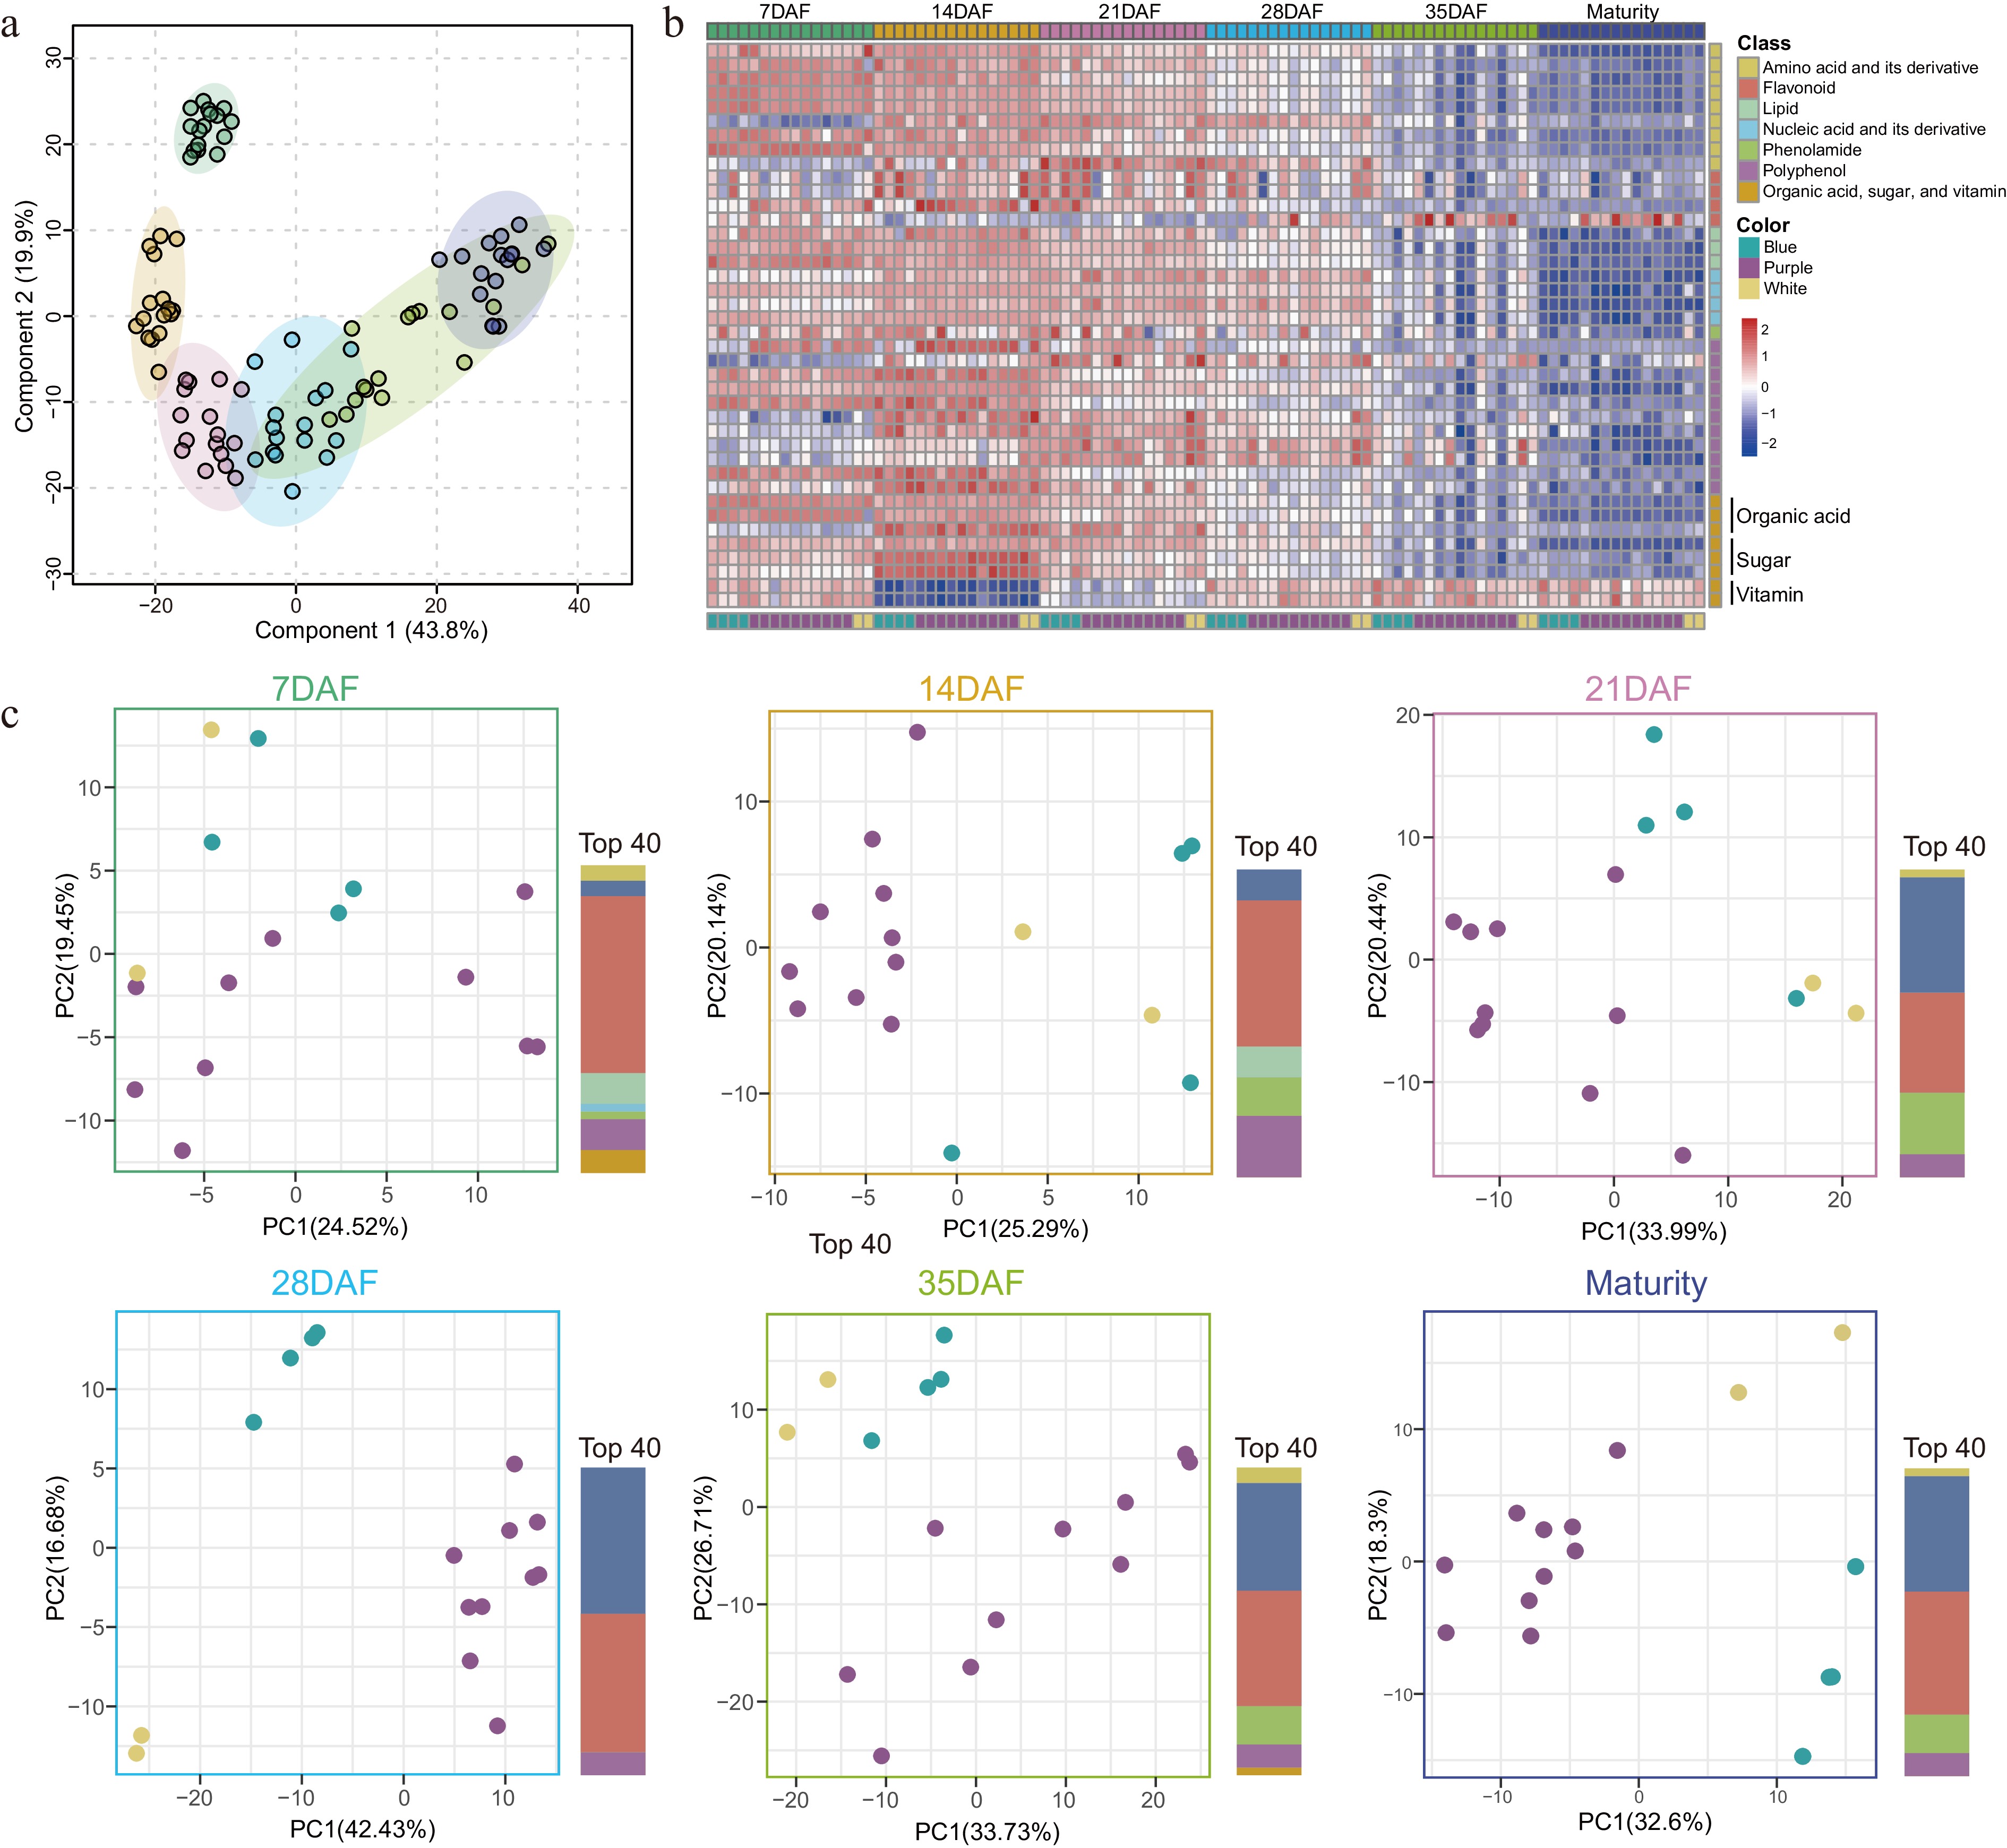
We further performed partial least squares discriminant analysis (PLS-DA) to pinpoint the defining nutrients that differentiate the six stages encompassing grain filling and maturity. Analysis unveiled that the primary principal components, PC1 and PC2, accounted for 63.7% of the total variance, clearly segregating the earliest stages (7DAF and 14DAF) from subsequent intervals (Fig. 3a). Nutrients pivotal in stage discrimination were further detailed by examining PLS-DA loadings, with the top 40 discriminators predominantly being polyphenols (11) and amino acids (9) (Supplementary Table S5). Heatmaps visualized the varied stages' nutrient accumulation, showcasing a majority on a downward trajectory from initial filling to maturation, primarily categorized within modalities M1, M2, and M6 (Fig. 3b). Notably, two vitamin forms (beta tocotrienol and gamma tocotrienol) peaked at maturation as opposed to earlier and middle filling phases (Fig. 3b). Furthermore, a unique flavonoid (mr1205, tricin 4'-O-(syringyl alcohol) ether) amassed predominantly in middle and late filling stages and at maturation in purple wheat, but remained scant in blue and white wheat (Fig. 3b; Supplementary Table S5). These findings highlight that the discernible differences in wheat grains across development predominantly stem from shifts in the levels of polyphenols, amino acids, and their derivatives. Amino acids, portending shifts in protein composition throughout grain growth, impact protein synthesis and energy metabolism[45]. Polyphenols, with their potent antioxidant capabilities, are closely tied to environmental adaptability and resistance[46]. Beyond discriminating development stages, the flavonoid tricin 4'-O-(syringyl alcohol)ether is instrumental in differentiating purple wheat from the other two germplasm types.

Figure 3.
(a) Partial least squares discriminant analysis (PLS-DA) of the nutrients detected in samples of each of the six stages of all wheat varieties. The data have been normalized and represent the mean values obtained from three biological replicates of each sample. (b) The accumulation levels of the top 40 contributors identified in PLS-DA in different varieties as well as during the grain filling and maturity. (c) Perform PCA analysis on grains at six stages during grain filling and maturity. The histogram on the right represents the number and class of top 40 contributors. The colors used in (a) correspond to the six stages during grain filling and maturity color labels in (b) and (c).
Subsequent principal component analysis (PCA) for each identified filling period (Fig. 3c) revealed that wheat varieties across the spectrum of colors were indistinguishable during the initial stages (7DAF and 14DAF) (Fig. 3c). Varietal delineation started to emerge at 21DAF, save for a late-developing blue wheat variety (L38) resembling white wheat (Figs 2b, 3c). From 28DAF through to maturity, the three colored wheat types were distinctly separated (Fig. 3c), perhaps reflecting post-28DAF grain pigmentation differences, and underscoring the precision of PCA in detecting varietal divergence throughout grain development. The dominant 40 contributors at early stages were flavonoids; from 21DAF onward, however, anthocyanins became increasingly represented (Fig. 3c; Supplementary Table S6), consistant with the timing of grain color emergence. In essence, these anthocyanins and flavonoids represent the signature nutrients that demarcate various colored wheat varieties across the spectrum of grain filling and maturation.
Green wheat kernel possesses greater nutritional value than mature wheat
-
Previous studies have demonstrated that nutrient accumulation chiefly occurs early in the grain-filling phase, yet the grains at this juncture-filled with a milky white paste—are not suitable for consumption. Grains in the mid-filling stages (21−28DAF), which are in the dough stage featuring plump kernels and heightened nutritional content, are optimal for development as health-oriented food products and are colloquially referred to as green wheat kernels[47,48]. To further underline the nutritional disparity between green wheat kernels and mature grains, we employed orthogonal partial least squares discriminant analysis (oPLS-DA) to juxtapose the nutrient data from the middle filling stage with the maturity phase. This analysis showcased a stark differentiation between the two categories (Fig. 4a), and the model's robustness was confirmed with a high degree of fit, as evidenced by a permutation test performed one hundred times (p < 0.01) (Supplementary Fig. S2). Green wheat kernels boasted a rich nutrient profile, outclassing mature grains in over 200 nutritive compounds (highlighted by red dots in the upper right sector), encompassing a comprehensive range of nutrient types with a particular abundance in polyphenols, amino acids (and their derivatives), lipids, 15 phenolamides, nine vitamins, and seven organic acids (Fig. 4b & c; Supplementary Table S7). Despite the limited number of anthocyanins detected—owing to the stark contrast in anthocyanin content between colored and white wheat, along with significant variance within groups—colored wheat reached peak anthocyanin levels during mid-filling (Fig. 2c; Supplementary Table S2). Contrarily, mature grains possessed a higher concentration of just over ten nutrients (red dots, lower left sector) (Fig. 4b). To cast a spotlight on the nutritional virtues of green wheat kernels, we delineated the three colored wheat varieties and produced volcanic plots, emphasizing nutrients with significant fold changes (|log2FC| > 1) and statistical relevance (−log10p-value > 1.3) (Supplementary Fig. S3). Given the modest variances in mineral element concentrations, a p-value of less than 0.05 (-log10p-value > 1.3) was employed as the threshold for this analysis. All three green wheat kernel variants were enriched with amino acids, flavonoids, lipids, polyphenols, and minerals, in addition to anthocyanins characteristic of colored wheat (Supplementary Fig. S3 & Supplementary Table S8). These nutritive elements are commonly localized in wheat bran—a portion typically shed during flour refinement, hence contributing to nutritional depletion[49]. In stark contrast, green wheat kernels can maintain their nutritive integrity thanks to low-temperature freezing methods coupled with whole-grain processing techniques[50]. In conclusion, green wheat kernels represent a healthful food alternative, with those derived from colored wheat varieties bringing forth additional economic value due to their enriched nutrient composition.
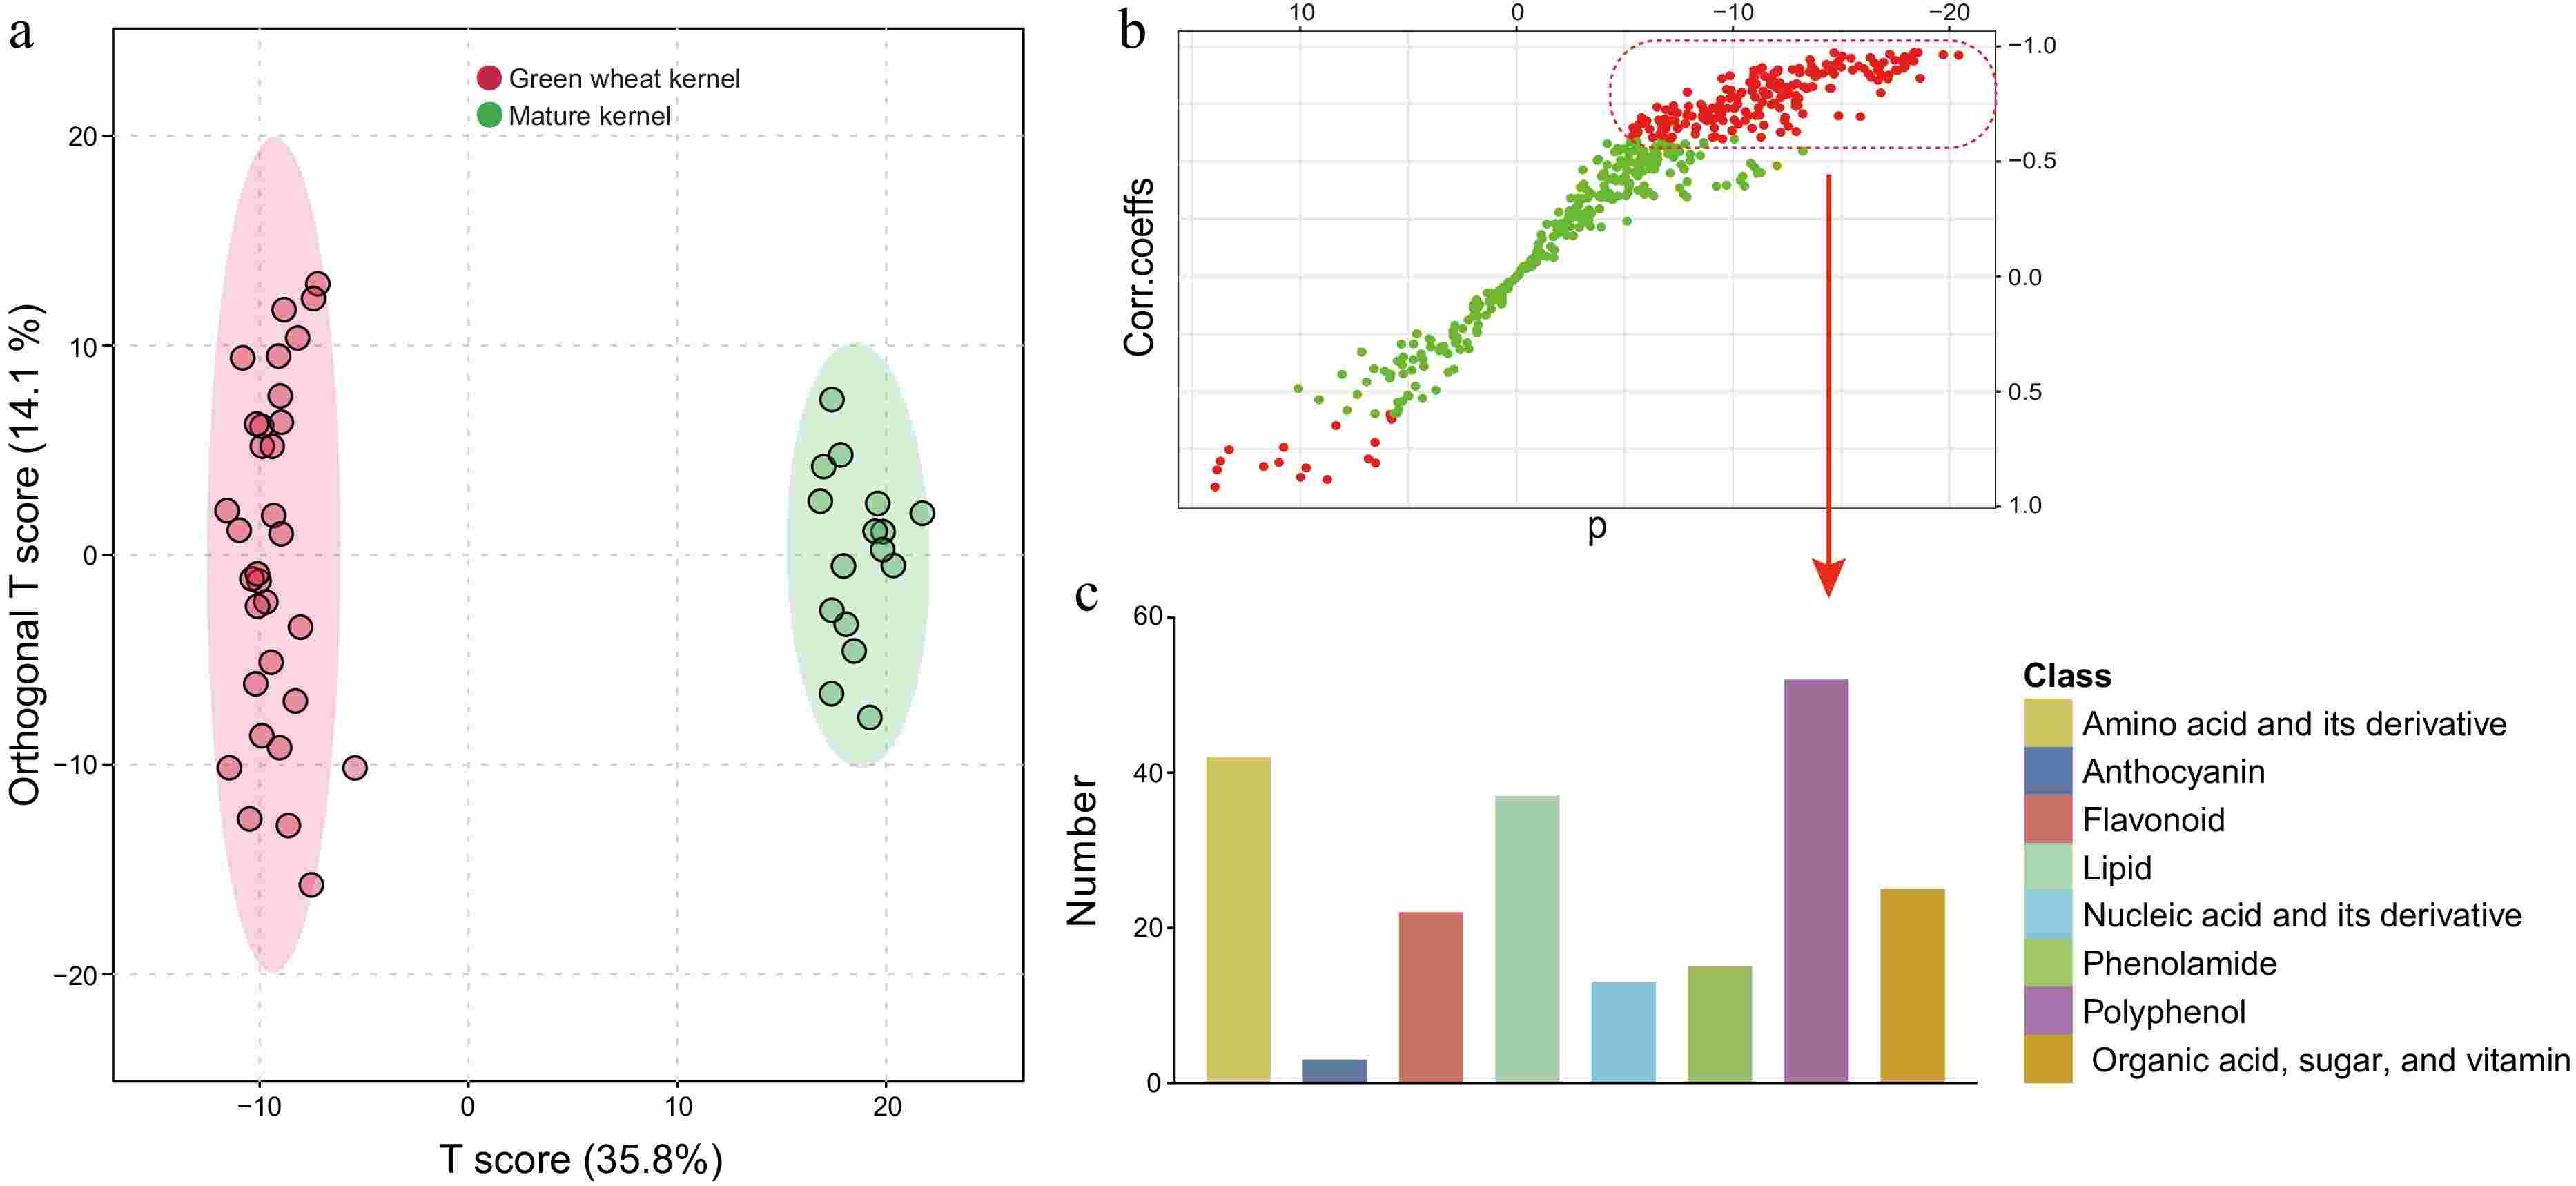
Figure 4.
(a) An orthogonal partial least-squares discriminant analysis (oPLS-DA) score plot of a comparison between the green wheat kernel group and the mature grain group. (b) A corresponding S-plot. The model was validated (Q2 = 0.973, R2Y = 0.99), and the data used in B were Pareto-standardized from the raw data (Supplementary Fig. S2). Variables with VIP (variable importance in the projection) > 1.0 are highlighted in red. (c) The classes and corresponding numbers of nutrients are within the red dashed box.
Transcriptome analysis identifies potential candidate genes and network for anthocyanins
-
Blue and purple wheat grains, initially colorless at 14DAF, began to show their characteristic hues at 21DAF, which may be attributed to the elevated expression of genes related to the anthocyanin biosynthesis. Subsequently, we selected wheat grains from these two distinct stages, 14DAF and 21DAF, for transcriptome sequencing to identify genes responsible for the onset of pigmentation. The sequencing aimed to delve into the underlying molecular mechanisms driving color development in wheat grains at different developmental stages. Transcriptome data quality and parameters are detailed in Supplementary Table S9. Principal component analysis (PCA) of all gene expression levels demonstrated a distinct clustering of the samples, with PC1 and PC2 accounting for 29% and 15% of the total variance, respectively (Supplementary Fig. S4a). The correlation analysis of the transcriptome data across three biological replicates is depicted in Supplementary Fig. S4b.
Based on their expression profiles during the developmental stages, the genes fell into two main clusters: Cluster I, with genes upregulated at the onset of pigmentation (21DAF), and Cluster II, with genes active during the grain filling stage (14DAF) (Supplementary Fig. S4c). To explore the gene expression dynamics in the two-colored wheat varieties, we compared their differentially expressed genes (DEGs) at both developmental stages. In total, we identified 19,906 DEGs (Supplementary Fig. S5a & b; Supplementary Table S10), predominantly concentrated in the phenylpropanoid (Ko00940), flavonoid (Ko00941), and anthocyanin (Ko00942) biosynthesis pathways in KEGG (Supplementary Fig. S6). Similarly, we identified 125 differentially accumulated nutrients (DANs) using an approach paralleling the transcriptome analysis (Supplementary Fig. S5c & Supplementary Table S11), with the bulk consisting of flavonoids and anthocyanins, congruent with the enriched KEGG pathways (Supplementary Table S11). These findings suggest that the identified genes are closely associated with the synthesis of phenylpropanoids, flavonoids, and anthocyanins during the wheat grain development stages.
To assess the interplay between nutrient accumulation and gene expression patterns, we utilized K-means clustering analysis on differentially expressed genes (DEGs) and differentially accumulated nutrients (DANs). The anthocyanins found in Cluster 1 aligned with those observed in purple wheat as depicted in Fig. 2c, and gene expression within this cluster peaked at the 21DAF stage for purple wheat (Supplementary Fig. S7a & Supplementary Table S12). A similar expression pattern emerged in Cluster 2, with anthocyanins corresponding to those in blue wheat and their highest gene expression levels at the 21DAF stage of blue wheat development (Fig. 2c; Supplementary Fig. S7a & Supplementary Table S12). A linkage between changes in gene expression and shifts in metabolite profiles during the grain developmental stages was observed (Supplementary Fig. S7a), suggesting that genes in Clusters I and II may underlie the pigmentation of purple and blue wheat grains, respectively.
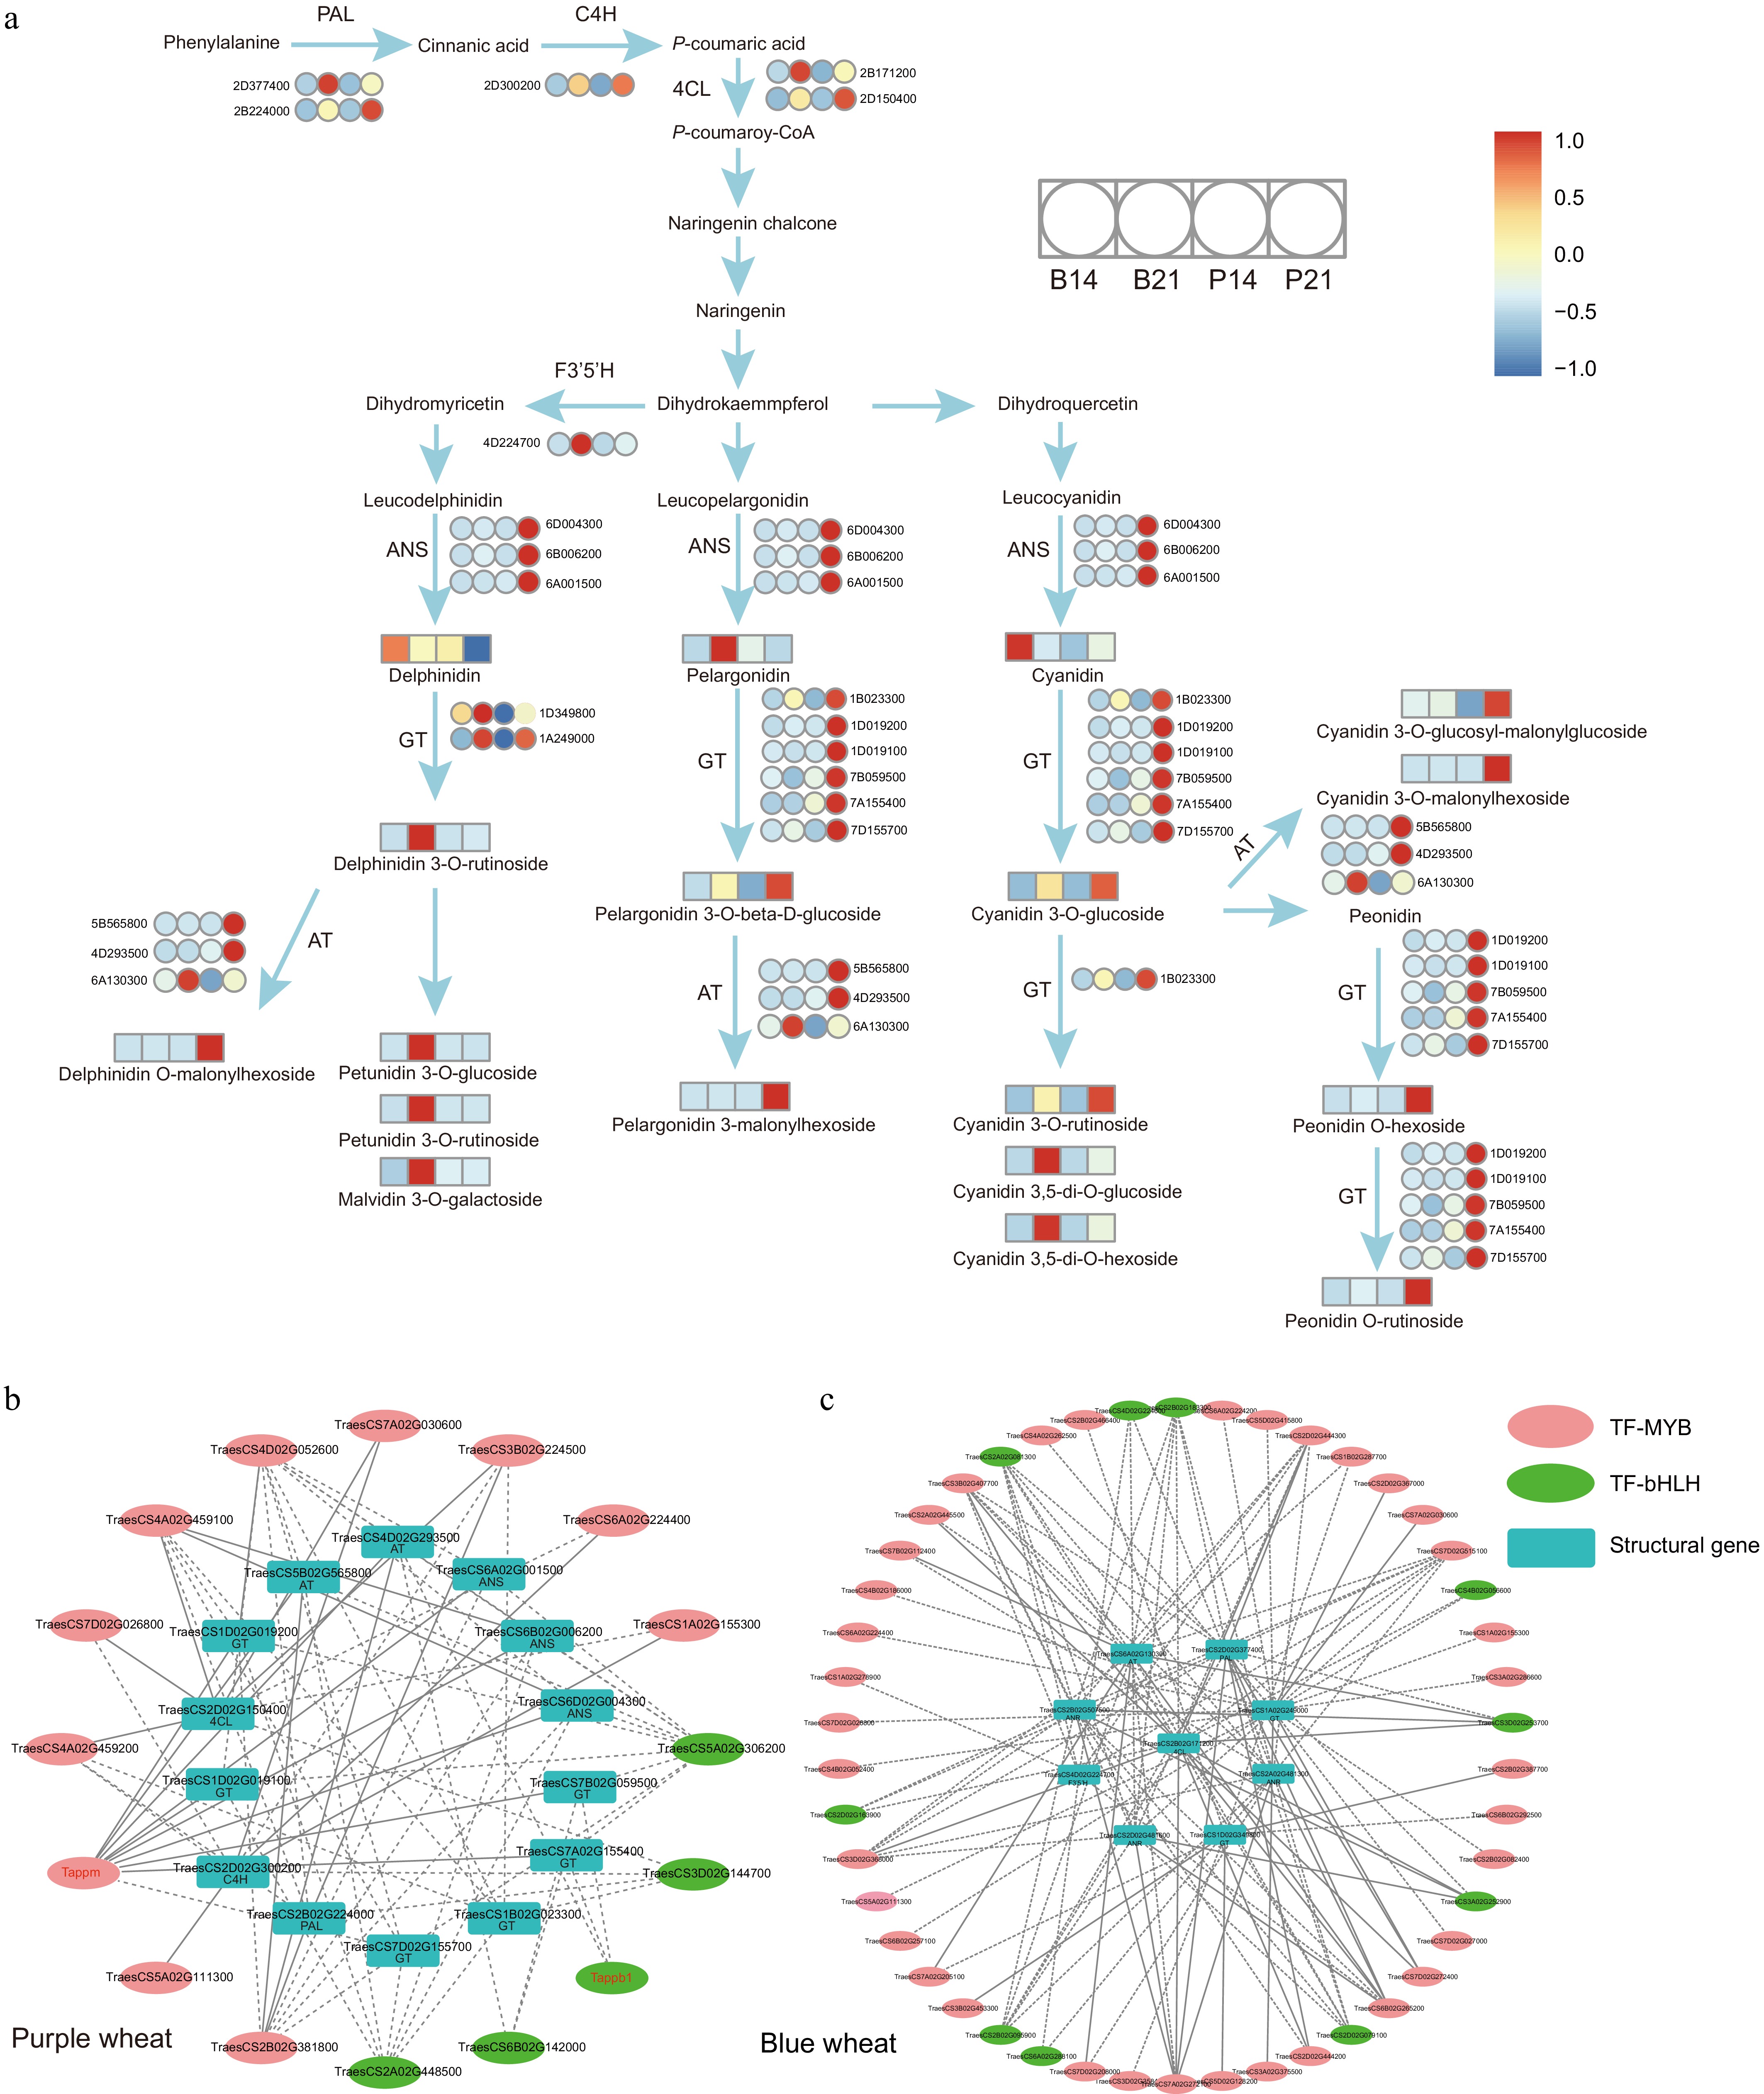
We then extracted anthocyanins from Clusters 1 and 2 and undertook correlation analyses on structural genes situated within the phenylpropanoid, flavonoid, and anthocyanin biosynthesis pathways. Fourteen candidate genes were pinpointed in Cluster 1 and seven in Cluster 2 (Supplementary Fig. S7b & Supplementary Table S13). These genes demonstrated pronounced upregulation in the P21 and B21 datasets and displayed a significant correlation with anthocyanin levels (r > 0.9, p-value < 0.05) (Supplementary Fig. S7b & Supplementary Table S13), identifying them as crucial for anthocyanin synthesis. The proposed network for wheat anthocyanin metabolism is illustrated in Fig. 5a, highlighting the regulatory role of two transcription factor groups, MYB and bHLH. The co-expression network identified 16 transcription factors in purple wheat, including five bHLHs and 11 MYBs, and 46 in blue wheat, consisting of 36 MYBs and ten bHLHs. Phylogenetic trees verified the evolutionary relationships of MYBs and bHLHs in both blue and purple wheat, showing close connections to counterparts in rice and maize (Supplementary Fig. S8). This confirmation enhances the credibility of our findings. Their expression patterns are closely associated with the identified structural genes (r > 0.95, p-value < 0.05) (Fig. 5b, c; Supplementary Table S14). Quantitative real-time PCR (qRT-PCR) results further corroborated the transcriptional data (Supplementary Fig. S9 & Supplementary Table S15), thereby providing novel insights into the biosynthesis of anthocyanins in colored wheat and offering a comprehensive blueprint of the anthocyanin biosynthesis pathway.
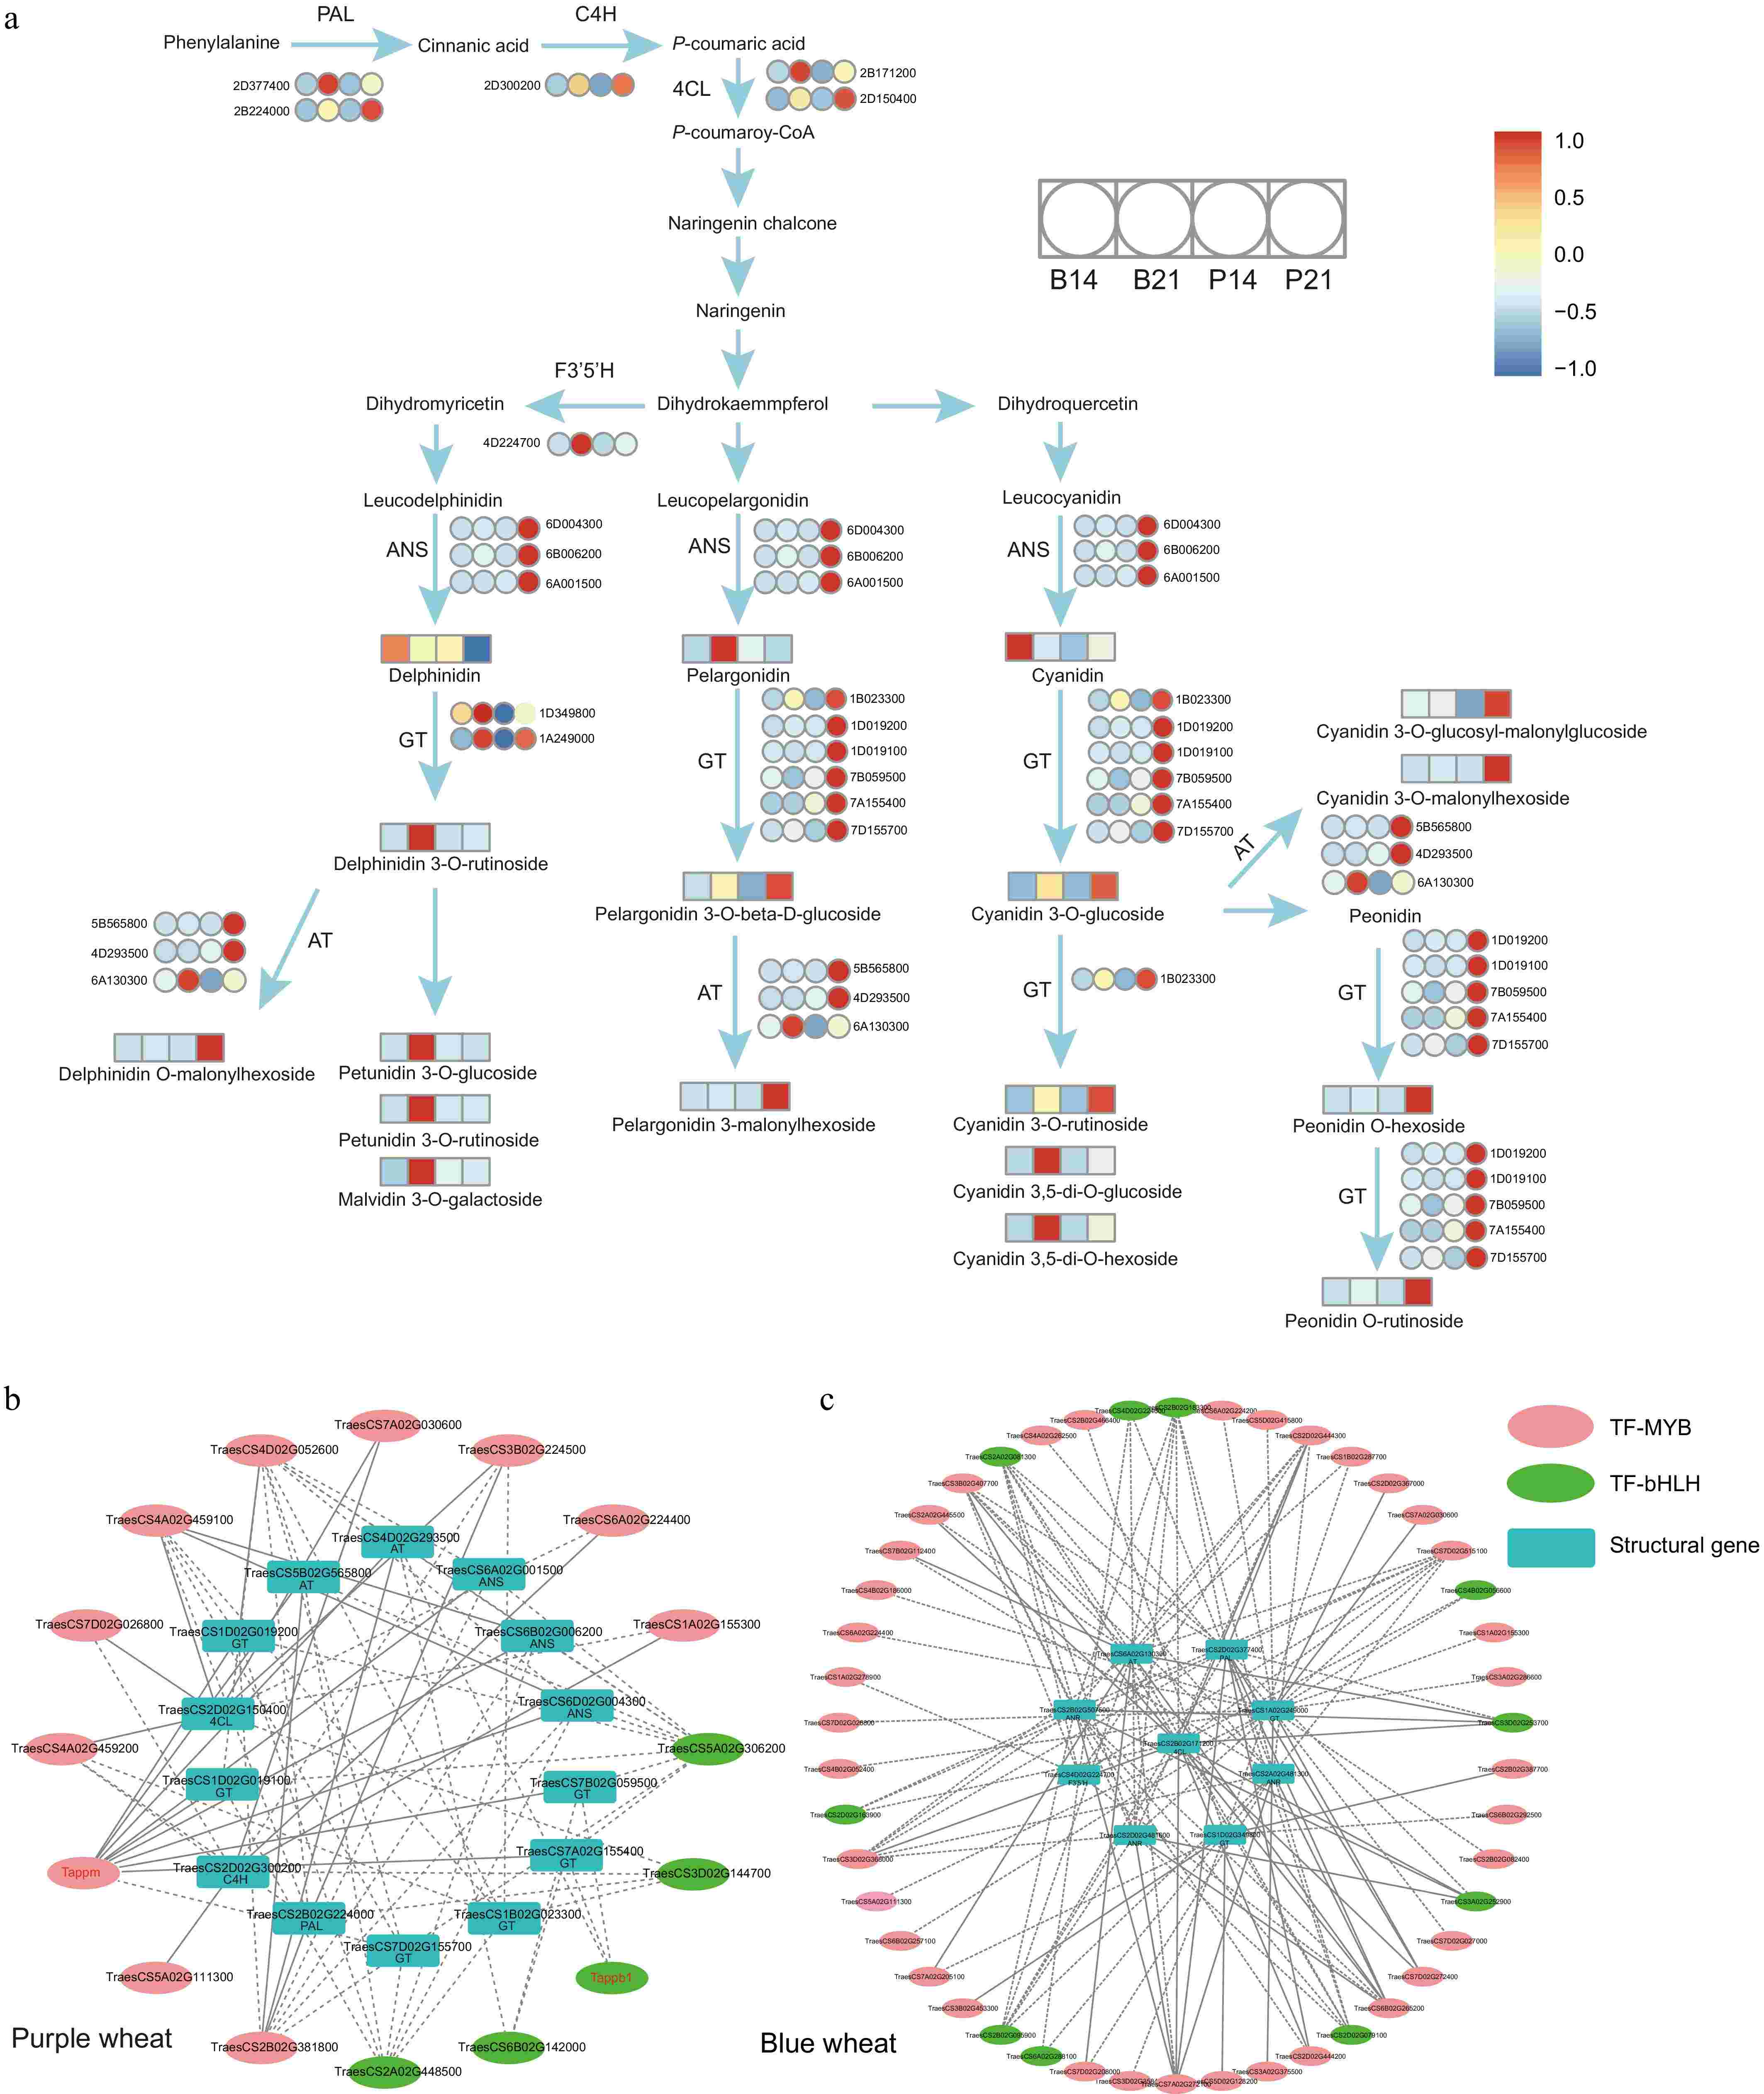
Figure 5.
(a) Proposed anthocyanin biosynthesis pathway in colored wheat grain. The color scale from blue to red in the heatmap indicates the the expression of corresponding genes (or the relative contents of nutrients) ranging from low to high in colored wheat. The full gene/enzyme names and expression level are shown in Supplementary Table S13. (b), (c) Regulatory network between anthocyanin-related genes and transcription factors. Different color ovals represent different types of transcription factors, while rectangles indicated structural genes. A dotted line suggests that transcription factors were significantly correlated with the expression of anthocyanin-related genes. The solid line indicates that the transcription factor binding site exist upstream of the 2KB coding region of the structural gene (TFBS relScore > 0.9, p-value < 0.01, calculated by TFBSTools v1.20.0 R packages). Red font represents genes that have been reported.
-
Through a systematic analysis utilizing multi-omics data, we investigated the dynamic changes in nutrient content in various colored wheat grains at different developmental stages. Our findings revealed that colored wheat has a higher nutritional value compared to white wheat. The majority of nutrients displayed a decrease in content as the grains matured, underscoring the nutritional significance of green wheat kernels. Furthermore, by integrating transcriptome analysis, we identified numerous structural and regulatory genes involved in anthocyanin biosynthesis. Overall, this study has advanced our understanding of nutrient accumulation and anthocyanin biosynthesis in wheat grains, laying a foundation for the cultivation of colored wheat varieties.
The authors thank the high-performance computing platform, and the mass spectrometry platform at the National Key Laboratory of Crop Genetic Improvement at Huazhong Agricultural University. This work was supported by the STI 2030-Major Project (2023ZD04069), the International Science and Technology Cooperation Project of Hubei Province (Grant No. 2023EHA060), the First-Class Discipline Construction Funds of College of Plant Science and Technology, Huazhong Agricultural University (Grant No. 2023ZKPY005) and the National Key Laboratory of Crop Genetic Improvement Self-Research Program (Grant No. ZW22B0206).
-
The authors confirm contribution to the paper as follows: study conception and design: Chen W, Yan W; experiments conducting: Shi T, Zhang Y, Wang X; data analysis: Hu X, Ao M; sample collecting: Li F; manuscript writing and revision: Shi T, Wang X, Chen W. All authors reviewed the results and approved the final version of the manuscript.
-
All data generated or analyzed during this study are included in this published article and its supplementary information files.
-
The authors declare that they have no conflict of interest.
-
# Authors contributed equally: Taotao Shi, Xin Hu, Xinyi Wang
- Supplementary Table S1 Detailed information of nutrients detected by LC-MS.
- Supplementary Table S2 The nutrient content in grains of different wheat varieties during the grain filling and maturity.
- Supplementary Table S3 Nutrients rich in mature wheat grains of different colors (p < 0.05).
- Supplementary Table S4 The cluster of nutrients by K-means analysis.
- Supplementary Table S5 The contribution of nutrients based on PLS-DA analysis.
- Supplementary Table S6 The contribution of nutrients in wheat grain during filling and maturity based on PCA analysis.
- Supplementary Table S7 The VIP score from S-plot compared green wheat kernel with mature kernel.
- Supplementary Table S8 Differential nutrients identified in different comparison groups.
- Supplementary Table S9 Quality statistics of RNA-seq data after filtering.
- Supplementary Table S10 Differentially expressed genes (DEGs) of purple wheat (LHM) and blue wheat (L14207) in 14DAF and 21DAF.
- Supplementary Table S11 Differentially accumulated nutrients (DANs) of purple wheat (LHM) and blue wheat (L14207) in 14DAF and 21DAF (FC > 2, FC < 0.5 and p < 0.05).
- Supplementary Table S12 Cluster of DEGs and DANs by K-means analysis.
- Supplementary Table S13 Differentially expressed genes (DEGs) involved in anthocyanin biosynthesis.
- Supplementary Table S14 A coexpression correlation network of transcription factors (MYB and bHLH) and structural genes within anthocyanin pathway in colored wheat
- Supplementary Table S15 Primers used in the qRT-PCR assay.
- Supplementary Fig. S1 The selection of the optimal number of clusters.
- Supplementary Fig. S2 Model evaluation results of oPLS-DA.
- Supplementary Fig. S3 Volcano plots of the differential nutrients among the comparison groups. Compare green wheat made from three different colored wheat with their corresponding mature grains.
- Supplementary Fig. S4 (a) PCA of transcriptomic data. (b) Correlation analysis among the three replicates of the transcriptome data. (c) Hierarchical clustering heatmap of transcriptome data.
- Supplementary Fig. S5 (a) and (b) Differentially expressed genes (DEGs) during different developmental stages in blue and purple wheat. Colors represent the classification of the DEGs. (c) Differential accumulation of nutrients (DANs) during different developmental stages in blue and purple wheat.
- Supplementary Fig. S6 Top 15 significantly enriched KEGG pathways of DEGs. The y-axis represents the KEGG pathway; the x-axis indicates the enrichment score.
- Supplementary Fig. S7 (a) The dynamic changes in nutrient content and gene expression during the grain developmental stages. K-means clustering groups the nutrients (upper layer) and genes (lower layer) into five clusters. The x-axis shows four samples from two key grain developmental stages, and the y-axis represents the Z score per nutrient or gene. Detailed information are listed in Supplementary Table S12. (b) Correlation network between anthocyanin-related genes and anthocyanins. Statistical significance determined by one-sided t-tests (***p < 0.001, **p < 0.01, *p < 0.05). The thickness of the line indicates the correlation between anthocyanin content and gene expression. The square color's depth represents the correlation between gene and gene. The color of the line represents significance, green (p < 0.05) and orange (p < 0.01).
- Supplementary Fig. S8 (a) Phylogenetic tree analysis of genes encoding flavonoid glycosyltransferases potentially involved in wheat (obtained by predicting the function of the gene encoding the enzyme) and flavonoid glycosyltransferases reported inother plants. CGT, flavonoid C-glycosyltransferases; 3GT, flavonoid 3-O-glycosyltransferases; 5GT, flavonoid 5-O-glycosyltransferases; 7GT, flavonoid 7-O-glycosyltransferases; GGT, flavonoid glycoside glycosyltransferases; MGT, monolignol glycosyltransferase; 7GT-5GT-3GT, UGTs with at least one of 7-O-,5-O-, and 3-O-glycosyltransferaseactivity; 7GT-3GT-1, group-I UGTs with at least one of 7-O-and 5-O-glycosyltransferase activity; 7GT-3GT-Il, group-ll UGTs with at least one of 7-O-and 5-O-glycosyltransferase activity. (b) Phylogenetic tree of MYBs transcription factors in the anthocyanin synthesis pathway of color wheat. (c) Phylogenetic tree of bHLHs transcription factors in the anthocyanin synthesis pathway of color wheat. Phylogenetic tree construction using MYBs and bHLHs from blue and purple wheat identified in Supplementary Table S11 and from Oryza sativa , Zea mays and Arabidopsis thaliana for which relevant functions have been identified. Different colors represent different species, blue: blue wheat; purple: purple wheat; Multiple sequence alignment was performed using ClustalW program in MEGA7.0 software, and the phylogenetic tree was constructed using the Neighbor-joining (NJ) with 1,000 bootstraps.
- Supplementary Fig. S9 Expression patterns of twelve genes by qRT-PCR results. The full gene/enzyme names, expression level, and primer sequences are shown in Supplementary Tables S13 and S15.
- Copyright: © 2025 by the author(s). Published by Maximum Academic Press on behalf of Hainan Yazhou Bay Seed Laboratory. This article is an open access article distributed under Creative Commons Attribution License (CC BY 4.0), visit https://creativecommons.org/licenses/by/4.0/.
-
About this article
Cite this article
Shi T, Hu X, Wang X, Ao M, Zhang Y, et al. 2025. Comprehensive multi-omics analysis of nutrient dynamics in colored wheat provides novel insights into the development of functional foods. Seed Biology 4: e003 doi: 10.48130/seedbio-0025-0003 

Figure 1.
(a) The mature grains of 16 different color wheat varieties were used in this study. (b) Representation of nutrient class, quantity of each class, and the associated coefficient of variation (CV) distribution. + represents the average CV of these nutrients. Colors represent the classification of the corresponding nutrient. (c) Differential nutrients rich in mature wheat grains of three colors. Statistical significance determined by Student's t-test (p-value < 0.05). The hexagons represent the nutrients rich in the corresponding wheat varieties. Different colors labelled as in Fig. 1b. (d) Detailed information on nutrients rich in colored wheat. (e) Comparison of ten mineral elements in mature colored wheat grains with white wheat. The mineral elements marked in red represent that colored wheat concentration were higher than white wheat.